Embed Size (px)
Citation preview

MPOMacro Poverty Outlook
Country-by-country Analysis and Projections for the Developing World
Spring Meetings
2021
South Asia

© 2021 International Bank for Reconstruction and Development / The World Bank
1818 H Street NW
Washington DC 20433
Telephone: 202-473-1000
Internet: www.worldbank.org
This work is a product of the staff of The World Bank with external contributions. The findings, interpretations, and conclu-
sions expressed in this work do not necessarily reflect the views of The World Bank, its Board of Executive Directors, or the
governments they represent.
The World Bank does not guarantee the accuracy of the data included in this work. The boundaries, colors, denominations,
and other information shown on any map in this work do not imply any judgment on the part of The World Bank concerning
the legal status of any territory or the endorsement or acceptance of such boundaries.
Rights and Permissions
The material in this work is subject to copyright. Because The World Bank encourages dissemination of its knowledge, this
work may be reproduced, in whole or in part, for noncommercial purposes as long as full attribution to this work is given.
Any queries on rights and licenses, including subsidiary rights, should be addressed to World Bank Publications, The World
Bank Group, 1818 H Street NW, Washington, DC 20433, USA; fax: 202-522-2625; e-mail: [email protected].
MPO Apr 21 183
South Asia
Maldives Nepal Pakistan Sri Lanka
Afghanistan Bangladesh Bhutan India

184 MPO Apr 21
Key conditions and challenges In Afghanistan’s recent past, economic activity has been adversely impacted by deep-rooted political instability, institu-tional weakness, and violent insurgency. Poverty has remained stubbornly high and GDP per capita is among the lowest in the world. Afghanistan also lags in terms of key social indicators and ranked 169th in the 2020 Human Capital Index. The economy is shaped by the dispropor-tionate weight of aid and security related services, with small spillovers to other sectors of the economy. Aid inflows ex-ceed 45 percent of GDP, and security spending is equivalent to approximately 30 percent of GDP. Grants finance more than 75 percent of total public spending (including off-budget spending) and around half of the budget. The livelihood of seventy percent of the population con-tinues to depend on agriculture. The de-velopment of private sector activity unre-lated to aid or security development, par-ticularly of industries and manufacturing, has been heavily constrained by political instability, weak institutions and wide-spread corruption, inadequate infrastruc-ture, and onerous regulation. As a result, Afghanistan has a small and undiversified production base and struc-tural fiscal and trade deficits, financed almost entirely by international grants. There are only limited economic opportu-nities for the estimated 300,000 Afghans entering the labor force each year.
The COVID-19 shock has exacerbated economic and social challenges. The pandemic and related containment measures, including border closures and lockdowns of major cities, disrupted commerce and trade. Poverty is believed to have increased significantly, as urban casual workers were impacted dispro-portionately. Peace talks with the Tali-ban have stalled, dampening expecta-tions that sustainable peace can be achieved over the short-term. The outlook is highly uncertain. Critical risk factors include: a possible decline in international security support, a deteriora-tion of security conditions (a possible in-tensification of Taliban attacks), and faster-than-expected reductions in aid support (if governance improvements are not sufficient to reassure donors, who increas-ingly condition grants on reforms).
Recent developments The economy is estimated to have con-tracted by 1.9 percent in 2020, reflecting the impact of the COVID-19 crisis. Thanks to favorable weather conditions and its relative insulation from COVID-19 impacts, agriculture production is estimated to have increased by 5.3 per-cent. By contrast, lockdowns and inter-mittent border closures had a significant adverse impact on industrial and services output, which contracted by 4.2 and 4.8 percent, respectively. Inflation rose to an annual average of 5.6 percent in 2020, up from 2.3 percent in 2019. This mostly reflected a sharp increase
AFGHANISTAN
Afghanistan is expected to experience
sluggish growth over 2021, as political
uncertainty, insecurity, and declining aid
depress the pace of recovery from the
COVID-19 crisis. The combination of low
revenue collection and declining grants
means that the government has limited
fiscal space to provide countercyclical
support. Poverty remains high and infor-
mal and self-employed workers have been
hit hard by COVID-19 related disrup-
tions. To reach and sustain higher growth
the following will be key: continued sup-
port from the international community, a
resolution of current political uncertain-
ties, and the mobilization of new sources
of growth including the extractives.
FIGURE 1 Afghanistan / Real GDP growth and contribution
to real GDP growth
FIGURE 2 Afghanistan / Actual poverty rates and real GDP
per capita
Sources: World Bank, Macroeconomics, Trade and Investment Global Practice. Sources: WDI, NSIA, official data, and IE-LFS (2020).
Table 1 2020
Population, million 38.9
GDP, current US$ billion 1 9.9
GDP per capita, current US$ 51 1 .0
Poverty headcount ratioa 47.1
School enro llment, primary (% gross)a 72.5
Life expectancy at birth, yearsb 64.5
(a) Income, Exp. and Labor Force Survey (IE-LFS) (2020).
(b) M ost recent WDI value (2018).
Source: WDI, M acro Poverty Outlook, and off icial data.
Notes:
3438
55
47.1
26 25
42
45.536
42
59
47.6
0
50
100
150
200
250
300
350
400
450
500
550
600
15
20
25
30
35
40
45
50
55
60
65
70
2007 2009 2011 2013 2015 2017 2019
National Poverty
Urban Poverty
Rural Poverty
GDP per capita (rhs)
Poverty rate GDP per capita, USD
-4
-2
0
2
4
6
2017 2018 2019 2020 2021f 2022f 2023f
Agriculture Industry Services Real GDP
Percent, percentage points

185 MPO Apr 21
in food prices due to panic buying and import disruptions in the second quar-ter. Over the second half of the year, inflation decelerated as trade disruptions were resolved. External balances are estimated to have improved in 2020. The trade deficit is be-lieved to have narrowed slightly to 27.6 percent of GDP (from 30.4 percent in 2019), with imports and exports declining by 4.5 percent and 10 percent respectively (such that value of imports fell more than exports in absolute). Despite the large trade deficit, the current account is esti-mated to have reached a surplus of 2.9 percent of GDP (up from 0.6 percent in 2019), thanks to continued high foreign grant inflows. The afghani remained sta-ble against the US dollar throughout the year, and international reserves are esti-mated to have increased to USD 9.7 billion in 2020, corresponding to approximately 16 months of goods and services imports. The fiscal deficit widened to 2.3 percent of GDP in 2020 (from 1.6 percent in 2019), reflecting reduced revenues and increased expenditures in the context of the COVID-19 crisis. Domestic revenues fell around 17 percent short of budget targets, given weak overall economic activity, low pro-ceeds from import taxes, and poor compli-ance. Meanwhile, overall expenditure increased by 3.4 percent relative to 2019, amounting to 28.6 percent of GDP. According to estimates from the 2019-2020 Income and Expenditure Household
Survey, some 47.1 percent of Afghans are poor, a slight reduction from the previous estimate (54.5 in 2016-2017). Urban poverty increased from 42 to 45 percent between the two rounds, while rural poverty declined significantly (from 59 to 48 percent). Better rural out-comes reflect the recovery of agriculture incomes in the aftermath of the 2018 drought, and the relatively lower expo-sure of rural and subsistence communi-ties to the impacts of COVID-19 lock-downs and trade restrictions.
Outlook The baseline scenario assumes (i) contin-uation of current security and political conditions, involving high levels of un-certainty, slow progress with peace talks, a sustained US troop presence, and continued widespread violence; (ii) no further COVID-19 lockdowns, despite continued high infection rates; and (iii) a gradual decline in grant support, in line with donor commitments at the 2020 Geneva Conference. Under this baseline scenario, the econo-my is expected to grow by one percent in 2021. Industry and services are expected to recover gradually from the COVID-19 crisis, but the onset of drought condi-tions is expected to dampen agricultural output. Over the medium-term growth is
expected to firm up gradually as weather conditions improve and the scarring effect of the COVID-19 dis-ruptions dissipates. Notwithstanding a slight increase in non-food inflation due to higher global oil prices, inflation is expected to fall to 3.8 percent in 2021, as COVID-19-related supply restrictions fade and growth of food prices moderates (despite impacts of the drought). Over the medium term, inflation is expected to stabilize at around 5.0 percent. The current account surplus is projected to narrow to 0.3 percent of GDP in 2022, before moving into deficit from 2023 onward, as a result of lower grants and the continuation of a large trade deficit. Thus, international reserve buffers are projected to decline. Given weak growth prospects, tax reve-nues will remain constrained. This, cou-pled with lower projected international grants, will drive a fiscal deficit of around 3.1 percent of GDP in 2021, to be financed largely from cash reserves. Over the medi-um term, the fiscal deficit is expected to narrow to less than 2 percent of GDP, partly thanks to the expected implementa-tion of the VAT in 2022. Drought conditions are likely to result in increased poverty and food insecurity in some rural areas, while the recovery from COVID-19 disruptions in commerce and trade may support modest reductions in urban poverty.
TABLE 2 Afghanistan / Macro poverty outlook indicators (annual percent change unless indicated otherwise)
2018 2019 2020 e 2021 f 2022 f 2023 f
Real GDP growth, at constant market prices 1.2 3.9 -1.9 1.0 2.6 3.0
Private Consumption 10.0 -2.0 -3.7 1.5 3.0 3.5
Government Consumption -17.8 15.0 5.6 1.2 1.3 1.8
Gross Fixed Capital Investment 0.0 -15.3 -13.6 -0.1 1.4 1.3
Exports, Goods and Services 49.6 -6.3 -2.3 4.1 7.2 7.3
Imports, Goods and Services 13.1 -6.8 -5.3 2.3 3.1 3.5
Real GDP growth, at constant factor prices 1.2 4.4 -1.9 1.0 2.6 3.0
Agriculture -4.4 17.5 5.2 -1.5 4.0 4.5
Industry 11.1 4.8 -4.4 2.0 2.0 2.0
Services 1.9 -1.4 -4.9 2.3 2.0 2.5
Inflation (Consumer Price Index) 0.6 2.3 5.6 3.8 4.5 5.0
Current Account Balance (% of GDP) 2.7 0.6 2.9 1.2 0.3 -0.6
Net Foreign Direct Investment (% of GDP) 0.5 0.0 0.0 0.1 0.2 0.3
Fiscal Balance (% of GDP) 0.8 -1.5 -2.3 -3.1 -1.1 -0.7
Debt (% of GDP) 5.8 7.1 8.2 9.7 9.9 9.3
Primary Balance (% of GDP) 1.0 -1.4 -2.2 -3.0 -1.1 -0.7
Source: World Bank, Poverty & Equity and M acroeconomics, Trade & Investment Global Practices.Notes: e = estimate, f = forecast.NA

186 MPO Apr 21
Table 1 2020
Population, million 1 70.3
GDP, current US$ billion 324.2
GDP per capita, current US$ 1 903.7
International poverty rate ($1.9)a 1 4.3
Lower middle-income poverty rate ($3.2)a 52.3
Upper middle-income poverty rate ($5.5)a 84.2
Gini indexa 32.4
School enro llment, primary (% gross)b 1 1 6.5
Life expectancy at birth, yearsb 72.3
(a) M ost recent value (201 6), 2011 PPPs.
(b) M ost recent WDI value (201 8).
Source: WDI, M acro Poverty Outlook, and off icial data.
Notes:
Key conditions and challenges Bangladesh made rapid development pro-gress over the past two decades, reaching lower-middle-income country status in 2015. Rapid GDP growth was supported by a demographic dividend, sound mac-roeconomic policies, and an acceleration in readymade garment (RMG) exports. Meanwhile, job creation and growing re-mittance inflows contributed to a sharp decline in poverty. However, from 2013 onward, the pace of job creation and pov-erty reduction slowed, even as GDP growth accelerated. Persistent structural weaknesses include low institutional ca-pacity, highly concentrated exports, grow-ing financial sector vulnerabilities, unbal-anced urbanization, and slow improve-ments in the business environment. Bang-ladesh is also highly vulnerable to the effects of climate change. The COVID-19 pandemic impacted the economy profoundly. A national shut-down from March to May 2020 resulted in severe supply-side disruptions in all sec-tors of the economy. On the demand side, losses in employment income dampened consumption growth, although remittance inflows provided some buffer. The gov-ernment’s COVID-19 stimulus program provided firms with access to working capital and low-cost loans to sustain oper-ations and maintain employee wages in FY20 and FY21. From June onward, move-ment restrictions have been progressively
lifted, and transit and workplace move-ment patterns returned to pre-pandemic levels by October. Officially recorded in-fections peaked in July 2020 and declined gradually in subsequent months. Downside risks to the outlook are likely to persist if new waves of COVID-19 re-emerge in Bangladesh or its trading part-ner countries. This could necessitate addi-tional movement restrictions, dampen demand for RMG, and/or limit the outflow of migrant workers. Bangladesh’s expected graduation from the UN’s Least Devel-oped Country status in coming years will present opportunities but also challenges, including the eventual loss of preferential access to advanced economy markets.
Recent developments After a substantial deceleration in growth in FY20, early signs of recovery emerged in the first half of FY21 (July to December 2020). Following a 16.8 per-cent decline (y-o-y) in FY20, exports re-bounded in the first half of FY21 as RMG export orders were reinstated. On the demand side, growth was primarily sup-ported by private consumption, under-pinned by a recovery in labor income and remittance inflows. However, a con-traction in capital goods imports (-19.1 percent, y-o-y) suggests that private in-vestment has not yet normalized. Inflation decelerated from 5.6 percent in FY20 to 5.3 percent by December 2020, as food and non-food prices moderated. Monetary policy was further eased in July
BANGLADESH
Following sharp GDP growth deceleration in
FY20 due to the COVID-19 pandemic, the
economy started recovering in the first half of
FY21, as movement restrictions were lifted
and international buyers reinstated export
orders. Going forward, a gradual recovery is
expected to continue, particularly if the gov-
ernment’s COVID-19 recovery programs are
implemented swiftly. Downside risks include
new waves of COVID-19 infections that may
dampen external demand for exports and
Bangladesh’s labor force overseas. With
growth firming up, poverty is projected to
decline marginally in FY21.
FIGURE 1 Bangladesh / Real GDP growth and contributions
to real GDP growth
FIGURE 2 Bangladesh / Actual and projected poverty rates
and real GDP per capita
Sources: Bangladesh Bureau of Statistics (BBS) and World Bank staff. Sources: World Bank. Notes: see Table 2.
-10
-5
0
5
10
15
2000 2003 2006 2009 2012 2015 2018 2021
Gov. cons. Exports GFCFInventories Private cons. ImportsStatistical disc. GDP
Percent, percentage points Poverty rate (%) Real GDP per capita (LCU constant)
0
10000
20000
30000
40000
50000
60000
70000
80000
0
20
40
60
80
100
2005 2007 2009 2011 2013 2015 2017 2019 2021 2023
International poverty rate Lower middle-income pov. rateUpper middle-income pov. rate Real GDP pc

187 MPO Apr 21
2020. However, growing risk aversion among commercial banks, a cap on lend-ing rates, and rising non-performing loans limited the transmission to lending rates. Private sector credit growth continued to decline, falling from a high of 13.3 percent (y-o-y) in December 2018 to just 8.4 per-cent (y-o-y) by the end of December 2020. The current account moved into surplus in the first half of FY21, as the trade deficit declined due to lower imports and surg-ing official remittance inflows. Possible reasons could be that overseas workers switched to formal payment systems as the traditional hundi system was disrupt-ed by international travel restrictions, and/or, returning overseas workers repat-riated accumulated savings. Foreign ex-change reserves remained adequate at 8.6 months of goods and non-factor services imports in December 2020. The fiscal deficit widened marginally to an estimated 6.0 percent of GDP in FY20, with a decline in revenue and slower ex-penditure growth, relative to FY19. Ex-penditure growth moderated due to the slow implementation of development pro-jects in the context of COVID-19, while revenue collection declined as internation-al trade and the domestic economy stalled. Bangladesh was at low risk of debt distress in a Debt Sustainability Assess-ment completed in May 2020. Preliminary data from the first four months of FY21 show further reductions in the growth of
recurrent and development expenditure, and modest revenue growth. Estimated poverty rose sharply in FY20 amidst substantial job and income losses. However, household surveys point to a gradual recovery in employment and earnings and a decline in poverty in the first half of FY21. Food security improved across the country, with the greatest in-crease in Chittagong.
Outlook The economy is expected to continue to recover gradually. Given the significant uncertainty pertaining to both epidemio-logical and policy developments, real GDP growth for FY21 could range from 2.6 to 5.6 percent depending on the pace of the ongoing vaccination campaign, whether new restrictions to mobility are required and how quickly the world economy recovers. Over the medium term, growth is projected to stabilize within a 5 to 7 percent range as exports and consumption continue to recover, and investment rises, led by externally financed public infrastructure invest-ments under the recently adopted 8th Five-Year Plan. The recent surge in offi-cial remittance inflows is unlikely to per-sist if (i) the net outflow of migrant work-ers slows in FY21 (as visa issuance in the
Middle East declined during the pandemic) and (ii) the reliance on formal payment channels subside (as normal travel re-sumes). If weakness in revenue collections persist, the fiscal deficit is projected to re-main at 6.0 percent of GDP in FY21, moder-ating over the medium term with tax re-forms and expenditure prioritization. Sus-taining the economic recovery and further reducing poverty will depend, inter alia, on the implementation of the government’s COVID-19 response program, including credit programs in the banking sector. Downside risks to the outlook may per-sist. Fiscal risks include weak domestic revenue growth (if tax reforms are de-layed) and higher expenditure for COVID-19 vaccinations (if external fi-nancing is limited) and for supporting the Rohingya refugees (if donor fatigue sets in). In the financial sector, contin-gent liabilities from non-performing loans combined with weak capital buff-ers could necessitate recapitalizations (resulting in higher domestic govern-ment debt) and depress credit growth. External risks could also be elevated. While external demand for RMGs ap-pears to be stabilizing, the recovery is fragile and could be vulnerable to new waves of COVID-19 infections. Demand for Bangladesh’s overseas workforce in the Gulf region may also be impacted by the ongoing recession in that region, impairing future remittance inflows.
TABLE 2 Bangladesh / Macro poverty outlook indicators (annual percent change unless indicated otherwise)
2017/18 2018/19 2019/20 e 2020/21 f 2021/22 f 2022/23 f
Real GDP growth, at constant market prices 7.9 8.2 2.4 3.6 5.1 6.2
Private Consumption 11.0 3.9 2.6 3.2 4.5 5.3
Government Consumption 15.4 9.5 -0.9 4.3 5.4 6.5
Gross Fixed Capital Investment 10.5 8.4 4.3 3.6 7.4 8.6
Exports, Goods and Services 8.1 11.6 -16.8 8.4 8.6 8.9
Imports, Goods and Services 27.0 -0.2 -12.1 6.0 10.5 9.4
Real GDP growth, at constant factor prices 7.9 8.4 2.6 3.6 5.0 6.1
Agriculture 4.2 3.9 3.0 2.2 3.3 3.1
Industry 12.1 12.7 1.3 4.5 6.1 7.4
Services 6.4 6.8 3.4 3.3 4.8 6.0
Inflation (Consumer Price Index) 5.8 5.5 5.6 5.7 5.7 5.8
Current Account Balance (% of GDP) -3.5 -1.5 -1.5 -0.5 -2.1 -2.4
Net Foreign Direct Investment (% of GDP) 0.6 0.9 0.4 0.3 0.5 0.6
Fiscal Balance (% of GDP) -4.6 -5.4 -5.5 -6.0 -6.0 -5.9
Debt (% of GDP) 31.9 33.7 37.6 41.7 44.9 47.2
Primary Balance (% of GDP) -2.8 -3.4 -3.2 -3.6 -3.4 -3.0
International poverty rate ($1.9 in 2011 PPP)a,b 12.7 11.9 18.9 17.9 17.2 16.4
Lower middle-income poverty rate ($3.2 in 2011 PPP)a,b 49.4 47.9 55.9 55.3 54.3 53.1
Upper middle-income poverty rate ($5.5 in 2011 PPP)a,b 82.9 82.2 85.2 84.9 84.5 83.9
Source: World Bank, Poverty & Equity and M acroeconomics, Trade & Investment Global Practices.Notes: e = estimate, f = forecast.NA(a) Calculations based on SAR-POV harmonization, using 2010-HIES and 2016-HIES.Actual data: 2016. Nowcast: 2017-2020. Forecast are from 2021 to 2023.
(b) Projection using annualized elasticity (2010-2016) with pass-through = 1 based on GDP per capita in constant LCU.

188 MPO Apr 21
Table 1 2020
Population, million 0.8
GDP, current US$ billion 2.4
GDP per capita, current US$ 3079.8
International poverty rate ($1.9)a 1 .5
Lower middle-income poverty rate ($3.2)a 1 2.2
Upper middle-income poverty rate ($5.5)a 38.9
Gini indexa 37.4
School enro llment, primary (% gross)b 1 05.8
Life expectancy at birth, yearsb 71 .5
(a) M ost recent value (201 7), 2011 PPPs.
(b) WDI for School enrollment (2020); Life expectancy (2018).
Source: WDI, M acro Poverty Outlook, and off icial data.
Notes:
Key conditions and challenges Annual real GDP growth has averaged 7.5 percent since the 1980s, mainly driven by public sector-led hydropower devel-opment and electricity sales to India. However, while hydropower has provid-ed a reliable source of growth, it has re-sulted in high fiscal volatility (temporary one-off profits from the on-streaming of hydropower plants boosting revenues and driving up current spending). The capital-intensive hydropower sector has also failed to generate a large amount of jobs. Thus, over half of Bhutan’s work-force remains employed in agriculture, primarily of subsistence nature, while one-third is employed in low value-added services. Nonetheless, poverty reduction was impressive, with a decline in the $3.20 poverty rate from 30.6 percent to 12.2 percent between 2007 and 2017, part-ly supported by a greater commercial orientation of farmers. Bhutan has avoided a large-scale domes-tic COVID-19 outbreak thanks to strin-gent domestic containment measures, including two nationwide lockdowns in FY20/21. The closure of domestic borders since March 2020 brought the tourism industry to a standstill and disrupted trade with India, Bhutan’s main trading partner. As a result, many workers in the services sector, especially in urban areas, experienced job and/or earning losses. The government launched a COVID-19
recovery package, with emphasis on agri-culture, tourism, and construction. The pace of economic recovery will de-pend on how fast COVID-19 vaccines can be deployed globally, and specifically in India (given significant tourism and trade linkages). Domestic risks include delays in hydro projects and lower-than-expected hydropower production (due to adverse weather patterns) as well as the materiali-zation of financial sector contingent liabili-ties, which could strain government fi-nances. The implementation of revenue measures, particularly the goods and ser-vices tax (GST), is critical to expanding domestic resource mobilization.
Recent developments The economy contracted by 0.8 percent in FY19/20. Lower tourist arrivals y-o-y in the second half of FY19/20 (January to June 2020) dampened services sector growth. While the hydropower sector performed well thanks to the on-streaming of the Mangdechhu hydroelec-tric power plant, other industrial activi-ties have been significantly affected by supply-chain disruptions (for critical in-puts, including foreign labor), and de-pressed external demand (especially from India). On the demand side, public con-sumption and net exports supported growth. An increase in hydro exports more than offset the decline in non-hydro exports, and imports for infrastructure projects were subdued. However, there was a contraction in private consumption
BHUTAN
Output is projected to contract by 1.8
percent in FY20/21, reflecting the ad-
verse impact of the COVID-19 crisis on
tourism and non-hydropower indus-
tries. Poverty is expected to slightly
increase due to high food price inflation
and disruptions in agricultural activi-
ties. While the state-led hydropower
sector cushioned the impact of the crisis
on economic growth and fiscal ac-
counts, accelerating reforms to promote
private sector development is important
to generate more and better jobs.
FIGURE 1 Bhutan / Real GDP growth and sectoral contribu-
tions to real GDP growth
FIGURE 2 Bhutan / Actual and projected poverty rates and
real GDP per capita
Sources: Government of Bhutan and World Bank staff calculations. Sources: World Bank. Notes: see Table 2.
Poverty rate (%) Real GDP per capita (LCU constant)
0
20000
40000
60000
80000
100000
0
10
20
30
40
50
60
70
2007 2009 2011 2013 2015 2017 2019 2021 2023
International poverty rate Lower middle-income pov. rateUpper middle-income pov. rate Real GDP pc
4.0
6.2
7.4
6.3
3.84.3
-0.8
-2
0
2
4
6
8
10
2013/14 2014/15 2015/16 2016/17 2017/18 2018/19(f)
2019/20(f)
Taxes/subsidies AgricultureServices ManufacturingNon-manufacturing (incl. hydro) GDP growth
Percent, percentage points

189 MPO Apr 21
and investment due to domestic contain-ment measures and disruptions in infra-structure projects. Average inflation increased from 3.0 per-cent in FY19/20 to 7.7 percent in the first half of FY20/21. While non-food inflation remained modest, averaging 1.7 percent in the first half of FY20/21, food inflation averaged 15.3 percent–due to import re-strictions on food and severe supply dis-ruptions. High food inflation–along with disruptions in the production, transport, and sales of agricultural products–likely eroded the real incomes of many rural poor. This is expected to have led to a slight increase in the $3.20 poverty rate, from 10.7 in 2019 to 11.2 percent in 2020. The current account deficit narrowed to 12.2 percent of GDP in FY19/20, mainly thanks to a smaller trade deficit. Hydro-power exports doubled as a share of GDP, more than offsetting the decline in non-hydro exports, which have been severely impacted by the border closure and lower external demand during the last quarter of the fiscal year. Meanwhile, goods imports declined, as the pandemic depressed pub-lic investment–including hydro projects. Gross international reserves increased by 22 percent (y-o-y) to US$ 1.43 billion in November, equivalent to 16.1 months of FY19/20 goods and services imports. The fiscal deficit widened to 3.2 percent of GDP in FY19/20 with spending growing faster than revenues. While the latter was
boosted by one-off profits from hydro-power, non-hydro revenues decreased with the discontinuation of excise duty refunds from India and lower-than-normal tourism receipts. The increase in spending was primarily driven by the increase in salaries and wages (40 percent, y-o-y) and an increase in capital expendi-tures. Public debt rose to 120.7 percent of GDP as of June 2020 (up from 106.6 per-cent in FY18/19). However, debt sustaina-bility risks are moderate as the bulk of the debt is linked to hydropower project loans from India (to be paid off from future hy-dro revenues), which reduces re-financing and exchange rate risks.
Outlook Under the baseline scenario, economic growth is projected to contract further by 1.8 percent in FY20/21 (July 2020 to June 2021). Services sector output is expected to fall by 3.7 percent, as tourism activity is not expected to reopen until mid-2021. Labor shortages, high input prices, and trade disruptions are expected to weigh on construction, manufacturing, and non-hydro exporting industries. Output is ex-pected to return to pre-pandemic levels (in real terms) in FY21/22, when tourist inflows gradually resume and activities in the non-hydro industry pick up.
The current account deficit is expected to remain low relative to pre-COVID levels. Non-hydro exports are expected to recov-er gradually, supported by the global re-covery and a resumption of tourism. Im-port growth is projected to increase grad-ually over the medium term, in line with increases in public investment. The fiscal deficit is projected to increase sharply in FY21/22, with the discontinua-tion of profit transfers from Mangdechhu (4.0 percent of GDP in FY20/21), upward pressure on current expenditures (due to higher salaries and the COVID-19 recov-ery package), and downward pressures on non-hydro revenues from weak economic activity. Thereafter, the deficit should nar-row to pre-COVID levels (in FY23/24) as profit transfers from Puna II begin. Public debt is expected to remain elevated as a share of GDP due to low economic growth, high financing needs, and an in-crease in hydropower debt (in FY22/23). The $3.20 poverty rate is projected to rise further to 12.5 percent in 2021, given con-tinued disruptions in economic activities. A delay in the domestic rollout of vac-cines could further impact economic ac-tivity. However, a faster-than-expected implementation of the COVID-19 recov-ery package, including employment pro-grams and the national credit guarantee scheme to small and medium-sized enter-prises, could support domestic job crea-tion and growth.
TABLE 2 Bhutan / Macro poverty outlook indicators (annual percent change unless indicated otherwise)
2017/18 2018/19 2019/20 e 2020/21 f 2021/22 f 2022/23 f
Real GDP growth, at constant market prices 3.8 4.3 -0.8 -1.8 2.9 4.5
Private Consumption 10.0 10.1 1.0 -4.0 3.0 0.2
Government Consumption 3.7 7.0 30.0 1.8 2.2 0.6
Gross Fixed Capital Investment -3.6 -11.4 -29.2 -8.1 3.7 0.5
Exports, Goods and Services 5.5 9.6 12.5 -23.2 10.3 23.5
Imports, Goods and Services 3.6 0.5 -3.6 -22.0 8.6 6.7
Real GDP growth, at constant factor prices 3.2 4.5 0.4 -1.8 2.9 4.5
Agriculture 3.6 2.7 1.9 2.0 3.0 3.0
Industry -1.3 -1.6 -1.5 -0.7 2.2 5.4
Services 7.8 10.8 1.6 -3.7 3.4 4.0
Inflation (Consumer Price Index) 3.7 2.8 3.0 7.2 3.7 3.7
Current Account Balance (% of GDP) -19.1 -21.1 -12.2 -10.2 -10.9 -7.0
Fiscal Balance (% of GDP) -1.6 -1.6 -3.2 -5.4 -7.4 -5.9
Debt (% of GDP) 110.5 106.6 120.7 121.5 120.5 133.9
Primary Balance (% of GDP) -0.3 -0.7 -2.7 -4.3 -5.8 -4.3
International poverty rate ($1.9 in 2011 PPP)a,b 1.4 1.3 1.4 1.5 1.4 1.3
Lower middle-income poverty rate ($3.2 in 2011 PPP)a,b 11.5 10.7 11.2 12.5 12.0 11.2
Upper middle-income poverty rate ($5.5 in 2011 PPP)a,b 37.8 36.9 37.4 38.6 37.9 36.9
Source: World Bank, Poverty & Equity and M acroeconomics, Trade & Investment Global Practices.Notes: e = estimate, f = forecast.NA(a) Calculations based on SAR-POV harmonization, using 2017-BLSS.Actual data: 2017. Nowcast: 2018-2020. Forecast are from 2021 to 2023.
(b) Projection using neutral distribution (2017) with pass-through = 0.7 based on GDP per capita in constant LCU.
190 MPO Apr 21
Key conditions and challenges The economy was already slowing when the COVID-19 pandemic unfolded. After reaching 8.3 percent in FY17, growth decelerated to 4.0 percent in FY20. The slowdown was caused by a decline in private consumption growth and shocks to the financial sector (the collapse of a large non-bank finance institution), which compounded pre-existing weak-nesses in investment. In response to the COVID-19 outbreak, the authorities implemented a nation-wide lockdown, which brought economic activ-ity to a near standstill between April and June 2020 (Q1FY21). The most impacted sub-sectors included aviation and tourism, hospitality, trade, and construction, but industrial activity was also deeply dis-rupted by mobility restrictions. Agricul-ture, however, was mostly unaffected. To mitigate the social and economic im-pacts of the COVID-19 induced crisis, the Reserve Bank of India (RBI) provided liquidity and other regulatory support (including forbearance measures), and the government increased spending on health and social protection through expendi-ture re-prioritizing and fiscal expansion. Still, the sharp contraction in output be-tween April and September 2020, is ex-pected to have inflicted significant eco-nomic and social impacts. Going forward, the main risks to the out-look include the materialization of financial
sector risks, that could compromise a re-covery in private investment, and new waves of COVID-19 infections.
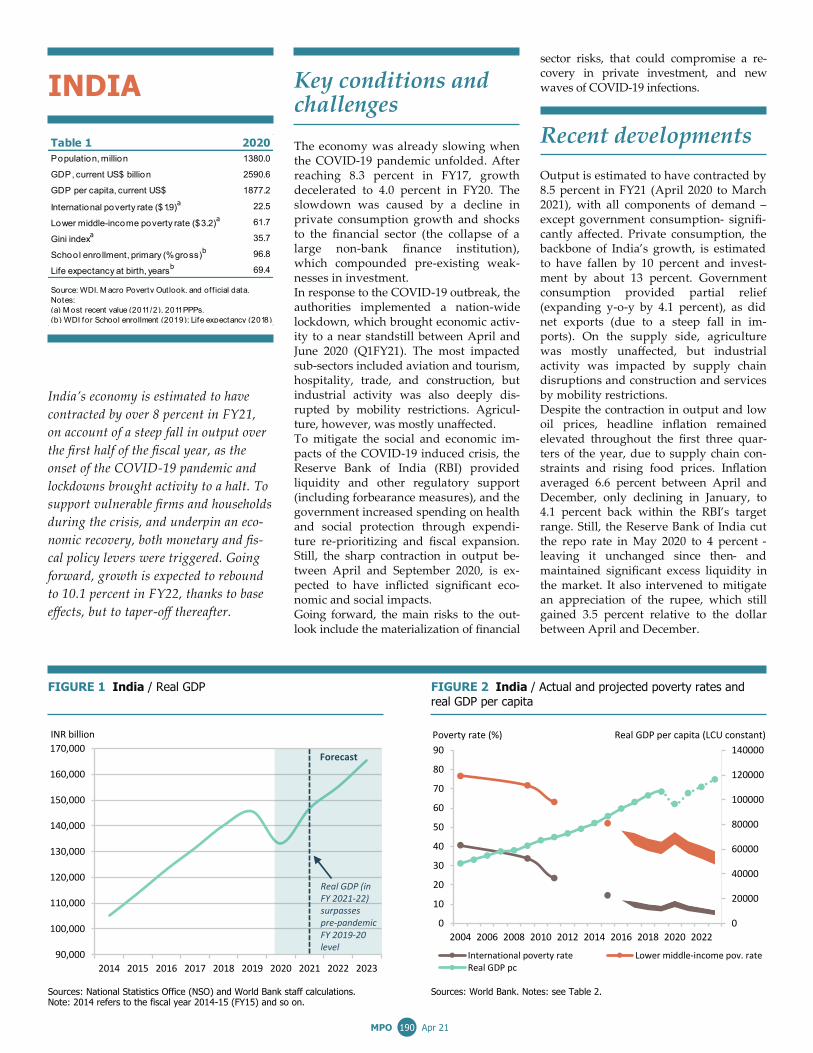
Recent developments Output is estimated to have contracted by 8.5 percent in FY21 (April 2020 to March 2021), with all components of demand – except government consumption- signifi-cantly affected. Private consumption, the backbone of India’s growth, is estimated to have fallen by 10 percent and invest-ment by about 13 percent. Government consumption provided partial relief (expanding y-o-y by 4.1 percent), as did net exports (due to a steep fall in im-ports). On the supply side, agriculture was mostly unaffected, but industrial activity was impacted by supply chain disruptions and construction and services by mobility restrictions. Despite the contraction in output and low oil prices, headline inflation remained elevated throughout the first three quar-ters of the year, due to supply chain con-straints and rising food prices. Inflation averaged 6.6 percent between April and December, only declining in January, to 4.1 percent back within the RBI’s target range. Still, the Reserve Bank of India cut the repo rate in May 2020 to 4 percent -leaving it unchanged since then- and maintained significant excess liquidity in the market. It also intervened to mitigate an appreciation of the rupee, which still gained 3.5 percent relative to the dollar between April and December.
INDIA
India’s economy is estimated to have
contracted by over 8 percent in FY21,
on account of a steep fall in output over
the first half of the fiscal year, as the
onset of the COVID-19 pandemic and
lockdowns brought activity to a halt. To
support vulnerable firms and households
during the crisis, and underpin an eco-
nomic recovery, both monetary and fis-
cal policy levers were triggered. Going
forward, growth is expected to rebound
to 10.1 percent in FY22, thanks to base
effects, but to taper-off thereafter.
FIGURE 1 India / Real GDP FIGURE 2 India / Actual and projected poverty rates and
real GDP per capita
Sources: National Statistics Office (NSO) and World Bank staff calculations. Note: 2014 refers to the fiscal year 2014-15 (FY15) and so on.
Sources: World Bank. Notes: see Table 2.
Table 1 2020
Population, million 1 380.0
GDP, current US$ billion 2590.6
GDP per capita, current US$ 1 877.2
International poverty rate ($1.9)a 22.5
Lower middle-income poverty rate ($3.2)a 61 .7
Gini indexa 35.7
School enro llment, primary (% gross)b 96.8
Life expectancy at birth, yearsb 69.4
(a) M ost recent value (2011 /2), 2011 PPPs.
(b) WDI for School enrollment (201 9); Life expectancy (2018).
Source: WDI, M acro Poverty Outlook, and off icial data.
Notes:
90,000
100,000
110,000
120,000
130,000
140,000
150,000
160,000
170,000
2014 2015 2016 2017 2018 2019 2020 2021 2022 2023
INR billion
Forecast
Real GDP (in FY 2021-22) surpassespre-pandemic FY 2019-20 level
0
20000
40000
60000
80000
100000
120000
140000
0
10
20
30
40
50
60
70
80
90
2004 2006 2008 2010 2012 2014 2016 2018 2020 2022
International poverty rate Lower middle-income pov. rateReal GDP pc
Real GDP per capita (LCU constant)Poverty rate (%)

191 MPO Apr 21
A decline in the trade deficit combined with an increase in net services receipts and private transfers turned the current account balance into a surplus of 1.3 per-cent. Together with robust net foreign investment inflows, and unsterilized RBI intervention in forex markets, reserves reached a peak of USD 584.6 billion at end-February, equivalent to around 15 months of FY20 merchandise imports. The COVID-19 pandemic, together with measures to contain its effects, had a sig-nificant impact on public finances in FY21. The fiscal deficit of the central government was revised to 9.5 percent of GDP (from 3.5 percent initially targeted in the budg-et), reflecting both lower than expected tax revenues, government measures to sup-port the economy, as well as bringing past off-budget expenditures on the books. The fiscal deficit of States is estimated to have been between 4 and 5 percent of GDP against the planned 2.8 percent. The lockdown, in the first quarter of FY21, appears to have had a major impact on
household consumption. Mean per capita consumption is estimated to have dropped by 36 percent over April-July, 2020 y-o-y. Available household survey data indicate that relative to the “traditional poor” the most affected popu-lation were relatively younger, more ur-ban and educated. With the end of the lockdown, however, household consump-tion seems to have recovered to almost pre-pandemic levels.
Outlook Given the significant uncertainty per-taining to both epidemiological and pol-icy developments, real GDP growth for FY21/22 can range from 7.5 to 12.5 per-cent, depending on how the ongoing vaccination campaign proceeds, wheth-er new restrictions to mobility are re-quired, and how quickly the world economy recovers.
As economic activity normalizes, domes-tically and in key export markets, the current account is expected to return to mild deficits (around 1 percent in FY22 and FY23) and capital inflows are project-ed by continued accommodative mone-tary policy and abundant international liquidity conditions. The COVID-19 shock will lead to a long-lasting inflexion in India’s fiscal trajecto-ry. The general government deficit is ex-pected to remain above 10 percent of GDP until FY22. As a result, public debt is projected to peak at almost 90 percent of GDP in FY21 before declining gradual-ly thereafter. As growth resumes and the labor market prospects improve, poverty reduction is expected to return to its pre-pandemic trajectory. The poverty rate (at the $1.90 line) is projected to return to pre-pandemic levels in FY22, falling within 6 and 9 percent, and fall further to between 4 and 7 percent by FY24.
TABLE 2 India / Macro poverty outlook indicators (annual percent change unless indicated otherwise)
2018/19 2019/20 2020/21 e 2021/22 f 2022/23 f 2023/24 f
Real GDP growth, at constant market prices 6.5 4.0 -8.5 10.1 5.8 6.5
Private Consumption 7.6 5.5 -10.0 11.0 7.7 8.1
Government Consumption 6.3 7.9 4.1 13.8 6.4 9.2
Gross Fixed Capital Investment 9.9 5.4 -12.9 15.2 7.9 8.9
Exports, Goods and Services 12.3 -3.3 -8.0 9.7 8.5 8.7
Imports, Goods and Services 8.6 -0.8 -18.1 14.0 12.0 12.9
Real GDP growth, at constant factor prices 5.9 4.1 -7.1 9.6 5.6 6.5
Agriculture 2.6 4.3 3.4 3.5 3.5 4.0
Industry 5.3 -1.2 -8.6 13.2 6.0 7.3
Services 7.2 7.2 -9.1 9.5 6.0 6.7
Inflation (Consumer Price Index) 3.4 4.8 6.0 4.5 4.0 4.0
Current Account Balance (% of GDP) -2.1 -0.9 1.3 -1.1 -1.2 -1.4
Net Foreign Direct Investment (% of GDP) 1.1 1.5 2.0 1.5 1.4 1.4
Fiscal Balance (% of GDP) -5.8 -8.0 -14.0 -10.4 -9.4 -8.5
Debt (% of GDP) 68.6 72.5 89.7 88.4 88.1 86.5
Primary Balance (% of GDP) -1.1 -3.4 -8.5 -4.6 -3.2 -2.5
International poverty rate ($1.9 in 2011 PPP)a,b 6.9-10.0 6.2-9.2 8.5-11.8 6.4-9.3 5.4-8.2 4.4-6.9
Lower middle-income poverty rate ($3.2 in 2011 PPP)a,b 37.7-44.0 36.0-42.5 41.0-47.4 36.3-42.8 33.6-40.3 30.6-37.5
Source: World Bank, Poverty & Equity and M acroeconomics, Trade & Investment Global Practices.Notes: e = estimate, f = forecast.
(a) Calculations based on SARM D harmonization, using 2011 NSS-SCH1.
(b) Projection using neutral distribution base on GDP pc in constant LCU with pass-through = .67 for 2018-23, and 2017 international poverty as a range of 8.1 to 11.3 percent
(at 1.9 PPP$ a day) estimated for the 2020 PSPR. The latest official data for estimate poverty in India date to 2011/12. Nowcast: 2018-2020. Forecast are from 2021 to 2023.

192 MPO Apr 21
Key conditions and challenges Maldives has managed to attain upper middle-income status and reduce pov-erty mainly through the successful devel-opment of high-end tourism. According to official estimates, only 3.6 percent of the population lived below the poverty line for upper middle-income countries (US$ 5.50/person/day in PPP) in 2016. However, heavy reliance on tourism, which directly accounts for a quarter of GDP, makes the economy vulnerable to external shocks. Although growth aver-aged 5.7 percent from 2000 to 2019, natu-ral disasters and global shocks have re-peatedly caused large and sudden swings in output. Opportunities for di-versification are limited in the near term due to scarce land, remoteness, and other geographical constraints. The COVID-19 pandemic is the largest shock to have ever hit the Maldives’ econ-omy. The government closed borders be-tween end-March and mid-July 2020, re-sulting in a sudden stop of tourist inflows. To mitigate the adverse welfare impacts of the crisis, the government spent USD 187 million or about 4.7 percent of estimated 2020 GDP on special financing facilities for firms and freelance workers, monthly income support allowances, and discount-ed utility bills. Restoring fiscal and debt sustainability is key to building back better. Even before the pandemic, Maldives was already at
high risk of overall and external debt dis-tress. Reliance on external non-concessional loans to finance the ambi-tious public infrastructure agenda led to a large increase in debt between 2016 and 2019. The large contraction in GDP and additional borrowing due to COVID-19 have further elevated debt vulnerabilities. Delaying large public investment projects until the economy strengthens would help to alleviate these pressures.
Recent developments Maldives’ economy is estimated to have contracted by 28 percent in fiscal (calendar) year 2020 as tourism and con-struction activity slumped. Only 555,494 tourists visited the country, a third of the number in 2019. Since December, howev-er, tourism has picked up strongly thanks to the absence of quarantine requirements and the unique ‘one island, one resort’ concept. Approximately 189,000 tourists, mostly from Russia and India visited Maldives in January and February 2021; however, this is still 42 percent below the comparable period in 2019. Against this backdrop of anemic economic activity, prices fell by an average of 1.4 percent y-o-y in 2020. The deflation was more pronounced in Malé than in the at-olls, but in both cases driven by housing and utilities (reflecting lower rent and oil prices), as well as information and com-munications services. Food prices, howev-er, rose by 3 percent on average, driven by an increase in tobacco duties.
MALDIVES
Maldives has suffered an unprecedented
shock from COVID-19 as tourism came
to a standstill. Output contracted by an
estimated 28 percent in 2020, leading
to a projected increase in poverty. In
2021, with a partial recovery in tour-
ism and large base effects, growth is
expected to rebound to 17 percent.
While Maldives’ appeal to tourists re-
mains strong, the outlook largely hing-
es on factors outside its control. More
prudent fiscal policies would help re-
duce debt vulnerabilities, which were
already high before the pandemic.
FIGURE 1 Maldives / Public and publicly guaranteed debt FIGURE 2 Maldives / Actual and projected poverty rates and
real GDP per capita
Sources: Ministry of Finance. Sources: World Bank. Notes: see Table 2.
Table 1 2020
Population, million 0.5
GDP, current US$ billion 4.0
GDP per capita, current US$ 7458.8
Upper middle-income poverty rate ($5.5)a 3.6
Gini indexa 31 .3
School enro llment, primary (% gross)b 98.0
Life expectancy at birth, yearsb 78.6
(a) M ost recent value (2016), 2011 PPPs.
(b) M ost recent WDI value (2018).
Source: WDI, M acro Poverty Outlook, and off icial data.
Notes:
Poverty rate (%) Real GDP per capita (LCU constant)
0
20000
40000
60000
80000
100000
120000
140000
160000
0
1
2
3
4
5
6
7
8
2016 2017 2018 2019 2020 2021 2022 2023
Upper middle-income pov. rate Real GDP pc0
30
60
90
120
150
2016 2017 2018 2019 2020e
Domestic debt
Guaranteed debt
External debt
Total public and publicly guaranteed debt
Percent of GDP

193 MPO Apr 21
The goods trade deficit narrowed from US$ 2.5 billion in 2019 to US$ 1.5 billion in 2020, as a compression in imports out-weighed the decline in exports. Imports fell by an estimated 36 percent y-o-y, driv-en by lower imports of raw materials as construction activity contracted. Lower imports of food and fuel due to lower tourist arrivals and lower oil prices, re-spectively, also contributed. Meanwhile, exports fell by 20 percent y-o-y, mostly due to a large decline in re-exports of jet fuel from fewer international aircraft movements. However, exports of fish in-creased by 3 percent, boosted by a large increase in exports of processed fish in the second half of the year. Maldives maintains a de facto stabilized exchange rate arrangement. Official re-serves recovered from a low of US$ 569.8 million at end-August 2020 to US$ 855.7 million at end-February 2021, as tourists returned and the Maldives Monetary Au-thority activated the remainder of its US$ 400 million foreign currency swap ar-rangement with the Reserve Bank of In-dia. The Monetary Authority also imple-mented measures to manage shortages of US dollars. Usable reserves—netting out short-term liabilities—amounted to US$ 156.5 million at end-February 2021, equiv-alent to a month of 2020 goods imports.
The fiscal deficit reached 20 percent of estimated GDP in 2020. While the sudden stop in tourism led total revenues and grants to fall by 35 percent y-o-y, total expenditures fell only by 4.5 percent. Alt-hough the government cut recurrent spending by 9 percent, capital expendi-tures are estimated to have grown by 7 percent. As a result of the higher deficit and negative growth, total public and publicly guaranteed debt is estimated to have increased to 139.3 percent of GDP in 2020 from 78.4 in 2019. With most Maldivians dependent on tour-ism and fisheries for their livelihoods, World Bank estimates based on household survey data indicate that the poverty rate has increased from an estimated 2.1 per-cent in 2019 to 7.2 percent in 2020.
Outlook Assuming its borders remain open to visi-tors, Maldives is expected to receive 1 million tourists in 2021, about 60 percent of the 2019 number. Real GDP is therefore projected to grow by 17 percent in 2021. The rebound in growth largely reflects base effects and assumes a continuation of strong tourism inflows especially from
Russia and India. Although medium-term prospects for tourism are strong, real GDP is not expected to return to pre-pandemic levels until 2023, in line with global avia-tion and travel forecasts. The poverty rate is expected to decline slowly over the me-dium term to 2.7 percent in 2023. External and fiscal imbalances will re-main elevated. Despite the recovery in tourism receipts, the current account defi-cit is expected to widen over the medium term as imports linked to tourism and construction normalize. The fiscal deficit is expected to decline as revenues recover but is forecast to remain in double-digits due to expansionary fiscal policies. The 2021 Budget, for example, targets a 45 percent increase in capital expenditures from 2020, while revenues are not ex-pected to cover current expenditures. With the recovery in growth, the debt ratio is expected to moderate to 131.4 percent of GDP in 2023. Risks are heavily tilted to the downside and some are outside Maldives’ control, such as the pace and effectiveness of COVID-19 vaccinations globally. The out-look would deteriorate if more stringent restrictions on international travel are reintroduced. The low level of usable re-serves and high indebtedness pose signifi-cant risks to macroeconomic stability.
TABLE 2 Maldives / Macro poverty outlook indicators (annual percent change unless indicated otherwise)
2018 2019 2020 e 2021 f 2022 f 2023 f
Real GDP growth, at constant market prices 8.1 7.0 -28.0 17.1 11.5 8.3
Private Consumption 10.6 5.5 -35.0 27.0 20.0 12.0
Government Consumption 9.0 -4.2 0.6 2.7 2.3 1.5
Gross Fixed Capital Investment 29.1 -2.7 -5.9 2.3 4.4 4.8
Exports, Goods and Services 10.1 6.1 -45.0 30.0 14.1 11.9
Imports, Goods and Services 12.8 0.3 -38.0 24.0 14.8 12.0
Real GDP growth, at constant factor prices 8.1 7.1 -25.9 16.0 10.7 8.2
Agriculture 4.8 5.0 8.0 5.5 5.6 3.6
Industry 15.6 1.5 -19.7 7.1 6.6 5.8
Services 7.3 8.0 -28.9 18.4 11.7 8.9
Inflation (Consumer Price Index) -0.1 0.2 -1.4 2.5 1.1 1.0
Current Account Balance (% of GDP) -28.3 -26.8 -26.3 -27.1 -27.5 -27.7
Net Foreign Direct Investment (% of GDP) 10.9 17.0 7.9 9.3 10.6 14.0
Fiscal Balance (% of GDP) -5.3 -6.6 -20.1 -18.5 -15.2 -12.7
Debt (% of GDP) 74.0 78.4 139.3 135.2 132.1 131.4
Primary Balance (% of GDP) -3.5 -4.9 -16.4 -14.2 -10.9 -8.3
Upper middle-income poverty rate ($5.5 in 2011 PPP)a,b 2.9 2.1 7.2 5.2 3.6 2.7
Source: World Bank, Poverty & Equity and M acroeconomics, Trade & Investment Global Practices.Notes: e = estimate, f = forecast.NA(a) Calculations based on SAR-POV harmonization, using 2016-HIES.Actual data: 2016. Nowcast: 2017-2020. Forecast are from 2021 to 2023.
(b) Projection using neutral distribution (2016) with pass-through = 0.87 based on GDP per capita in constant LCU.

194 MPO Apr 21
Table 1 2020
Population, million 29.1
GDP, current US$ billion 33.9
GDP per capita, current US$ 1 1 63.7
International poverty rate ($1.9)a 1 5.0
Lower middle-income poverty rate ($3.2)a 50.9
Upper middle-income poverty rate ($5.5)a 83.0
Gini indexa 32.8
School enro llment, primary (% gross)b 1 42.1
Life expectancy at birth, yearsb 70.5
(a) M ost recent value (2010), 2011 PPPs.
(b) WDI for School enrollment (2019); Life expectancy (2018).
Source: WDI, M acro Poverty Outlook, and off icial data.
Notes:
Key conditions and challenges Growth averaged 4.9 percent, over FY09-FY19, supported by remittance inflows but constrained by structural vulnerabili-ties and periodic shocks. Natural disas-ters (such as the April 2015 earthquake and recurring floods and landslides) and external developments (such as border closures, trade disruptions, and the recent pandemic) depressed growth and impact-ed livelihoods. Meanwhile, high political instability (including episodes of civil unrest) and infrastructure gaps impede private investment. The adoption of a new constitution in 2015, created a federal system that decentralizes some responsi-bilities to the seven provincial and 753 local governments. This is expected to improve service delivery and reduce geo-graphical disparities. At the same time, it has exacerbated pre-existing weaknesses in administrative and implementation capacity that need to be addressed. Against this backdrop, scarce domestic employment opportunities have triggered mass outmigration. The resulting high remittance inflows, averaging around 22 percent of GDP over the past decade, have supported private consumption and poverty reduction, but contributed to a real appreciation of the exchange rate and eroded external competitiveness. In FY20, COVID-19 related social distanc-ing measures and lockdowns triggered the first economic contraction in 40 years,
likely reversing past progress in poverty reduction. While lockdowns impacted all sectors of the economy, they dispropor-tionately affected workers engaged in subsistence activities, who make up over half of the employment. International bor-der restrictions and economic downturns abroad also forced thousands of Nepalese migrants to return home, elevating the risk that many households who have re-lied on remittances and informal sector jobs may fall back into poverty. Sources of risk to the outlook include possible new waves of COVID-19, as well as increased political uncertainties, fol-lowing the dissolution of Parliament’s lower house in December 2020 and the Supreme Court’s February 2021 decision to reinstate it.
Recent developments A nation-wide lockdown, implemented during March-July 2020, impacted eco-nomic activity in the last four months of FY20. As a result, output contracted by an estimated 1.9 percent in FY20. Whole-sale and retail trade, tourism, transport, and associated services such as hotels and restaurants – which are all im-portant drivers of growth - were particu-larly impacted. In the first half of FY21 (mid- July 2020 – mid-January 2021), growth has remained sluggish, given that tourism activity was stalled, and private investment con-strained by risk aversion and uncertainty. However, there were incipient signs of
NEPAL
After contracting in FY20, Nepal’s econo-
my is expected to grow in FY21, as
COVID-19 related disruptions fade and
government relief spending materializes.
Significant jobs and income losses, how-
ever, are likely to have increased vulnera-
bility. To ensure the recovery is sustained
and resilient, policy priorities will need to
include: strengthening health systems,
supporting agriculture production, and a
focus on green, resilient, and inclusive
development. Downside risks to the out-
look stem from new waves of COVID-19
infections and political uncertainties.
FIGURE 1 Nepal / Real GDP levels: Actual vs pre-covid trend FIGURE 2 Nepal / The current account deficit has narrowed
Sources: World Bank staff projections and Nepal Central Bureau of Statistics. Sources: World Bank staff calculations and Nepal Rastra Bank.
-8000
-6000
-4000
-2000
0
2000
4000
6000
H1FY21H1FY20H1FY19H1FY18H1FY17H1FY16
Workers' remittances Balance of goods and servicesCurrent account balance
USD million
20
40
60
80
100
120
140
FY2012 FY2014 FY2016 FY2018 FY2020 FY2022
Pre-covid 5 year GDP trend
Actual GDP
Index of real GDP, FY2019=100

195 MPO Apr 21
recovery in wholesale and retail trade, transport, and financial services, as con-tainment measures were gradually eased. Subdued demand and adequate food sup-ply brought consumer price inflation to a three-year low of 3.7 percent y-o-y. Against the backdrop of muted economic activity, the current account deficit de-clined by 39.6 percent year-on-year in the first half of FY21. This was driven by a sharp contraction in imports (11.8 percent y-o-y) which, in absolute terms, far out-weighed a parallel decline in exports (of 36.6 percent), as well as an increase in remittance inflows (by 6.7 percent). Given modest levels of foreign direct investment, external concessional loans financed the current account deficit. The central bank's foreign exchange reserves reached US$ 11.3 billion by mid-January 2021—equivalent to 11.3 months of imports. Spending was higher and revenue lower, y-o-y, over the first half of FY21. Higher spending was driven by purchases of COVID-related health equipment and investments at the subnational levels (which offset a 19 percent y-o-y reduction in capital spending). Meanwhile, tax reve-nues fell by 2.1 percent y-o-y, with trade and consumption taxes as well as corpo-rate income taxes performing poorly. Non-tax revenues continued to suffer from the near standstill in tourism. As a result, public debt increased by 7.4 percent over
the first half of FY21 to 36.1 percent of projected FY21 GDP. A recent World Bank COVID monitoring survey suggests that the pandemic-related economic slowdown had a major impact on jobs and incomes, with more than 2 in 5 economically active workers reporting a job loss or prolonged work absence in 2020.
Outlook Economic growth is projected to recover gradually, to 5.1 percent by FY23. The baseline projections assume a successful domestic and global vaccination rollout, and a gradual resumption of international tourism. Agriculture should continue to contribute positively to growth. However, industrial activity is expected to remain below pre-pandemic levels up until early FY22, and services are expected to recover only gradually as domestic confinement measures are lifted. With roughly a third of the population liv-ing close to the poverty line before the pan-demic, widespread jobs and earning losses are likely to have increased poverty, partic-ularly for women, younger age cohorts, and workers in non-agricultural sectors. The current account deficit is expected to widen over the medium term. Import
growth is expected to accelerate as con-sumption resumes, while service exports should remain subdued until FY22 (as tourism is only expected to recover fully in FY23). Consequently, the current ac-count deficit is projected to reach 3.2 per-cent of GDP by FY22, financed primarily by long-term concessional borrowing. The fiscal deficit is projected to remain elevated over the medium term. While revenue performance is expected to re-main weak, additional spending on eco-nomic relief measures, vaccinations, and the resumption of project implementation will widen the fiscal deficit to just under 8 percent of GDP in FY22. Thereafter it is projected to stabilize at 6.5 percent of GDP in FY23 as revenues recover. Total public debt is expected to reach 41.9 percent of GDP in FY21 and gradually increase to 51.3 percent by FY23. The economic outlook is subject to downside risks. Delays in vaccination and/or new outbreaks of COVID-19 both domestically and globally would damp-en prospects of economic recovery. The resumption of tourism would be delayed if international travel restrictions are imposed. Domestic risks include politi-cal uncertainty, which could undermine investment sentiment. On the upside, effective vaccination campaigns in Nepal and abroad could facilitate the resump-tion of tourism.
TABLE 2 Nepal / Macro poverty outlook indicators (annual percent change unless indicated otherwise)
2018 2019 2020 e 2021 f 2022 f 2023 f
Real GDP growth, at constant market prices 7.6 6.7 -1.9 2.7 3.9 5.1
Private Consumption 6.2 5.6 3.7 4.0 4.2 4.5
Government Consumption 2.1 7.3 6.2 11.8 15.4 4.1
Gross Fixed Capital Investment 11.8 11.3 -3.5 4.2 9.2 12.2
Exports, Goods and Services 7.7 5.5 -16.0 -18.0 11.1 17.2
Imports, Goods and Services 19.0 5.8 -15.3 4.5 12.4 11.4
Real GDP growth, at constant factor prices 7.4 6.4 -2.0 2.7 3.9 5.1
Agriculture 2.6 5.2 2.2 2.5 2.7 2.8
Industry 10.4 7.4 -4.2 3.1 4.6 6.9
Services 9.3 6.8 -3.6 2.7 4.4 5.9
Inflation (Consumer Price Index) 4.1 4.6 6.1 4.8 5.1 5.7
Current Account Balance (% of GDP) -7.1 -6.9 -0.9 -1.2 -3.2 -4.4
Fiscal Balance (% of GDP) -5.8 -5.0 -5.2 -6.9 -7.7 -6.5
Debt (% of GDP) 26.5 27.2 36.0 41.9 47.9 51.3
Primary Balance (% of GDP) -5.4 -4.4 -4.5 -6.2 -6.8 -5.5
Source: World Bank, Poverty & Equity and M acroeconomics, Trade & Investment Global Practices.Notes: e = estimate, f = forecast.NA

196 MPO Apr 21
Table 1 2020
Population, million 220.9
GDP, current US$ billion 264.5
GDP per capita, current US$ 1 1 97.6
International poverty rate ($1.9)a 4.4
Lower middle-income poverty rate ($3.2)a 35.7
Upper middle-income poverty rate ($5.5)a 76.2
Gini indexa 31 .6
School enro llment, primary (% gross)b 95.4
Life expectancy at birth, yearsb 67.1
(a) M ost recent value (2018), 2011 PPPs.
(b) WDI for School enrollment (2019); Life expectancy (2018).
Source: WDI, M acro Poverty Outlook, and off icial data.
Notes:
Key conditions and challenges Pakistan’s economy has been growing slowly over the past two decades. Annu-al per capita growth has averaged only 2 percent, less than half of the South Asia average, partly due to inconsistent mac-roeconomic policies and an under-reliance on investment and exports to drive economic growth. Short periods of rapid consumption-fueled growth fre-quently led to sizable current account and fiscal deficits, that ultimately re-quired policy tightening, resulting in recurrent boom-bust cycles (Figure 1). In early FY20, which runs from July 2019 to June 2020, following one such episode of external and fiscal imbalances, the country entered a 39-month IMF-Extended Fund Facility. The associated adjustment measures, including fiscal consolidation, contributed to a reduction of the imbalances over the year and im-proved macroeconomic stability. However, the containment measures adopted in response to the COVID-19 pandemic led to a collapse in economic activity during the final quarter of FY20. As a result, GDP growth is estimated to have contracted by 1.5 percent in FY20. Half of the working population saw ei-ther job or income losses, with informal and low-skilled workers employed in elementary occupations facing the strong-est contraction in employment. As a re-sult, poverty incidence is estimated to
have increased in FY20 from 4.4 to 5.4 percent, using the international poverty line of $1.90 PPP 2011 per day (Figure 2, Table 2), with more than two million peo-ple falling below this poverty line. More-over, 40 percent of households suffered from moderate to severe food insecurity. The government, therefore, focused on mitigating the adverse socioeconomic effects of the pandemic, and the IMF pro-gram was temporarily put on hold. Major risks to the outlook include the possibility of new waves of infections, the emergence of new vaccine-resistant strains, and setbacks in mass vaccina-tions. In addition, more delays in the im-plementation of critical structural reforms could lead to further fiscal and macroeco-nomic imbalances.
Recent developments Over the first half of FY21 (July to Decem-ber 2020), there have been signs of a frag-ile recovery. With increased community mobility, private consumption has strengthened, aided by record official re-mittance inflows. Investment is also esti-mated to have slightly recovered, as ma-chinery imports and cement sales both recorded double-digit growth rates. On the production side, crop production was relatively weak in the first six months of FY21, as cotton production was adversely affected by heavy mon-soon floods. Following the phased lifting of lockdown measures from May 2020 onwards, indicators of industrial and
PAKISTAN
Pakistan’s economy was severely impact-
ed by the COVID-19 shock in FY20 lead-
ing to an increase in poverty. With the
lifting of lockdown measures, the economy
is showing signs of a fragile recovery.
Growth is expected to gradually strength-
en but remain muted in the medium-
term. Fiscal deficit and debt levels are
projected to remain elevated but to gradu-
ally improve. Risks to the outlook include
new waves of COVID-19 infections and
delays in the implementation of critical
structural reforms.
FIGURE 1 Pakistan / Twin deficits and real GDP growth FIGURE 2 Pakistan / Actual and projected poverty rates and
real GDP per capita
Sources: Ministry of Finance and World Bank staff estimates. Note: Pakistan reports data on fiscal year (FY) basis. The fiscal year runs from July 1 through June 30.
Sources: World Bank. Notes: see Table 2.
Poverty rate (%) Real GDP per capita (LCU constant)
0
10000
20000
30000
40000
50000
60000
70000
0
20
40
60
80
100
2005 2007 2009 2011 2013 2015 2017 2019 2021 2023
International poverty rate Lower middle-income pov. rateUpper middle-income pov. rate Real GDP pc
-10
-5
0
5
10
-6
-4
-2
0
2
4
6
FY15 FY16 FY17 FY18 FY19 FY20-e FY21-f FY22-f FY23-f
Real GDP growth (lhs) Current account balance (rhs)Fiscal balance (rhs)
Percent Percent of GDP

197 MPO Apr 21
services activity have recovered, with “Large Scale Manufacturing” and busi-ness confidence indexes exceeding pre-COVID levels in December 2020. As a result, the majority of the informal work-ers affected by the crisis are expected have been able to return to work. Although headline inflation fell over July-February FY21 (y-o-y), it is still high at 8.3 percent on average, mostly on account of high food inflation. Since July 2020, the State Bank of Pakistan (SBP) has main-tained the policy rate at 7.0 percent to sup-port the economy. The capital adequacy ratio at end-December 2020 remained well above the minimum regulatory require-ment, indicating banking sector resilience over the first half of the fiscal year. Compared to a deficit of US$2.0 billion for June-December 2019, the current ac-count recorded a surplus of US$1.1 billion for June-December 2020, the first half-yearly surplus in almost a decade, as strong official remittance inflows more than offset a wider trade deficit. Both for-eign direct investment and portfolio in-vestment inflows decreased during this period, but the improved current account supported a balance of payments surplus.
The Pakistani rupee appreciated by 5.4 percent against the U.S. dollar, from end-June 2020 to end-December 2020, and offi-cial foreign exchange reserves increased to US$14.9 billion at end-December 2020, equivalent to 3.3 months of imports of goods and services. The fiscal deficit widened over the first six months of FY21 (y-o-y), as expenditure growth outpaced an increase in revenues. In line with the recovering of economic activity, total revenues grew by 3.7 per-cent. Over the same period, total expendi-tures rose by 6.2 percent, partly driven by higher interest payments. Public debt, including guaranteed debt, reached 87.9 percent of GDP at end-December 2020, up from 86.7 percent of GDP at end-December 2019.
Outlook Output growth is expected to recover gradually over the medium-term, averag-ing 2.2 percent over FY21-23, mostly due to contributions from private consump-tion. However, sectors that employ the
poorest, such as agriculture, are expected to remain weak, and therefore poverty is likely to remain high. The baseline out-look is predicated on the absence of sig-nificant infection flare-ups that would require more extensive lockdowns. The current account deficit is projected to narrow to 0.8 percent of GDP in FY21, as a wider trade deficit is more than offset by stronger remittances inflows. However, it is expected to increase over the medium term. Exports are projected to grow from FY22 onwards, as external conditions be-come more conducive and tariff reforms gain traction, but imports are also ex-pected to increase in line with stronger domestic activity and higher oil prices. While fiscal consolidation efforts are ex-pected to resume, the deficit is projected to remain elevated at 8.3 percent of GDP in FY21, partly due to the settlement of arrears in the power sector. As critical revenue-enhancing reforms gain pace and expenditure rationalization efforts re-sume, the fiscal deficit is projected to gradually narrow over the medium-term. Still, public debt will remain elevated in the medium term, as will Pakistan’s expo-sure to debt-related shocks.
TABLE 2 Pakistan / Macro poverty outlook indicators (annual percent change unless indicated otherwise)
2017/18 2018/19 2019/20 e 2020/21 f 2021/22 f 2022/23 f
Real GDP growth, at constant market prices 5.8 1.0 -1.5 1.3 2.0 3.4
Private Consumption 6.2 2.9 -1.0 2.5 2.5 3.4
Government Consumption 8.6 0.8 5.6 0.1 2.2 3.0
Gross Fixed Capital Investment 11.2 -12.8 -17.9 -4.2 1.1 3.7
Exports, Goods and Services 12.7 14.5 -8.6 -1.7 3.0 5.5
Imports, Goods and Services 17.6 4.3 -10.5 0.9 4.3 4.8
Real GDP growth, at constant factor prices 5.5 1.9 -1.5 1.3 2.0 3.4
Agriculture 4.0 0.6 1.5 0.5 2.3 2.6
Industry 4.6 -2.3 -5.0 1.5 1.7 3.5
Services 6.3 3.8 -1.3 1.4 2.1 3.6
Inflation (Consumer Price Index) 4.7 6.8 10.7 9.0 7.0 6.0
Current Account Balance (% of GDP) -6.1 -4.8 -1.1 -0.8 -1.3 -1.7
Net Foreign Direct Investment (% of GDP) 0.9 0.5 1.0 0.7 0.8 1.0
Fiscal Balance (% of GDP) -6.4 -9.0 -8.1 -8.3 -7.7 -6.9
Debt (% of GDP) 75.9 89.9 93.6 93.9 94.4 94.1
Primary Balance (% of GDP) -2.1 -3.5 -1.8 -2.1 -1.7 -1.1
International poverty rate ($1.9 in 2011 PPP)a,b 4.4 5.4 5.6 5.6 5.1
Lower middle-income poverty rate ($3.2 in 2011 PPP)a,b 35.7 38.7 39.3 39.2 37.9
Upper middle-income poverty rate ($5.5 in 2011 PPP)a,b 76.2 78.1 78.4 78.3 77.5
Source: World Bank, Poverty & Equity and M acroeconomics, Trade & Investment Global Practices.Notes: e = estimate, f = forecast.NA(a) Calculations based on SAR-POV harmonization, using 2018-PSLM .Actual data: 2018. Nowcast: 2019-2020. Forecast are from 2021 to 2023.
(b) Projection using neutral distribution (2018) with pass-through = 1 based on GDP per capita in constant LCU.

198 MPO Apr 21
Table 1 2020
Population, million 21 .9
GDP, current US$ billion 80.7
GDP per capita, current US$ 3685.6
International poverty rate ($1.9)a 0.9
Lower middle-income poverty rate ($3.2)a 1 1 .0
Upper middle-income poverty rate ($5.5)a 42.0
Gini indexa 39.3
School enro llment, primary (% gross)b 1 00.2
Life expectancy at birth, yearsb 76.8
(a) M ost recent value (2016), 2011 PPPs.
(b) M ost recent WDI value (2018).
Source: WDI, M acro Poverty Outlook, and off icial data.
Notes:
Key conditions and challenges The economy was already showing signs of weakness before the COVID-19 pandemic. Between 2017 and 2019, the average growth rate was only 3.1 per-cent, well below the levels of the begin-ning of the decade, when the economy reaped a peace dividend and the bene-fits of a determined policy thrust toward reconstruction. Modest growth, in re-cent years, is partly a reflection of (i) limited progress on structural reforms to shift the growth model toward great-er private sector participation, export-orientation, and integration into global value chains; (ii) frequent macroeco-nomic shocks, from inclement weather in 2016 and 2017, a political crisis in late 2018, and the Easter Sunday attacks in 2019; and (iii) low fiscal space to sup-port growth (although a fiscal stimulus package was implemented in 2019, fur-ther reducing fiscal space). Against this backdrop, COVID-19 had a significant impact on the economy and welfare. The government reacted swiftly to control the first large outbreak of COVID-19 in mid-March 2020. Related containment measures, especially in the second quarter of 2020, and a standstill of tourism activity, impacted the econo-my significantly. With the slowdown in the economy, fiscal balances were also impacted and particu-larly so since Sri Lanka is highly exposed
to global financial market sentiments (as its debt repayment profile requires ac-cessing financial markets frequently). Further sovereign rating downgrades by major rating agencies could negatively impact market sentiments and constrain market access. Thus, the country will need to strike a balance between support-ing the economy and ensuring fiscal and external sustainability.
Recent developments Real GDP contracted by 3.6 percent in 2020, the worst performance on record. It was caused by contractions in construc-tion, tourism, textile, mining and transport, due to mobility restrictions in the second quarter amid strict lockdowns. Agricultural activities were relatively un-interrupted, but the fishery sector suffered a significant shock. As a result of wide-spread earnings losses, particularly in industry sectors, poverty using the $3.20 per day poverty line is projected to have increased significantly, from 9.2 percent in 2019 to 11.7 percent in 2020. Despite high food inflation, annual aver-age inflation (measured by the Colombo Consumer Price Index) remained low at 4.6 percent in 2020 due to the offsetting effects of weak aggregate demand and low oil prices. This allowed the central bank to reduce policy rates by 250 basis points (Standing Deposit Facility to 4.5 percent and Standing Lending Facility to 5.5 percent) and the reserve ratio by 300 basis points (to 2.0 percent) in 2020.
SRI LANKA
The COVID-19 pandemic resulted in a
sharp economic contraction of 3.6 percent
in 2020. With jobs and earnings lost, pov-
erty is projected to have increased.
Growth is expected to recover to 3.4 per-
cent in 2021, but the medium-term out-
look is clouded by the lasting impact of
COVID-19. Economic scarring from the
slowdown increased risks to debt sustain-
ability and external stability and macroe-
conomic vulnerabilities will remain ele-
vated due to large refinancing needs.
FIGURE 1 Sri Lanka / Real GDP growth and contributions to
real GDP growth (production side)
FIGURE 2 Sri Lanka / Actual and projected poverty rates
and real GDP per capita
Sources: Department of Census and Statistics, staff calculations. Sources: World Bank. Notes: see Table 2.
Poverty rate (%) Real GDP per capita (LCU constant)
0
100000
200000
300000
400000
500000
0
10
20
30
40
50
60
70
2006 2008 2010 2012 2014 2016 2018 2020 2022
International poverty rate Lower middle-income pov. rateUpper middle-income pov. rate Real GDP pc
-4
-3
-2
-1
0
1
2
3
4
5
6
2016 2017 2018 2019 2020
Agriculture Industry ServiceNet taxes Overall growth
Percent, percentage points

199 MPO Apr 21
The current account deficit is estimated to have narrowed to 0.9 percent of GDP in 2020, as a reduction in imports due to low oil prices and severe import re-strictions offset reduced receipts from exports. However, official reserves de-clined to an 11-year low of US$ 4.6 bil-lion by February 2021, mainly because reserves were mobilized to service exter-nal debt. The US$ 1.5 billion currency swap approved by the People’s Bank of China in March 2021 is expected to pro-vide a boost to the reserves. After depre-ciating by 2.6 percent against the US Dollar in 2020, the LKR further depreci-ated by 4.1 percent in the first two months of 2021. The combination of a stimulus package in 2019 (pre-pandemic) and low revenues in the aftermath of the COVID-19 shock resulted in a steep deterioration in fiscal balances. The deficit is believed to have increased to 12.6 percent of GDP in 2020 (after including arrears payments), and public and publicly guaranteed debt to have increased to 109.7 percent of GDP. Citing limited fiscal buffers and external vulnerabilities, Fitch, S&P, and Moody’s downgraded the sovereign rating to the substantial risk investment category.
Outlook The pandemic has further clouded an al-ready challenging outlook. While the econ-omy is expected to grow by 3.4 percent in 2021, output will remain 0.3 percent below its pre-COVID level. With a gradual im-provement in labor market conditions, poverty at $3.20 per day is projected to fall to 10.9 percent in 2021, still significantly above the 2019 level. Continued import restrictions and the high debt burden will adversely affect growth and poverty re-duction over the medium-term. Inflation is projected to increase gradually, as domes-tic banking institutions, including the cen-tral bank, are contributing to finance the government deficit. The current account deficit is expected to remain low due to strict import re-strictions, which should largely offset a deceleration of export growth. Still, sig-nificant additional borrowings will be required to close the external financing gap in 2021 and beyond, as external pub-lic debt service requirements are estimat-ed above US$ 4.0 billion each year be-tween 2021 and 2023. External buffers are
expected to weaken relative to external liabilities as reserves may need to be used to service the external debt. The fiscal deficit is expected to be high in the forecast period, despite tightly con-trolled expenditures, as revenue collection is expected to remain weak. In turn, public and publicly guaranteed debt is expected to reach 115.0 percent of GDP in 2021 and to rise further between 2022-2023. High gross financing requirements will exert pressure on the domestic financial market. This baseline assumes a quick and com-prehensive vaccine rollout, in line with the government’s aim to vaccinate 60 percent of the population in 2021. Delays in the vaccination process in Sri Lanka and/or major tourist origin countries would ex-tend the horizon and depth of economic disruptions. A longer downturn could push many small and medium enterprises from illiquidity to insolvency, further holding back the recovery process and the return to a path of poverty reduction. Lower growth would also put additional strain on public finances and increase risks to macroeconomic stability. Depleted fiscal buffers, high indebtedness, and con-strained market access will continue to pose risks to debt sustainability.
TABLE 2 Sri Lanka / Macro poverty outlook indicators (annual percent change unless indicated otherwise)
2018 2019 2020 e 2021 f 2022 f 2023 f
Real GDP growth, at constant market prices 3.3 2.3 -3.6 3.4 2.0 2.1
Private Consumption 3.7 2.9 -3.7 3.3 1.9 2.2
Government Consumption -5.1 9.6 6.0 -1.0 -1.0 -1.0
Gross Fixed Capital Investment -1.4 4.0 -6.7 3.7 2.0 1.8
Exports, Goods and Services 0.5 7.1 -16.8 5.8 5.3 4.7
Imports, Goods and Services 1.8 -5.8 -12.4 3.1 2.7 2.5
Real GDP growth, at constant factor prices 3.7 2.2 -3.1 3.4 2.0 2.1
Agriculture 5.8 1.0 -2.4 2.0 2.0 2.0
Industry 1.3 2.6 -6.9 3.9 1.8 1.9
Services 4.6 2.2 -1.5 3.3 2.1 2.2
Inflation (Consumer Price Index) 4.3 4.3 4.6 5.2 6.0 6.0
Current Account Balance (% of GDP) -3.2 -2.2 -0.9 -1.2 -1.3 -1.4
Net Foreign Direct Investment (% of GDP) 1.8 0.7 0.6 0.8 1.0 1.2
Fiscal Balance (% of GDP)a -5.4 -6.8 -12.6 -9.4 -8.9 -8.3
Debt (% of GDP)a 92.2 94.3 109.7 115.0 117.7 119.6
Primary Balance (% of GDP)a 0.6 -0.8 -6.0 -2.7 -2.2 -1.7
International poverty rate ($1.9 in 2011 PPP)b,c 0.7 0.6 1.2 1.1 1.0 0.9
Lower middle-income poverty rate ($3.2 in 2011 PPP)b,c 9.6 9.2 11.7 10.9 10.4 10.0
Upper middle-income poverty rate ($5.5 in 2011 PPP)b,c 39.5 38.6 42.3 40.7 39.7 38.9
Source: World Bank, Poverty & Equity and M acroeconomics, Trade & Investment Global Practices.Notes: e = estimate, f = forecast.NA(a) Fiscal balance in 2020 includes arrears payments pertaining to 2019 and foreign funded pro ject related expenditures not included in the audited financial statements in 2019.
(b) Calculations based on SAR-POV harmonization, using 2016-HIES.Actual data: 2016. Nowcast: 2017-2020. Forecast are from 2021 to 2023.
(c) Projection using neutral distribution (2016) with pass-through = 0.87 based on GDP per capita in constant LCU.

Macro Poverty O
utlook04 / 2021