Embed Size (px)
Citation preview
South African Tax Performance: Some Perspectives and International Comparisons
by
Graham Glenday Duke Center for International Development,
Duke University
for
Tax Symposium 2008, National Treasury of South Africa
March 26, 2008 version
A paper prepared for presentation at the TAX SYMPOSIUM 2008 organized by the National Treasury of South Africa at the CSIR Convention Centre, Pretoria on 17-18 March, 2008, sponsored by USAID through the SEGA (Support for Growth and Analysis) project.

1
South African Tax Performance: Some Perspectives and International Comparisons1
Introduction Over recent decades, the South African central government tax revenues as share of gross domestic product (GDP) have risen steadily and particularly sharply since 2000. The central government tax yield rose from about 15% of GDP in 1960 to 17% in 1970, to 19% in 1980, rose further to 23% in 1990, and then stalled at about 23% through the 1990s before rising again to over 26% in 2008. Not all of this revenue yield increase, however, could be attributed to economic growth. By a number of measures, real per capita GDP 2
rose to a peak in 1981, but then steadily declined by some 18.5% to a trough in 1993 (ironically the last year of the apartheid era), before rising again to the levels of 1981 by 2007. While increasing per capita GDP typically allows low and middle-income countries to raise higher tax yields, other factors also significantly affect revenue performance, including improved tax policies, changing economic structures and compliance-enhancing tax administration. With the enactment of the South Africa Revenue Service (SARS) as a semi-autonomous authority in 1997, the effectiveness and efficiency of tax administration to broaden the tax bases and enhance tax compliance has no doubt improved, but there is not sufficient public data to analyze the impact of SARS on revenue performance. This paper, therefore, focuses on the impacts of changing tax policy and a changing economic environment, both national and international, on the revenue performance in South Africa with a particular focus on recent developments since 2000.
This paper presents the broad trends in tax performance in South Africa. The intent is to focus on the major factors affecting this performance drawing comparisons with tax policy and performance internationally. This should assist in objective predictions of future trends as well as some recommendations for potential new directions or perspectives on tax policy. A particular focus is on the remarkable increase in the tax yield from the income tax on companies since 2000 from about 3% to nearly 8% of GDP. Why this occurred and whether it will continue is clearly of major consequence to the overall tax performance in South Africa. The paper first discusses the changing mix and trends in the major tax types of the central government in South Africa. Second it makes some comments on the tax effort in South Africa in recent decades relative to comparable countries. Finally, some analysis of the
1 The author wishes to thank Cecil Morden, Unathi Kamlana and Basil Maseko of the National Treasury for their assistance in the preparation of this paper. All data unless otherwise indicated was supplied by the National Treasury or taken from Reserve Bank of South Africa data series, or from South African Revenue Service publications or National Budget documents. The opinions expressed are solely those of the author who is also responsible for any errors or omissions. 2 Per capital GDP measured in terms of constant rand values, constant US dollars or purchasing power parity measured in constant international dollars.
2
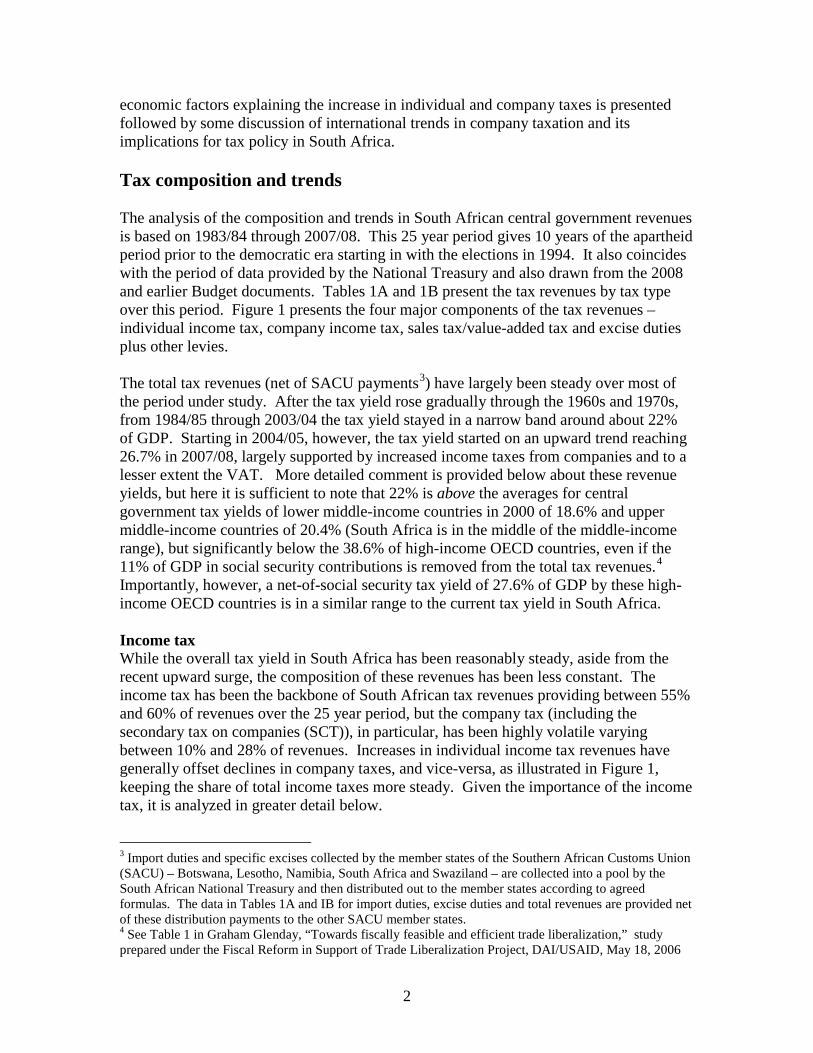
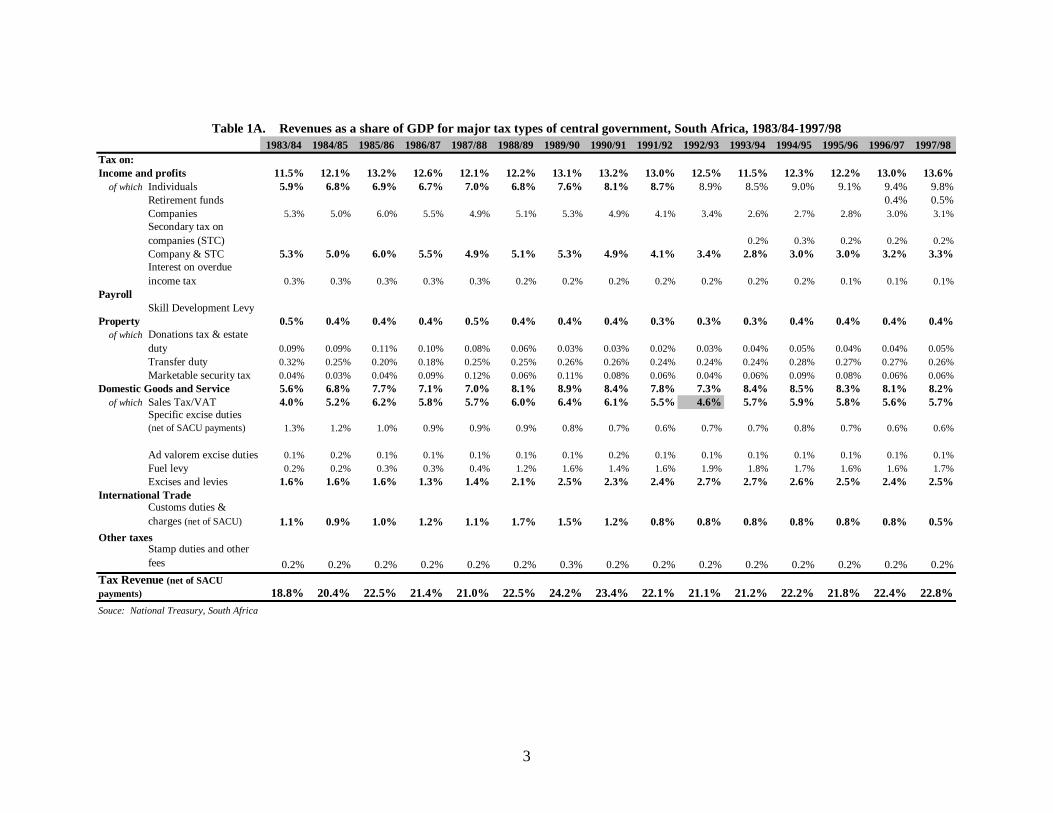
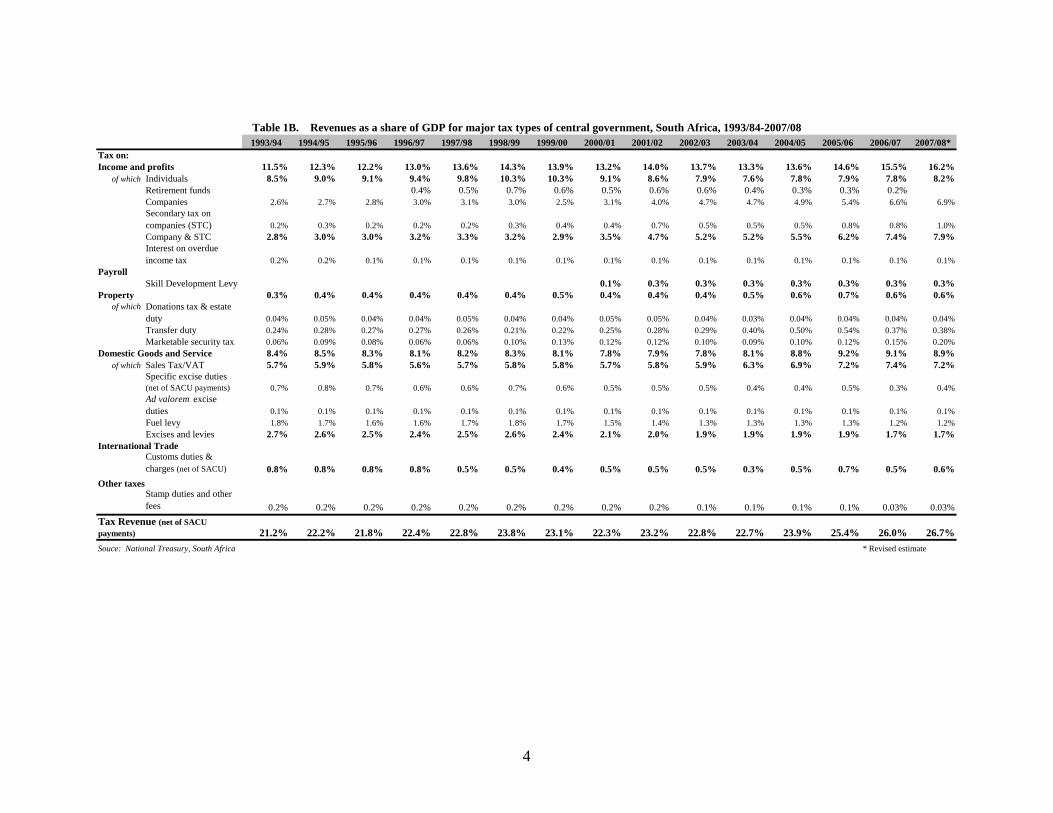
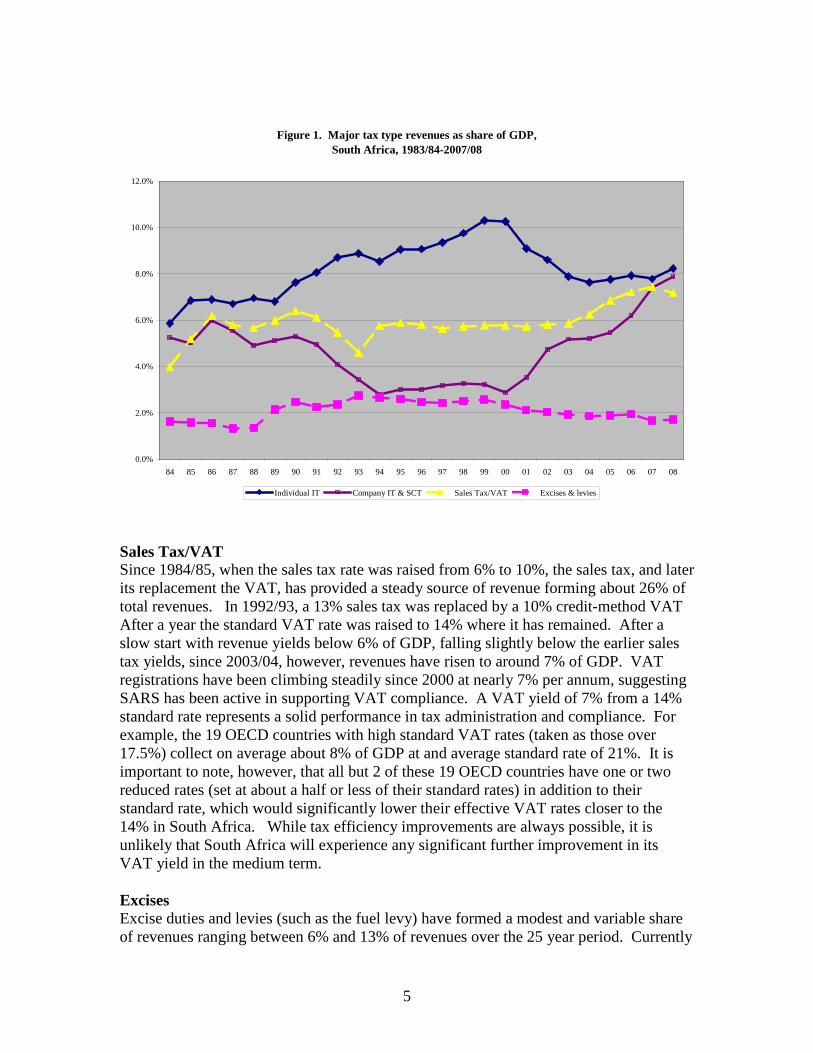
economic factors explaining the increase in individual and company taxes is presented followed by some discussion of international trends in company taxation and its implications for tax policy in South Africa. Tax composition and trends The analysis of the composition and trends in South African central government revenues is based on 1983/84 through 2007/08. This 25 year period gives 10 years of the apartheid period prior to the democratic era starting in with the elections in 1994. It also coincides with the period of data provided by the National Treasury and also drawn from the 2008 and earlier Budget documents. Tables 1A and 1B present the tax revenues by tax type over this period. Figure 1 presents the four major components of the tax revenues – individual income tax, company income tax, sales tax/value-added tax and excise duties plus other levies. The total tax revenues (net of SACU payments3) have largely been steady over most of the period under study. After the tax yield rose gradually through the 1960s and 1970s, from 1984/85 through 2003/04 the tax yield stayed in a narrow band around about 22% of GDP. Starting in 2004/05, however, the tax yield started on an upward trend reaching 26.7% in 2007/08, largely supported by increased income taxes from companies and to a lesser extent the VAT. More detailed comment is provided below about these revenue yields, but here it is sufficient to note that 22% is above the averages for central government tax yields of lower middle-income countries in 2000 of 18.6% and upper middle-income countries of 20.4% (South Africa is in the middle of the middle-income range), but significantly below the 38.6% of high-income OECD countries, even if the 11% of GDP in social security contributions is removed from the total tax revenues.4
Importantly, however, a net-of-social security tax yield of 27.6% of GDP by these high-income OECD countries is in a similar range to the current tax yield in South Africa.
Income tax While the overall tax yield in South Africa has been reasonably steady, aside from the recent upward surge, the composition of these revenues has been less constant. The income tax has been the backbone of South African tax revenues providing between 55% and 60% of revenues over the 25 year period, but the company tax (including the secondary tax on companies (SCT)), in particular, has been highly volatile varying between 10% and 28% of revenues. Increases in individual income tax revenues have generally offset declines in company taxes, and vice-versa, as illustrated in Figure 1, keeping the share of total income taxes more steady. Given the importance of the income tax, it is analyzed in greater detail below.
3 Import duties and specific excises collected by the member states of the Southern African Customs Union (SACU) – Botswana, Lesotho, Namibia, South Africa and Swaziland – are collected into a pool by the South African National Treasury and then distributed out to the member states according to agreed formulas. The data in Tables 1A and IB for import duties, excise duties and total revenues are provided net of these distribution payments to the other SACU member states. 4 See Table 1 in Graham Glenday, “Towards fiscally feasible and efficient trade liberalization,” study prepared under the Fiscal Reform in Support of Trade Liberalization Project, DAI/USAID, May 18, 2006
3
1983/84 1984/85 1985/86 1986/87 1987/88 1988/89 1989/90 1990/91 1991/92 1992/93 1993/94 1994/95 1995/96 1996/97 1997/98Tax on:Income and profits 11.5% 12.1% 13.2% 12.6% 12.1% 12.2% 13.1% 13.2% 13.0% 12.5% 11.5% 12.3% 12.2% 13.0% 13.6%
of which Individuals 5.9% 6.8% 6.9% 6.7% 7.0% 6.8% 7.6% 8.1% 8.7% 8.9% 8.5% 9.0% 9.1% 9.4% 9.8%Retirement funds 0.4% 0.5%Companies 5.3% 5.0% 6.0% 5.5% 4.9% 5.1% 5.3% 4.9% 4.1% 3.4% 2.6% 2.7% 2.8% 3.0% 3.1%Secondary tax on companies (STC) 0.2% 0.3% 0.2% 0.2% 0.2%Company & STC 5.3% 5.0% 6.0% 5.5% 4.9% 5.1% 5.3% 4.9% 4.1% 3.4% 2.8% 3.0% 3.0% 3.2% 3.3%Interest on overdue income tax 0.3% 0.3% 0.3% 0.3% 0.3% 0.2% 0.2% 0.2% 0.2% 0.2% 0.2% 0.2% 0.1% 0.1% 0.1%
PayrollSkill Development Levy
Property 0.5% 0.4% 0.4% 0.4% 0.5% 0.4% 0.4% 0.4% 0.3% 0.3% 0.3% 0.4% 0.4% 0.4% 0.4%of which Donations tax & estate
duty 0.09% 0.09% 0.11% 0.10% 0.08% 0.06% 0.03% 0.03% 0.02% 0.03% 0.04% 0.05% 0.04% 0.04% 0.05%Transfer duty 0.32% 0.25% 0.20% 0.18% 0.25% 0.25% 0.26% 0.26% 0.24% 0.24% 0.24% 0.28% 0.27% 0.27% 0.26%Marketable security tax 0.04% 0.03% 0.04% 0.09% 0.12% 0.06% 0.11% 0.08% 0.06% 0.04% 0.06% 0.09% 0.08% 0.06% 0.06%
Domestic Goods and Service 5.6% 6.8% 7.7% 7.1% 7.0% 8.1% 8.9% 8.4% 7.8% 7.3% 8.4% 8.5% 8.3% 8.1% 8.2%of which Sales Tax/VAT 4.0% 5.2% 6.2% 5.8% 5.7% 6.0% 6.4% 6.1% 5.5% 4.6% 5.7% 5.9% 5.8% 5.6% 5.7%
Specific excise duties (net of SACU payments) 1.3% 1.2% 1.0% 0.9% 0.9% 0.9% 0.8% 0.7% 0.6% 0.7% 0.7% 0.8% 0.7% 0.6% 0.6%
Ad valorem excise duties 0.1% 0.2% 0.1% 0.1% 0.1% 0.1% 0.1% 0.2% 0.1% 0.1% 0.1% 0.1% 0.1% 0.1% 0.1%Fuel levy 0.2% 0.2% 0.3% 0.3% 0.4% 1.2% 1.6% 1.4% 1.6% 1.9% 1.8% 1.7% 1.6% 1.6% 1.7%Excises and levies 1.6% 1.6% 1.6% 1.3% 1.4% 2.1% 2.5% 2.3% 2.4% 2.7% 2.7% 2.6% 2.5% 2.4% 2.5%
International TradeCustoms duties & charges (net of SACU) 1.1% 0.9% 1.0% 1.2% 1.1% 1.7% 1.5% 1.2% 0.8% 0.8% 0.8% 0.8% 0.8% 0.8% 0.5%
Other taxesStamp duties and other fees 0.2% 0.2% 0.2% 0.2% 0.2% 0.2% 0.3% 0.2% 0.2% 0.2% 0.2% 0.2% 0.2% 0.2% 0.2%
18.8% 20.4% 22.5% 21.4% 21.0% 22.5% 24.2% 23.4% 22.1% 21.1% 21.2% 22.2% 21.8% 22.4% 22.8%Tax Revenue (net of SACU payments)
Souce: National Treasury, South Africa
Table 1A. Revenues as a share of GDP for major tax types of central government, South Africa, 1983/84-1997/98
4
1993/94 1994/95 1995/96 1996/97 1997/98 1998/99 1999/00 2000/01 2001/02 2002/03 2003/04 2004/05 2005/06 2006/07 2007/08*Tax on:Income and profits 11.5% 12.3% 12.2% 13.0% 13.6% 14.3% 13.9% 13.2% 14.0% 13.7% 13.3% 13.6% 14.6% 15.5% 16.2%
of which Individuals 8.5% 9.0% 9.1% 9.4% 9.8% 10.3% 10.3% 9.1% 8.6% 7.9% 7.6% 7.8% 7.9% 7.8% 8.2%Retirement funds 0.4% 0.5% 0.7% 0.6% 0.5% 0.6% 0.6% 0.4% 0.3% 0.3% 0.2%Companies 2.6% 2.7% 2.8% 3.0% 3.1% 3.0% 2.5% 3.1% 4.0% 4.7% 4.7% 4.9% 5.4% 6.6% 6.9%Secondary tax on companies (STC) 0.2% 0.3% 0.2% 0.2% 0.2% 0.3% 0.4% 0.4% 0.7% 0.5% 0.5% 0.5% 0.8% 0.8% 1.0%Company & STC 2.8% 3.0% 3.0% 3.2% 3.3% 3.2% 2.9% 3.5% 4.7% 5.2% 5.2% 5.5% 6.2% 7.4% 7.9%Interest on overdue income tax 0.2% 0.2% 0.1% 0.1% 0.1% 0.1% 0.1% 0.1% 0.1% 0.1% 0.1% 0.1% 0.1% 0.1% 0.1%
PayrollSkill Development Levy 0.1% 0.3% 0.3% 0.3% 0.3% 0.3% 0.3% 0.3%
Property 0.3% 0.4% 0.4% 0.4% 0.4% 0.4% 0.5% 0.4% 0.4% 0.4% 0.5% 0.6% 0.7% 0.6% 0.6%of which Donations tax & estate
duty 0.04% 0.05% 0.04% 0.04% 0.05% 0.04% 0.04% 0.05% 0.05% 0.04% 0.03% 0.04% 0.04% 0.04% 0.04%Transfer duty 0.24% 0.28% 0.27% 0.27% 0.26% 0.21% 0.22% 0.25% 0.28% 0.29% 0.40% 0.50% 0.54% 0.37% 0.38%Marketable security tax 0.06% 0.09% 0.08% 0.06% 0.06% 0.10% 0.13% 0.12% 0.12% 0.10% 0.09% 0.10% 0.12% 0.15% 0.20%
Domestic Goods and Service 8.4% 8.5% 8.3% 8.1% 8.2% 8.3% 8.1% 7.8% 7.9% 7.8% 8.1% 8.8% 9.2% 9.1% 8.9%of which Sales Tax/VAT 5.7% 5.9% 5.8% 5.6% 5.7% 5.8% 5.8% 5.7% 5.8% 5.9% 6.3% 6.9% 7.2% 7.4% 7.2%
Specific excise duties (net of SACU payments) 0.7% 0.8% 0.7% 0.6% 0.6% 0.7% 0.6% 0.5% 0.5% 0.5% 0.4% 0.4% 0.5% 0.3% 0.4%Ad valorem excise duties 0.1% 0.1% 0.1% 0.1% 0.1% 0.1% 0.1% 0.1% 0.1% 0.1% 0.1% 0.1% 0.1% 0.1% 0.1%Fuel levy 1.8% 1.7% 1.6% 1.6% 1.7% 1.8% 1.7% 1.5% 1.4% 1.3% 1.3% 1.3% 1.3% 1.2% 1.2%Excises and levies 2.7% 2.6% 2.5% 2.4% 2.5% 2.6% 2.4% 2.1% 2.0% 1.9% 1.9% 1.9% 1.9% 1.7% 1.7%
International TradeCustoms duties & charges (net of SACU) 0.8% 0.8% 0.8% 0.8% 0.5% 0.5% 0.4% 0.5% 0.5% 0.5% 0.3% 0.5% 0.7% 0.5% 0.6%
Other taxesStamp duties and other fees 0.2% 0.2% 0.2% 0.2% 0.2% 0.2% 0.2% 0.2% 0.2% 0.1% 0.1% 0.1% 0.1% 0.03% 0.03%
21.2% 22.2% 21.8% 22.4% 22.8% 23.8% 23.1% 22.3% 23.2% 22.8% 22.7% 23.9% 25.4% 26.0% 26.7%* Revised estimate
Tax Revenue (net of SACU payments)
Table 1B. Revenues as a share of GDP for major tax types of central government, South Africa, 1993/84-2007/08
Souce: National Treasury, South Africa
5
Figure 1. Major tax type revenues as share of GDP, South Africa, 1983/84-2007/08
0.0%
2.0%
4.0%
6.0%
8.0%
10.0%
12.0%
84 85 86 87 88 89 90 91 92 93 94 95 96 97 98 99 00 01 02 03 04 05 06 07 08
Individual IT Company IT & SCT Sales Tax/VAT Excises & levies Sales Tax/VAT Since 1984/85, when the sales tax rate was raised from 6% to 10%, the sales tax, and later its replacement the VAT, has provided a steady source of revenue forming about 26% of total revenues. In 1992/93, a 13% sales tax was replaced by a 10% credit-method VAT After a year the standard VAT rate was raised to 14% where it has remained. After a slow start with revenue yields below 6% of GDP, falling slightly below the earlier sales tax yields, since 2003/04, however, revenues have risen to around 7% of GDP. VAT registrations have been climbing steadily since 2000 at nearly 7% per annum, suggesting SARS has been active in supporting VAT compliance. A VAT yield of 7% from a 14% standard rate represents a solid performance in tax administration and compliance. For example, the 19 OECD countries with high standard VAT rates (taken as those over 17.5%) collect on average about 8% of GDP at and average standard rate of 21%. It is important to note, however, that all but 2 of these 19 OECD countries have one or two reduced rates (set at about a half or less of their standard rates) in addition to their standard rate, which would significantly lower their effective VAT rates closer to the 14% in South Africa. While tax efficiency improvements are always possible, it is unlikely that South Africa will experience any significant further improvement in its VAT yield in the medium term. Excises Excise duties and levies (such as the fuel levy) have formed a modest and variable share of revenues ranging between 6% and 13% of revenues over the 25 year period. Currently

6
excises and levies yield 1.7% of GDP in revenues and are at the low end of the historical range of revenue shares. The highest yield was in 1998/99 at 2.6% of GDP with the majority of revenue coming from the fuel levy. The 30 OECD countries average about 3% of GDP in excise revenues with Turkey at the top end of the distribution at over 6% of GDP from its special consumption taxes in addition to its VAT. Expanded use of excise taxes offers an option for revenue increases. To some extent, South Africa has been reluctant to expand its use of excise because the sharing of the specific excise duties under the 1969 SACU agreement was biased against South Africa. Since the implementation in 2005 of the new 2002 SACU Agreement that shares excise revenues largely in proportion to GDP, South Africa may be less averse to using these excises to enhance revenues. Import duties In line with international trends over the past few decades, South Africa has decreased its use of import duties as a revenue source down to only 2% of its total tax revenues. Over the period 1975 through 2000, for example, a sample of middle-income countries reduced their average trade tax yields from about 6% to 3.7% of GDP. Over the 25 year period of this study, South Africa reduced its use of import duties from 1.1% to 0.6% of GDP. South Africa, however, did make increased use of trade protection during the period of international economic sanctions against apartheid South Africa. Import duty yields peaked at 1.7% of GDP in 1988/89. While most low-income countries and about a third of lower middle income countries that lowered their use of trade tax revenues over 1975-2000 were unable to replace these tax losses with increased domestic taxes,5
South Africa has readily managed to offset its import duty losses with VAT and income tax increases.
Transfer and property taxes South Africa charges a number of taxes on property – estate duty and donations tax, transfer duty and marketable securities tax – which in combination collect about 0.6% of GDP or just over 2% of revenues. The transfer duty which is charged at 8% on property transfers6
forms 60% of these revenues. Transfer taxes by their nature are arbitrary and distort market transactions given they only apply if and when a transfer occurs. They also compete with annual recurrent property rates for the same tax base. Given the trend towards decentralization of government in South Africa, opening up the land and buildings property base to local authority taxation would appear to be a preferable allocation of taxation powers and the transfer duty could be phased out.
Payroll taxes Since 2000/01, the skill development levy has been collected at 1% of payroll through the budget as tax revenues amounting to 0.3% of GDP. In addition, a 2% contribution of payroll (on the first R11,622 per month) has to be contributed to the Unemployment Insurance Fund (UIF). These contributions amount to over 0.4% of GDP. In addition, employers pay premiums into the Compensation Fund for Occupational Injuries and
5 Baunsgaard, Thomas and Michael Keen, “Tax Revenue and (or?) Trade Liberalization” International Monetary Fund, IMF Working Paper WP/05/112 (June 2005) 6 For individual acquiring property rate is 0% on first R500,000, 5% on the next R500,000, and 8% on the amount above R1,000,000.
7
Diseases amounting to 0.15% of GDP. Payroll taxes have been the traditional source of funds internationally for social security programs. Aside from the contributions just listed, South Africa to date has funded social security benefits out of general revenues. As announced with the 2008 Budget, consideration is being given to an expanded social security system for South Africa. This will no doubt require added social security contributions charged on payroll to supplement the draw on the budget revenues. Added payroll taxes will increase the total tax on employment and potentially slow down employment growth in the formal sector of the economy. Currently marginal tax rates (MTRs) on individual income range from 18% on the first R122,000 of annual income up to 40% of amounts in excess of R490,000 per year. In addition, the skill development levy and UIF contributions add about 3% in the bottom bracket and 1% to other brackets on employment compensation. Higher payroll taxes to fund social security may require further reductions in the MTRs in the personal income tax. Tax effort Another approach to comparing total tax yields across countries is to consider the tax effort of a country. Tax effort is defined as the actual tax yield compared to the tax yield of countries with similar economic features. Importantly the features should be those that affect the productivity of taxes – make tax collection and compliance either easier or more difficult. One way of making this comparison is choosing other countries with similar features and making the comparison. A more sophisticated way is developing an explanatory model that predicts the tax yield of countries based on the tax-relevant features of an economy. For example, tax collection should be more productive in economies with large mining sectors or with large volumes of trade following through well managed airports or seaports. By contrast, economies with large informal sectors in their agricultural or urban sectors are expected to have difficulty collecting taxes. Models of tax yields that control for the features of an economy that predict the ease or difficulty of tax collections are said to estimate the tax capacity of economies. The tax effort is then found by comparing actual tax yields compared to the estimated tax capacity (or the tax yield of the country controlling for its economic features that affect tax productivity.) The tax performance of South Africa can be judged based on its tax effort. Recent estimates of tax capacity by this author are used. One study of tax capacity is based on the tax performance of 13 member states of the Southern African Development Community (SADC) over 1990-2001.7 These estimates showed South Africa with a tax effort of 1.05 (or 5% above its estimated tax capacity) on average over the period and 11% above its estimated capacity in 2001 as revenue yields increased. A second study of tax capacity is based on tax yield data for 123 countries over 1975-2000.8
7 Chapter 6 in Graham Glenday, “Assessment of the Current State of VAT Implementation in SADC Member States” Report prepared for the Trade, Industry, Finance and Investment (TIFI) Directorate of the Southern African Development Community, August 15, 2004, revised November 30, 2005
Two sets of estimates of tax capacity were made. One based only on countries with low-incomes and lower middle-incomes, and the other on the full sample. Both sets of estimates of tax
8 Annex E in Graham Glenday, “Towards fiscally feasible and efficient trade liberalization,” study prepared under the Fiscal Reform in Support of Trade Liberalization Project, DAI/USAID, May 18, 2006
8
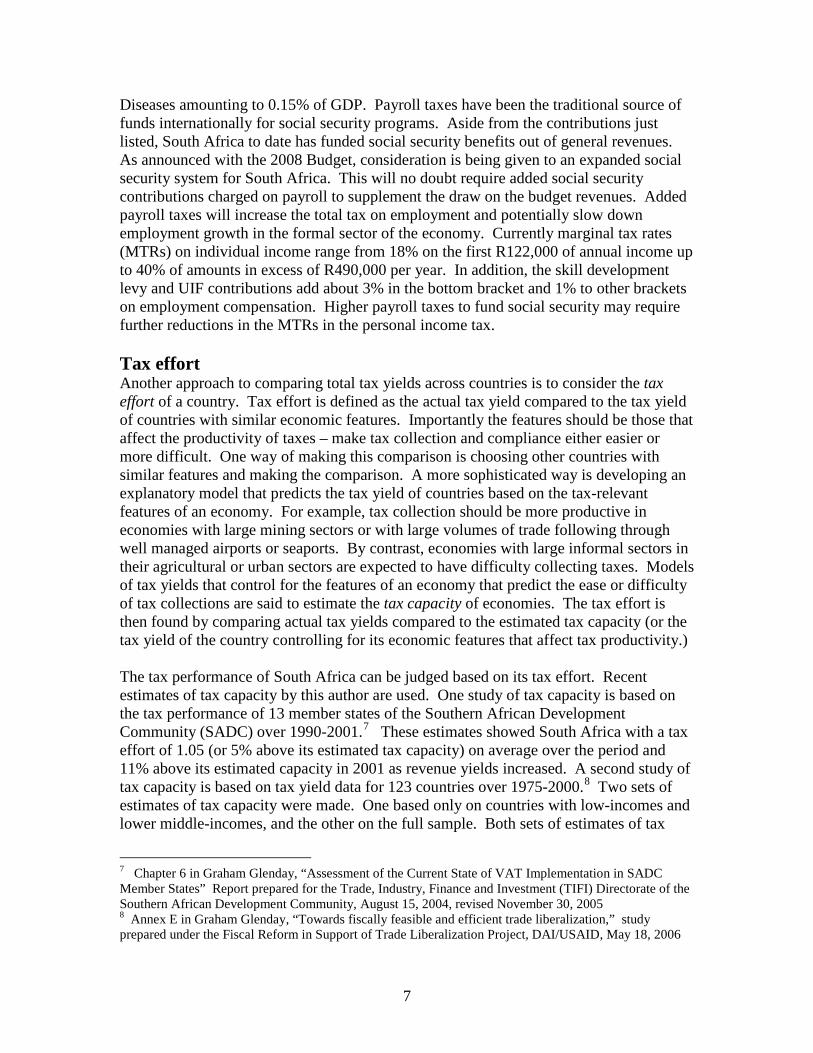
capacity for South Africa give similar results. In 1975, the South African tax effort was some 15% below its estimated tax capacity. It gradually rose to its estimated tax capacity by the mid-1980s and then continued to rise to be 15% above capacity by 2000. With the continued rise in tax yields through 2007/06, the tax effort has risen further to be some 20% above capacity. Individual income tax performance: Economic determinants and tax policy issues The individual income tax has been the largest source of tax revenue. It is also arguably the most politically sensitive tax given its direct nature and differentiation by individual income level, particularly since the transition from the apartheid to the democratic eras. The tax rate structure on individual income has undergone significant changes to accommodate and encourage compliance by a broader tax base. For example, comparing 2008/09 with 1995/96, there has been a reduction in the rate brackets from 8 to 6, and after adjusting for inflation, the width of the bottom bracket has been expanded by 285%,9
the threshold at which tax becomes payable increased by 49%, and the start of the top tax bracket by 190%. At the same time the top marginal tax rate (MTR) was lowered from 45% to 40%. These moves clearly serve a number of competing needs. First, they provide increased protection for low-income individuals and lower the entry barriers into formal employment. Second, the expand bracket widths ease the tax burden on the middle-income earners. Third, lowering the top tax rate helps make South Africa more competitive to retain and attract professional and high skill workers to the extent that tax burdens become a factor in worker location choices. Figure 2 illustrates some of the changes to the individual income tax structure since 1984.
A basic question that emerges is whether the top MTR in South Africa of 40% is in the “right” range. As will be noted below, this top rate has significant impact on revenues, but at the same time concerns arise about the rate in terms of its impact on attracting and retaining top workers and investment. Ultimately, the willingness of a population to pay combined with the capacity of the country to enforce high tax rates limits the maximum efficient tax rate, even where labor migration is not a factor and market labor supply can be taken as being relatively inelastic. When compared to OECD countries, this rate seems reasonable. The average top statutory rate among these countries was 46% in 2000 (ranging from 32% to 63.9%).10
9 The expansion of the bottom bracket is strictly 1056% if the R5,000 at 17% is as the bottom bracket. For better comparability of the change in tax structure, the first three brackets at 17%, 18% and 19%, respectively, up to R15,000 are taken as one bracket. These three brackets were in fact combined in 1996/97 and that structure retained through 2008/09 when the first bracket charges 18% on the first R122,000.
By 2006, the average top statutory rate had fallen to 43% (ranging from 19% to 59.7%). When compared to a selection of low- and middle-income countries, however, there are many countries with lower top MTR rates: Russia, 13%; Ukraine, 15%; Egypt, 20%; Ghana, Uruguay, 25%; Brazil, 27.5%; Malaysia, 28%; Botswana, India, Kenya, Tanzania, Uganda, 30%; Pakistan, 30% on
10 SourceOECD Revenue Statistics of OECD Member Countries, Comparative Tables Vol 2007 release 01
9
employment income, 35% on other income; Philippines, 32%; Argentine, Namibia, 35%; and Thailand, 37%. There are also others with the same or higher MTR such as Chile and Taiwan, 40%; and China 45%.11
Figure 2 Key features of the individual income tax rate structure
0
10
20
30
40
50
60
1984
1985
1986
1987
1988
1989
1990
1991
1992
1993
1994
1995
1996
1997
1998
1999
2000
2001
2002
2003
2004
2005
2006
2007
2008
2009
Top
MTR
and
IT R
ev/G
DP
(%)
0
50000
100000
150000
200000
250000
300000
350000
Ran
d (c
onst
ant 2
000
pric
es)
Top MTR IndividuaL Tax Rev/GDP Top bracket Bottom bracket Threshold income
Another major consideration in comparing tax rates on individual income is the added tax on employment arising from social security contributions. This can markedly increase the tax on employment earnings, often more among low income workers than high where there are caps on the income levels covered by social security. Among OECD countries, social security contributions currently add about 28% to the tax rate on the average worker wage. This ranges, however, from zero in New Zealand (with a top MTR of 39%) to 55.3% in France (with a top MTR of 55.9%). Social security contributions clearly change the costs of compensating workers from the employers’ perspective (to the extent the tax burden falls on the employer), but they also may have different impacts on workers across countries depending upon the package of health and financial security benefits arising from a social security scheme, and to what extent these substitute for private provision of these services either by employers or the employees themselves. As noted above, the current consideration of expanded social security benefits in South Africa will require careful analysis of the effects of any additional social security contributions on payroll or self-employed income in conjunction with the existing tax rate structure on individual incomes.
11 PriceWaterhouseCoopers, Worldwide Tax Summaries Online

10
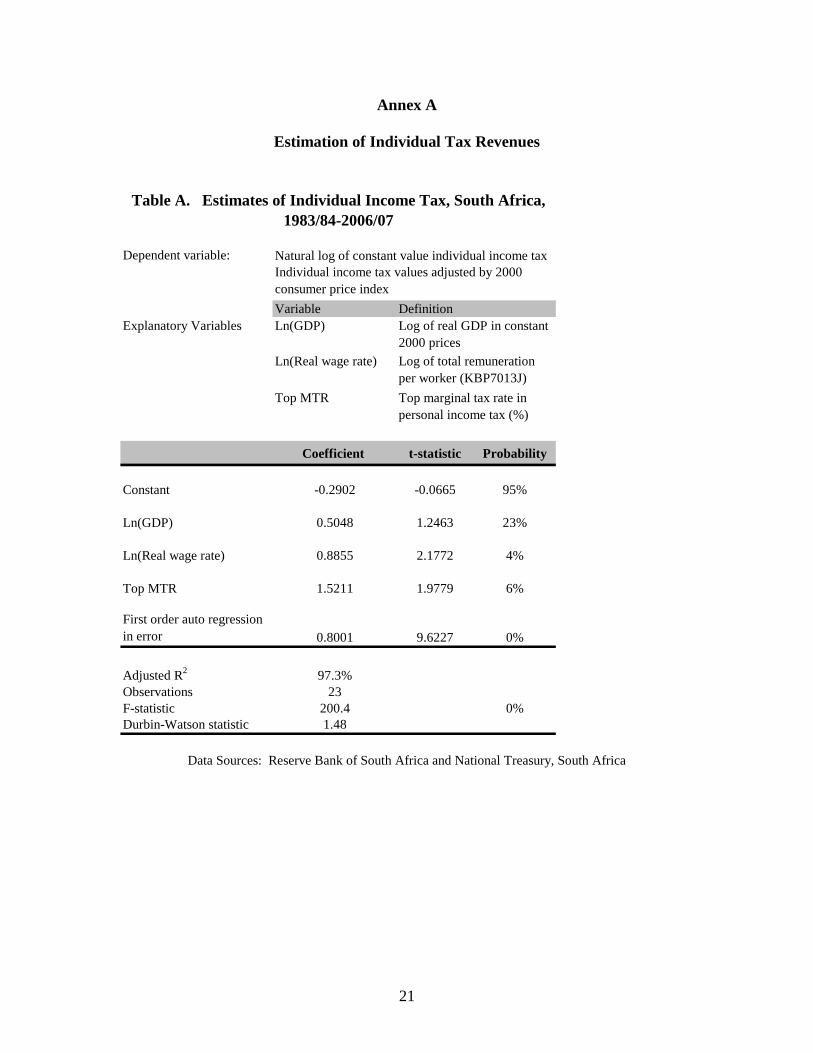
A final key aspect of the changes to the individual income tax is the impact on the individual revenue collections. As has been illustrated above, individual income taxes rose from a 5.9% of GDP in 1983/84 to a peak of 10.3% of GDP in 1998/99 before gradually declining to 7.6% of GDP in 2003/04 and then recovering somewhat to 8.2% in 2007/08. The revenue effects of the complex set of changes to the overall tax structure over the past decade cannot be adequately explained without access to the detailed micro-data files of the income returns in order to assess the separate contributions of the changes in bracket widths, tax rates, employment income patterns and tax compliance over the years. Here, some analysis is attempted based on some aggregate economic and tax structure indicators. In Annex A, an estimation is made of the determinants on the annual real income tax revenues (adjusted to 2000 year values by the CPI) over 1983/84 through 2007/08. The results of this analysis show that individual income tax revenue has increased by about 0.5% for a 1% increase in real GDP, and 0.9% for each 1% increase in real wage rates. Real increases in per capita income tend to push taxpayers income higher tax brackets causing increases in the effective income tax rate they pay. Real wage rates increased steadily over recent decades, averaging 3.4% during the 1990s and 2.6% over 2000-2006. By contrast, increases in employment had no significant impact on income taxes (other than through increasing GDP). Employment growth was flat or even negative during periods from 1983 up to 2000, but since then private sector employment has increased rapidly at an average annual rate of 12.3%. As will be discussed further below, most of this wage growth is likely to have disproportionately added taxpayers to the lower brackets and not raised (or even lowered) the effective tax rate. Finally, raising the top MTR by one percentage point increased the revenues by 1.5%. Typically, in lower and middle income countries, the income in the top bracket forms a large share of the taxable income, and hence, revenues are sensitive to the tax rate.12
Company income tax performance: Economic determinants and tax policy issues The rapid growth in company tax revenues (including secondary company tax) in South Africa from 2.9% in 1999/2000 to 7.9% in 2007/08 demands an understanding of its determinants. (See Table 1.B. and Figure 1.) This is important in forecasting future revenues and in setting future company tax rates. In general, for an ad valorem tax at rate, t, on a base, B, the revenues, R, are simply t*B. If the base is expressed as a share of GDP, Y, then revenues can be expressed as R=t*(B/Y)*Y. As long as the base grows at the same rate as the economy, or (B/Y) stays constant, then we expect the tax revenue to grow at the same rate as the economy (or to have a tax elasticity of one) and the revenues as a share of GDP to stay constant, R/Y = t*(B/Y). Clearly R/Y for the company tax has not been constant over the period under study as illustrated by Figure 1. In addition, a
12 To check on the effect of the change in the political regime, a dummy variable for the apartheid era (years up to 1993/94) was created under the expectation that the apartheid period would be characterized by a narrower taxpayer base and higher non-compliance responses to tax rate increases. Within the limitations of the aggregate tax data available, however, a change in the pattern of taxpayer responses to a complex set of tax structure changes did not emerge in to support such expectations.
11
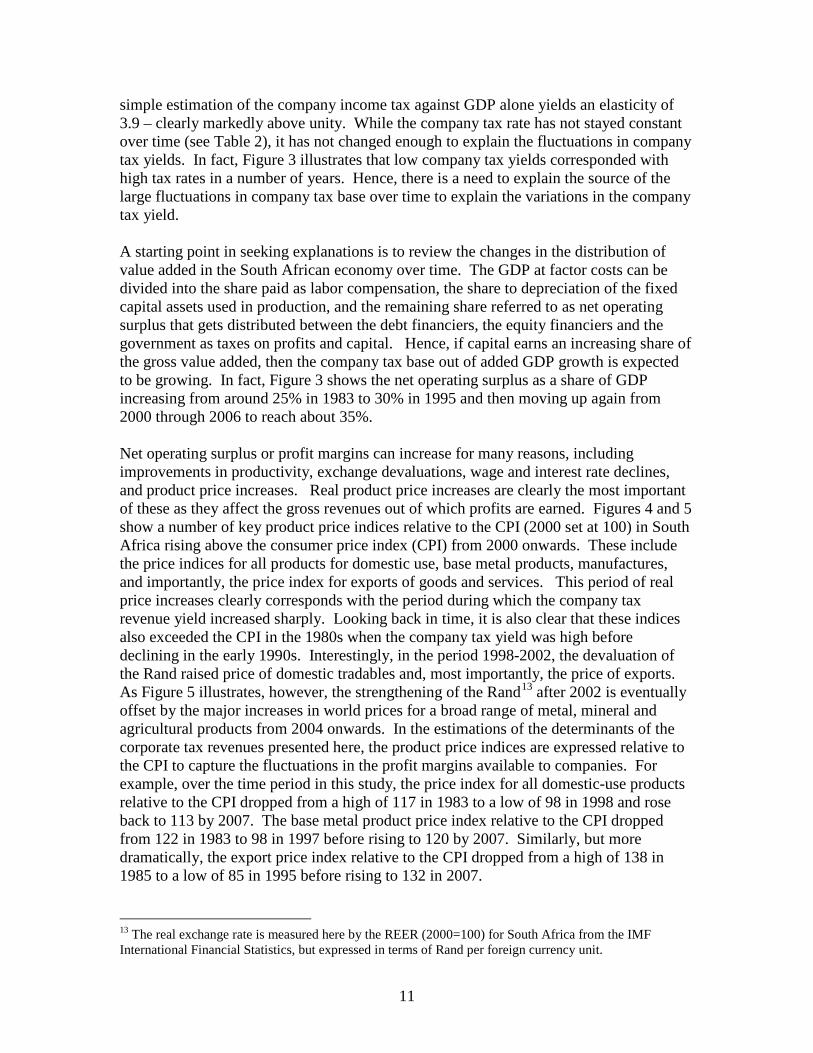
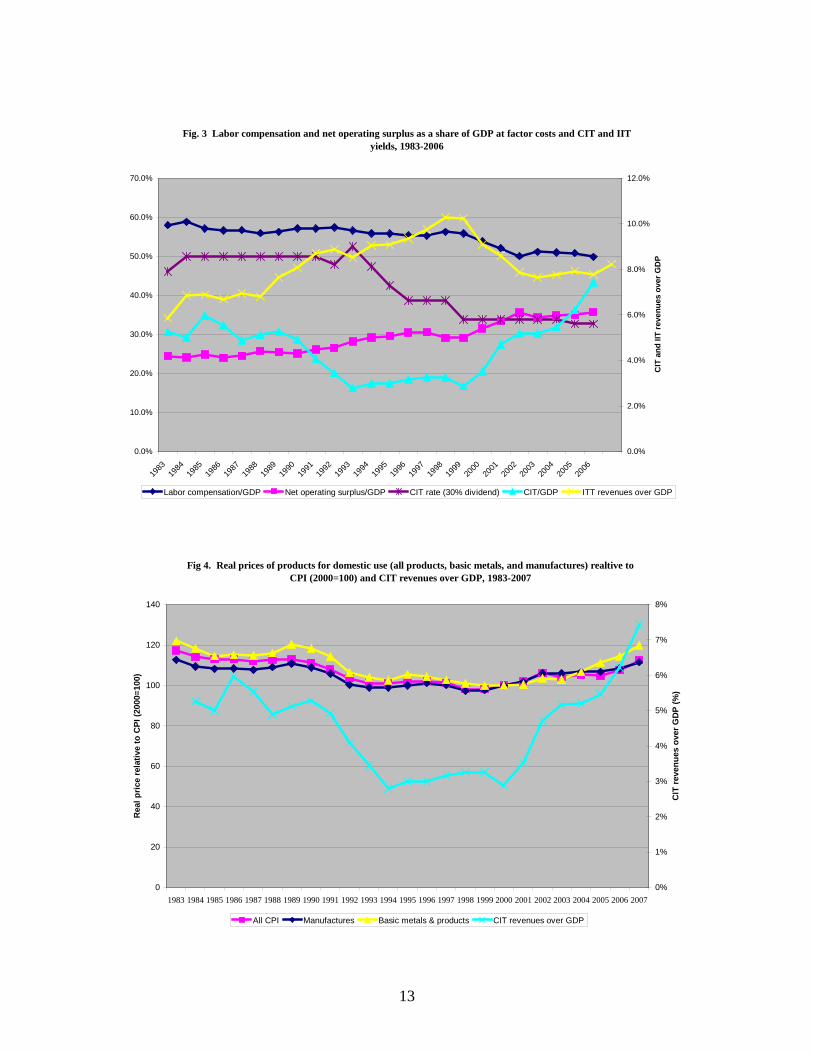
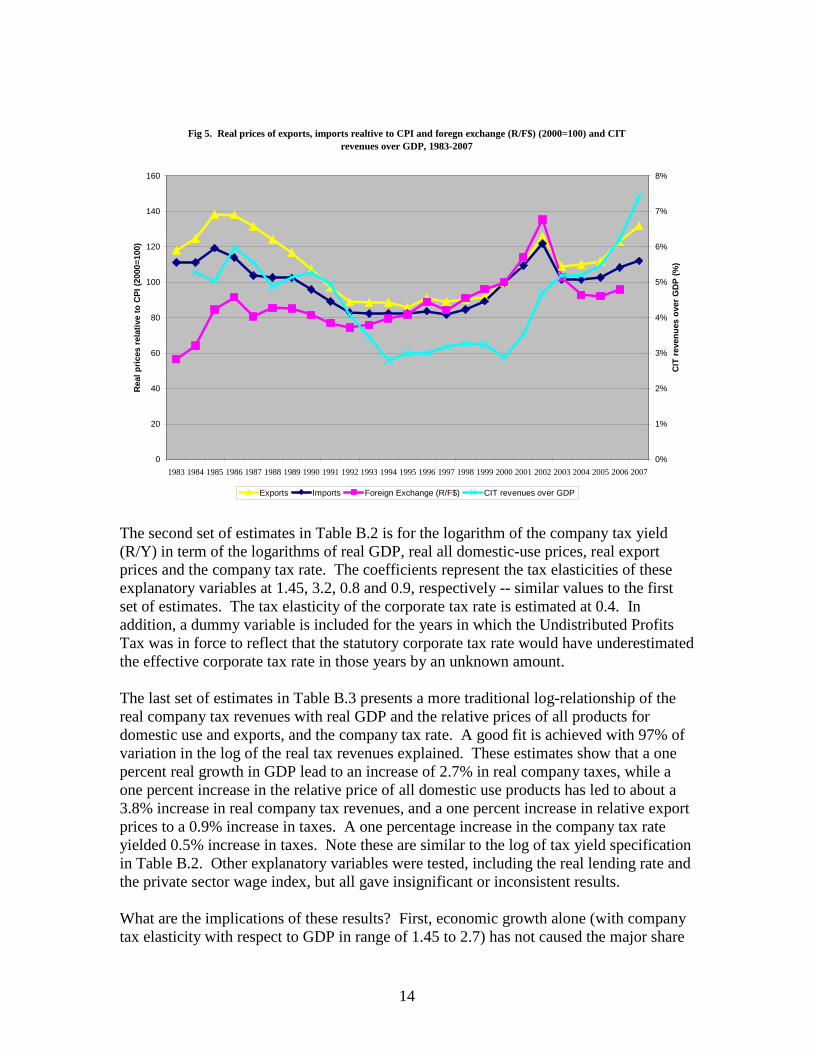
simple estimation of the company income tax against GDP alone yields an elasticity of 3.9 – clearly markedly above unity. While the company tax rate has not stayed constant over time (see Table 2), it has not changed enough to explain the fluctuations in company tax yields. In fact, Figure 3 illustrates that low company tax yields corresponded with high tax rates in a number of years. Hence, there is a need to explain the source of the large fluctuations in company tax base over time to explain the variations in the company tax yield. A starting point in seeking explanations is to review the changes in the distribution of value added in the South African economy over time. The GDP at factor costs can be divided into the share paid as labor compensation, the share to depreciation of the fixed capital assets used in production, and the remaining share referred to as net operating surplus that gets distributed between the debt financiers, the equity financiers and the government as taxes on profits and capital. Hence, if capital earns an increasing share of the gross value added, then the company tax base out of added GDP growth is expected to be growing. In fact, Figure 3 shows the net operating surplus as a share of GDP increasing from around 25% in 1983 to 30% in 1995 and then moving up again from 2000 through 2006 to reach about 35%. Net operating surplus or profit margins can increase for many reasons, including improvements in productivity, exchange devaluations, wage and interest rate declines, and product price increases. Real product price increases are clearly the most important of these as they affect the gross revenues out of which profits are earned. Figures 4 and 5 show a number of key product price indices relative to the CPI (2000 set at 100) in South Africa rising above the consumer price index (CPI) from 2000 onwards. These include the price indices for all products for domestic use, base metal products, manufactures, and importantly, the price index for exports of goods and services. This period of real price increases clearly corresponds with the period during which the company tax revenue yield increased sharply. Looking back in time, it is also clear that these indices also exceeded the CPI in the 1980s when the company tax yield was high before declining in the early 1990s. Interestingly, in the period 1998-2002, the devaluation of the Rand raised price of domestic tradables and, most importantly, the price of exports. As Figure 5 illustrates, however, the strengthening of the Rand13
13 The real exchange rate is measured here by the REER (2000=100) for South Africa from the IMF International Financial Statistics, but expressed in terms of Rand per foreign currency unit.
after 2002 is eventually offset by the major increases in world prices for a broad range of metal, mineral and agricultural products from 2004 onwards. In the estimations of the determinants of the corporate tax revenues presented here, the product price indices are expressed relative to the CPI to capture the fluctuations in the profit margins available to companies. For example, over the time period in this study, the price index for all domestic-use products relative to the CPI dropped from a high of 117 in 1983 to a low of 98 in 1998 and rose back to 113 by 2007. The base metal product price index relative to the CPI dropped from 122 in 1983 to 98 in 1997 before rising to 120 by 2007. Similarly, but more dramatically, the export price index relative to the CPI dropped from a high of 138 in 1985 to a low of 85 in 1995 before rising to 132 in 2007.

12
Financial year
Company tax rate
Surcharge/ Levy
Secondary Company
Tax
Tax with no profits
distributed
Tax on 30% of before
tax profits distributed
Tax on fully distributed
profitsTop MTR
in PIT1984 42% 10% 46.2% 46.2% 46.2% 50%1985 50% 50% 50% 50% 50%1986 50% 50% 50% 50% 50%1987 50% 50% 50% 50% 50%1988 50% 50% 50% 50% 45%1989 50% 50% 50% 50% 45%1990 50% 50% 50% 50% 45%1991 50% 50% 50% 50% 45%1992 50% 50% 50% 50% 44%1993 48% 48% 48% 48% 43%1994 48% 15% 48% 52.5% 55.8% 43%1995 35% 5% 25% 40% 47.5% 51.3% 43%1996 35% 25% 35% 42.5% 51.3% 45%1997 35% 13% 35% 38.8% 43.1% 45%1998 35% 13% 35% 38.8% 43.1% 45%1999 35% 13% 35% 38.8% 43.1% 45%2000 30% 13% 30% 33.8% 38.8% 45%2001 30% 13% 30% 33.8% 38.8% 42%2002 30% 13% 30% 33.8% 38.8% 42%2003 30% 13% 30% 33.8% 38.8% 40%2004 30% 13% 30% 33.8% 38.8% 40%2005 30% 13% 30% 33.8% 38.8% 40%2006 29% 13% 29% 32.8% 37.9% 40%2007 29% 13% 29% 32.8% 37.9% 40%2008 29% 10% 29% 32.0% 36.1% 40%2009 28% 10% 28% 31.0% 35.2% 40%
SCT coverted to final withholding tax in 2008/09. Undistributed Profits Tax excluded for 1980/81-1989/90
Table 2. Company tax rates on distributed profits, 1983/84-2008/09
Estimations of the determinants of company tax revenues over 1983/84-2006/07 are presented in Annex B. The first formulation (in Table B.1) estimates the company tax yield (R/Y) in terms of the net operating surplus share of GDP and the price indices of all products for domestic use and exports relative to the CPI, company tax rate14
14 Company tax rate is taken as tax rate including secondary company tax assuming 30% dividend distribution of before tax profits.
and either net operating surplus relative to GDP, or real GDP, or log of real GDP. These estimates have reasonably good fits (explaining about 87% to 95% of the variation in R/Y) and suggest that a one percentage point increase in the share of net operating surplus leads to a 0.2 percentage point increase in the company tax yield, and tax elasticities of real GDP relative to GDP of 1.5 to 1.7. The estimate of the tax elasticities of the real price of all domestic-use products is 2.5 and real export price is 0.8. In addition, a one percentage point in crease in the company tax rate increases tax revenue by about 0.5%.
13
Fig. 3 Labor compensation and net operating surplus as a share of GDP at factor costs and CIT and IIT yields, 1983-2006
0.0%
10.0%
20.0%
30.0%
40.0%
50.0%
60.0%
70.0%
1983
1984
1985
1986
1987
1988
1989
1990
1991
1992
1993
1994
1995
1996
1997
1998
1999
2000
2001
2002
2003
2004
2005
2006
0.0%
2.0%
4.0%
6.0%
8.0%
10.0%
12.0%
CIT
and
IIT
reve
nues
ove
r GD
P
Labor compensation/GDP Net operating surplus/GDP CIT rate (30% dividend) CIT/GDP ITT revenues over GDP
Fig 4. Real prices of products for domestic use (all products, basic metals, and manufactures) realtive to CPI (2000=100) and CIT revenues over GDP, 1983-2007
0
20
40
60
80
100
120
140
1983 1984 1985 1986 1987 1988 1989 1990 1991 1992 1993 1994 1995 1996 1997 1998 1999 2000 2001 2002 2003 2004 2005 2006 2007
Rea
l pric
e re
lativ
e to
CPI
(200
0=10
0)
0%
1%
2%
3%
4%
5%
6%
7%
8%
CIT
reve
nues
ove
r GD
P (%
)
All CPI Manufactures Basic metals & products CIT revenues over GDP
14
Fig 5. Real prices of exports, imports realtive to CPI and foregn exchange (R/F$) (2000=100) and CIT revenues over GDP, 1983-2007
0
20
40
60
80
100
120
140
160
1983 1984 1985 1986 1987 1988 1989 1990 1991 1992 1993 1994 1995 1996 1997 1998 1999 2000 2001 2002 2003 2004 2005 2006 2007
Rea
l pric
es re
lativ
e to
CPI
(200
0=10
0)
0%
1%
2%
3%
4%
5%
6%
7%
8%
CIT
reve
nues
ove
r GD
P (%
)
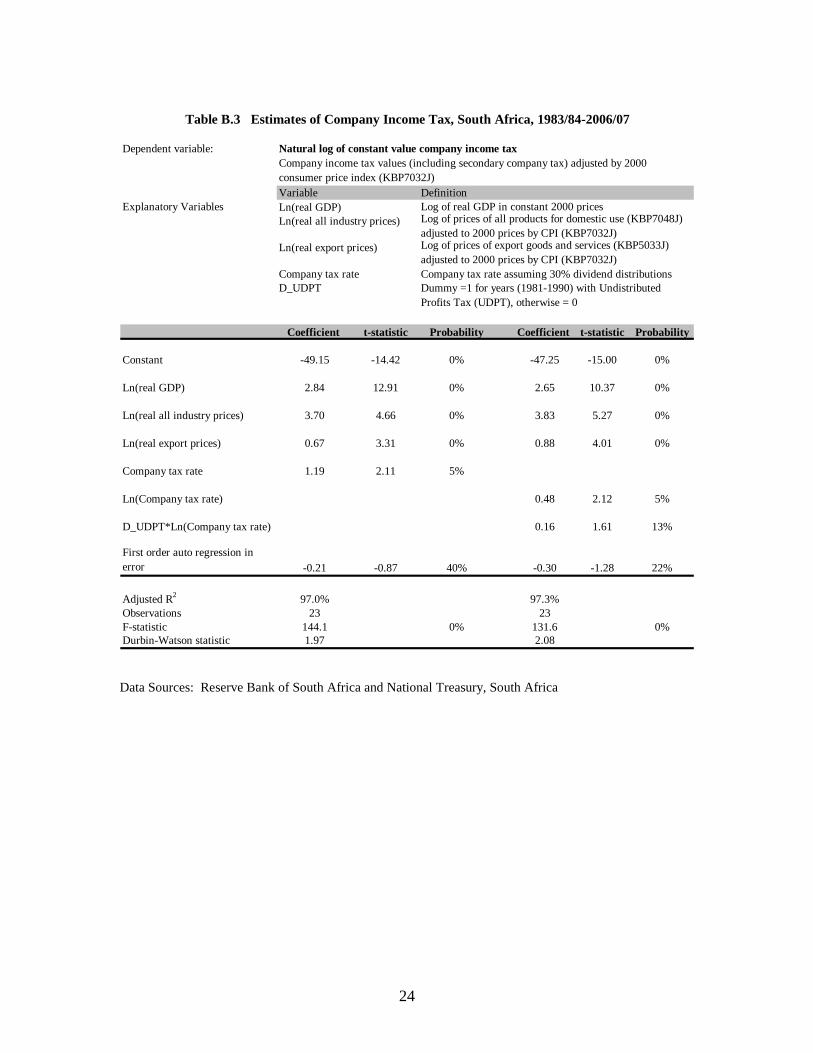
Exports Imports Foreign Exchange (R/F$) CIT revenues over GDP The second set of estimates in Table B.2 is for the logarithm of the company tax yield (R/Y) in term of the logarithms of real GDP, real all domestic-use prices, real export prices and the company tax rate. The coefficients represent the tax elasticities of these explanatory variables at 1.45, 3.2, 0.8 and 0.9, respectively -- similar values to the first set of estimates. The tax elasticity of the corporate tax rate is estimated at 0.4. In addition, a dummy variable is included for the years in which the Undistributed Profits Tax was in force to reflect that the statutory corporate tax rate would have underestimated the effective corporate tax rate in those years by an unknown amount. The last set of estimates in Table B.3 presents a more traditional log-relationship of the real company tax revenues with real GDP and the relative prices of all products for domestic use and exports, and the company tax rate. A good fit is achieved with 97% of variation in the log of the real tax revenues explained. These estimates show that a one percent real growth in GDP lead to an increase of 2.7% in real company taxes, while a one percent increase in the relative price of all domestic use products has led to about a 3.8% increase in real company tax revenues, and a one percent increase in relative export prices to a 0.9% increase in taxes. A one percentage increase in the company tax rate yielded 0.5% increase in taxes. Note these are similar to the log of tax yield specification in Table B.2. Other explanatory variables were tested, including the real lending rate and the private sector wage index, but all gave insignificant or inconsistent results. What are the implications of these results? First, economic growth alone (with company tax elasticity with respect to GDP in range of 1.45 to 2.7) has not caused the major share
15
of the increase in the company tax yield, especially with the offsetting effects of a decline in the company tax rate. From 2000 to date, real growth offset by tax rate cuts would explain about a one percentage point increase in the company tax yield from 3% to 4%. Second, the tax elasticity of about 3.8 for domestic product prices and 0.9 for real export prices is consistent with the observed fluctuations in the company tax yield about the average of about 4.5% of GDP over the 25 year period under study. For example, a 10% increase in the relative price index for all domestic use products would raise the company tax yield by 38% and a 30% increase in the relative export price index would increase it by 27%. The combined effect would be a corporate tax yield of 7.8% of GDP, which is consistent with actual outcomes. While the elasticity of corporate taxes with respect to the corporate tax rate is expected to be less than one (possibly around 0.8) because of the changes in the tax base caused by changes in the after-tax returns, 0.5 is somewhat lower than expected. At the same time the elasticity with respect to real GDP in the range of 1.45 up to 2.7 is considerably higher than expected. This high real GDP elasticity may reflect changes in the sector mix as the economy has been growing with a shift to the tertiary sectors at the expense of the primary and secondary sectors. More detailed sector tax studies may show that these rapidly growing tertiary sectors such as finance and telecommunications are yielding higher company profits and are possibly qualifying for relatively fewer tax breaks than manufacturing and mining, and hence, are increasing the overall effective tax rate of the company tax that, in turn, would raise the effective tax elasticity of real GDP above one. Other factors can add to the volatility of corporate taxes. These include the effects of loss carry forwards and accelerated depreciation. After an extended period of high profitability, the stock of loss carry forwards by companies tends to get run down exposing an increasing share of current profits to tax. This tends to make corporate taxes more pro-cyclical. Accelerated depreciation or other investment incentives tend to work in the opposite direction if growth is investment driven. The recent growth period in South Africa, however, was not characterized by increased private investment rates until more recently. In fact, over 1991-2003, gross fixed capital formation by private businesses remained close to its average of 11.2% of GDP without ever exceeding 12%. Since then, it has grown to 13.7% of GDP in 2006, and Budget estimates and forecasts suggest that the investment rate will continue to rise in the medium term. This can result in taxable income being eroded by higher accelerated tax depreciation allowances resulting in declining company tax yields. Access to detailed tax records, however, would be required to confirm the extent of these tax deduction timing effects on revenue yields. Looking forward, how long will South Africa enjoy the “product price bonus” in its company taxes? While world commodity prices boomed over 2005-2007, commodity prices outside of fuels are expected to moderate or even decline, particularly if the United States economic slow down has any strong contagious effects.15
15 IMF Economic Outlook, October 2007, in Table A.17 forecasts prices in US dollars of manufactures to rise at annual rates of 2.8% in 2008 and 1.7% over 2009-2012 and prices of non-fuel primary commodities to decline at annual rates of 6.7% in 2008 and 6.8% in 2009-2012.
At the same time, there
16
can be expected to be some cost catch up as input costs rise, the depreciation base expands, and labor competes for some of the higher surplus currently accruing to capital. The path of the real exchange rate will also have a significant effect on profit margins in the tradable sectors. Any significant real appreciation of the Rand will serve to reduce the “product price bonus,” or alternatively, depreciation of the Rand could sustain it at least partially. From the discussion so far it would seem that much of the explanation of company tax performance relates to changes in economic structures rather than tax policy changes, or at least the changes in real product prices have dominated the changes in company tax rates. While the changes in the tax structure have been significant over the years, as illustrated in Table 2, it has only been since 1999/2000 that the tax rate on undistributed profits has dropped below one-third and the combined tax on distributed and undistributed profits has been on a consistent downward trend. This has also been the period of rapidly rising real product prices that has masked the effects of these tax changes on revenues and investment. At the same time, it does not appear that the higher growth rates experienced since 2000 are driven by any marked acceleration in investment until the past few years. Investor confidence does take time to adjust to new economic realities. It is not clear whether the consistent lower and falling company tax rates have elicited some of this increased investment. In a highly competitive global economy, the competition to attract and retain capital has become an ongoing and possibly escalating battle as capital markets have emerged and merged making capital mobility a more common reality in an increasing number of countries. The issue of whether South Africa has taken its company tax rate low enough still appears to be an open question. The international comparison of corporate tax rates is not a simple matter as the effective rate charged on corporate income typically varies according to the ownership of the corporation and how corporate income is paid out to the owners, aside from the numerous effects arising from accounting conventions, inflation and investment tax incentives. The first major division in ownership comes between widely held corporations (typically with publicly traded shares) and closely held corporations (often not traded and family owned and possibly also managed). The second major division occurs between foreign and domestically owned corporations. These divisions focus on two of the major responses of owners to corporate (or broadly investment) income taxation. The first is the ability of owner-managers to arbitrage tax rate differences between the personal and corporate taxes depending upon how corporate income is earned by them. The second is the expected high responsiveness of investors to differences in net-of-tax rates of return across countries – either domestic investors looking to invest in foreign host countries rather than domestically, or foreign investors deciding whether to expand investment in different host countries. Most simple international comparisons focus only on the statutory company or corporate tax rate charged on profits at the company level. International competition for investment has put downward pressure on corporate tax rates since the 1980s. One study of a large sample of countries showed the average central government statutory corporate tax rate dropping from 39.6% (+/- standard deviation of 10.9%) in 1980 to 32.7% (+/- standard
17
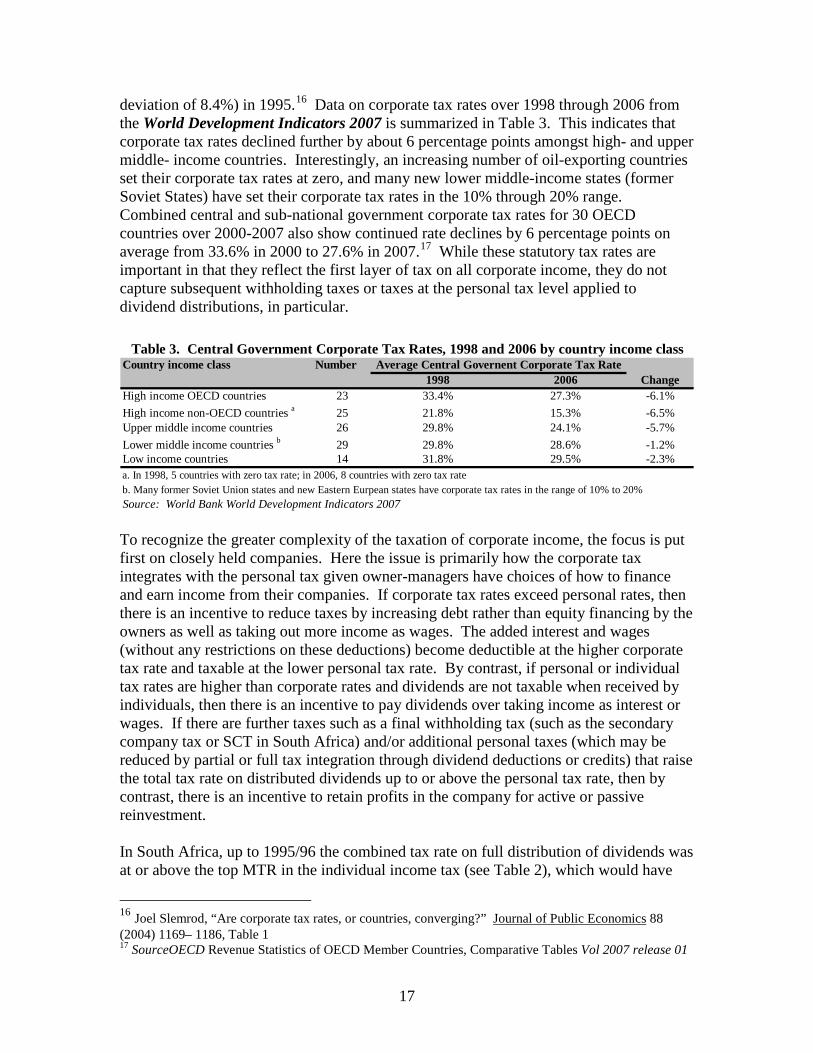
deviation of 8.4%) in 1995.16 Data on corporate tax rates over 1998 through 2006 from the World Development Indicators 2007 is summarized in Table 3. This indicates that corporate tax rates declined further by about 6 percentage points amongst high- and upper middle- income countries. Interestingly, an increasing number of oil-exporting countries set their corporate tax rates at zero, and many new lower middle-income states (former Soviet States) have set their corporate tax rates in the 10% through 20% range. Combined central and sub-national government corporate tax rates for 30 OECD countries over 2000-2007 also show continued rate declines by 6 percentage points on average from 33.6% in 2000 to 27.6% in 2007.17
While these statutory tax rates are important in that they reflect the first layer of tax on all corporate income, they do not capture subsequent withholding taxes or taxes at the personal tax level applied to dividend distributions, in particular.
Country income class Number1998 2006 Change
High income OECD countries 23 33.4% 27.3% -6.1%High income non-OECD countries a 25 21.8% 15.3% -6.5%Upper middle income countries 26 29.8% 24.1% -5.7%Lower middle income countries b 29 29.8% 28.6% -1.2%Low income countries 14 31.8% 29.5% -2.3%
Table 3. Central Government Corporate Tax Rates, 1998 and 2006 by country income classAverage Central Governent Corporate Tax Rate
a. In 1998, 5 countries with zero tax rate; in 2006, 8 countries with zero tax rateb. Many former Soviet Union states and new Eastern Eurpean states have corporate tax rates in the range of 10% to 20%Source: World Bank World Development Indicators 2007 To recognize the greater complexity of the taxation of corporate income, the focus is put first on closely held companies. Here the issue is primarily how the corporate tax integrates with the personal tax given owner-managers have choices of how to finance and earn income from their companies. If corporate tax rates exceed personal rates, then there is an incentive to reduce taxes by increasing debt rather than equity financing by the owners as well as taking out more income as wages. The added interest and wages (without any restrictions on these deductions) become deductible at the higher corporate tax rate and taxable at the lower personal tax rate. By contrast, if personal or individual tax rates are higher than corporate rates and dividends are not taxable when received by individuals, then there is an incentive to pay dividends over taking income as interest or wages. If there are further taxes such as a final withholding tax (such as the secondary company tax or SCT in South Africa) and/or additional personal taxes (which may be reduced by partial or full tax integration through dividend deductions or credits) that raise the total tax rate on distributed dividends up to or above the personal tax rate, then by contrast, there is an incentive to retain profits in the company for active or passive reinvestment. In South Africa, up to 1995/96 the combined tax rate on full distribution of dividends was at or above the top MTR in the individual income tax (see Table 2), which would have
16 Joel Slemrod, “Are corporate tax rates, or countries, converging?” Journal of Public Economics 88 (2004) 1169– 1186, Table 1 17 SourceOECD Revenue Statistics of OECD Member Countries, Comparative Tables Vol 2007 release 01
18
discouraged dividend distributions, whereas since then there has been a widening gap between the top MTR and the combined tax on full distributions, which would tend to encourage dividend distributions as appears to be evident from the growth in the SCT yield shown in Table 1.B above. Currently, there is scope for raising the SCT to close this gap. There is no incentive, however, for using wages and interest to move income out of a large company as the tax rate on retained profits has been lower than the top MTR except from 1987/88 through 1993/94. A review of current OECD country tax treatment of distributed company profits shows no consistent pattern. When the final withholding taxes (in the case of seven of the thirty OECD countries) and the personal income taxes (adjusted for any tax integration provisions) are combined and compared with the top MTRs on personal income, it is found that 11 countries have combined tax rates on dividends that are at or above their top MTRs, and the remaining 19 have lower combined tax rates. South Africa also offers a closely-held small business, if it has a turnover below R14 million, the option of paying tax as a Small Business Corporation at rates rising from 0% on the first R46,000 of taxable income, 10% on the next amounts up to R300,000, and 28% on amounts above R300,000 plus the 10% SCT on distributed dividends. This gives small businesses the same top tax rates as other companies. They are also in a more favorable tax position than operating as unincorporated businesses. One exception is personal service business which has to incorporate as an Employment Company facing a flat tax rate of 33.3% and 10% SCT. This puts their combined tax rate on dividend distributions at 39.7% (essentially equal to the top MTR of 40%). This situation for small businesses could be simplified by following the tax integration approach used in the United States which allows closely held businesses to set up as S-Corporations, Limited Liability Companies (LLCs) or Limited Liability Partnerships (LLPs) all of which report their profits at the personal level (without any company taxation). This gives the business perfect tax integration, and at the same time, affords them the benefits of limited liability. The taxation for small closely held companies, therefore, could be combined and simplified without any limit to turnover. This can be achieved either by the income of Small Business Corporations being reported as personal income (it would get the same tax treatment as other individual income) or by setting the tax rates of these companies to rise in line with the personal brackets, but adjusted for the STC.18
18 The small corporation marginal tax rate, tsc = (tp –STC)/(1-STC) where STC is the STC rate (currently 10%) and tp is the marginal personal tax rate. Companies could be offered the option t pay the lower of the company tax rate (28%) or the taxes arising from paying taxes at the rates tsc on income in the PIT brackets plus STC on distributed profits.
This latter approach would result in the marginal small business tax rates rising from 0% to 33.3% following the same bracket structure as the personal tax rate. If the regular company tax is less than 33.3%, as it currently is at a flat 28%, then, as the profitability of the company grows, its average tax rate would gradually rise to 28% and
19
it could convert to filing as a regular company or be given the option of paying the lesser of the scheduler rates or a flat 28%.19
Widely held companies are the other major ownership type. In this case, ownership may be held by insurance funds, pension funds, non-government organizations, trusts, domestic individuals and foreign persons. Such widely held companies typically have to pay the going market rates of return, net-of-taxes at the company level, to attract investment capital. For most countries the marginal supply of capital that sets the market rate is net foreign savings by domestic savers repatriating capital or foreign savers increasing their investments. Such market returns effectively separate the investor or user of capital from the saver or supplier of capital such that the tax treatment of the two can be analyzed separately. Hence, in viewing the incentives of foreign investor it is sufficient to look at the company tax rate plus the withholding or other taxes charged on distributions to non-residents. If domestic private savings are taken as relatively fixed, then a combination of government and net foreign savings tends to determine investment and growth. If an economy is open with low country risk and faces a fixed prices of capital funds, but relatively unlimited supply of foreign savings, then competing for capital through lowering tax rates relative to capital-source countries should expand investment significantly. The ultimate impact of such expanded investment, given a fixed price of capital, accrues to labor as the capital intensity of the economy increases while capital owners earn the fixed return. This insight has led many countries to lower their first layer corporate tax rates on undistributed profits below their top MTRs and often below the company tax rates of competing countries.20
At the same time, care has to be taken to ensure that lower host country taxes do not merely result in added taxes going to the home country treasury through the taxation of world-wide income by the home country at a higher tax rate. Lowering a host country tax rate down to the level of the home country, however, does not risk such pointless revenue transfers and can gain the benefits of expanded investment through induced foreign investment. Part of the issue, therefore, is knowing the tax structures of the home or capital-source countries of foreign investors as well as how responsive they are to changes in host country investment returns. This includes whether the host country profits are only taxed when repatriated as dividends or whether the full current accrued income becomes taxable. As long as the former is the case, the host country can lower its first layer of corporate tax while setting withholding taxes to capture the difference between this host and home country rates on repatriated dividends (in the same way it can equalize taxes on domestic dividends with the personal marginal tax rate.) The lower first layer corporate tax rate should at a least encourage a business to reinvest its profits rather than repatriate them, thereby expanding investment in the host country.
19 With current personal marginal tax rates and awarding the small business primary tax rebate, the switchover would happen at about R1.25 million or at a before-tax profit margin of 20%, a turnover of R6.25 million. 20 See for example, Alberto Barreix and Jerónimo Roca, “Strengthening a fiscal pillar: the Uruguayan dual income tax”, Cepal Review, No. 92, August 2007

20
The following are some examples of countries with low central government corporate tax rates (below 30%): Switzerland, 8.5% (21.32%)21; Cyprus, Paraguay and Serbia, 10%; Macao, Oman, Uruguay and Uzbekistan, 12%; Ireland, 12.5%; Latvia, 15%; Romania, 16%; Hungary, 16% (20%)22; Chile 17%; Hong Kong 17.5%; Iceland, 18%; Poland and Slovak Republic, 19%; Cambodia, Croatia, Georgia, Hungary, and Turkey, 20%; Canada, 22.1% (36.1%)20; Estonia, 23%; Czech Republic, 24% (36.8%)23
; China, Denmark, Ghana, and Mauritius, 25%; Korea, 25% (27.5%)20; Germany 25% (38.9%)20, 21; Austria, 25% (43.8%)22; Netherlands (25.5%); Finland (26%); and Mexico, Norway and Sweden, 28%. Some of these countries such as Hong Kong, Ireland and Mauritius have followed low corporate tax rate policies for time with some success. Many others have only recently restructured their rates and which of them will be relatively more successful in attracting capital investment remains to be ascertained. Some have added sub-national taxes or surtaxes that raise their rates significantly, and others, like South Africa, have final secondary or withholding taxes on distributed dividends. The remainder merely has low tax rates at the corporate level.
While South Africa has seen some moderately good growth over recent years, it has not benefited from any marked increase in investment rates to increase its growth rates from 4-5% to 6-7% in order to absorb the still high number of unemployed and continue to raise real wage rates. Further lowering of the company tax rate from its current rate of 28% to meet the ever growing tax competition for investment, while increasing the SCT rate or withholding tax rates on distributed dividends, should contribute to investment promotion. South Africa still has some room to increase rates on the SCT, VAT and excise duties to enhance its revenues, though it clearly faces some fiscal risks through company tax yields declining and rising social security expenditures. It can expect to gradually loose the company tax revenue bubble it has enjoyed from high real product prices and also will need to finance growing demands for expanded social security benefits.
21 Combined central and sub-national corporate tax rate 22 Combined corporate tax and surtax 23 Including final withholding tax on distributed dividends.
21
Annex A
Estimation of Individual Tax Revenues
Dependent variable:
Variable DefinitionExplanatory Variables Ln(GDP)
Ln(Real wage rate)
Top MTR
Coefficient t-statistic Probability
Constant -0.2902 -0.0665 95%
Ln(GDP) 0.5048 1.2463 23%
Ln(Real wage rate) 0.8855 2.1772 4%
Top MTR 1.5211 1.9779 6%
First order auto regression in error 0.8001 9.6227 0%
Adjusted R2 97.3%Observations 23F-statistic 200.4 0%Durbin-Watson statistic 1.48
Table A. Estimates of Individual Income Tax, South Africa, 1983/84-2006/07
Log of total remuneration per worker (KBP7013J)
Top marginal tax rate in personal income tax (%)
Log of real GDP in constant 2000 prices
Natural log of constant value individual income tax Individual income tax values adjusted by 2000 consumer price index
Data Sources: Reserve Bank of South Africa and National Treasury, South Africa

22
Annex B
Estimation of Company Tax Revenues
Dependent variable:
Variable DefinitionExplanatory Variables
Coefficient t-statistic Probability Coefficient t-statistic Probability Coefficient t-statistic Probability
Constant -0.1786 -3.04 1% -0.1956 -8.51 0% -1.2090 -9.15 0%
NOS/GDP 0.1658 3.38 0%
Real GDP 8.2100E-08 7.85 0%
Ln(Real GDP) 0.07867 8.24 0%
Real all industry prices 0.00134 2.24 4% 0.00106 3.23 0% 0.00109 3.65 0%
Real export prices 0.00031 2.04 6% 0.00031 3.87 0% 0.00033 4.43 0%
Company tax rate 0.0569 2.39 3% 0.0685 2.92 1%
First order auto regression in error 0.4922 1.89 7% 0.0025 0.01 99% -0.1988 -0.87 40%
Adjusted R2 87.2% 95.3% 92.9%Observations 23 23 23F-statistic 38.6 0% 89.7 0% 72.9 0%Durbin-Watson statistic 1.83 2.42 1.87
Real GDP 1.54 1.74Real all industry prices 2.50 2.57Real export prices 0.75 0.79Company tax rate 0.53 0.64
Company tax rate assuming 30% dividend distributions
Elasticities of company tax revenue with respect to explanatory variables (calculated at sample average values)
Company tax rate
Company income tax values (including secondary company tax) over GDP at current market prices
Net operating surplus (KBP6001J) over GDP (%)
Table B.1 Estimates of Company Income Tax as a share of GDP, South Africa, 198384-2006/07
Company income tax over GDP (%)
NOS/GDP
Real all industry pricesReal GDP in constant 2000 pricesPrice index of all products for domestic use (KBP7048J) adjusted to 2000 prices by CPI (KBP7032J)
Real export prices Price index of export goods and services (KBP5033J) adjusted to 2000 prices by CPI (KBP7032J)
Real GDP
Data Sources: Reserve Bank of South Africa and National Treasury, South Africa

23
Dependent variable:
Variable DefinitionExplanatory Variables
Coefficient t-statistic Probability Coefficient t-statistic Probability
Constant -41.67 -14.88 0% -40.14 -14.95 0%
Ln(real GDP) 1.45 8.13 0% 1.30 5.93 0%
Ln(real all industry prices) 3.16 4.98 0% 3.27 5.38 0%
Ln(real export prices) 0.76 4.71 0% 0.92 4.98 0%
Company tax rate 0.94 2.08 5%
Ln(Company tax rate) 0.37 1.96 7%
D_UDPT*Ln(Company tax rate) 0.12 1.41 18%
First order auto regression in error -0.33 -1.46 16% -0.40 -1.77 10%
Adjusted R2 95.5% 95.7%Observations 23 23F-statistic 94.6 0% 83.6 0%Durbin-Watson statistic 2.02 2.11
D_UDPT Dummy =1 for years (1981-1990) with Undistributed Profits Tax (UDPT), otherwise = 0
Table B.2 Estimates of Company Income Tax over GDP, South Africa, 1983/84-2006/07
Natural log of company income tax over GDP (%)Company income tax values (including secondary company tax) over GDP at current market prices
Log of real GDP in constant 2000 pricesLn(real GDP)
Company tax rate Company tax rate assuming 30% dividend distributions
Ln(real all industry prices)
Ln(real export prices)
Log of prices of all products for domestic use (KBP7048J) adjusted to 2000 prices by CPI (KBP7032J)Log of prices of export goods and services (KBP5033J) adjusted to 2000 prices by CPI (KBP7032J)
Data Sources: Reserve Bank of South Africa and National Treasury, South Africa
24
Dependent variable:
Variable DefinitionExplanatory Variables
Coefficient t-statistic Probability Coefficient t-statistic Probability
Constant -49.15 -14.42 0% -47.25 -15.00 0%
Ln(real GDP) 2.84 12.91 0% 2.65 10.37 0%
Ln(real all industry prices) 3.70 4.66 0% 3.83 5.27 0%
Ln(real export prices) 0.67 3.31 0% 0.88 4.01 0%
Company tax rate 1.19 2.11 5%
Ln(Company tax rate) 0.48 2.12 5%
D_UDPT*Ln(Company tax rate) 0.16 1.61 13%
First order auto regression in error -0.21 -0.87 40% -0.30 -1.28 22%
Adjusted R2 97.0% 97.3%Observations 23 23F-statistic 144.1 0% 131.6 0%Durbin-Watson statistic 1.97 2.08
Ln(real all industry prices)
D_UDPT Dummy =1 for years (1981-1990) with Undistributed Profits Tax (UDPT), otherwise = 0
Log of prices of all products for domestic use (KBP7048J) adjusted to 2000 prices by CPI (KBP7032J)
Company tax rate Company tax rate assuming 30% dividend distributions
Table B.3 Estimates of Company Income Tax, South Africa, 1983/84-2006/07
Natural log of constant value company income tax Company income tax values (including secondary company tax) adjusted by 2000 consumer price index (KBP7032J)
Ln(real GDP) Log of real GDP in constant 2000 prices
Ln(real export prices) Log of prices of export goods and services (KBP5033J) adjusted to 2000 prices by CPI (KBP7032J)
Data Sources: Reserve Bank of South Africa and National Treasury, South Africa