Embed Size (px)
DESCRIPTION
South African Micro-finance Apex Fund sa maf ANNUAL REPORT 2011/12. Presentation Outline. Mandate , Vision, Mission , Values & Objectives Operating Model 2011/2012 Performance Highlights samaf National Footprint 2011/12 Financial Performance Auditor General Report Way forward. - PowerPoint PPT Presentation
Citation preview
South African Micro-finance Apex FundSouth African Micro-finance Apex Fund sasamafmaf
ANNUAL REPORTANNUAL REPORT
2011/122011/12
1

Presentation OutlinePresentation OutlineMandate, Vision, Mission, Values & Objectives
Operating Model
2011/2012 Performance Highlights
samaf National Footprint
2011/12 Financial Performance
Auditor General Report
Way forward
2

MandateMandatesamaf’s mandate is to create work opportunities and sustainable livelihoods through the facilitation and provision of affordable access to finance to micro, small and survivalist businesses for the purpose of growing their income and asset bases. It is also required to act as a catalyst in the development of a vibrant micro-finance industry in South Africa. The primary purpose is:
To facilitate the provision of affordable access to finance by micro and survivalist
businesses;
To extend financial and non-financial services to reach deeper and broader into the
rural areas, informal settlement and peri-urban settlement of South Africa;
To contribute towards the reduction of poverty and unemployment;
To build a strong, effective and efficient wholesale (Apex) Fund;
To contribute to better quality of life; and
To contribute towards a sustainable and vibrant micro financial industry in South
Africa.
3

Vision & MissionVision & MissionMission
“To be a leader in developmental micro finance” (in South Africa)
To provide developmental finance and non-financial services to financial intermediaries through:
Mobilization of financial intermediaries
Wholesaling of funds
Development of institutional capacity
Lobbying and advocacy towards policy development
Development of valuable partnerships (between government , businesses and communities)
Vision
4

Values & ObjectivesValues & Objectives1. Contribution to poverty alleviation goals through; Funding Intermediaries( Enterprise loans and poverty
alleviation loans) Capacitating Financial Intermediaries Regulation and Prudential Standards2. Exceed our stake holder expectation through;
Improving outreach through expanded satellite network / offices
Improving internal turnaround standards3. Improvement of processes to achieve service delivery
excellence through; Improving financial reporting and management Strengthening risk management Increased compliance of legal and other regulations
4. Leverage performance through capacity and people through;
Organisational Development Balance Scorecard & Performance Management Organisational Design & Change Management
5. Building sustainable Apex Fund Improved quality of lending portfolio and internal
control environment
ObjectivesValuesIntegrity: Dealing with staff and stakeholders in an
honest and ethical manner.
Transparency – ensuring compliance with best
practice on the dissemination and sharing of
information with all stakeholders and consulting
with them to ensure comprehensiveness and
buy-in to samaf activities.
Professionalism: adhere to specific defined
norms and setting standards of workmanship,
respect and communication.
Accountability: taking responsibility for the
decisions and actions, including allocation of
powers and duties.
High Performance: excellent performance and
satisfied customers that guarantee long term
sustainability of the South African Micro-Finance
Apex Fund.
5

samaf Operating Modelsamaf Operating Model
IT
FIN
SC
HR
FI’s
SAMAF
Internal Audit
ExternalInternal
CB
EducationSelectionResearch
Primary / CoreSupport
MARKET
External
EDD
REG
PR & COMS
6

Disbursements of R58.3m were made to FI’s in respect of loans and grants.
14 Micro Finance Institutions, 23 Financial Services Cooperatives and 24 stokvels were
supported.The total number of borrowers increased by 53% from 40 726 to 62 459.
68% of loans by the FI to end users were in rural communities and 93%
were micro-enterprise loans.
The number of end user savings increased by 15 % from 31 129 to 35 719
Installment repayments by FIs average 95%
272 individuals from 68 institutions nationally participated in capacity building
workshops.
samaf received an unqualified audit report
2011/12 Performance Highlights2011/12 Performance Highlights
77

Approved Funding (R’m)Approved Funding (R’m)
An increase of 21% as compared to the previous financial year was achieved
8
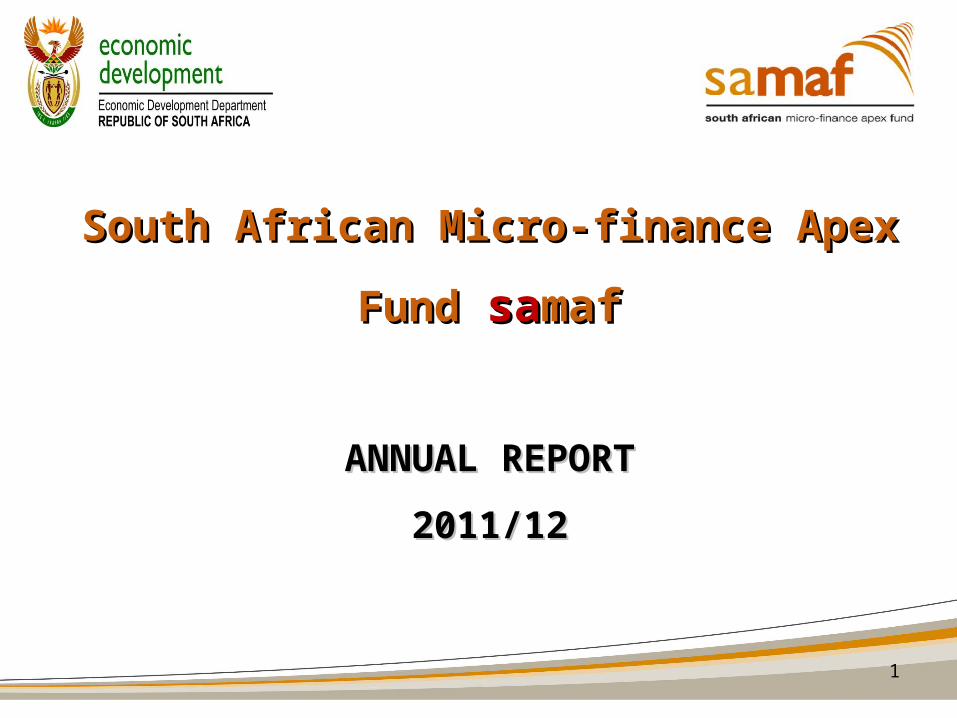
Total Disbursements (R’m)Total Disbursements (R’m)
Capacity building decreased
by 32% as compared to the
previous financial year
On lending funds increased
by 104% as compared to
the previous financial year
9
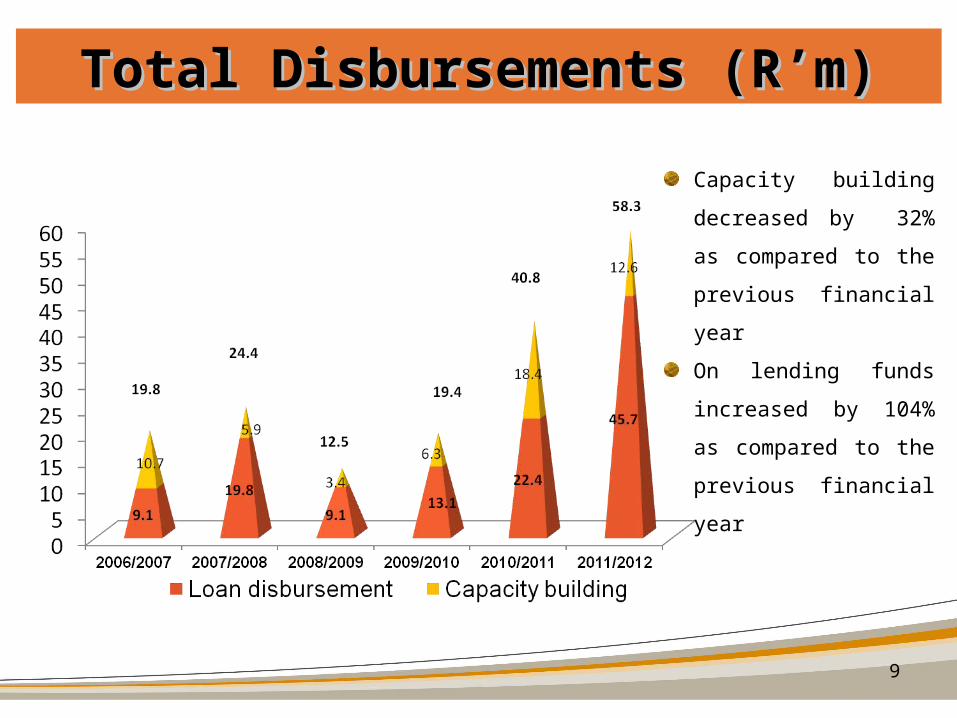
On- lending per Province (R)On- lending per Province (R)
10
Provinces On-lendingEC R2,500,000NC R 0WC R 5,000,000MP R 1,812,500NW R 2,095,000LP R 22,450,000GP R 5,686,340FS R 0KZN R 6,099,168
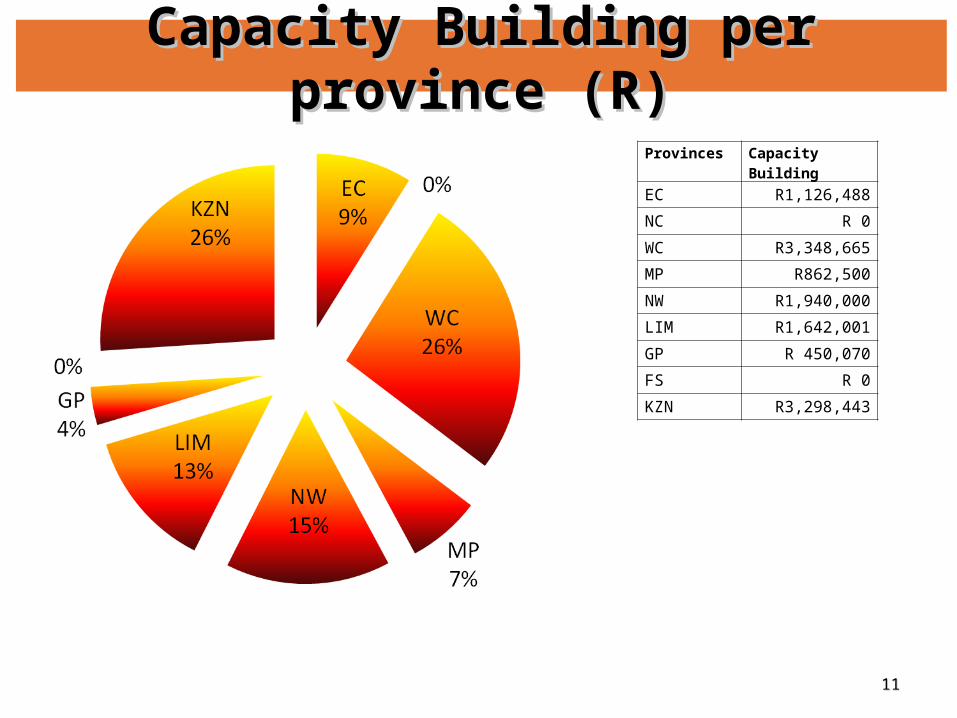
Capacity Building per province (R)Capacity Building per province (R)
1111
Provinces Capacity Building
EC R1,126,488
NC R 0
WC R3,348,665
MP R862,500
NW R1,940,000
LIM R1,642,001
GP R 450,070
FS R 0
KZN R3,298,443

samaf NATIONAL FOOTPRINTsamaf NATIONAL FOOTPRINTM=4F=4
M=0F=4
M=0F=3
M=1F=6
M=0F=5
M=2F=6
M=3F=3
M=2F=1
M=3F=5
1212
M= Micro Finance Institutions
F= Financial Services Co-operatives

2010/11 Financial Performance2010/11 Financial PerformanceStatement of Comprehensive Income
13
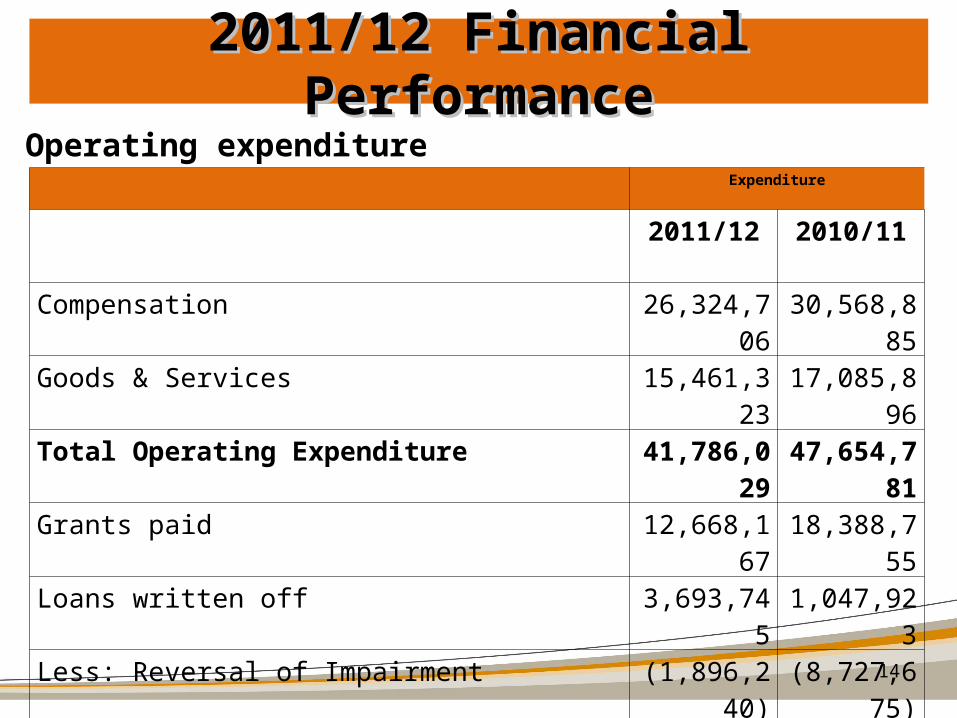
2011/12 Financial Performance2011/12 Financial Performance
Expenditure
2011/12 2010/11
Compensation 26,324,706 30,568,885
Goods & Services 15,461,323 17,085,896
Total Operating Expenditure 41,786,029 47,654,781
Grants paid 12,668,167 18,388,755
Loans written off 3,693,745 1,047,923
Less: Reversal of Impairment (1,896,240) (8,727,675)
Total Expenditure 56,251,701 58,363,784
Operating expenditure
14
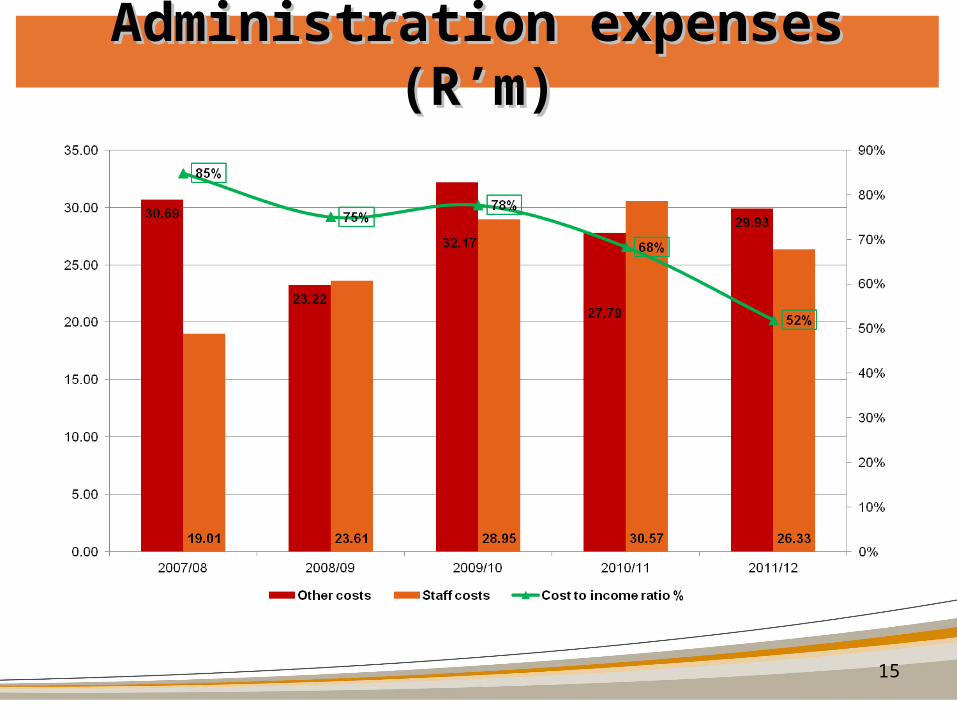
Administration expenses (R’m)Administration expenses (R’m)
15
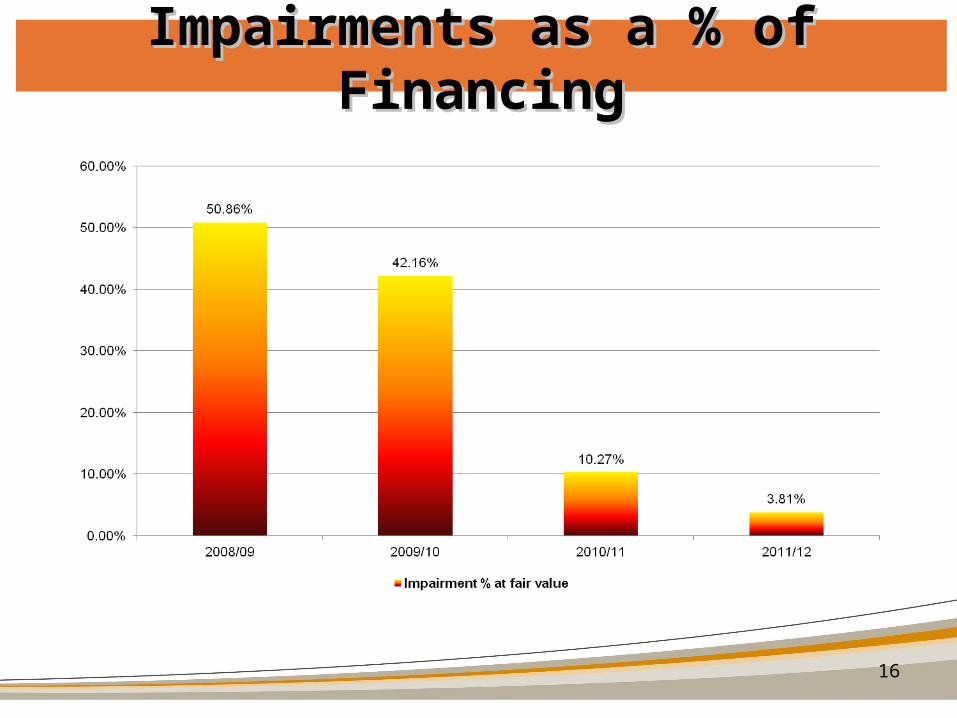
Impairments as a % of FinancingImpairments as a % of Financing
16

Assets for the last 5 years (R’m)Assets for the last 5 years (R’m)
17

Auditor General ReportAuditor General ReportOPINION
An unqualified opinion was expressed, however issues were raised as part of emphasis of
matter.
EMPHASIS OF MATTER
Going concern
The Economic Development Department is re-organising its small lending business
institutions by merging samaf, Khula and small business activities of the Industrial
Development Corporation (IDC).
Material write-off and Impairments
Material losses to the amount of R 3 693 745 were incurred as a result of the write off of
loans provided to financial intermediaries.
In addition, material impairments to the amount R 2 899 287 were incurred on loans
provided to Financial Intermediaries.18
Auditor General Report (cont…)Auditor General Report (cont…)
19
REPORT ON OTHER LEGAL AND REGULATORY REQUIREMENTS
Usefulness of information
Predetermined objectives
The reported performance information was deficient in respect of the following criterion:
Measurability : Indicators are not well defined.
Reliability of information
The reported performance information was deficient in respect of the following criterion:
Accuracy: the amounts , numbers and other data relating to actual performance have
not been recorded and reported appropriately.
Completeness: All actual results and events that should have been recorded have not
been included in the reported performance information.
19
• As of the 1st of April 2012, Khula was merged with the South African Micro Finance Apex
fund (samaf) as well as the business operations of the Industrial Development
Corporation’s (IDC) small business funding portfolio.
• The new entity is called the Small Enterprise Finance Agency (sefa).
Way ForwardWay Forward
20

THANK YOU
21