Embed Size (px)
Citation preview

THIS REPORT CONTAINS ASSESSMENTS OF COMMODITY AND TRADE ISSUES MADE BY
USDA STAFF AND NOT NECESSARILY STATEMENTS OF OFFICIAL U.S. GOVERNMENT
POLICY
Required Report - public distribution
Date: 11/2/2010
GAIN Report Number:
South Africa - Republic of
Fresh Deciduous Fruit Annual
Annual
Approved By:
Ross Kreamer
Prepared By:
Linda Siphugu
Report Highlights:
Post forecasts production of fresh apples to decrease by 7.2 percent to 750,000 MT in MY 2010/11,
beginning in January 2010, due to a late spring that reduced budding and a heat wave that reduced
yields prior to harvest, while pear production is forecast to remain flat at 348,000 MT. Production of
table grapes is forecast at 280,000 MT in MY 2010, a 9.6 percent increase from 255,284 MT in MY
2009/10, on stellar climatic conditions which were characterized by warm and dry spring temperatures,
resulting in better yields per hectare.
Executive Summary:
Pear production, supply, and distribution remain flat in MY 2010/11
Post forecasts production of fresh pears to remain flat at 348,000 MT in the January – December
marketing year (MY 2010/11), as consumer demand remains static. Domestic consumption of fresh
pears is forecast to remain flat at 44,000 MT in MY 2010/11 as pears are generally more expensive than
apples in the domestic market and appeal to middle to high-income consumers. Exports of fresh pears
will increase one percent on strong demand from the EU to182, 000 MT in MY 2010/11.
Apple production down on a late spring and heat wave damage
Post forecasts production for fresh apple production to decrease 7.2 percent to 750,000 MT in MY 2010
from the previous year on a late spring that reduced budding and a heat wave that reduced crop yields
prior to harvest. Domestic consumption of fresh apples will decrease seven percent to 200,000 MT in
MY 2010/11, from the previous year as domestic prices have risen on shorter supplies. Tighter supplies
are also expected to push down fresh apple exports by 13 percent in MY 2010/11.
Table grape production benefits from good weather
Post forecasts production of table grapes at 280,000 MT in MY 2010, a 9.6 percent increase from
255,284 MT in MY 2009/10, on stellar climatic conditions which were characterized by warm and dry
spring temperatures, resulting in better yields per hectare. The cultivar profile in South Africa has
changed in recent years: seeded cultivars are declining on a yearly basis as consumers prefer seedless
grapes. The domestic consumption of fresh table grapes will increase two percent to 38,000 MT as
demand increases with the growth of middle class consumers.
Post forecasts table grape exports will increase six percent to 232,100 MT in MY 2010/11, up from
217,875 MT in the previous year on higher yields and greater exportable supplies. The South African
industry launched a major international marketing campaign to support table grape sales in the UK in
MY 2009 called “Beautiful Country, Beautiful Fruit”: www.beautifulcountrybeautifulfruit.com.
Market Year 2010/11 = January to December 2010
US$1 = Rand 6.95 (20 October 2010)
Sources:
Deciduous Fruit Producer’s Trust (DFPT)
South Africa Table Grape Industry (SATGI)
National Agricultural Marketing Council (NAMC)
Commodities:
Pears, Fresh
Apples, Fresh
Grapes, Table, Fresh
Pears, Fresh
Area Planted
Post forecasts area planted to pears will remain flat at 11,450 hectares in MY 2010/11 on high input
costs. The cost of establishing a pear orchard increased by 49 percent to R124, 432 in MY 2009/10, up
from R83, 696 in the previous year. The main drivers of the increased production costs are the planting
material (rootstock and seedlings) and the cost of trellising. Rootstock is typically imported and
experienced a price spike in-line with high commodity and petroleum prices during 2008 - 2009. The
cost of trellising is dependent on iron, which also experienced price volatility in recent years.
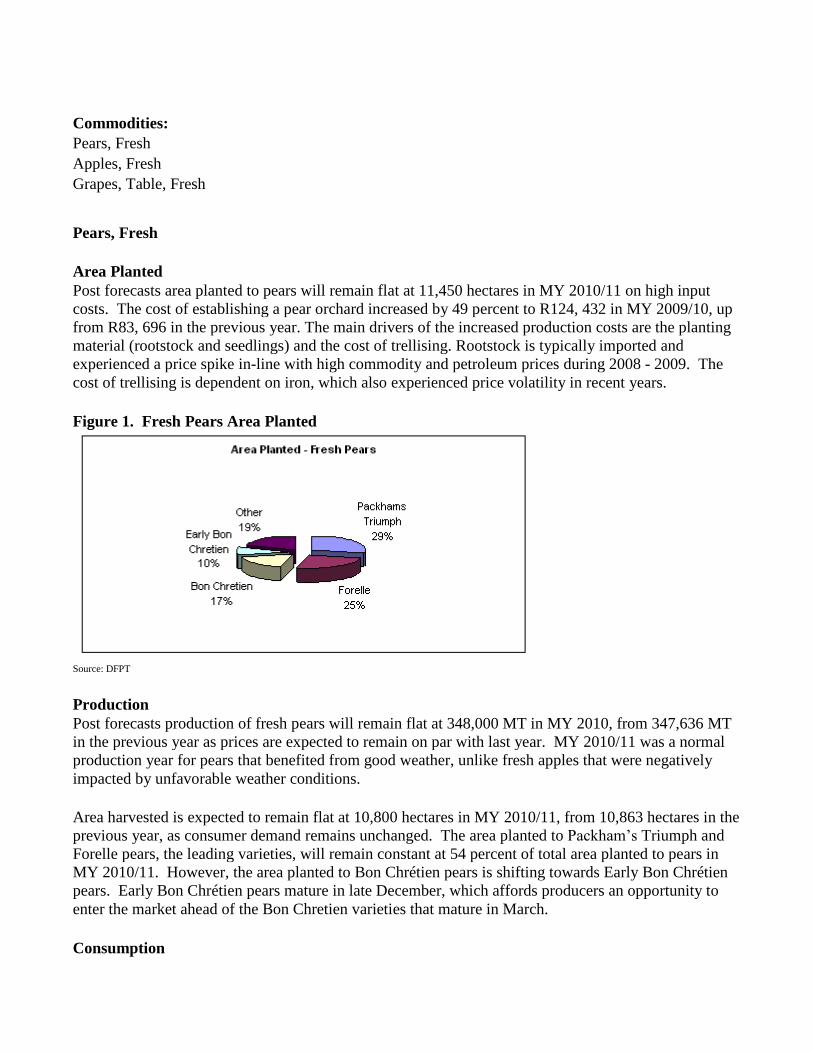
Figure 1. Fresh Pears Area Planted
Source: DFPT
Production
Post forecasts production of fresh pears will remain flat at 348,000 MT in MY 2010, from 347,636 MT
in the previous year as prices are expected to remain on par with last year. MY 2010/11 was a normal
production year for pears that benefited from good weather, unlike fresh apples that were negatively
impacted by unfavorable weather conditions.
Area harvested is expected to remain flat at 10,800 hectares in MY 2010/11, from 10,863 hectares in the
previous year, as consumer demand remains unchanged. The area planted to Packham’s Triumph and
Forelle pears, the leading varieties, will remain constant at 54 percent of total area planted to pears in
MY 2010/11. However, the area planted to Bon Chrétien pears is shifting towards Early Bon Chrétien
pears. Early Bon Chrétien pears mature in late December, which affords producers an opportunity to
enter the market ahead of the Bon Chretien varieties that mature in March.
Consumption
Domestic consumption of fresh pears is forecast to remain flat at 44,000 MT in MY 2010/11, from
44,711 MT the previous year, as consumer demand remains static. Pears are generally more expensive
than apples in the domestic market and appeal more to middle to high-income consumers. A 12.5
kilogram box of pears can sell up to 50 percent more than a 12.5 kilogram box of apples at local
wholesale markets. Domestic demand for fresh pears is approximately 13 percent total production
annually.
Marketing
South African producers focus on two pear varieties primarily for export markets: Packham’s Triumph
and Forelle. The Packham’s Triumph is a medium to large bumpy green dessert pear. The flesh is
creamy-white with a smooth texture and consumers enjoy its sweet and juicy taste. The Forelle pear is a
small, bell shaped, red-freckled variety of pear. Consumers enjoy its crisp texture and sweet taste.
Trade
Post forecasts exports of fresh pears will increase one percent to 182,000 MT in MY 2010/11, from
180,408 MT from the previous year, despite a strengthening rand. The EU is South Africa’s biggest
traditional market with the Netherlands and the UK having the largest market share. The representatives
of the South African fruit industry are determined to maintain the EU market since South Africa has an
advantage of shorter shipping distances and free access. In 2009, the industry kicked-off a consumer
education campaign in UK stores such as Tesco and Morrison’s Sainsburys as well as launched print
and radio advertisements promoting South African deciduous fruits.
Post forecasts South Africa will import 185 MT of pears in MY 2010, as imports are typically specialty
crunchy pears from China destined for high-income consumers. Pear imports typically land during the
last quarter of the MY.
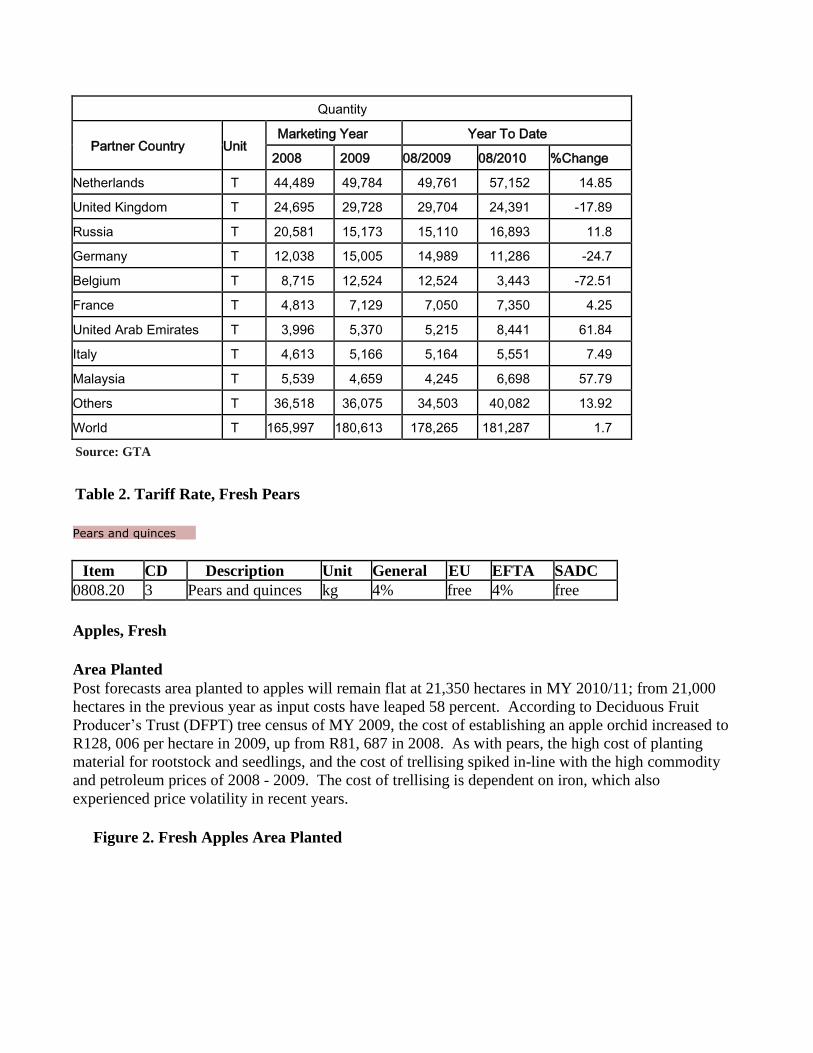
Table 1. Export Trade Matrix, Fresh Pears: MY 2008-2009, Year to Date 8/09-8/10
South Africa Export Statistics
Commodity: 080820, Pears, Fresh
Marketing Year Jan-Dec: 2008 - 2009, Year To Date: 08/2009 & 08/2010
Quantity
Partner Country Unit Marketing Year Year To Date
2008 2009 08/2009 08/2010 %Change
Netherlands T 44,489 49,784 49,761 57,152 14.85
United Kingdom T 24,695 29,728 29,704 24,391 -17.89
Russia T 20,581 15,173 15,110 16,893 11.8
Germany T 12,038 15,005 14,989 11,286 -24.7
Belgium T 8,715 12,524 12,524 3,443 -72.51
France T 4,813 7,129 7,050 7,350 4.25
United Arab Emirates T 3,996 5,370 5,215 8,441 61.84
Italy T 4,613 5,166 5,164 5,551 7.49
Malaysia T 5,539 4,659 4,245 6,698 57.79
Others T 36,518 36,075 34,503 40,082 13.92
World T 165,997 180,613 178,265 181,287 1.7
Source: GTA
Table 2. Tariff Rate, Fresh Pears
Pears and quinces
Item CD Description Unit General EU EFTA SADC 0808.20 3 Pears and quinces kg 4% free 4% free
Apples, Fresh
Area Planted
Post forecasts area planted to apples will remain flat at 21,350 hectares in MY 2010/11; from 21,000
hectares in the previous year as input costs have leaped 58 percent. According to Deciduous Fruit
Producer’s Trust (DFPT) tree census of MY 2009, the cost of establishing an apple orchid increased to
R128, 006 per hectare in 2009, up from R81, 687 in 2008. As with pears, the high cost of planting
material for rootstock and seedlings, and the cost of trellising spiked in-line with the high commodity
and petroleum prices of 2008 - 2009. The cost of trellising is dependent on iron, which also
experienced price volatility in recent years.
Figure 2. Fresh Apples Area Planted
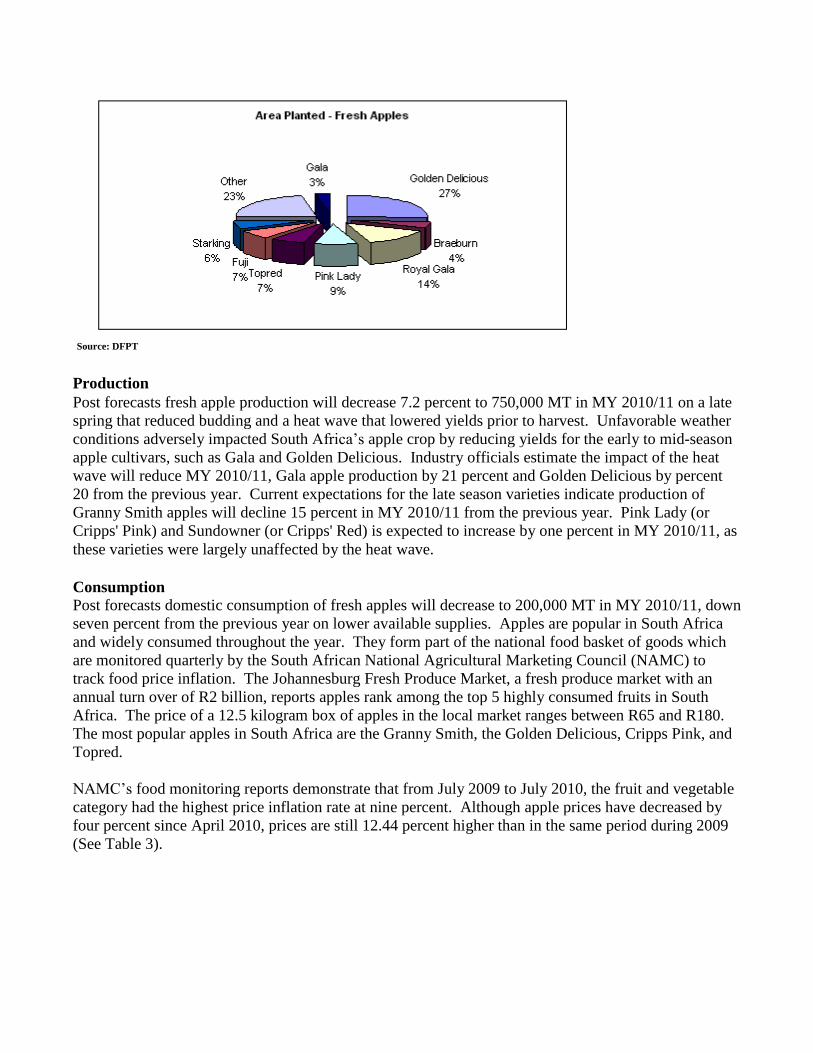
Source: DFPT
Production
Post forecasts fresh apple production will decrease 7.2 percent to 750,000 MT in MY 2010/11 on a late
spring that reduced budding and a heat wave that lowered yields prior to harvest. Unfavorable weather
conditions adversely impacted South Africa’s apple crop by reducing yields for the early to mid-season
apple cultivars, such as Gala and Golden Delicious. Industry officials estimate the impact of the heat
wave will reduce MY 2010/11, Gala apple production by 21 percent and Golden Delicious by percent
20 from the previous year. Current expectations for the late season varieties indicate production of
Granny Smith apples will decline 15 percent in MY 2010/11 from the previous year. Pink Lady (or
Cripps' Pink) and Sundowner (or Cripps' Red) is expected to increase by one percent in MY 2010/11, as
these varieties were largely unaffected by the heat wave.
Consumption
Post forecasts domestic consumption of fresh apples will decrease to 200,000 MT in MY 2010/11, down
seven percent from the previous year on lower available supplies. Apples are popular in South Africa
and widely consumed throughout the year. They form part of the national food basket of goods which
are monitored quarterly by the South African National Agricultural Marketing Council (NAMC) to
track food price inflation. The Johannesburg Fresh Produce Market, a fresh produce market with an
annual turn over of R2 billion, reports apples rank among the top 5 highly consumed fruits in South
Africa. The price of a 12.5 kilogram box of apples in the local market ranges between R65 and R180.
The most popular apples in South Africa are the Granny Smith, the Golden Delicious, Cripps Pink, and
Topred.
NAMC’s food monitoring reports demonstrate that from July 2009 to July 2010, the fruit and vegetable
category had the highest price inflation rate at nine percent. Although apple prices have decreased by
four percent since April 2010, prices are still 12.44 percent higher than in the same period during 2009
(See Table 3).
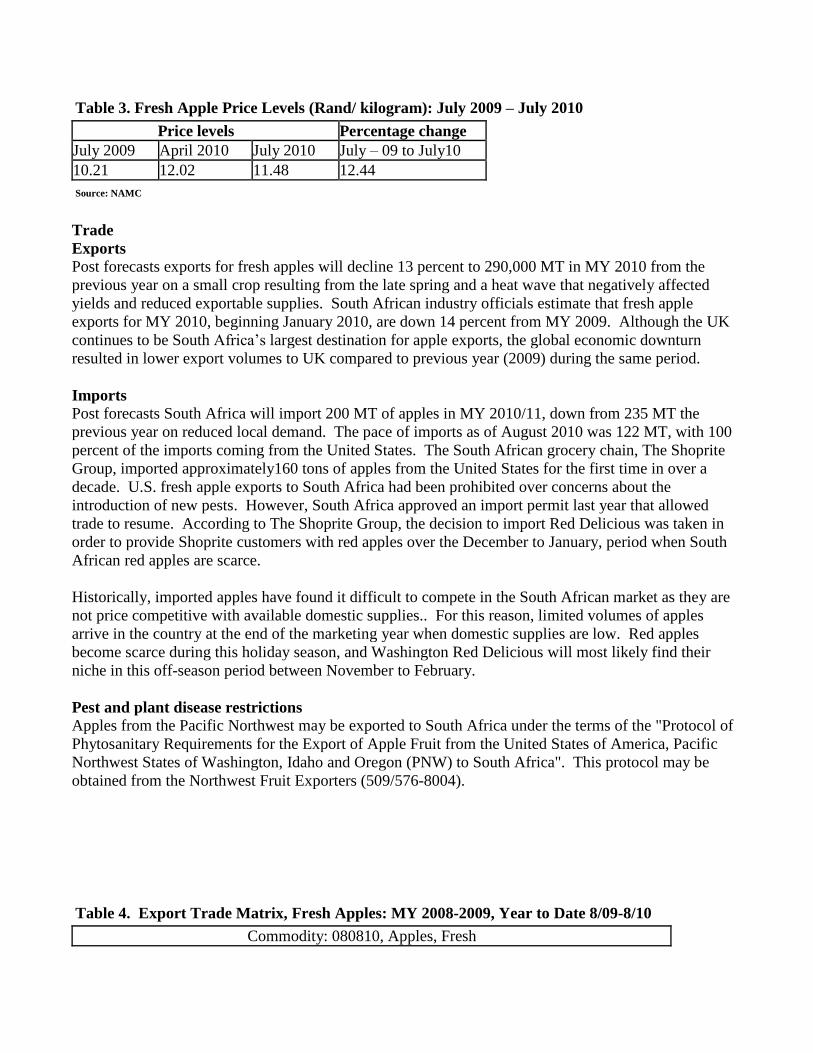
Table 3. Fresh Apple Price Levels (Rand/ kilogram): July 2009 – July 2010
Price levels Percentage change July 2009 April 2010 July 2010 July – 09 to July10
10.21 12.02 11.48 12.44
Source: NAMC
Trade
Exports
Post forecasts exports for fresh apples will decline 13 percent to 290,000 MT in MY 2010 from the
previous year on a small crop resulting from the late spring and a heat wave that negatively affected
yields and reduced exportable supplies. South African industry officials estimate that fresh apple
exports for MY 2010, beginning January 2010, are down 14 percent from MY 2009. Although the UK
continues to be South Africa’s largest destination for apple exports, the global economic downturn
resulted in lower export volumes to UK compared to previous year (2009) during the same period.
Imports
Post forecasts South Africa will import 200 MT of apples in MY 2010/11, down from 235 MT the
previous year on reduced local demand. The pace of imports as of August 2010 was 122 MT, with 100
percent of the imports coming from the United States. The South African grocery chain, The Shoprite
Group, imported approximately160 tons of apples from the United States for the first time in over a
decade. U.S. fresh apple exports to South Africa had been prohibited over concerns about the
introduction of new pests. However, South Africa approved an import permit last year that allowed
trade to resume. According to The Shoprite Group, the decision to import Red Delicious was taken in
order to provide Shoprite customers with red apples over the December to January, period when South
African red apples are scarce.
Historically, imported apples have found it difficult to compete in the South African market as they are
not price competitive with available domestic supplies.. For this reason, limited volumes of apples
arrive in the country at the end of the marketing year when domestic supplies are low. Red apples
become scarce during this holiday season, and Washington Red Delicious will most likely find their
niche in this off-season period between November to February.
Pest and plant disease restrictions
Apples from the Pacific Northwest may be exported to South Africa under the terms of the "Protocol of
Phytosanitary Requirements for the Export of Apple Fruit from the United States of America, Pacific
Northwest States of Washington, Idaho and Oregon (PNW) to South Africa". This protocol may be
obtained from the Northwest Fruit Exporters (509/576-8004).
Table 4. Export Trade Matrix, Fresh Apples: MY 2008-2009, Year to Date 8/09-8/10
Commodity: 080810, Apples, Fresh
Marketing Year: 2005 - 2009, Year To Date: 08/2009 & 08/2010
Quantity
Partner Country Unit Marketing Year Year To Date
2008 2009 08/2009 08/2010 %Change
United Kingdom T 120,014 111,251 106,262 83,207 -21.7
Malaysia T 33,164 39,309 29,564 30,156 2
Netherlands T 26,973 19,618 19,156 15,936 -16.81
United Arab Emirates T 18,515 18,461 15,208 14,709 -3.28
Benin T 20,536 18,334 12,994 12,542 -3.48
Singapore T 10,751 11,925 8,470 7,875 -7.02
Bangladesh T 2,829 8,945 8,184 6,703 -18.09
France T 6,117 7,486 6,225 6,079 -2.35
Russia T 14,086 6,701 6,583 3,066 -53.42
Other T 105,569 96,940 70,978 75,505 6.00
World T 358,554 338,970 283,624 255,778 -9.82
Source: GTA
Table 5. Tariff Rates, Fresh Apples
Apples
Item CD Description Unit General EU EFTA SADC
0808.10 9 Apples kg 4% free 4% free
Grapes, Table, Fresh
Area Planted Post forecast area planted to table grapes will remain flat at 10,830 hectares in MY 2010/11, as grape
production continues to recover from floods in 2008 that damaged 23 percent of the crop and reduced
the area planted by 3,161 hectares. Despite the reduction in area planted, yields are up nearly 10 percent
in MY 2010/11 on good weather.
Production
Post forecasts production of table grapes at 280,000 MT in MY 2010/11, a 9.6 percent increase from
255,284 MT in MY 2009/10, on stellar climatic conditions which were characterized by warm and dry
spring temperatures, resulting in better yields per hectare. The cultivar profile in the South Africa has
changed in recent years: seeded cultivars are declining on a yearly basis as consumers prefer seedless
grapes. Production of black and red seedless varieties increased by 9.3 percent and 9 percent
respectively. The popularity of seedless cultivars stems from characteristics such as large berry size
(with elongated or oval berry shapes), favorable texture (crunchiness), and good color. Though the
demand for seedless cultivars is growing globally, Europe still exists as a large market for seeded
varieties that have specific cultivar characteristics: longer shelf-life, good color development, and larger
fruit sizes.
Consumption
Post forecasts the domestic consumption of fresh table grapes will increase two percent to 38,000 MT
in MY 2010/11, as demand increases with the growth of middle-income consumers. The growth in
demand is not expected to exceed two percent, since the price of table grapes are relatively high when
compared other fresh fruits such as apples and pears. The price of a 4.5 kilogram box of table grapes
costs between R110 and R140 in the local market.
Grapes are considered a luxury fruit, and only 30 percent of the population is identified as frequent
grape consumers. This demographic has a disposable monthly income of R8, 000 or higher per month.
The local market for grapes is small at less than 40,000 MT annually. However, the market has grown
from 24,000 MT in 2001 to 37,409 MT in 2009, driven by a rapidly expanding urban middle-class.
Trade
Exports
Post forecasts table grape exports will increase six percent to 232,100 MT in MY 2010/11, up from
217,875 the previous year on higher yields and greater exportable supplies. The EU is the leading
export market for South African grapes, accounting for 63 percent of South Africa’s table grape
exports. South Africa benefits from a shorter shipping distance than competitors and strong demand
for seedless varieties accompanied by sustained demand for seeded varieties in Eastern Europe. The
global economic downturn put downward pressure on exports to the UK, which is South Africa’s
second largest traditional market at 16 percent of total grape exports. However, the South African
Table Grape Industry is actively marketing its product in UK, which has been steadily coming out of
recession since the last quarter of 2009. Industry officials remain optimistic the marketing campaigns
and improvement in the economy will generate increased sales in MY 2010/11.
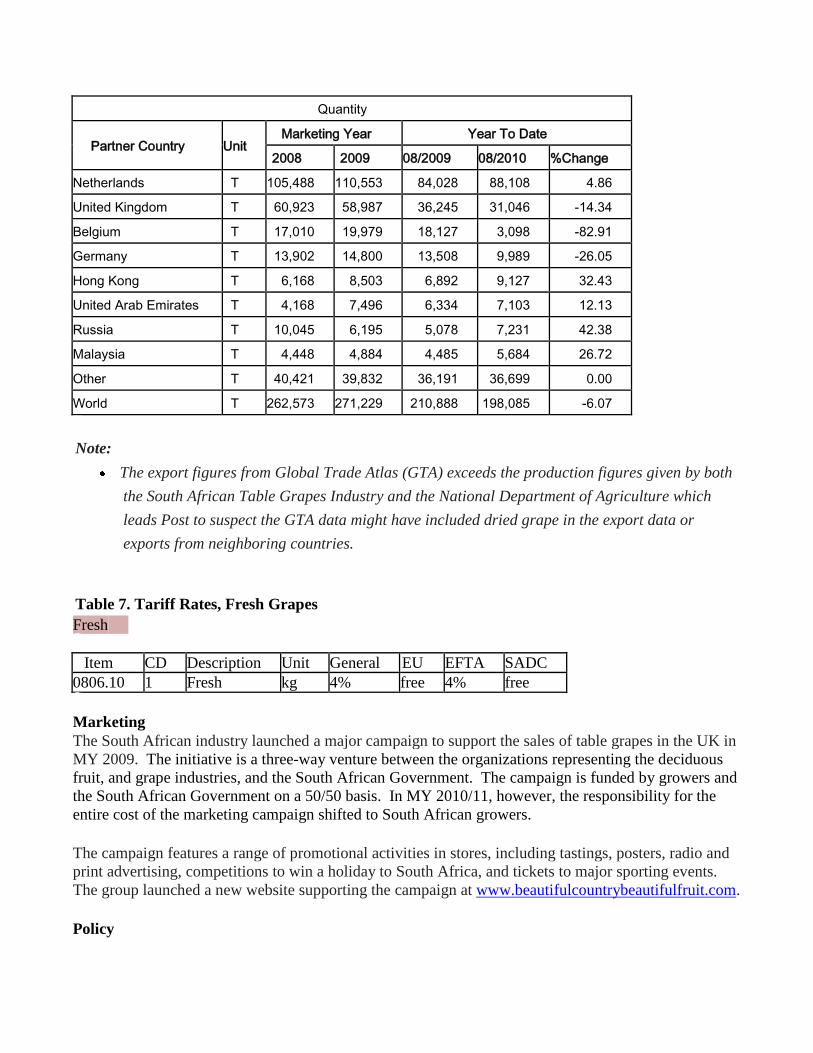
Table 6. Export Trade Matrix, Fresh Grapes: MY 2008-2009, Year to Date 8/09-8/10
Commodity: 080610, Grapes, Fresh
Calendar Year: 2005 - 2009, Year To Date: 08/2009 & 08/2010
Quantity
Partner Country Unit Marketing Year Year To Date
2008 2009 08/2009 08/2010 %Change
Netherlands T 105,488 110,553 84,028 88,108 4.86
United Kingdom T 60,923 58,987 36,245 31,046 -14.34
Belgium T 17,010 19,979 18,127 3,098 -82.91
Germany T 13,902 14,800 13,508 9,989 -26.05
Hong Kong T 6,168 8,503 6,892 9,127 32.43
United Arab Emirates T 4,168 7,496 6,334 7,103 12.13
Russia T 10,045 6,195 5,078 7,231 42.38
Malaysia T 4,448 4,884 4,485 5,684 26.72
Other T 40,421 39,832 36,191 36,699 0.00
World T 262,573 271,229 210,888 198,085 -6.07
Note:
The export figures from Global Trade Atlas (GTA) exceeds the production figures given by both
the South African Table Grapes Industry and the National Department of Agriculture which
leads Post to suspect the GTA data might have included dried grape in the export data or
exports from neighboring countries.
Table 7. Tariff Rates, Fresh Grapes
Fresh
Item CD Description Unit General EU EFTA SADC
0806.10 1 Fresh kg 4% free 4% free
Marketing
The South African industry launched a major campaign to support the sales of table grapes in the UK in
MY 2009. The initiative is a three-way venture between the organizations representing the deciduous
fruit, and grape industries, and the South African Government. The campaign is funded by growers and
the South African Government on a 50/50 basis. In MY 2010/11, however, the responsibility for the
entire cost of the marketing campaign shifted to South African growers.
The campaign features a range of promotional activities in stores, including tastings, posters, radio and
print advertising, competitions to win a holiday to South Africa, and tickets to major sporting events.
The group launched a new website supporting the campaign at www.beautifulcountrybeautifulfruit.com.
Policy
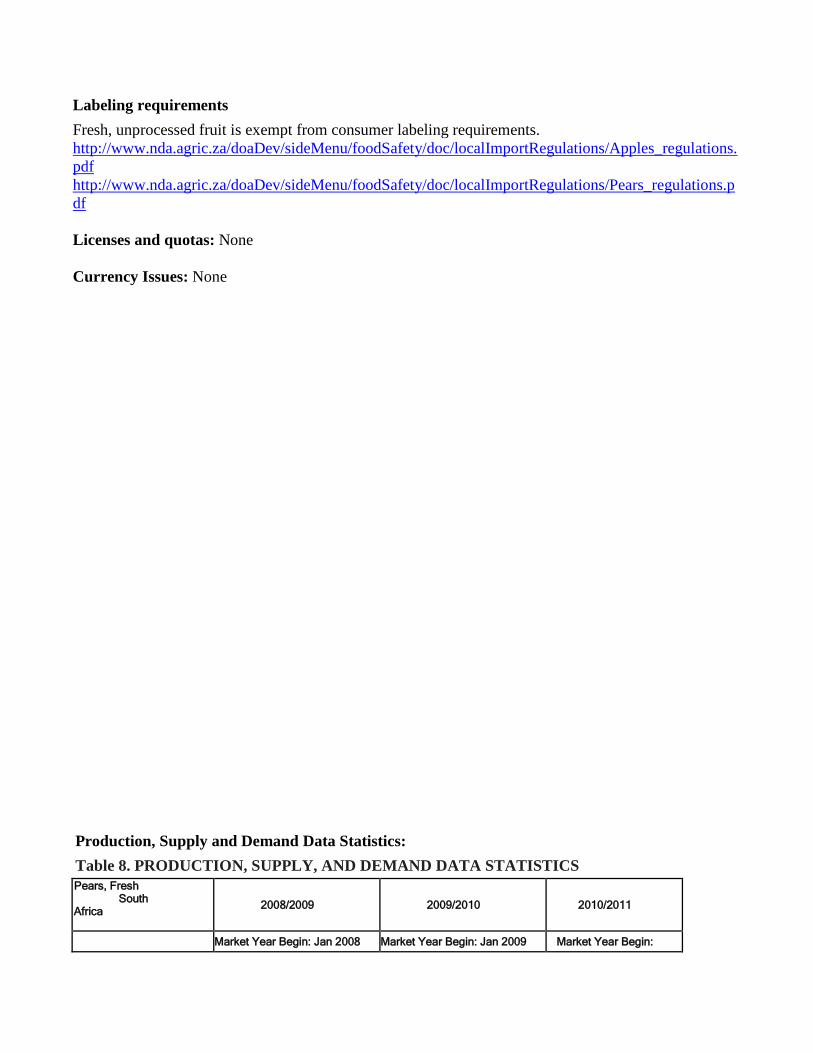
Labeling requirements Fresh, unprocessed fruit is exempt from consumer labeling requirements.
http://www.nda.agric.za/doaDev/sideMenu/foodSafety/doc/localImportRegulations/Apples_regulations.
http://www.nda.agric.za/doaDev/sideMenu/foodSafety/doc/localImportRegulations/Pears_regulations.p
df
Licenses and quotas: None
Currency Issues: None
Production, Supply and Demand Data Statistics:
Table 8. PRODUCTION, SUPPLY, AND DEMAND DATA STATISTICS
Pears, Fresh South
Africa
2008/2009 2009/2010 2010/2011
Market Year Begin: Jan 2008 Market Year Begin: Jan 2009 Market Year Begin:
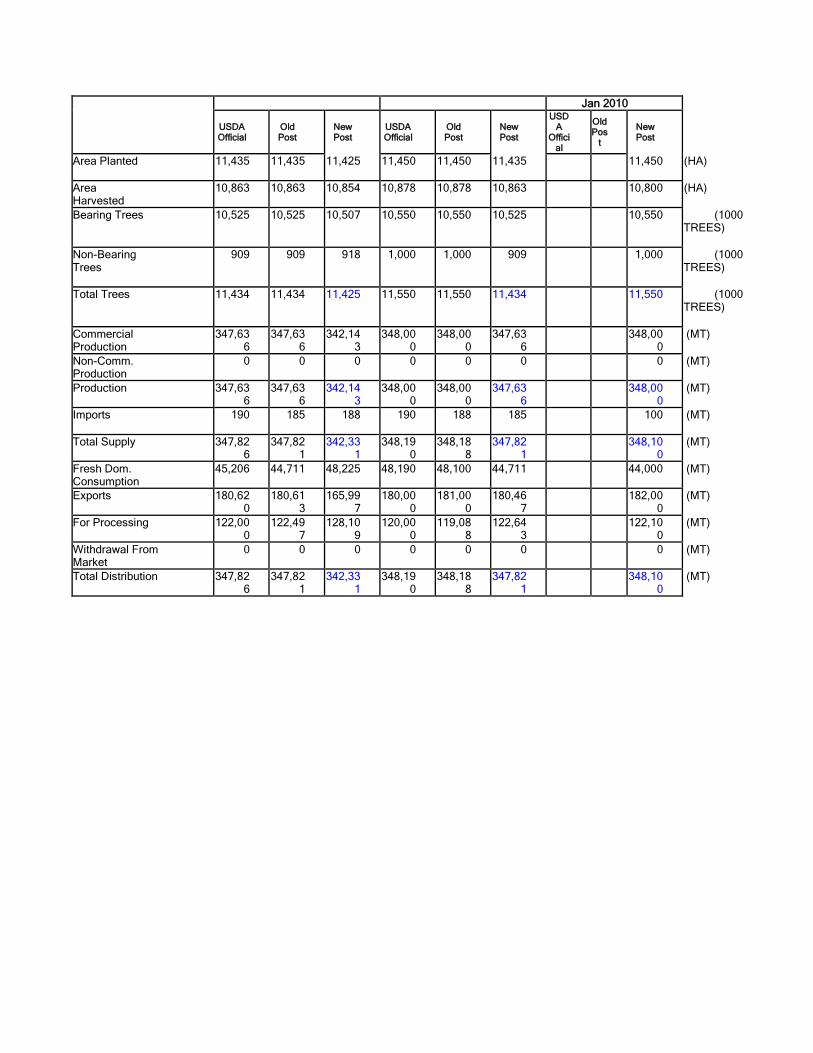
Jan 2010
USDA Official
Old Post
New Post
USDA Official
Old Post
New Post
USDA
Official
Old Pos
t New Post
Area Planted 11,435 11,435 11,425 11,450 11,450 11,435 11,450 (HA)
Area Harvested
10,863 10,863 10,854 10,878 10,878 10,863 10,800 (HA)
Bearing Trees 10,525 10,525 10,507 10,550 10,550 10,525 10,550 (1000 TREES)
Non-Bearing Trees
909 909 918 1,000 1,000 909 1,000 (1000 TREES)
Total Trees 11,434 11,434 11,425 11,550 11,550 11,434 11,550 (1000
TREES)
Commercial Production
347,636
347,636
342,143
348,000
348,000
347,636 348,00
0 (MT)
Non-Comm. Production
0 0 0 0 0 0 0 (MT)
Production 347,636
347,636
342,143
348,000
348,000
347,636 348,00
0 (MT)
Imports 190 185 188 190 188 185 100 (MT)
Total Supply 347,82
6 347,82
1 342,33
1 348,19
0 348,18
8 347,82
1 348,100
(MT)
Fresh Dom. Consumption
45,206 44,711 48,225 48,190 48,100 44,711 44,000 (MT)
Exports 180,620
180,613
165,997
180,000
181,000
180,467 182,00
0 (MT)
For Processing 122,00
0 122,49
7 128,10
9 120,00
0 119,08
8 122,64
3 122,100
(MT)
Withdrawal From Market
0 0 0 0 0 0 0 (MT)
Total Distribution 347,826
347,821
342,331
348,190
348,188
347,821 348,10
0 (MT)
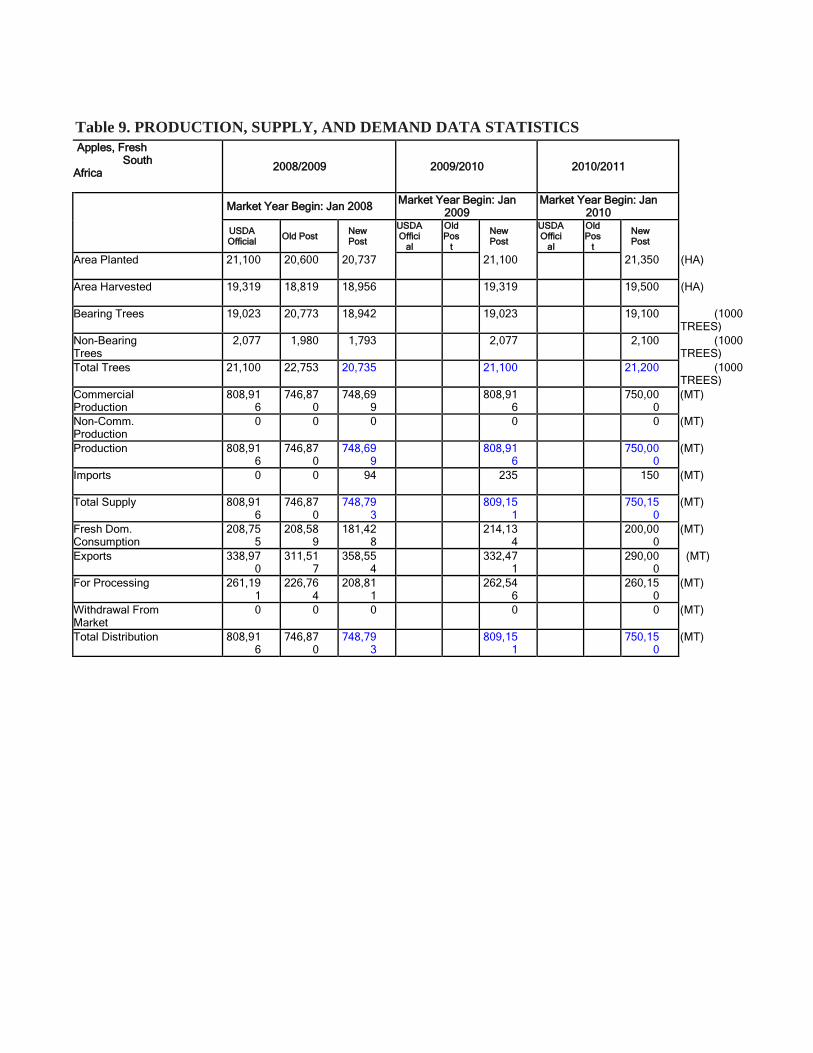
Table 9. PRODUCTION, SUPPLY, AND DEMAND DATA STATISTICS
Apples, Fresh South
Africa
2008/2009 2009/2010 2010/2011
Market Year Begin: Jan 2008 Market Year Begin: Jan
2009 Market Year Begin: Jan
2010
USDA Official Old Post New
Post USDA Offici
al
Old Pos
t New Post
USDA Offici
al
Old Pos
t New Post
Area Planted 21,100 20,600 20,737 21,100 21,350 (HA)
Area Harvested 19,319 18,819 18,956 19,319 19,500 (HA)
Bearing Trees 19,023 20,773 18,942 19,023 19,100 (1000 TREES)
Non-Bearing Trees
2,077 1,980 1,793 2,077 2,100 (1000 TREES)
Total Trees 21,100 22,753 20,735 21,100 21,200 (1000 TREES)
Commercial Production
808,916
746,870
748,699 808,91
6 750,000
(MT)
Non-Comm. Production
0 0 0 0 0 (MT)
Production 808,916
746,870
748,699 808,91
6 750,000
(MT)
Imports 0 0 94 235 150 (MT)
Total Supply 808,916
746,870
748,793 809,15
1 750,150
(MT)
Fresh Dom. Consumption
208,755
208,589
181,428 214,13
4 200,000
(MT)
Exports 338,970
311,517
358,554 332,47
1 290,000
(MT)
For Processing 261,191
226,764
208,811 262,54
6 260,150
(MT)
Withdrawal From Market
0 0 0 0 0 (MT)
Total Distribution 808,916
746,870
748,793 809,15
1 750,150
(MT)
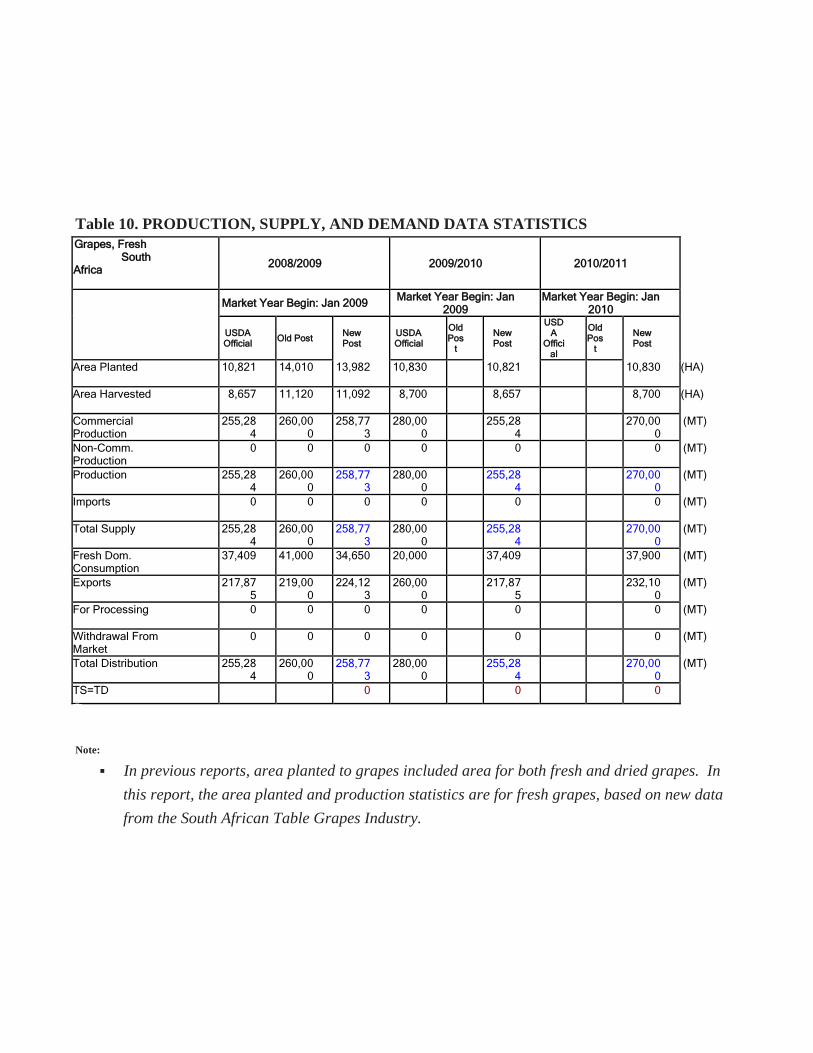
Table 10. PRODUCTION, SUPPLY, AND DEMAND DATA STATISTICS
Grapes, Fresh South
Africa
2008/2009 2009/2010 2010/2011
Market Year Begin: Jan 2009 Market Year Begin: Jan 2009
Market Year Begin: Jan 2010
USDA Official Old Post New
Post USDA Official
Old Pos
t New Post
USDA
Official
Old Pos
t New Post
Area Planted 10,821 14,010 13,982 10,830 10,821 10,830 (HA)
Area Harvested 8,657 11,120 11,092 8,700 8,657 8,700 (HA)
Commercial Production
255,284
260,000
258,773
280,000 255,28
4 270,000
(MT)
Non-Comm. Production
0 0 0 0 0 0 (MT)
Production 255,284
260,000
258,773
280,000 255,28
4 270,000
(MT)
Imports 0 0 0 0 0 0 (MT)
Total Supply 255,284
260,000
258,773
280,000 255,28
4 270,000
(MT)
Fresh Dom. Consumption
37,409 41,000 34,650 20,000 37,409 37,900 (MT)
Exports 217,875
219,000
224,123
260,000 217,87
5 232,100
(MT)
For Processing 0 0 0 0 0 0 (MT)
Withdrawal From Market
0 0 0 0 0 0 (MT)
Total Distribution 255,284
260,000
258,773
280,000 255,28
4 270,000
(MT)
TS=TD 0 0 0
Note:
In previous reports, area planted to grapes included area for both fresh and dried grapes. In
this report, the area planted and production statistics are for fresh grapes, based on new data
from the South African Table Grapes Industry.


![Fresh Deciduous Fruit Annual Vienna EU-27 10-28-2011[1] GAIN Publications/Fresh Deciduous... · WAPA World Apple and Pear Association Trade data ... Executive Summary Apples Pears](https://img.dokumen.tips/doc/110x75/5adbc6c67f8b9a9d4d8b806f/fresh-deciduous-fruit-annual-vienna-eu-27-10-28-20111-gain-publicationsfresh.jpg)