Embed Size (px)
Citation preview

Sources of United States Oil Supply
Prepared for the Alaska Coalition
April 8, 2002
by W. Thomas Goerold, Ph.D.
Lookout Mountain Analysis 314 Parkview Avenue
Golden, CO 80401 (303) 526-2362

I. Introduction This report looks at important elements of U.S. and worldwide country petroleum supply. Covered in this report are: current world oil statistics and trends, U.S. oil imports, oil supply assessments of three of this country’s important oil trading partners, and an examination of the technologies and the potential of enhanced oil recovery (EOR) in selected Western Hemisphere nations. Section II examines current sources of U.S. oil supplies—including domestic production and oil imports. Section III shows important oil statistics for much of the world. Section IV examines some worldwide energy statistics. Included in this section are snapshots of energy production, reserves, and reserve/production ratios in 2000, as well as a look at recent energy trends. Also covered in detail in this section are the energy sectors of Mexico, Canada, and Venezuela. Section V examines the role of enhanced oil recovery (EOR). Most of the oil ever discovered in the U.S. is still underground in identified geologic structures and within producing oil fields. Applications of advanced EOR technologies are yielding increasingly large quantities of additional oil production without the need to develop brand-new oil fields. Section VI gives the major conclusions of this study and Section VII shows references.
II. U.S. Oil Production and Imports The Energy Information Administration (EIA) of the U.S. Department of Energy (DOE) divides the country into five areas. These regions, defined at the beginning of World War II by Harold Ickes—FDR’s Secretary of Interior, are called Petroleum Administration for Defense Districts (PAD). Table 1 shows the states within each of the PADs, followed by the regional designation of each district in parentheses.
Table 1 – Petroleum Administration for Defense Districts (PADD)
PAD District States Included 1 FL, NY, PA, VA, WV (Florida and East) 2 IL, IN, KS, KT, MI, MO, NE, ND, OH,
OK, SD, TN (Midwest) 3 AL, AR, LA, MS, NM, TX (SE and SW) 4 CO, MT, UT, WY (Rocky Mountain) 5 AK, CA, AZ, NV (Alaska and Far West)
Figure 1 shows the sources of U.S. oil production by region, as defined by PAD. In 2000, more than 85 percent of all oil production came from PADs 3 and 5—the SE and SW and Alaska and the Far West region. About 94 percent of all federal offshore oil production was pumped from the SE and SW PAD 3, with the remaining federal offshore output

from Alaska and the Far West PAD 5. State waters extend out to three miles and federal waters extend seaward from there to the 200-mile national limit. A. Oil Production from Federal Lands Most production from new U.S. oilfields comes from offshore fields in the Gulf of Mexico, located in PAD 3. Figure 2 depicts the increasing importance of federally administered lands for U.S. petroleum production. In 1991 oil output from U.S. federal lands amounted to about 490 million barrels, by 1999 this had grown to approximately 630 million barrels. (Note: federally administered lands includes onshore and offshore acreage, as well as acquired military lands). U.S. federal lands share of oil output grew even more impressively during the period. It rose by almost 50 percent—from about 20 percent of total U.S. oil production in 1991 to almost 30 percent in 1999 (the most recent year with data). While the majority of the federal lands oil production increase is from new oil fields in the Gulf of Mexico, the nation’s federal lands also produce significant output from fields located in New Mexico, Alaska, Oklahoma, and California. B. U.S. Oil Import Diversity Some critics of U.S. energy policy point to the relatively large and growing U.S. crude oil imports. In recent years the U.S. has imported slightly more than one-half of its oil needs from foreign sources. But, the geographical and political diversity of oil import sources help protect the U.S. from unilateral oil embargoes. The U.S. definitely does not put its “oil import eggs” in one basket. Figure 3 gives preliminary estimates of U.S. oil imports by country in 2000. Canada, Venezuela, and Mexico each shipped almost as much oil to the U.S. as Saudi Arabia. In addition to the OPEC countries of Nigeria and Iraq, Colombia, Norway, and the United Kingdom were all major suppliers of crude oil to the U.S. Non-OPEC sources supplied about 25 percent and OPEC sources about 26 percent of total U.S. oil consumption. Persian Gulf countries were the source of about 13 percent of total U.S. oil consumption in 2000 (DOE/EIA, 2001d).
III. Selected World and U.S. Oil Statistics
Since peaking in the late 1980s the U.S. has seen gradually declining domestic oil production. This has led to increases in oil imports and has fostered increasing concern among some about the security of energy supplies. In 2000, about 70 percent of all petroleum used in the United States was consumed in the transportation sector. And, petroleum currently supplies about 97 percent of all energy consumed in the transportation sector. Probably the most significant single target for decreasing petroleum consumption is improving the fuel efficiency of automobiles and light trucks.
3

This section looks generally at recent oil production, reserves, and reserve/production ratios. It also scrutinizes three of the most important Western Hemisphere energy trading partners of the U.S.—Mexico, Canada, and Venezuela. A. Oil Production, Reserves, and Reserve/Production (R/P) Ratios A reserves/production ratio (R/P) can give a snapshot of the current state of a country’s oil reserves. An intensively explored area containing very mature energy-production facilities will tend to have lower R/P ratios than areas that have not been as thoroughly explored or with a still-developing energy infrastructure. There is a disincentive for oil companies to explore for and identify oil production well out into the future. It costs money to explore and develop oil fields and most companies are concerned just with proving enough oil reserves to produce in the immediate future. While a low R/P ration does not necessarily indicate a country running out of oil, a high R/P ratio usually implies that a country has very significant oil reserves with large amounts likely left to be discovered. Table 2 below gives year 2000 oil production, reserves and R/P ratios.
Table 2 – Selected Country Oil Statistics
(Billions of Barrels) Country Production (2000) Reserves (2000) R/P ratio U.S. 353.5 29.7 10.4 Canada 126.3 6.4 8.5 Mexico 172.1 28.3 23.5 Venezuela 166.8 76.9 66.4 Brazil 63.5 3.1 17.7 Norway 157.5 9.4 7.7 United Kingdom 126.2 5.0 5.3 Kazakhstan 35.3 8.0 31.1 Russian Federation 323.3 48.6 20.6 Saudi Arabia 441.2 261.7 81.1 Iran 186.6 89.7 65.7 Iraq 128.1 112.5 >100 Kuwait 105.6 96.5 >100 UAE 114.7 97.8 >100 World 1010.4 1046.4 39.9
4

Source: BP, 2001.
An important fact often overlooked is that, in 2000 the U.S. was the world’s second largest oil producer. Saudi Arabia produced the most oil in 2000, 441.2 billion barrels, followed by the U.S. at 353.5 and the Russian Federation at 323.3 billion barrels, respectively. At yearend 2000 Saudi Arabia had 261.7, U.S. 29.7, and the Russian Federation 48.6 billion barrels of oil reserves identified. This results in an R/P ratio of 81.1 for Saudi Arabia, 10.4 for the U.S., and 20.6 for the Russian Federation. Thus, at current levels of domestic production and with no further oil exploration activities, Saudi Arabia could produce oil for more than 80 years, the U.S. for more than 10, and the Russian Federation for more than 20 years. But the R/P ratio tends to be a number that is continually being extended forward as a result of ongoing exploration and development activities. Looking at an R/P ratio at one point in time can be misleading. The U.S. has had an R/P between 8 and 12 for the past 50 years. In 1940s and 1950s the R/P ratio was about 12, and declined to below 10 in the 1960s. It then stayed relatively constant at about 8 in the 1970s and 1980s and has hovered at around 10 throughout the 1990s. Despite its huge appetite for oil, the U.S. has been able to replace the oil that it has produced for the last 50 years. Comparing Western Hemisphere countries, Canada had oil reserves of 6.4 billion barrels at the end of 2000 and an R/P ratio of 8.5. Mexico’s oil statistics showed a significantly larger identified oil reserve base of 28.3 billion barrels and an R/P ratio of 23.5. Venezuela also has the hallmarks of a country with a promising oil production future—with yearend 2000 oil reserves of 76.9 billion barrels, and an R/P of 66.4 (BP, 2001). Of course Middle Eastern countries have very large R/P ratios. But there are many Western Hemisphere, European, and Asian countries with significant current production, reserves, and high R/P ratios. Outside of the Middle East, the Russian Federation, Venezuela, and Mexico all have very healthy R/P ratios. A. Recent Global Oil Production Trends Figure 4 shows oil production trends from 1993 to 2000 for selected countries. Grouped by continents, the figure depicts changes in oil output during the period. The leftmost group of bars, representing North America, shows that U.S. oil production declined by about 10 percent since 1993. But, fueled by an increase of 24 percent in Canada and 10 percent in Mexico, total North American oil output was virtually unchanged during the period. The group of bars to the right of the North American bars shows the robustness of oil production in South and Central America. Total oil output in South and Central America grew by 36 percent during the study period. Led by Brazil’s almost-doubling of oil production, the continent saw very significant production increases from the oil-
5

powerhouse of Venezuela. Argentina, Colombia, and Ecuador also recorded healthy double-digit growths in oil production. The middle group of bars shows European oil production (excluding the former USSR). Petroleum output grew by almost 30 percent, with 38 percent and 73 percent leaps by Norway and the United Kingdom’s oil industries, respectively. Due to widespread economic woes, most countries of the former USSR (shown by the next group of bars) experienced declines in oil output. Russia labored through a petroleum production decrease of about 9 percent during the period. Even a 52 percent surge in output by Kazakhstan could not stem an overall decrease of 2 percent in oil output from the countries of the former USSR. The Middle East enjoyed a healthy increase in oil production during the study period, growing by 17 percent. The region’s largest oil producer, Saudi Arabia, grew output by about 2 percent since 1993. Both OPEC and Non-OPEC countries showed a growth in oil production of about 15 percent from 1993 to 2000. With the exception of North America, all regions showed significant oil output increases from 1993 to the present. South and Central America showed the largest increases, followed by Europe, and the Middle East. No region exhibits any evidence of the exhaustion of oil resources. C. Undiscovered Conventional Oil and Gas Resources The U.S. Geological Survey has projected the worldwide distribution of undiscovered oil and gas resources. This information can be combined with data about existing discovered oil and gas resources (also known as oil reserves), to get an idea whether or not the “center of gravity” of oil production is likely to change from its current Middle Eastern position. Table 3 presents a summary of the USGS research.
Table 3 – Estimates of Worldwide Undiscovered Conventional Oil and Gas Resources
(Bill. Bbls) Percent of World (TCF) Percent of World
Region Oil Oil Natural Gas Natural Gas Middle East/ North Africa 230 35.4 1370 29.3 Former Soviet Union 116 17.9 1611 34.5 Central & South America 105 16.2 487 10.4 Sub Sahara Africa/
6
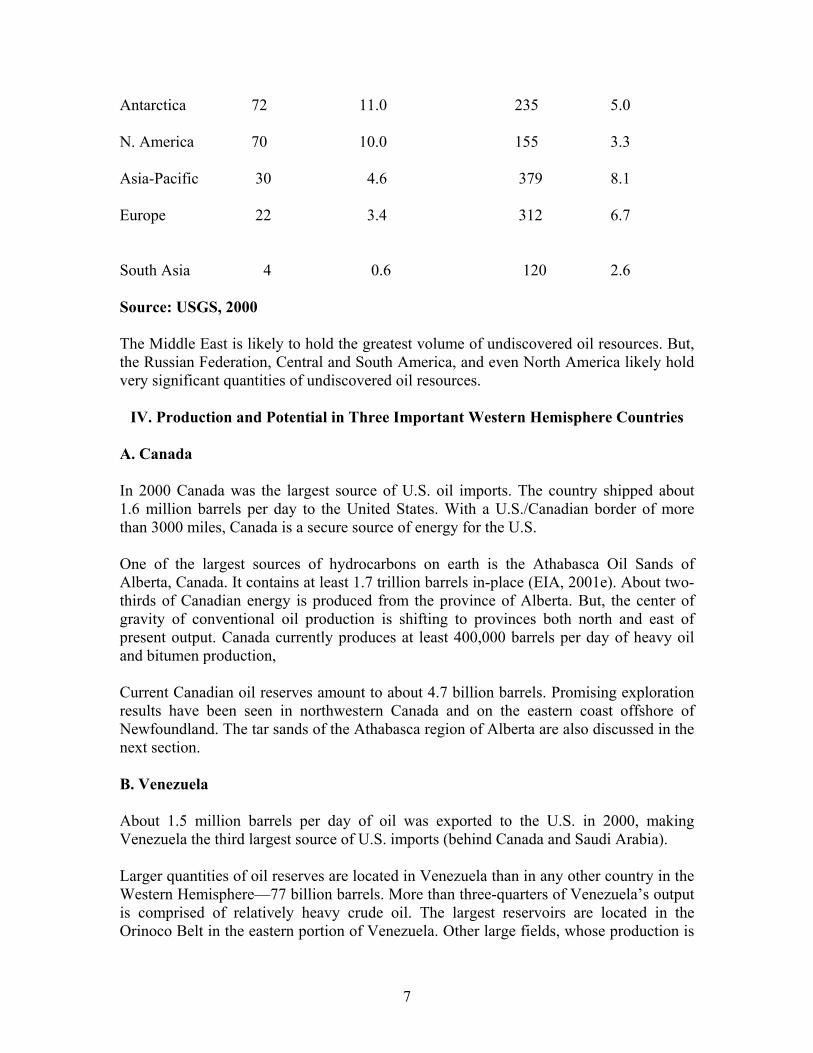
Antarctica 72 11.0 235 5.0 N. America 70 10.0 155 3.3 Asia-Pacific 30 4.6 379 8.1 Europe 22 3.4 312 6.7 South Asia 4 0.6 120 2.6 Source: USGS, 2000 The Middle East is likely to hold the greatest volume of undiscovered oil resources. But, the Russian Federation, Central and South America, and even North America likely hold very significant quantities of undiscovered oil resources.
IV. Production and Potential in Three Important Western Hemisphere Countries
A. Canada In 2000 Canada was the largest source of U.S. oil imports. The country shipped about 1.6 million barrels per day to the United States. With a U.S./Canadian border of more than 3000 miles, Canada is a secure source of energy for the U.S. One of the largest sources of hydrocarbons on earth is the Athabasca Oil Sands of Alberta, Canada. It contains at least 1.7 trillion barrels in-place (EIA, 2001e). About two-thirds of Canadian energy is produced from the province of Alberta. But, the center of gravity of conventional oil production is shifting to provinces both north and east of present output. Canada currently produces at least 400,000 barrels per day of heavy oil and bitumen production, Current Canadian oil reserves amount to about 4.7 billion barrels. Promising exploration results have been seen in northwestern Canada and on the eastern coast offshore of Newfoundland. The tar sands of the Athabasca region of Alberta are also discussed in the next section. B. Venezuela
About 1.5 million barrels per day of oil was exported to the U.S. in 2000, making Venezuela the third largest source of U.S. imports (behind Canada and Saudi Arabia). Larger quantities of oil reserves are located in Venezuela than in any other country in the Western Hemisphere—77 billion barrels. More than three-quarters of Venezuela’s output is comprised of relatively heavy crude oil. The largest reservoirs are located in the Orinoco Belt in the eastern portion of Venezuela. Other large fields, whose production is
7

often shipped to U.S. Gulf Coast refineries, are located in the Lake Maricaibo region (in the northwest portion of the country). As was the case with Mexico, Venezuela’s oil industry was nationalized in 1975-76. In recent bidding for exploration and development rights on new tracts, several U.S. energy companies won new tracts for development, including Chevron, Phillips, ARCO, Union Texas, and Pennzoil. Enhanced oil recovery projects in the country are discussed in the next section. C. Mexico In 2000, Mexico supplied about 1.0 million barrels per day of oil to the U.S., making it the fourth largest source of U.S. oil imports (behind Canada, Saudi Arabia, and Venezuela). And, the United States’ southern neighbor is owner of very substantial additional oil resources. Mexico’s location ensures a secure energy source for the U.S. After Venezuela, Mexico has the second largest proven crude oil reserves in the Western Hemisphere, amounting to about 27 billion barrels. Mexico is also the fifth largest crude oil producer in the world, behind the U.S., Saudi Arabia, Russia, and Iran. (DOE/EIA, 2002a). Mexico is not a member of OPEC. Despite the huge oil reserve base, PEMEX (Mexico’s national oil monopoly) has repeatedly invested lower-than-optimal amounts for constructing additional oil production infrastructure. This lack of investment has meant that Mexican oil production will not grow appreciably in 2002. However, the most current budget for the Mexico’s oil giant includes the largest annual increase in investment over the last twenty years (DOE/EIA, 2002a). This funding increase could foreshadow significant future oil production growth. Primary oil-producing fields in Mexico are Cantarell, Abkatun, Ku, Caan, Pol, and Chuc. Most of this country’s production is located in the Campeche Bay of the Gulf of Mexico. One of the more promising areas for further exploration is the Sihil field, located underneath the Cantarell field. Preliminary estimates indicate that it may hold as much as 1.4 billion barrels of oil and associated natural gas.
V. Enhanced Oil Recovery (EOR)
With a target of at least 300 billion barrels, enhanced oil recovery represents the single largest source of future U.S. oil supply. And, because the location of the oil is usually known and it is sited within or close to oil-producing infrastructure, this category of oil supply has the potential to be the least disruptive to the environment. Compared with hypothesized production of 3-9 billion barrels of potential production from the Arctic Refuge, enhanced oil recovery represents the largest source of oil in the U.S.
8

This section defines EOR terminology, examines the size of potential EOR oil production in the U.S. and elsewhere, and presents some examples of current EOR technologies and projects. A. Definitions Oil field development and production typically is characterized by a series of technologies that change over time as the oil field development matures. One of the determinants of the cost effectiveness of an oil reservoir is the amount of “natural lift”. Newly discovered oil fields often contain large underground pressures that help force the oil (and gas) to the surface. These pressures are caused by the tremendous weight of the overlying rock and water columns on the deeply buried reservoir. Natural gas, dissolved in the oil and present in gaseous form, also contributes to a reservoir’s “natural lift.” One of the more extreme examples of an oil well with abundant natural lift is the popular image of a “gusher”, or a well that spews vast volumes of oil skyward. A famous example of a gusher is the Potrero del Llano well No. 4 of the Mexican Eagle Oil company in the “Golden Lane” of Mexico. It flowed continuously from at least 1910 to 1967. When the well was first completed in December of 1910, it had an initial flow of 100,000 barrels per day. It then got out of control and flowed almost 2,000,000 barrels of oil, most of which was wasted, before it could be gotten under control (Independent Petroleum Association of America, 1949). As the oil is removed from the reservoir the original pressures that helped push the oil to the surface dissipate. At this point, the natural lift provided by the reservoir is usually augmented by “artificial lift” often provided by oil pumps (usually powered by natural gas, steam, or electricity). Most oil fields in the U.S. use some type of artificial lift in the oil production process. The types of oil production described above are considered primary production. Additional techniques used to supplement the natural lift and pumping are called secondary-production methods. One example of secondary recovery is re-injecting the produced gas back into the well to increase reservoir pressure. Another secondary recovery technique is called waterflooding. Additional pressure is created in the reservoir by injecting water down wells in specific configurations. For instance, one common method of secondary production is to inject water down oil wells on the periphery of an oil field to force the remaining oil towards the center of the field where more centrally located wells can produce it. Yet another class of even-more sophisticated techniques of coaxing more production out of oil fields is called tertiary recovery, or enhanced oil recovery (EOR). Some of the more exotic-sounding EOR technologies are called micellar surfactant, steam polymer, miscible hydrocarbon, CO2, and steam soak.
9

Generally speaking, EOR methods are centered on at least two different concepts; (1) using advanced geophysical and other information-gathering techniques to obtain a much better picture of the specific location of the remaining oil, and (2) using additional recovery agents such as chemicals, gases, or others to remove additional oil that was left behind after primary and secondary recovery. C. Enhanced Oil Recovery (EOR) Production and Targets At the conclusion of primary and secondary recovery techniques, the percentage of total oil recovered is typically in the range of 5 to 40 percent. Some of the more outstanding fields may recover as much as 50 percent of the original oil in place, but that scale of recovery is unusual. That means that, prior to using EOR, at least half and perhaps as much as 90 to 95 percent of the underground oil still remains in virtually all oil fields in the world. The policy implications of this fact is that much more oil remains underground than the total amount that has been cumulatively produced in this country and elsewhere. This remaining oil is in identified oil fields that may still have (1) fully developed oil production and transportation infrastructures, (2) communities of skilled oil-field workers, and (3) oil-field-based economies. Figure 5 gives an indication of the size of prospective EOR targets in the U.S. In the U.S. alone there are as much as 300 billion barrels remaining in existing reservoirs (DOE, 1987). To put that number in perspective, the total amount of identified U.S. oil that can be produced at a profit (oil reserves) at the end of 2000 was about 29.7 billion barrels (BP, 2001). At year 2000 consumption rates, 300 billion barrels would last this country about 105 years (using ratios found in BP, 2001). The total amount of U.S. crude oil and equivalent production from 1949 to 2000 was about 181.8 billion barrels (EIA, 2001g). Assuming a 3.2 billion-barrel find in the Arctic National Wildlife Refuge (ANWR), the size of the EOR target is almost 100 times larger. That is not to say that all 300 billion barrels, or even one-half of it would necessarily be economically producible. But, even an additional 10 percent recovery of the EOR target would result in more oil than the total current oil reserves of the nation (30 billion barrels). And, a one percent additional recovery would approximately equal the expected economic recovery of oil from the Arctic Refuge. The DOE is not alone in highlighting the importance of EOR. A spokesman for the Organization of Arab Petroleum Exporting Countries (OAPEC) said that “[m]ost experts believe that at least an additional 10% to 15% of discovered oil in place can be produced with EOR techniques, if costs can be justified.” And, that “too often, scenarios of reserves replacement neglect to account for reserves accessible by enhanced oil recovery… (OGJ, 2001c).” Recent reports give a total U.S. EOR production of about 748,000 barrels per day of production—representing about 12 percent of total U.S. oil output (OGJ, 2000a).
10

Venezuela, Canada, Indonesia, and China also have very significant EOR production. This EOR production and expansion activity has taken place despite recent relatively low oil prices.
Technically Recoverable Oil Another way to estimate of the size of potential EOR production can be derived from EIA estimates of discovered and undiscovered technically recoverable oil. Technically recoverable oil is that which can be produced using known technologies, regardless of cost. This category of oil should not be confused with economically recoverable resources (also known as reserves). Only economically recoverable oil resources will ever be commercially produced. But as technology improves, the proportion of technically recoverable oil that can be economically produced will grow. The EIA estimates that we have discovered about 78 billion barrels of conventional oil and natural gas liquids (similar to crude oil) that is technically producible. But, only about 30 billion barrels of that amount can be recovered with current oil prices. The remaining 48 billion barrels remains as a target for future technology improvements and/or higher oil prices. Using sophisticated statistical analysis, the U.S. Geological Survey estimates that future exploration efforts in the United States will likely turn up an additional 89 billion barrels of oil and natural gas liquids. Collectively, these discovered and undiscovered resources amount to about 142.6 billion barrels of oil (EIA, Table 4.1 Technically Recoverable Petroleum Resource Estimates, Jaunary 1, 2000). C. Examples of Existing EOR Technologies and Targets
Enhanced Information-Gathering Technologies A. Dynamic Elastic Nonlinearity Measurements - Getting more of the oil out of oil fields is not only a function of more efficient oil production technologies, it is also a function of more detailed reservoir information. Pin-pointing the oil-rich and oil-poor portions of reservoirs is an important factor in getting the greatest oil recovery. Lacking specific data on the distribution of oil in a field, an oil producer might space expensive EOR wells uniformly. But, oil distribution in oil fields is not usually uniform. There are areas that are more oil-rich are not. Different parts of the reservoir also have greater permeability than others. More permeable areas are much more amenable to enhanced oil recovery. In the past, many geologic models of reservoirs assumed that the rocks were relatively uniform. This assumption was based partly on the lack of specific information about reservoir properties, and partly on the fact that, even if more detailed rock property data were available, the computers of past eras might not have enough computational horsepower to use the additional information effectively.
11
Additional research has shown that rock fracturing and fluid-flow is very non-uniform. And, fractures are often one of the most important fluid-flow controls in a reservoir. A better understanding of fractures leads to a better understanding of the dynamics of extracting oil from the reservoirs (OGJ, 2001d). Using new and modified seismic methods such as dynamic elastic nonlinearity measurements, geologists can map reservoir properties with more resolution and greater confidence. This helps to find critical information such as oil reservoir permeability, fractures, and the composition of pore fluids. The result is that oil producers can use this additional information to more efficiently extract remaining oil from existing reservoirs.
Enhanced Oil Production (EOR) Technologies for Conventional Oil Carbon Dioxide (CO2) flood – Carbon dioxide flooding is the predominant technology used for EOR in the U.S. Carbon dioxide is pumped into the existing oil field. The injected CO2 dissolves in the underground crude oil, thereby reducing oil viscosity, increasing the volume of the oil, and forcing more oil towards production wells. This is called a miscible displacement technology. Expected additional oil recovery for favorable projects typically ranges from 7 to 15 percent of original oil in place. Advances in computer simulation and additional operating experience have led to decreased development costs and more favorable carbon dioxide flood project economics (OGJ, 2001a).
Carbon dioxide is also the most important greenhouse gas, the primary culprit identified in global warming studies. Carbon dioxide flood projects that derive the gas from above-ground sources can help lower atmospheric CO2 levels and sequester it underground, while at the same time boosting oil recovery.
One of the key economic criteria for using this technology is carbon dioxide availability. Currently, there are several large sources, including the Bravo Dome in Texas and New Mexico, Jackson Dome in Mississippi, Sheep Mountain and McElmo Dome in Colorado, the LaBarge gas processing facility in Wyoming, the Great Plains Coal Gasification Plant in North Dakota, the Ridgeway discovery in Arizona, and an ammonia plant in Oklahoma (OGJ, 2001a). The initial force behind current CO2 projects can be traced to incentives contained in the Crude Oil Windfall Profit Tax Act of 1980. The legislation preferentially taxed some EOR project profits at 30 percent, compared with a conventional crude oil profit tax of 70 percent (OGJ, 2001a). Current CO2 flood EOR projects include several in Texas’ Permian Basin (formerly owned by Amoco and Shell). These projects, now operated by Oxy Permain, have increased oil production by 8,000 barrels of oil per day, resulting in a current total daily production of 165,000 barrels of oil per day.
12

Other current U.S. carbon dioxide flood projects include Cogdell Canyon Reef Field, Central Slaughter Field, SAROC Field, and many other Permian Basin fields in western and northwestern Texas. Ten counties in the central portion of Kansas have produced more than 2.4 billion barrels of oil (out of the 6 billion barrels ever produced in the state). Most oil production efforts in this very mature province are approaching their economic limits, and are therefore in danger of being abandoned. According to some estimates, CO2 flood may help in recovering additional oil estimated to be in the hundreds of millions of barrels (OGJ, 2000b). DOE is sponsoring a CO2 injection project (Hall-Gurney Project) into a Lansing-Kansas City reservoir that was first developed in the 1930s and 1940s. This reservoir has already been subject to very thorough primary and secondary production. Other possible fields in Kansas that could benefit from CO2 flooding are those that tap the Arubuckle and Morrow Formations of central Kansas. Additional candidates for carbon dioxide flood include the Rangely Field in Colorado, the Lost Soldier, Wertz, Salt Creek, Lance Creek, and Mush Creek Fields in Wyoming, numerous other oil fields in Wyoming’s Oregon and Elk Basins, and the Bell Creek Field in Montana. In Mississippi, the Jackson Dome carbon dioxide source is being used for EOR recovery in the Little Creek field. The field has a breakeven price of only $12.75 per barrel (OGJ, 2001b). The operator of the Little Creek field claims “…as much as 1 billion barrels of incremental oil that might be recovered through the use of CO2 flooding, making Louisiana the ‘Arctic National Wildlife Refuge of the south’ (OGJ, 2001b).” Yet another prominent example of CO2 flood recovery is seen in the San Joaquin Basin of California. Because of poor reservoir characteristics such as poor permeabilities, poorly-developed fractures, and a complex geology, oil fields in this southern California basin have produced only about 6.5 percent of the oil, out of an estimated 2.6 billion barrels of oil in place (OGJ, 2000c). Microbial-Enhanced Oil Recovery (MEOR) – The most common use of this technology injects specific types of microbes down into existing wells. The microbes stimulate the production of additional oil at least two ways; (1) increasing the well pressure by producing gases such as carbon dioxide, nitrogen, hydrogen, and methane that, and (2) removing heavy, waxy buildups of petroleum compounds that tend to clog well bores. Oftentimes the microbes are injected with nutrients (e.g., molasses) so that they can metabolize and reproduce for longer periods of time and for greater distances from the well bore. This technology has been used at least since the 1950s and 1960s in Czechoslovakia, Poland, Hungary, and the USSR. The National Institute for Petroleum and Energy Research in Bartlesville, Oklahoma estimated that 27 percent of U.S. oil reservoirs would be amenable to using microbial techniques (OGJ, 1991).
13

Stripper wells (wells that produce very small quantities of oil) are particularly amenable to this technology. About 40 percent of daily U.S. oil production is derived from stripper wells. And, these wells are the most likely to be abandoned due to their low production. Because of high re-startup costs on abandoned wells, further oil production is much less likely to occur, even with new technological advances. One company that uses this technique has estimated that 2,500-3,000 wells have been treated with microbes, not including treatments of production tanks and barges. About 50 percent of the time oil production increases have occurred—with increases in total fluid ranging from 10 to 100 percent.
Enhanced Oil Production (EOR) Technologies for Unconventional Oil
Heavy Oil and Tar Sands Production – Hydrocarbon deposits that may be encountered underground span the gamut from very light gases, such as natural gas, to very heavy deposits, such as naturally occurring asphalt. Refineries use “cracking” techniques to convert the typically less valuable heavier and more viscous products such as asphalt and “heavy oils” to the more valuable and lighter petroleum products such as gasoline. But, heavier and more viscous hydrocarbons are usually much more difficult to coax out of their underground reservoirs than lighter crude oils. These heavier hydrocarbons are known by many names—e.g., heavy oil, tar sands, asphalt, heavy bitumen. They are all related to one another by the fact that all contain hydrocarbons and all tend to be very viscous, or even solid at room temperature. As a result, even though some of the largest known deposits of hydrocarbons on earth are made up of heavy hydrocarbons, production of them has been limited by cost. Two examples of enormous deposits of heavy hydrocarbons are; (1) the Athabasca Oil Sands of Alberta, Canada—holding at least 1.7 trillion barrels in-place (EIA, 2001e). Canada currently produces at least 400,000 barrels per day of heavy oil and bitumen production, and; (2) The Orinoco Belt of oil sands in Venezuela—containing at least 1.2 trillion barrels of oil in-place, with the economically recoverable portion amounting to at least 267 billion barrels (EIA, 2001f). Venezuela currently has 500,000 barrels per day of heavy oil production. The U.S. also has some very large concentrations of unconventional hydrocarbons. Large parts of southern California (e.g., Kern River Basin) are underlain by huge deposits of heavy oil. Another very large heavy oil deposit is the Kuparak Field on the North Slope of Alaska. This field, containing more than 20 billion barrels of oil in place actually overlies the major conventional oil-producing field at Prudhoe Bay. These heavier unconventional hydrocarbon resources can often be refined into more conventional petroleum products, but often their extraction and processing costs may be large. Counter-balancing their greater extraction costs is the sheer size of the resource. Even if only a small fraction of the resource in the ground can be extracted, the produced quantity may be enormous.
14
Steam-Assisted Gravity Drainage (SAGD) – Based on the fact that the viscosity (resistance to flow) decreases with higher temperatures, steam-assisted gravity drainage (SAGD) is used to tap into the vast Athabasca oil sands in Alberta, Canada. Steam is introduced in wells to allow the hydrocarbons to flow downwards and be captured in horizontal wells drilled below. Related technologies use steam and other gases to increase recovery. Many projects are in place and on the drawing board. Recovery rates greater than 50 percent have been realized with some of the projects (OGJ, 2001e). Athabasca projects are reported to cost less than $10 per barrel (not including fuel cost for generating steam). Some estimate that heavy oil production in the region will reach 1.5 million barrels per day by 2010, with some of that output produced by surface mining (OGJ, 2000a). The volumes of oil that might be recovered by EOR from identified fields dwarfs virtually all new potential new oil field discoveries such as oil that might be found in the Arctic National Wildlife Refuge. In addition to the much larger volumes EOR production would most likely occur in areas that already have a well established oil production infrastructure and a trained workforce already in place.
VI. Conclusions With a target of at least 300 billion barrels, enhanced oil recovery represents the single largest supply of future U.S. oil. And, because the location of the oil is usually known and it is sited within or close to oil-producing infrastructure, this category of oil supply has the potential to be the least disruptive to the environment. Compared with hypothesized production of 3-9 billion barrels of potential production from the Arctic Refuge, enhanced oil recovery represents the largest source of oil in the U.S. While Middle Eastern countries have very large reserve/production (R/P) ratios, there are many Western Hemisphere, European, and Asian countries with healthy R/P ratios—signifying large oil reserves. In addition to the Middle East, the Russian Federation, Venezuela, and Mexico all are expected to continue to have large oil exports to the U.S. The majority of U.S. oil imports do not come from Saudi Arabia, or even from Persian Gulf sources. Canada was the largest single U.S. oil imports source in 2000, followed by Saudi Arabia, Venezuela, and Mexico. Persian Gulf oil represented only 11 percent of U.S. consumption in 2000. While U.S. oil production has been inching downwards since the late 1980s, from 1993 to 2000 increases in Canadian and Mexican production have meant that total North American oil production was constant. The largest gains in oil output during that period were seen in South and Central America, followed by Europe, and the Middle East. U.S. neighbors Canada and Mexico have very substantial conventional and unconventional oil production, with very good prospects for increasing production in the future. Neither Canada nor Mexico are members of OPEC.
15

Venezuela, another major source of U.S. oil imports, has the largest oil reserves of any country in the Western Hemisphere—77 billion barrels. In addition, the country has even larger deposits of heavy oil, much of which may be economically recoverable in the near future. Most of U.S. oil production and reserves are located in PAD Districts 3 and 5—with the largest concentrations in the states of Texas, Alaska, California, Louisiana. The share of oil production from federal lands has risen by almost 50 percent in the last decade, mostly from deepwater Gulf of Mexico sources. Enhanced oil recovery (EOR) is the term for the technologies used after primary (natural lift and pumping), and secondary (gas re-injection) recovery techniques. After primary and secondary recovery has ended, most oil fields still have not produced even one-half of the original in-place oil. EOR technologies are those that may be used to (1) increase the information about reservoirs, or (2) increase recovery rates of reservoirs. EOR sources of oil are superior to new oil fields in many cases because additional production from existing fields may still have (1) fully developed oil production and transportation infrastructure, (2) communities of skilled oil-field workers, and (3) oil-field based economies. DOE claims that 300 billion barrels of oil in existing fields in the U.S. may be the target of EOR efforts. Compare this to a cumulative U.S. oil production from 1949 to 2000 of 181.8 billion barrels, and current U.S. oil reserves of 29.7 billion barrels. Just one percent of this EOR target roughly equals all expected economically recoverable oil from the Arctic National Wildlife Refuge (ANWR). Of course not all, or even half, of the 300 billion barrel target is likely to be ultimately produced. But current and projected near-term future EOR technologies show great promise. Existing U.S. oil fields, especially those in the West and Southwest, are prime targets for getting much more oil out of reservoirs that are on the verge of shutdown. EOR is also being used on this country’s large unconventional oil resources. Heavy oil, tar sands, asphalt, and shale oil are some of the other commodities that this nation has in abundance to satisfy energy needs. The largest heavy oil and tar sands resources in the world are located in two Western Hemisphere countries—Canada and Venezuela. More than 1.7 trillion barrels are known in the Athabasca Formation of Canada, and 1.2 trillion barrels of oil in-place in the Orinoco Belt of Venezuela. Recovery of even a fraction of these unconventional hydrocarbon resources would further increase already substantial Western Hemisphere oil sources. In conclusion, the United States has enormous amounts of hydrocarbons available from conventional existing reserves, EOR projects, and unconventional sources. The U.S. is also blessed with having the petroleum-rich countries of Canada and Mexico as
16

immediate neighbors, as well as being in close proximity to the huge hydrocarbon deposits of Venezuela.
VII. References
British Petroleum (BP), June 2001, Statistical Review of World Energy. Independent Petroleum Association of America, Monthly, August 1949, p. 49. Department of Energy (DOE), 1987, Energy Security: A Report to the President of the
United States, p. 91. Department of Energy – Energy Information Administration, (EIA), 2001a, Petroleum
Supply Annual, Volume 1, Production of Crude Oil by PAD District and State, Table 14.
DOE/EIA, 2001b, Annual Energy Review 2000, Fossil Fuel Production on Federally
Administered Lands, 1949-1999, Table 1.14. DOE/EIA, 2001c, Petroleum Supply Annual, Volume 1, Imports of Crude Oil and
Petroleum Products into the United States by Country of Origin, 2000, Table 21. DOE/EIA, 2001d, United States of America: Country Analysis Brief, October 2001. DOE/EIA, 2001e, Canada: Country Analysis Brief, February 2001. DOE/EIA, 2001f, Venezuela: Country Analysis Brief, March 2001. DOE/EIA, 2001g, Annual Energy Review, Table 5.1, Petroleum Overview. DOE/EIA, 2002a, Mexico: Country Analysis Brief, January 2002. Oil and Gas Journal (OGJ, 1991), April 15, 1991, “MEOR Screening Criteria Fit 27% of
U.S. Oil Reservoirs.” Oil and Gas Journal (OGJ, 2000a), March 20, 2000, “EOR Weathers Low Oil Prices.” Oil and Gas Journal (OGJ, 2000b), June 5, 2000, “Economics show CO2 Potential in
Central Kansas.” Oil and Gas Journal (OGJ, 2000c), September 25, 2000, “San Joaquin Basin is Scene of
New Effort to Evaluate EOR in Monterey.” Oil and Gas Journal (OGJ, 2001a), May 14, 2001, v. 99.20, “New Companies,
Infrastructure, Projects Reshape Landscape for CO2 EOR in US”, p. 68-74.
17
Oil and Gas Journal (OGJ, 2001b), October 22, 2001, “Denbury Resources Sustains Growth Through CO2 Flood, Workovers.”
Oil and Gas Journal (OGJ, 2001c), October 23, 2001, “Energy Congress Told Deep
Offshore Basins will be Key to Future Supplies.” Oil and Gas Journal (OGJ, 2001d), September 10, 2001, “Can We Use Dynamic Elastic
Nonlinearity Measurements of Rocks to Map Reservoir Properties.” Oil and Gas Journal (OGJ, 2001e), May 14, 2001, “Application of SAGD, Related
Processes Growing in Canada.” U.S. Geological Survey (USGS), 2000, USGS World Petroleum Assessment 2000.
18

Figure 1
U.S. Oil Production by Region, 2000
MIDWEST 8.2%
TX,AR,LA,MS,NM 55.2%
AK,AZ,CA,NV 31.1%
FL,NY,PA,VA,WV 0.4%
CO,MT,UT,WY 5.2%
More than 85 percent of U.S. oil production came from two EIA regions. The states with the largest oil output in 2000 were Alaska, Texas, California, Louisiana, New Mexico, and Oklahoma.
Source: DOE/EIA, 2001, Petroleum Supply Annual 2000, Volume 1, Table 14.
Prepared by Lookout Mountain Analysis for Alaska Coalition
19

Figure 2Oil Production from Federally Administered Lands
1991-1999 Since 1991, oil production from U.S. federally administered lands has increased by morethan 20 percent. Federal land’s share of total U.S. oil output has grown by more than 50 percent—from 20 to almost 30 percent of total U.S. oil production.
0
100,000
200,000
300,000
400,000
500,000
600,000
700,000
1991 1992 1993 1994 1995 1996 1997 1998 1999
Year
Thou
sand
s of
Bar
rels
0%
5%
10%
15%
20%
25%
30%
35%
Perc
ent o
f U.S
. Oil
Out
put
Note: Federal lands includes onshore and offshore Federal lands and acquired military lands.
Source: DOE/EIA, 2001, Annual Energy Review 2000, Table 1.14. Prepared by Lookout Mountain Analysis for Alaska Coalition
20

Figure 3U.S. Crude Oil Imports by Country, 2000
In 2000, Canada and Mexico each supplied almost as much crude oil imports as Saudi Arabia.
0 100 200 300 400 500 600
Million Barrels
Other
Nigeria
Iraq
Saudi Arabia
Norway
United Kingdom
Venezuela
Colombia
Mexico
Canada
Coun
try
North and South American countries supplied much more crude oil to the U.S. than Arab OPEC countries.
Source: DOE/EIA, 2001, Petroleum Supply Annual, 2000, Volume 1, Table 21.
Prepared by Lookout Mountain Analysis for Alaska Coalition
21

Figure 4 Changes in Oil Production 1993 - 2000
From 1993 to 2000, U.S. oil production decreased by 10 percent. But, North American output was constant during the period due to increases in Canadian and Mexican oil output. Both Non-OPEC and OPEC oil production increased by 15 percent during the period. Total South and Central American oil output grew by 36 percent, and European by 29 percent, even as petroleum from the former Soviet countries shrank by 2 percent.
-10%
24%
10%
0%
30%
92%
54%
14%
25%
36%38%
73%
29%
-9%
52%
-2%
2%
17%15% 15%
-20%
0%
20%
40%
60%
80%
100%US
Can MexN A
m
Arg Bra Col Ecu VenS C
Am
Nor UK Eur Rus KazEx S
ov SauM E
ast
Non O
PECOPEC
Region
Cha
nge
in O
il Pr
oduc
tion
Source: BP, June 2001, BP Statistical Review of World Energy.
Prepared by Lookout Mountain Analysis for Alaska Coalition
22

23
Figure 5Potential Sources of Domestic U.S. Oil
Although it is not likely that even one-half of the 300 billion barrels of identified oil in existing reservoirs would ultimately be produced, just one percent of
300.0
181.8
29.7
3.20
50
100
150
200
250
300
350
U.S. EOR Target inExisting Reservoirs
Total U.S. Oil Output1949-2000
2000 U.S. Oil Reserves Expected EconomicallyProducible Arctic Refuge
Category
Bill
ions
of b
arre
ls o
f oil
additional production is roughly equivalent to expected economically producible Arctic Refuge oil production. And, 10 percent recovery from the EOR target would be more than the total year 2000 U.S. oil reserves.
Sources: EOR Target: DOE, 1987, Energy Security: A Report to the President of the U.S., p. 91. U.S. Oil Output, 1949-2000: derived from EIA, 2001,Annual Energy Review, Table 5.1, Petroleum Overview. 2000 U.S. Oil Reserves: BP, June 2001, BP Statistical Review of World Energy, p. 4. Expected Economically Producible Arctic Refuge Oil Production, USGS, 1999, The Oil and Gas Resource Potential of the Arctic National Wildlife Refuge 1002 Area, Alaska.
Prepared by Lookout Mountain Analysis for Alaska Coalition