Embed Size (px)
Citation preview

Source Rock Distributions and Petroleum
Fluid Bulk Compositional Predictions on the Vulcan Sub-Basin,
Offshore Western Australia
Volkmar Neumann Rolando di Primio Brian Horsfield
GeoS4 GmbH Peter-Huchel-Chaussee 88
14552 Michendorf Germany

Address: Telephone: Telefax: e-mail:
GeoS4 GmbH Peter-Huchel-Chaussee 88 14552 Michendorf Germany +49 3320523861 +49 3320523862 [email protected]
Report Number: GeoS4 20081201 Report Title: Source Rock Distributions and Petroleum Fluid
Bulk Compositional Predictions on the Vulcan Sub-Basin, Offshore Western Australia
Author: V. Neumann, R. di Primio, B Horsfield Classification: Confidential Client: Geoscience Australia Client Reference: Distribution: Geoscience Australia GeoS4 GmbH
1 + CD 1 + CD
V. Neumann R. di Primio B. Horsfield
ii

Source Rock Distributions and Petroleum Fluid Bulk Compositional Predictions on the Vulcan Sub-Basin, Offshore Western Australia’
Disclaimer
This report was prepared as an account of work sponsored by Geoscience Australia. Neither GEOS4 GmbH, nor its employees, make any warranty, expressed or implied, or assumes any legal liability or responsibility for the accu-
racy, completeness, or usefulness of the information given here. Any references given here to any specific commer-cial product other than the ones offered by Geos4 GmbH do not necessarily constitute or imply its recommendation
or favouring by GEOS4 GmbH.
iii

Introduction..................................................................... 5 Input Data....................................................................... 6
Data Base.................................................................................... 6 Source Rocks ............................................................................... 9 Seal Properties............................................................................14
Description of Modelling Scenarios .....................................15 Simulation ......................................................................16 Results...........................................................................17
Scenario 1 ..................................................................................21 Scenario 2 ..................................................................................28 Scenario 3 ..................................................................................34 Scenario 4 ..................................................................................41 Scenario 5 ..................................................................................46
Summary and Conclusions ................................................50 References .....................................................................55 Appendix 1 .....................................................................57
Compositional Kinetic Models......................................................................... 57 Cumulative Volumes .................................................................................... 60
Appendix 2 .....................................................................62 Comparison of petroleum physical property predictions of 4-compound and PhaseKinetic models .................................................................................... 62 Methodology and background information on the PhaseKinetics approach. ........... 66
iv

5
Introduction
The Vulcan Sub-basin is a northeast-southwest aligned Late Permian to Jurassic extensional
depocenter in the western offshore Bonaparte Basin, located in the Timor Sea on the NW
Australian margin, some 600 kilometres west of Darwin, within water depths of mostly less
than 200 metres. Its major grabens are the Swan Graben and the Cartier Trough (Figure 1,
Figure 3). The basin contains producing and decommissioned oil fields as well as currently
undeveloped oil and gas discoveries. The organic rich Late Jurassic Vulcan Formation is the
main hydrocarbon source rock of the Vulcan Sub-basin. The Plover Formation of Early to
Middle Jurassic age can be seen as a secondary potential source. Based on earlier basin
modelling results Geoscience Australia identified a need to predict the occurrence of petro-
leum, its composition as well as the distribution and type of organic matter in source kitch-
ens in the Vulcan Sub-basin. This definition has to be in a form that can be directly trans-
lated into quantitative predictions of oil and gas volumes in time and space.
The Vulcan Sub-basin was subject of intensive basin modelling work, which was carried out
using the PetroMod™ version 9 2D/3D basin modelling package. The software is based on a
forward modeling approach to calculate the geologic evolution of a basin, starting at the
oldest and finishing at the youngest event, using the present as key to the past (Yalcin et
al., 1997). A detailed review of the IES basin modelling software and its concepts is given in
the PetroMod™ reference manual (Hhttp://www.iesgmbh.eu H). The results of the modelling
were published by Fujii et al. (2004), and while their model calibration showed a very good
match for the thermal regime, it fails to reproduce the composition and location of many
hydrocarbons which have accumulated within the modelled area of the Vulcan Sub-Basin.
This is basically a consequence of the kinetic data sets which have been used as well as the
geographic distribution of the main source rock intervals within the basin. This cooperation
between Geoscience Australia (GA) and GeoS4 GmbH (Germany) was initiated in order to
conduct a regional investigation of ‘Source Rock Distribution and Petroleum Fluid Bulk Com-
positional Predictions on the Vulcan-basin, offshore Western Australia’. This work forms an
integral part of continuing studies by Geoscience Australia on the petroleum potential of the
North-West shelf.
GA provided a thermally calibrated 3D basin model, which had been modelled with the basin
modelling software suite PetroMod™ version 9 of IES Germany. This model was used for
this study as a basis for testing a variety of scenarios on
• the geographic distribution of different source rock sequences
• the petrophysical properties of the assigned cap rocks
• the relative input of the individual source rock sequences on the total petroleum
generated (oil families of Edward et al., 2004)
Furthermore, the supplied data set included
• an extensive report data base (general overview papers and special studies)
• calibration data (vitrinite reflectance, temperature, porosities) from several Vulcan
Sub-basin wells
• Vulcan well composites

Numerical modelling for this report was performed using the basin modeling program
PetroMod™ version 10, Patch 4 (IES, Germany).
Key References:
Fujii, T., O'Brien, G.W., Tingate, P.R., Chen, G., (2004) Using 2D and 3D basin modelling to investigate controls on hydrocarbon migration and accumulation in the Vulcan Sub-basin, Timor Sea, Northwestern Australia. APPEA Journal, 93-122.
Edwards, D.S., Preston, J.C., Kennard, J.M., Boreham, C.J., van Aarssen, B.G.K., Summons, R.E., Zumberge,
J.E., (2004) Geochemical characteristics of hydrocarbons from the Vulcan Sub-basin, western Bonaparte Basin, Australia. Special Publication - Northern Territory Geological Survey, 1, 31.
Cadman, S.J., Temple, P.R., (2003) Bonaparte Basin, NT, WA, AC & JPDA. In: Australian Petroleum Accumula-
tions Report 5, 2nd Edition, pp. 335. Geoscience Australia, Canberra.
Input Data
Data Base 127 exploration wells have been drilled in the greater Vulcan Sub-basin (Figure 1), resulting
in 23 discoveries; six encountered oil, nine encountered gas, and eight encountered both oil
and gas (Cadman & Temple, 2003). The majority of the exploration wells are located inside
the digital area of the numerical model (Figure 3). 26 wells contain calibration data sets
(temperature and vitrinite reflectance data) which were used in the previous studies for the
thermal calibration of the model. Results obtained in this study were checked against the
data sets in order to recognise variations in the quality of the thermal calibration, which
might occur as a function of the new lithological definitions which were assigned to the
sedimentary units in this study.
The original 3D model from Fujii et al. (2004), which is the basis for the modeling presented
here, was constructed using a map stack of 11 interpreted and depth converted seismic sur-
face maps. Their work was based on the interpretations of depth converted 2D seismic lines
as published by Chen et al. (2002). The original numerical modelling by Fujii in 2002 was
probably performed using the PetroMod version 8 (no reference is given), and then up-
dated, first to version 9, then, in the present study, to version 10, which is the latest ver-
sion.
The ASCII horizons and fault files were imported into the PetroMod™ software package.
6

7
Figure 1 Major tectonic elements, bathymetry and exploration wells in the Vulcan Sub-basin and adjacent ar-eas(Cadman & Temple, 2003).
In total, 15 sedimentary units were used for the definition of the numerical model. In
agreement with GA, the original Plover Formation was subdivided into five individual sub-
packages with the ratio of the original thickness as shown below.
• Plover_Sand: 10%
• Plover_SR: 9%
• Plover_Sand2: 60%
• Plover_Shale: 15 %
• Plover_Sand3: 6%
This subdivision is significantly different as compared to the original model of Fujii, who
subdivided the Plover Formation into a sandy reservoir interval in the uppermost 20% of its
thickness, and a shaly source rock interval for the rest. The subdivision was required as the
presence of such a thick Plover source rock unit is not expected.
However, both the subdivision as well as the distribution of especially the source rock unit is
highly speculative, as its distribution is only very poorly constrained by wells within the ba-
sin. For nearly all rock types of the original model PetroMod™ V.9 user-defined lithological
definitions were assigned. The definitions available in PetroMod™ V.10 show recognisable
variations as compared to the original definitions, in general the new lithological definitions
are more permeable as compared to the V.9 definitions. From the point of view of migration
and leakage the V.10 lithologies are better suited to reproduce vertical migration patterns.
Table 2 shows the definition of formation names and the assigned facies definitions for each
formation unit, Table 1 lists the formation names and the assigned rock types (all of them
are PetroMod™ defaults).
Note that the facies definitions available in PetroMod™ only describe its petrophysical prop-
erties and not its quality as a source rock. The source rock properties are defined via the

TOC and HI values, which are listed here in Table 4. Therefore, the prime source rock of the
Vulcan Sub-basin, which is L.Vulcan(sq4a) is defined here as an organic lean and sandy
shale, simply because the petrophysical properties of such a facies are closer to the facies
defined in the original model (Sandstone 20%, Shale 80%). In a test run, in which pure
shale properties were assigned to the Lower Vulcan source rock, only insignificant differ-
ences throughout space and time in terms of generated volumes (per Ma) were observed.
Table 1 Formation names and PetroMod™ default lithologies assigned for each formation unit.
Formation Name Facies Definition
Pliocene Limestone (shaly) Miocene Limestone (shaly) Eocene Limestone (shaly) Paleocene Limestone (shaly) U_Cret_(Puffin) Sandstone (clay rich) U_Creta_SS75% Sandstone (clay poor) U_Creta_SS50% Sandstone (clay rich) L_Cretaceous Shale (organic rich, typical) L_Creta_SS50% Sandstone (clay rich) U_Vulcan(sq-4c) Shale (organic lean, sandy) L_Vulcan_U(sq-4b) Shale (typical) L._Vulcan_L(sq 4a)_(Montarra) Shale (organic lean, sandy) L._Vulcan_L(sq-4a)_SW Shale (organic lean, sandy) Plover_Res Sandstone (typical) Plover_SR Shale (organic lean, sandy) Plover_nil-SR Sandstone (typical) M_Jura_and_Triassic Sand50Shale50
Table 2 Correlation of formation names ands facies definitions.
Deposition [Ma] Period
Formation Name from to
Facies 1 Facies 2 Facies 3
Pliocene 7 0 Pliocene NEOGENE
Miocene 34 7 Miocene
Eocene 56 34 Eocene PALAEOGENE
Palaeocene 65 56 Palaeocene
U_Cret_Puffin 100 65 U_Cret_(Puffin) U_Creta_SS75% U_Creta_SS50% CRETACEOUS
L_Cretaceous 136 100 L_Cretaceous L_Creta_SS50%
U_Vulcan(sq 4c) 144 136 U_Vulcan(sq-4c)
L_Vulcan_U(sq4b) 150 144 L_Vulcan_U(sq-4b) L._Vulcan_L(sq 4a)_Montarra
163 150 L._Vulcan_L(sq 4a)_(Montarra)
L._Vulcan_L(sq-4a)_SW
Plover_Sand1 163.9 163 Plover_Res
Plover_SR 164.71 163.9 Plover_SR
Plover_Sand2 169.96 164.71 Plover_Res
Plover_Shale 171.27 169.96 Plover_nil-SR
Late - Middle JURASSIC
Plover_Sand3 172 171.27 Plover_Res
M_Jura and Triassic 250 172 M_Jura_and_Triassic
8

9
Source Rocks Edwards et al. (2004) investigated the geochemical characteristics of the hydrocarbons from
the Vulcan Sub-basin. In summary (Table 3), they recognized two groups (Group A and B)
of oils and condensates, and three groups of gases (Groups 1, 2 and 3) from their isotopic
profiles. The hydrocarbons are derived from at least two petroleum systems:
• Group A - Lower Vulcan source rock: The Late Jurassic marine Lower Vulcan For-
mation, the main source for most of the petroleum accumulations in the Vulcan
Sub-basin (Edwards et al., 2004; Kennard et al., 1999)
• Group B - Plover source rock: The coal-rich Early to Middle Jurassic Plover Forma-
tion, which is thought to be the secondary source rock in the Vulcan Sub-basin. At
the flanks of the Cartier Trough the formation contains organic-rich mudstones
with fair to very good source properties (Edwards et al., 2004).
Well data from Leewin, Tenacious, Audacious, Padthaway, Crux and Bilyara were not sup-
plied by GA for the numerical model; their locations are shown in Figure 3. Note that the
other figures do not show those locations, as the data for those wells was added upon re-
quest by GA after modelling.
Table 3 Vulcan Sub-basin source-related petroleum groups (Edwards et al., 2004). More wells which are not listed here have hydrocarbon shows. g/c: gas & condensate; g/o: gas & oil.
Well/Field HC Gas Group
Oil Group
°API GOR (scf/stb)
Inferred source rock
Leeuwin-1 gas 1 ? ? ? unknown
Swan-1,3 gas 1 A+? 40-55 ? Lower+Upper Vulcan? Tahbilk-1(2,690.2m)
g/c 1 A ? ? Lower Vulcan+Plover?
Cassini-1 g/o 2 A 40 250 Lower Vulcan
Tahbilk-1(2,305m) g/c 2 A ? ? Lower Vulcan
Skua-2,3,4,5,8,9 g/o 2 A ? 700-2000 Lower Vulcan
Birch-1ST1 oil ? A 43 222 Lower Vulcan
Challis-1,3,7,8 oil ? A 40 326 Lower Vulcan
Eclipse-2 g/o ? A 30-49 ? Lower Vulcan
Jabiru-1A,8A,11 oil ? A 42.5 260-350 Lower Vulcan
Octavius-1 oil ? A 37.5 Lower Vulcan
Talbot-1,2 oil ? A 50 Lower Vulcan
Tenacious-1 oil ? A 49 520 Lower Vulcan
Audacious-1 oil ? A+? 55 264 Lower Vulcan
Puffin-1,2,3,5 oil ? A+? 45 105-197 Lower Vulcan +?
Pengana-1 g/c 3 A+? 45 ? Lower Vulcan +?
Oliver-1 g/o 3 A+B 31.8 628 Lower Vulcan + Plover?
Montara-1, 2 g/o 2 B 34.6 324 Plover?
Padthaway-1 g/c 2 B 34.6 3613 Plover?
Crux-1 g/c 3 B 53.7 ? Plover?
Maple-1 g/o 3 ? ? ? Plover?
Bilyara-1 ST1 oil ? B 37 976 Plover?
Maret-1 condensate ? B 39.7 ? Plover coal

Differences in timing of generation from the individual source rocks and in migration pat-
terns result in the mixed hydrocarbon accumulations seen at several locations throughout
the Vulcan Sub-basin. The regional distribution of the groups is shown in Figure 2.
Figure 2 Inferred migration pathways of the Vulcan Sub-basin Group A and B oils and condensates (from Ed-wards et al (2004), modified after Chen et al., 2002).
The majority of oils and condensates from the Vulcan Sub-basin have a mixed marine and
terrestrial geochemical signature (Edwards et al., 2004). In order to reproduce this pattern
both source rocks were taken into account, where for each source rock interval, HI and TOC
values were assigned to the numerical models as discussed with GA and listed in Table 4.
The main problem with the determination of phase predictive compositional kinetic schemes
using conventional pyrolysis methods lies in the determination of gas compositions. While
pyrolysis methods accurately reconstruct hydrocarbon GORs they are incapable of correctly
reproducing the gas composition of natural fluids. As the gas composition dominantly con-
trols the phase behaviour of petroleum multi-compound compositional kinetic predictions
based on pyrolysis results alone are inappropriate for the prediction of phase behaviour. A
method developed by di Primio and Horsfield (2004) uses a combination of open and closed
system pyrolysis techniques to characterize the compositional evolution of the fluids gener-
ated as a function of increasing thermal stress. Gas compositions determined analytically
are iteratively tuned to natural fluid phase behaviour and the ensuing “corrected” gas com-
positions used for the definition of multi-compound kinetic models.
10

Following this approach compositional kinetic models for the Lower Vulcan and the Plover
formations were developed. The properties of the compositional kinetics of the Lower Vulcan
and the Plover formations (Table 4) are described in detail in the report previously prepared
by GeoS4 GmbH for Geoscience Australia on selected samples from the Vulcan Sub-basin.
Table 4 Source rock properties assigned in the digital models.
Source Interval TOC HI Assigned Kinetics
L._Vulcan_L(sq 4a)_(Montarra) 1.6 200 G005732 4-Comp_Crack L._Vulcan_L(sq-4a)_SW 0.7 150 G005732 4-Comp_Crack Plover_SR 3 215 G005733 4-Comp_Crack_Plover
In the present study the 4-compound kinetic models were used, which accurately reproduce
petroleum GOR evolution as well as the physical properties of the fluids at lower computa-
tional cost than if the PhaseKinetic models were used, which contain 14 compounds. For de-
tailed phase behaviour calculations as well as for the simulation of petroleum alteration it is,
however, recommended to use the full PhaseKinetic definitions. Details on the comparability
of 4- and 14-compound model predictions are listed in Appendix 2. There also the cracking
models implemented are discussed.
In addition to the characterization of primary cracking products described by the composi-
tional kinetic models, secondary cracking of the primary generated compounds was also de-
fined. The secondary cracking of hydrocarbons has been investigated experimentally in de-
tail (Dieckmann et al., 1998; Horsfield et al., 1992; Schenk et al., 1997). While the stability
of hydrocarbons in reservoirs is relatively high, onset of in-reservoir cracking starts at res-
ervoir temperatures of 180-200°C at geologic heating rates (Dieckmann et al., 1998; Hors-
field et al., 1992), the cracking of residual hydrocarbons in the source rock environment oc-
curs at significantly lower geologic temperatures, i.e. starting already at roughly 150°C
(Dieckmann et al., 1998). In the experimental studies listed oil cracking was described by
the formation of gas (C1-5) due to the cracking of the C6+ petroleum fraction. For the
compositional kinetic models applied here the use of two compounds describing the liquid
composition precluded the definition of oil cracking using a single bulk reaction characteriza-
tion. The definition of secondary cracking used is described in the PhaseKinetics report
20080818 from GeoS4 and in Appendix 2. The kinetic models of primary cracking applied
are shown in Table 14. Methane was defined as the single compound being produced from
oil cracking.
The expulsion model standardly implemented in PetroMod is based on a saturation thresh-
old. This is a petrophysical parameter and therefore set for each lithology separately. The
default setting is 1% for oil and 0% for gas. In the implemented 4-compound kinetic models
including secondary cracking, however, an adsorption based model is used to calculated ex-
pulsion. In this case the dead carbon proportion of the source rock adsorbs generated hy-
drocarbons. Only when the sorptive capacity is exceed is expulsion possible. This approach
follows the Pepper and Corvi (1995) model. The only variation is that a whole-phase ad-
sorption model is used as compared to a two-phase adsorption model in Pepper and Corvi
(1995). Based on the source rock properties listed in Table 4 dead carbon contents of the
Vulcan and Plover source rocks are high, reaching values of 76 to 82% of the total organic
carbon (see source rock kinetics in PetroMod format of GeoS4 report 20080818). Accord-
ingly, a relatively large retention capacity of these source rocks has to be assumed. The ap-
plication of this expulsion model based on the adsorptive capacity of the kerogen results in
11

relatively high degrees of kerogen conversion being required before expulsion occurs. Appli-
cation of the standard PetroMod saturation-based expulsion model would have resulted in
significantly earlier expulsion times. However, the PhaseKinetic modelling approach applied
here is only applicable using the modified adsorption based expulsion model of Pepper and
Corvi (1995) when secondary cracking is to be taken into account. As stated by IES Ger-
many (Hantschel pers. com.) PetroMod expulsion times are not very reliable, since they de-
pend on a variety of variables the contributions of which are difficult to assess individually
and are averaged over an area. Accordingly a relatively large error margin of this output in-
formation should be taken into account in the discussion of expulsion times.
In the present study the individual components of the two source rock kinetic models used
were tagged in order to be able to identify relative contributions to any given accumulation.
Hydrocarbons generated by the Vulcan Formation are named according to the usual 4-
compound definition, i.e. Methane, C2-C5, PK_C6-C14 and PK_C15+. The Plover Formation
products are characterized by the suffix Pl_, i.e. Pl_Methane, Pl_C2-C5, etc.
The geographic distribution of the known source rock intervals shown in Figure 3 were pro-
posed by GA and assigned to the numerical models. In the south-western area of the Vulcan
source rock facies map (Figure 3) a facies was assigned with the same rock properties but
distinctively lower TOC and HI values as compared to the facies assigned to the rest of the
area. This facies occurs in the structural saddle between the Swan Graben to the north and
the Browse Basin to the south, and was necessary in order to reduce the volume of gener-
ated petroleum in that area. The assigned compositional kinetic models are identical for
both.
The reserves of the Vulcan-Sub-basin are estimated to be 357 MMbbls oil, 31 MMbbls con-
densates and 1.3 Tcf gas or 58/5/36% oil/condensate/gas volume split respectively by boe
(Longley et al., 2002).
A full assessment of the masses generated, expelled, cracked and accumulated could not be
made for the present study due to incorrect data extraction routines in PetroMods PetroRe-
port program which was identified during this study and is described in detail in the Sum-
mary and Conclusions.
12

Figure 3 Distribution of the Lower Vulcan source rock facies.
13

Seal Properties Jurassic intra-formational shale and claystone seals are described by Bradshaw and co-
workers (1994). Local and regional seal rocks are lower to upper Cretaceous (Valaginian-
Cenomanian) claystones. Kivior et al. (2002) studied the seal potential in Cretaceous and
Late Jurassic rocks of the Vulcan Sub-basin.
To simulate a rather leaky sealing formation, the seal properties of the Upper Vulcan (seq-
4c) and the L_Cretaceous formations were adjusted in the Lithology Editor. Capillary entry
pressures for the upper Vulcan seal were reduced in order to remove accumulations at the
graben margin (Figure 4). The leaky lithology was assigned to the facies in scenario 4.
Figure 4 Seal properties used for the sealing lithologies in some of the modelled scenarios. The blue graphs show the definitions used for the leaky seal scenarios.
14

Description of Modelling Scenarios
GA required a set of scenarios to be modelled. The variations of the numerical set-ups are
listed below in Table 6. The modelled scenarios differ in the assignment of the source rock
properties and compositional kinetics. In two scenarios no source rock properties and no
compositional kinetic model were assigned to the Plover Formation (scenario 1 and 2). This
scenario was included in order to better constrain the contribution of petroleum generated
by the Lower Vulcan source rock interval. Scenarios 3 and 4 take the Plover Formation as a
contributing source rock interval into account. Three of the modelled scenarios include a
variation in TOC and HI for the most south-western area of the Lower Vulcan Formation
(scenarios 2, 3 and 4). Kivior et al. (2002) studied the seal potential in Cretaceous and Late
Jurassic rocks of the Vulcan Sub-basin. They concluded that top seal capillary failure is
rather unlikely to be mechanism for hydrocarbon leakage. However, in order to handle the
leakage numerically, variations of the sealing capacity of the upper Vulcan seal were mod-
elled in order to remove accumulations at the graben margin (scenario 4).
In Scenario 5 (copy of Scenario_3), faults which were part of the original model, were as-
signed to the formations between the M_Jura and Triassic up to the U_Vulcan (seq4c).
Three main faults (SwanGNW, SGSE and CTNW0) were extended up into the U_Cret_Puffin
horizon. The fault model available in PetroMod™ allows changes over time in the faults
transmissibility. Migration was allowed along the faults during rifting periods (163-136 Ma;
Miocene reactivation of three selected main faults between 6 to 0 Ma). The fault assignment
is shown in Table 5. The definitions of the different fault properties of PetroMod™ are in
summary: The fault capillary pressure describes the resistance of the fault for fluid flow, the
higher the value, the less permeable is the fault (100 MPa makes the fault impermeable).
The “closed” fault type closes the fault with respect to fluid flow (sealing fault); the “open”
fault type opens the fault with respect to fluid flow (leaking fault), “none” types are ignored
during the specific time interval of the simulation. A more detailed description about fault
properties is given in Yielding et al., (1997).
Table 5 Fault properties
Fault Name
Fault Type
Fault Capillary Pressure (Mpa)
From (Ma)
To (Ma)
Fault Type
Fault Capillary Pressure (Mpa)
From (Ma)
To (Ma)
Fault Type
Fault Capillary Pressure (Mpa)
From (Ma)
To (Ma)
CTNW open 10 163 136 closed 100 136 0 none 0 0 0
SwanGNW open 10 163 136 closed 100 136 6 open 10 6 0
CTSE open 10 163 136 closed 100 136 0 none 0 0 0
CTSE2 open 10 163 136 closed 100 136 0 none 0 0 0
JHNW open 10 163 136 closed 100 136 0 none 0 0 0
JHSE open 10 163 136 closed 100 136 0 none 0 0 0
JTSE open 10 163 136 closed 100 136 0 none 0 0 0
CTNW0 open 10 163 136 closed 100 136 6 open 10 6 0
SwanGNW2 open 10 163 136 closed 100 136 0 none 0 0 0
CTS open 10 163 136 closed 100 136 0 none 0 0 0
SGSE open 10 163 136 closed 100 136 6 open 10 6 0
PGS open 10 163 136 closed 100 136 0 none 0 0 0
PGSS open 10 163 136 closed 100 136 0 none 0 0 0
PHNW open 10 163 136 closed 100 136 0 none 0 0 0
CTSS open 10 163 136 closed 100 136 0 none 0 0 0
15

16
Table 6 Set-up of the numerical models.
Model Settings
Scenario 1 • Lower Vulcan
Scenario_2 • Lower Vulcan • Lower Vulcan_SW • Reduced capillary entry pressure for upper Vulcan
Scenario_3 • Lower Vulcan • Lower Vulcan_SW • Plover
Scenario_4
• Lower Vulcan • Lower Vulcan_SW • Plover • Reduced capillary entry pressure for upper Vulcan
Scenario_5
• Lower Vulcan • Lower Vulcan_SW • Plover • Faults assigned
Simulation
Once the numerical model includes the required set of input data, the simulation starts. To
reduce processing time an eight node (8 GB RAM per node) Linux based PC cluster for par-
allel processing was used. During the simulation, the geological evolution of the basin
through time, including its thermal and pressure history, is reconstructed. Simulation is an
iterative process, which means that it will be repeated until a satisfying result is achieved,
using the results of the previous runs as first approximations.
In order to assess the migration histories of both areas, first the drainage areas and subse-
quently the migration paths of the generated hydrocarbons were modelled.
The carrier maps were divided into drainage areas by the PetroMod’s PetroCharge tool,
which models migration as flow within a defined carrier. The calculated drainage area bor-
ders, the closures, showing areas of possible hydrocarbon accumulations and the calculated
spill paths, are based on the layers topography. Migration is assumed to occur instantane-
ously. Such flowpath models are based on the assumption, that
• petroleum flows against a defined surface (e.g. a regional seal),
• migration is only buoyancy driven (IES, 2002).
The following options were chosen within the Simulator module of PetroMod™:
• The chosen petroleum migration method for the simulation is the Hybrid Model,
which combines both Darcy flow and Flowpath.
• The reservoir definition has a threshold value of 10-2 mD permeability at 30% po-
rosity (sedimentary units with values equal to or higher than this permeability at
30% porosity are assumed to be carriers).
• Migration within units which did not match the criteria for carriers was modelled
assuming Darcy flow.
• The chosen adsorption model is the “expelled composition” model. For details on
the cracking model applied see Appendix 2.
• Equation of State: Peng Robinson.
17
• The model’s basin sides were left open in all simulation runs, generated petroleum
migrating to the model’s margins could therefore leave the basin through the open
sides, thereby preventing artificially trapped accumulations in the model bounda-
ries.
As the input data set contained undefined values (99999) at several locations within the
numerical model (which resulted in holes (no data) in the output results throughout all lay-
ers of the entire model at that location), those values were removed by setting them to 0,
thereby defining a zero thickness which closed the data gaps throughout the model.
Results
Initial thermal modelling of the study area indicated that no differences regarding calibra-
tion were obvious between the V.9 and V. 10 models. Accordingly the thermal history defi-
nition as described by Fujii et al. (2004) applies also to the models presented here. The fol-
lowing section describes the results of the different source rock scenarios under the as-
sumption that the geographic distribution of the different source rock facies and the as-
signed properties as determined by GA are correct.
All modelled scenarios predict hydrocarbon accumulations or traces to be present in the fol-
lowing formations:
• U_Cret_Puffin (traces/ small accumulations, e.g. at Langhorne 1)
• L_Cretaceous (traces)
• Plover_Sand1 (main reservoir unit)
• Plover_Sand2 (traces/ small accumulations, e.g. at Jaribu 1A)
• Plover_Shale (traces)
• Plover_Sand3 (traces)
However, it is only the Plover_Sand1 which contains economically interesting volumes of
hydrocarbons.

Scenario 1 This scenario considers only the source rock potential of the Lower Vulcan Formation with
no potential in its south-western area. The regional distribution of the presently transformed
organic matter is shown in Figure 5. Table 7 compares the fluid properties of the modelled
hydrocarbon accumulations to the ones reported in Edwards et al. (2004).
Table 7 Field data (Edwards et al., 2004) and the modelled results.
Edwards et al. (2004) Scenario_1
Well/Field °API GOR (stb/scf)
HC Type °API GOR (stb/scf)
HC Type
Leeuwin-1 ? ? gas - - No accum.
Swan-1,3 40-55
? gas 54 110000 g/c
Tahbilk-1 ? ? g/c 23 612 g/c
Cassini-1 40 250 g/o 56 1200 oil
Skua-2,3,4,5,8,9 ? 700-2000 g/o 32 1540 g/o
Birch-1ST1 43 222 oil 34 12500 g/o
Challis-1,3,7,8 40 326 oil 57 1650 traces
Eclipse-2 30-49
? g/o 55 (32)
22000 (234)
g (o)
Jabiru-1A,8A,11 42.5 260-350 oil 27 860 g/o
Octavius-1 37.5 oil - - -
Talbot-1,2 50 oil 23 611 oil
Tenacious-1 49 520 oil - - No accum.
Audacious-1 55 264 oil 28 892 oil
Puffin-1,2,3,5 45 105-197 oil 27 1050 g/o
Pengana-1 45 ? g/c 27 860 oil
Oliver-1 31.8 628 g/o - - -
Montara-1, 2 34.6 324 g/o - - -
Padthaway-1 34.6 3613 g/c 23 606 oil
Crux-1 53.7 ? g/c - - -
Maple-1 ? ? g/o 29 966 g/o
Bilyara-1 ST1 37 976 oil - - -
Maret-1 39.7 ? condensate - - -
The compositional kinetic models predict petroleum accumulation for a variety of forma-
tions, with the Plover Formation being the main reservoir unit and the Puffin Formation be-
ing the secondary. The predicted petroleum accumulations in the Plover Sand 1 west of
Montara 1 at Padthaway 1 (~10 MMbbls) and Tahbilk (~45 MMbbls) wells are rather small
(Figure 6). The migration paths which are visible in Figure 6 in the south-western non-
source area originate from the active kitchen outside the non-source area (transparent
overlay in the south-west of Figure 6). The predicted oil accumulation at the Swift/Skua lo-
cation is also small (~12 MMbbls). The migration pathways east of Douglas point towards
the Audacious well, which is located approximately 20 km east of Douglas, and confirm
known accumulations at that structure. Oil was modelled to be present within the Jaribu
structure.
According to GA, the Plover sand is absent in the Maple and the Cassini structures, but pro-
vides the carrier to the structures, where the model predicts accumulations to be present.
21

Within the Lower Cretaceous Puffin Formation, the assigned compositional model for the
Vulcan Formation predicts oil accumulations for the Puffin structure (Figure 7).
Figure 8 shows the predicted transformation ratio evolution through time for the Lower Vul-
can source rock unit. The assigned compositional kinetic models predict the onset of petro-
leum generation for the deepest location of the formation (the Swan Graben) at the end of
the Late Jurassic at 145 Ma. Transformation is not completed yet.
As stated in earlier, is the application of this expulsion model based on the adsorptive ca-
pacity of the kerogen results in relatively high degrees of kerogen conversion being required
before expulsion occurs. This is obvious in Figures 8 and 9 where transformation ratios of
over 40-60% are required (depending on the source rock characteristics) before expulsion
(as expressed by the line “Expulsion time”) occurs. More specifically, the expulsion of petro-
leum occurred at approximately 100 Ma at the Swan Graben location shown in Figure 5.
Based on the applied PhaseKinetic models of hydrocarbon generation, expulsion and crack-
ing organic matter within the Cartier Trough in the North of the basin has reached up to
80% conversion (Figure 9). The onset of petroleum generation here occurred in the Early
Cretaceous, at 140 Ma. Subsequent generation occurred during the Oligocene, followed by a
sharp drop and an increase during the last 8 Ma. Expulsion time was at 7 Ma.
Results in terms of cumulative hydrocarbon volumes as reported for the petroleum systems
are shown in the Appendix. The data is available in digital format in the PetroReport module
of this scenario. Figure 10 summarizes the total cumulative volumes of hydrocarbons which
were generated, expelled and accumulated. Here it should be taken into account that un-
expelled petroleum as well as residual petroleum saturations are included in the “accumu-
lated” volumes. Additionally, due to an error in the PetroReport extraction routine “expelled
volumes” are incorrect. This data could, however, not be removed from the graphics as a
user-defined output graphic is not available for this option in PetroMod.
22

Figure 5 Present day Lower Vulcan source rock. Overlay is transformation ratio; oil and gas flow vectors (green/red) are included, the red dots show the locations for the 1D time shots (Figure 8 and Figure 9).
23

Figure 6 Oil and gas accumulations and flow paths (green/red) in the uppermost Plover Sand_1 (present day, colour overlay is depth). Green and red circles show successfully reproduced oil and gas accumulations. The pie diagram shows the compositions of the fluid encountered east of Maple, west of Montara (Padthaway-1), at Jabiru 1a and south of Tahbilk.
24

Figure 7 U_Cret. Puffin Formation, present day: Oil (green) and gas (red) accumulations and flow. The pie dia-gram shows the composition of the fluid predicted at the Puffin well.
25

Figure 8 Central Swan Graben, Lower Vulcan Formation: Timing of petroleum generation and expulsion.
Figure 9 Cartier Trough, Lower Vulcan Formation: Timing of petroleum generation and expulsion.
26

Figure 10 Overview of timing and total volumes of the generated, expelled and accumulated hydrocarbons over time for the entire digital model. Please note that only the generated volumes described here are reliable as discussed in the summary and conclusions.
27

Scenario 2 This scenario considers the source rock potential of the Lower Vulcan Formation, including
its south-western area, although the source rock properties in terms of TOC and HI are here
reduced as compared to the rest of this formation.
The additional input of the tested south-western Lower Vulcan source rock potential is evi-
dent in the volumetric increase of the accumulations at Padthaway/west of Montara (Sce-
nario 1: ~7 MMbbls, Scenari_2: ~10 MMbbls) and south of Tahbilk (Scenario_1: ~32
MMbbls; Scenario_2: ~56 MMbbls) in the Plover Sand 1 (Figure 12). The predicted accumu-
lations in the Lower Cretaceous Puffin Formation (Figure 13) are identical to the ones shown
in Scenario 1 (Figure 7). API, GOR and fluid type data are ± identical to the results of Sce-
nario_1.
Figure 14 shows the predicted transformation ratio evolution through time for the Lower
Vulcan source rock unit at the location shown in Figure 11. The assigned compositional ki-
netic models predict the onset of petroleum generation for the location at 35 Ma. Transfor-
mation has not been completed. Presently the transformation of organic matter within the
south-western area has reached about 30% with no, or only minimal, expulsion of petro-
leum, which is basically due to the low TOC and HI values assigned here as well as the high
inert carbon content of the kerogen. This observation may seem strange in view of the ob-
served higher volumes of fluids encountered in the Padthaway/ west of Montara and Tahbilk
fields in this simulation, is however, easily explained by the fact that the time shot shown in
Figure 14 is valid only for the surface of the source rock at the location where the 1D time
shot was taken. The base of the source rock in the same location has reached a distinctly
higher degree of transformation (70%) and has accordingly also expelled hydrocarbons.
Results in terms of cumulative hydrocarbon volumes as reported for the Petroleum Systems
are shown in the Appendix. The data is available in digital format in the PetroReport module
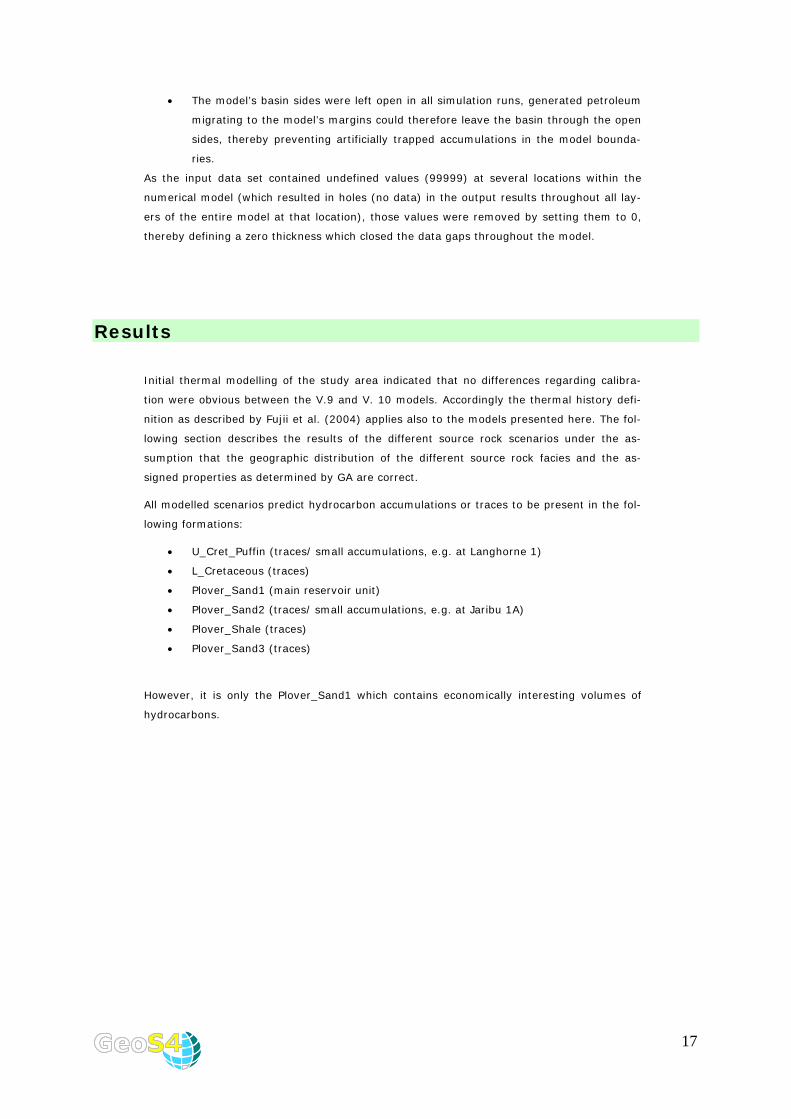
of this scenario. Figure 15 summarizes the total cumulative volumes of hydrocarbons which
were generated, expelled and accumulated. Here it should be taken into account that un-
expelled petroleum as well as residual petroleum saturations are included in the “accumu-
lated” volumes. Additionally, due to an error in the PetroReport extraction routine “expelled
volumes” are incorrect. This data could, however, not be removed from the graphics as a
user-defined output graphic is not available for this option in PetroMod.
28

Figure 11 Present day Lower Vulcan source rock. Overlay is transformation ratio; oil and gas flow vectors (green/red) are included, the red dot shows the location for the 1D time shot (Figure 14).
29

Figure 12 Oil and gas accumulations and flow paths (green/red) in the uppermost Plover Sand_1 (present day, colour overlay is depth). The pie diagram shows the composition of the gas predicted for the Tahbilk and for the Montara structures.
30

Figure 13 U_Cret. Puffin Formation, present day: Oil (green) and gas (red) accumulations and flow.
31

Figure 14 Lower Vulcan Formation, south-western area: Timing of petroleum generation and expulsion.
32
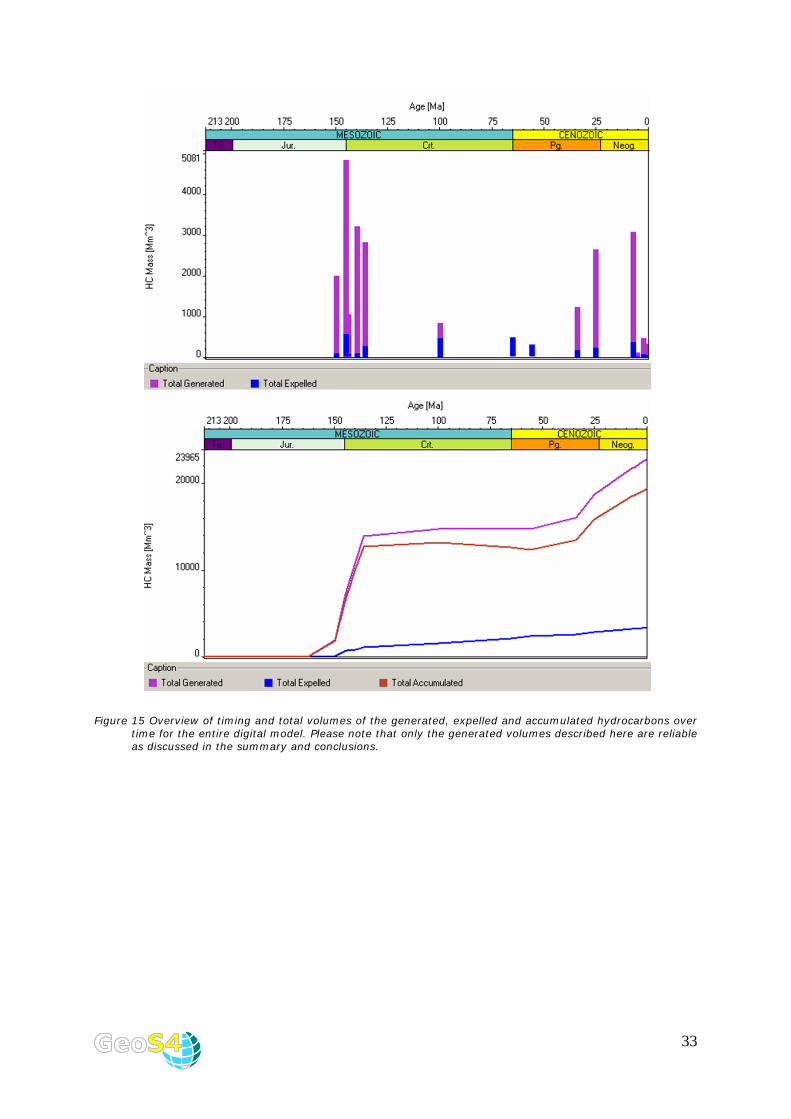
Figure 15 Overview of timing and total volumes of the generated, expelled and accumulated hydrocarbons over time for the entire digital model. Please note that only the generated volumes described here are reliable as discussed in the summary and conclusions.
33

34
Scenario 3 This scenario considers the source rock potential of both the Lower Vulcan Formation (in-
cluding its south-western area, although the source rock properties in terms of TOC and HI
are here reduced), as well as the Plover source rock interval. Table 8 compares the fluid
properties of the modelled hydrocarbon accumulations to the ones reported in Edwards et
al. (2004).
The differentiation of Vulcan and Plover products within an individual accumulation allows
the assessment of the respective contribution of these sources:
• Vulcan Formation products: usual 4-compound definition, i.e. Methane, C2-C5,
PK_C6-C14 and PK_C15+
• Plover Formation products: characterized by the suffix Pl_, i.e. Pl_Methane, Pl_C2-
C5, etc.
Table 8 Field data (Edwards et al., 2004) and the modelled results
Edwards et al. (2004) Scenario_3
Well/Field °API GOR (stb/scf)
Inferred source rock
HC Type °API GOR (stb/scf)
SR HC Type
Leeuwin-1 ? ? ? gas - - - No accum.
Swan-1,3 40-55
? L.+U. Vulcan? gas 42 103000 LV gas
Tahbilk-1 ? ? L. Vulcan+Plover?
g/c 23 679 LV g/c
Cassini-1 40 250 L. Vulcan g/o 26 471 mixed oil
Skua-2,3,4,5,8,9 ? 700-2000 L. Vulcan g/o 37 50
1346 21000
LV gas & oil
Birch-1ST1 43 222 L. Vulcan oil 25 14200 LV gas & oil
Challis-1,3,7,8 40 326 L. Vulcan oil 55 911 LV traces
Eclipse-2 30-49
? L. Vulcan g/o 53 42300 LV gas & oil
Jabiru-1A,8A,11 42.5 260-350 L. Vulcan oil 27/55 875/90000 LV oil & gas
Octavius-1 37.5 L. Vulcan oil - - - No accum.
Talbot-1,2 50 L. Vulcan oil 23 636 LV oil
Tenacious-1 49 520 L. Vulcan oil - - - No accum.
Audacious-1 55 264 L. Vulcan oil 28 1087 LV oil/gas
Puffin-1,2,3,5 45 105-197 L. Vulcan +? oil 18 831 mixed oil/gas
Pengana-1 45 ? L. Vulcan +? g/c 26 870 LV oil
Oliver-1 31.8 628 L. Vulcan + Plover?
g/o - - - No accum.
Montara-1, 2 34.6 324 Plover? g/o 23 668 LV oil
Padthaway-1 34.6 3613 Plover? g/c 23 668 LV oil
Crux-1 53.7 ? Plover? g/c - - - No accum.
Maple-1 ? ? Plover? g/o 27 1897 LV Oil/gas Bilyara-1 ST1 37 976 Plover? oil 23 668 LV oil
Maret-1 39.7 ? Plover coal condensate - - - No accum.

Table 9 Fluid compositions (mass fractions, %), calculated by PetroFlash.
Map
le 1
Audac
ious
Sw
an 1
Cas
sini 1
Tah
bilk
-1
Sku
a 1
Bir
ch 1
Ecl
ipse
1
Jabiru (
oil)
Tal
bot
Puff
in
Pen
gana
1
Pad
thaw
ay 1
Methane 19.8 82.8 4.4 5.3 13.6 55.9 75.8 7.7 5.1 4.4 7.7 5.3 16.2 C2-C5 10.7 11.0 6.0 9.2 6.7 11.5 11.7 8.7 9.4 3.0 8.6 9.3 10.0 PK_C6-C14 31.8 4.6 39.2 33.0 50.6 13.3 10.9 38.4 33.9 12.6 38.4 33.3 35.7PK_C15+ 27.3 0.1 36.4 49.4 19.3 14.5 0.0 42.0 51.5 15.9 42.0 50.2 36.4Pl_Methane 0.7 0.0 0.0 0.1 0.0 0.3 0.0 0.0 0.0 2.5 0.0 0.1 0.0 Pl_C2-C5 1.0 0.0 0.0 0.3 0.1 0.4 0.1 0.2 0.0 5.3 0.2 0.2 0.1 Pl_PK_C6+ 3.9 0.2 2.6 1.2 3.1 2.0 1.3 1.3 0.1 24.3 1.3 0.8 0.6 Pl_PK_C15+ 4.8 1.3 11.3 1.5 6.5 2.1 0.2 1.7 0.1 31.9 1.7 1.0 0.9 Sum 100 100 100 100 100 100 100 100 100 100 100 100 100
mol 35%) and Nome well
ation reservoir, Figure 18).
bels) and south of Tahbilk 1 (Figure 17). Those oils were sourced from the poor quality Vul-
red at 60 Ma. The onset of petroleum generation occurred in the Early Creta-
Ma. Subsequent generation occurred during a second phase during the Late
t
uring the Miocene,
expelled petroleum as well as residual petroleum saturations are included in the “accumu-
Table 9 shows the contributions of the different source rock units for the wells which were
subject in the study of Edwards et al. (2004). From those wells, the Puffin well shows a
dominance of Plover generation products (~mol 70%). The gas phase encountered in Jabiru
1 is primarily Vulcan-sourced. Additional accumulations which are also partly sourced by the
Plover source rock are modelled for the Langhorne well (Plover ~
(~mol 20%) and west of Skua and Swift (all in the Puffin Form
No Plover-sourced accumulation is modelled for Oliver or Maret.
The Eclipse gas/oil accumulation is, on the other hand, sourced to over 95 % by the Vulcan
Formation. The Talbot field in the model received petroleum from the Vulcan Formation ex-
clusively. In addition to the petroleum accumulations predicted in Scenario_1, further ac-
cumulations were modelled west of Montara (Padthaway 1, location is obscured by well la-
can source rock, which has been assigned to the south-western area.
Figure 19 shows the predicted transformation ratio evolution through time for the Plover
source rock unit in the south-western area (location is shown in Figure 16). 50% TR was
reached in the early Miocene. Organic matter is presently up to 55% transformed. First ex-
pulsion occur
ceous, at 140
Oligocene.
Figure 20 shows the predicted transformation ratio evolution through time for the Lower
Vulcan source rock unit in the south-western area (location is shown in Figure 16). 50% TR
has not been reached yet (presently 40% TR). First expulsion occurred at 60 Ma. The onse
of petroleum generation occurred at 50 Ma, followed by a sharp drop d
and subsequent generation during a second phase during the last 5 Ma.
Results in terms of cumulative hydrocarbon volumes as reported for the Petroleum Systems
are shown in the Appendix. The data is available in digital format in the PetroReport module
of this scenario. Figure 21 summarizes the total cumulative volumes of hydrocarbons which
were generated, expelled and accumulated. Here it should be taken into account that un-
35
lated” volumes. Additionally, due to an error in the PetroReport extraction routine “expelled
volumes” are incorrect. This data could, however, not be removed from the graphics as a
-defined output graphic is not available for this option in PetroMod. user
Figure r overlay is transformation ratio. The red dot shows the location of the 1D time plot shown in Figure 19. 16 Present Plover source interval. Colou
36

Figure 17 Oil and gas accumulations and flow paths (green/red) in the uppermost Plover Sand_1 (present day, colour overlay is depth). The pie diagrams show the compositions of the Jaribu, Tahbilk and Padthaway accumulations.
37

Figure 18 U_Cret. Puffin Formation, present day: Oil (green) and gas (red) accumulations and flow. The pie diagrams show the compositions of the Puffin, Longhorne, Nome accumulations, and an accumulation west of Skua and Swift. Colour overly was switched to transparent, as the accumulations were not clearly visible in the opaque colour mode.
38

Figure 19 Plover Formation, south-western area: Timing of petroleum generation and expulsion. The 1d time shot location is shown in Figure 16.
Figure 20 Lower Vulcan Formation, south-western area: Timing of petroleum generation and expulsion. The 1d time shot location is shown in Figure 10.
39

Figure 21 Overview of timing and total volumes of the generated, expelled and accumulated hydrocarbons over time for the entire digital model. Please note that only the generated volumes described here are reliable as discussed in the summary and conclusions.
40

Scenario 4 This scenario considers the source rock potential of both the Lower Vulcan Formation (in-
cluding its south-western area) as well as the Plover source rock interval. A lower capillary
entry pressure for the sealing Lower Cretaceous formation (see Figure 4) was assigned in
order to create a leaky seal. Table 10 compares the fluid properties of the modelled hydro-
carbon accumulations to the ones reported in Edwards et al. (2004), and Table 11 shows
the contributions of the different source rock units for the wells which were subject in the
study of Edwards et al. (2004). From those wells, the Puffin well shows a dominance of
Plover generation products (~mol 70%).
Table 10 Field data (Edwards et al., 2004) and the modelled results
Edwards et al. (2004) Scenario_4
Well/Field °API GOR (stb/scf)
Inferred source rock
HC Type °API GOR (stb/scf)
SR HC Type
Leeuwin-1 ? ? ? gas - - - No accum.
Swan-1,3 40-55
? L.+U. Vulcan? gas 40 112000 LV gas
Tahbilk-1 ? ? L. Vulcan+Plover?
g/c 23 678 LV g/c
Cassini-1 40 250 L. Vulcan g/ Lo 24 440 V oil
Skua-2,3,4,5,8,9 ? 700-2000 L. Vulcan g/o LV & 35
48 1254 19000
gas oil
Birch-1ST1 43 222 L. Vulcan oi 22 13800 L&
l V gas oil
Challis-1,3,7,8 40 oi 49 926 LV 326 L. Vulcan l traces
Eclipse-2 ? L. Vulcan g/o 52 45000 LV & 30-
49 gas oil
Jabiru-1A,8A,11 42.5 260-350 L. Vulcan oil 27/55 872/94000 LV oil & gas
Octavius-1 37.5 o - - - m.
L. Vulcan il No accu
Talbot-1,2 50 L. Vulcan oi 23 633 L l V oil
Tenacious-1 49 520 L. Vulcan oi - - -l No accum.
Audacious-1 55 264 L. Vulcan oil 28 1089 mixed oil/gas
Puffin-1,2,3,5 5-197 d 45 10 L. Vulcan +? oil 18 830 mixe oil/gas
Pengana-1 45 ? L. Vulcan +? g/ 31 288 LV c oil
Oliver-1 31.8 628 L. Vulcan +
g/o - -m. Plover?
- No accu
Montara-1, 2 34.6 324 Plover? g/o 23 662 LV oil
Padthaway-1 34. g/ 23 662 LV 6 3613 Plover? c oil
Crux-1 53.7 g/c - - -? Plover? No accum.
Maple-1 ? ? Plover? g/o 27 1889 LV oil/gas Bilyara-1 ST1 6 37 97 Plover? oil 23 662 LV oil
Maret-1 39.7 ? Plover coal condensate - - - accum. No
41

Table 11 Fluid compositions (mass fractions, %), calculated by PetroFlash.
Audac
ious
1
Sw
an 1
Cas
sini 1
Tah
bilk
1
Sku
a 1
Bir
ch 1
Ecl
ipse
1
Jabiru (
oil)
Jabir
u 1
(g
as)
Tal
bot
Puff
in
Pen
gana
1
Pad
thaw
ay 1
Map
le 1
Methane 21.0 83.1 4.1 5.3 12.8 55.4 76.3 7.7 74.2 5.0 4.2 2.5 5.2 16.2 C2-C5 10.8 11.1 5.6 9.3 6.4 10.9 11.7 8.6 19.2 9.4 2.7 6.7 9.3 9.8 PK_C6-C14 32.1 4.1 37.0 33.2 50.0 12.0 10.2 38.6 5.6 33.9 11.1 48.8 33.3 35.6 PK_C15+ 26.4 0.1 40.1 49.6 21.5 15.4 0.0 41.7 0.0 51.4 13.8 39.1 50.4 36.6 Pl_Methane 0.6 0.0 0.0 0.1 0.0 0.3 0.0 0.0 0.4 0.0 2.8 0.0 0.1 0.0 Pl_C2-C5 1.0 0.0 0.0 0.2 0.1 0.5 0.1 0.2 0.4 0.0 5.6 0.2 0.2 0.1 Pl_PK_C6+ 3.7 0.2 2.3 1.0 2.6 2.3 1.4 1.3 0.2 0.1 25.9 1.1 0.7 0.6 Pl_PK_C15+ 4.4 1.3 10.9 1.3 6.5 3.2 0.2 1.8 0.0 0.1 34.0 1.6 0.9 1.0 Sum 100.0 100 100 100 100 100 100 100 100 100 100 100 100 100
Results in terms of cumulative hydrocarbon volumes as reported for the Petroleum Systems
are shown in the Appendix. The data is available in digital format in the PetroReport module
of this scenario. Figure 24 summarizes the total cumulative volumes of hydrocarbons which
were generated, expelled and accumulated. Here it should be taken into account that un-
expelled petroleum as well as residual petroleum saturations are included in the “accumu-
lated” volumes. Additionally, due to an error in the PetroReport extraction routine “expelled
volumes” are incorrect. This data could, however, not be removed from the graphics as a
user-defined output graphic is not available for this option in PetroMod.
42

Figure 22 Oil and gas accumulations and flow paths (green/red) in the uppermost Plover Sand_1 (present day, colour overlay is depth). The pie diagrams show the compositions of Jabiru 1A and Tahbilik 1 ac-cumulations.
43
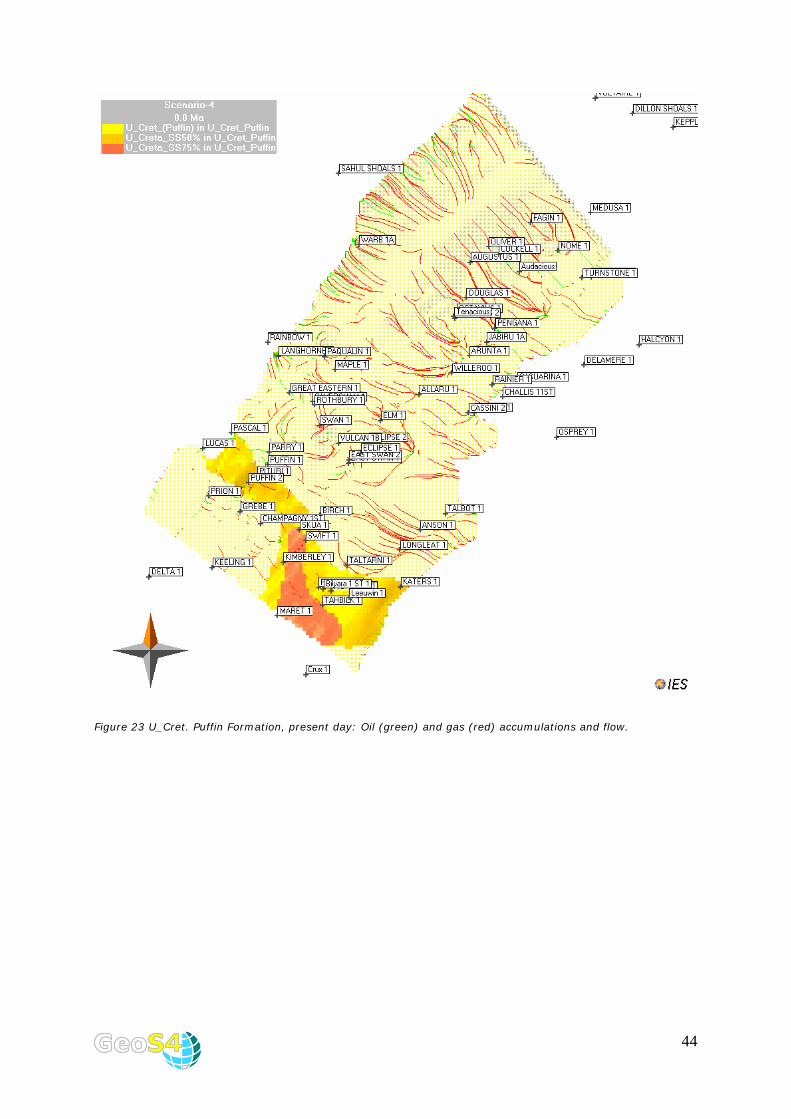
Figure 23 U_Cret. Puffin Formation, present day: Oil (green) and gas (red) accumulations and flow.
44

Figure 24 Overview of timing and total volumes of the generated, expelled and accumulated hydrocarbons over time for the entire digital model. Please note that only the generated volumes described here are reliable as discussed in the summary and conclusions.
45

46
Scenario 5 This scenario tested hydrocarbon charge along faults during rifting episodes. Both Plover
and Lower Vulcan (including its south-western area) are assigned as source rocks.
As in the former scenarios, Vulcan and Plover products were tagged in order to allow a dif-
ferentiation of the generated products:
• Vulcan Formation products: usual 4-compound definition, i.e. Methane, C2-C5,
PK_C6-C14 and PK_C15+
• Plover Formation products: characterized by the suffix Pl_, i.e. Pl_Methane, Pl_C2-
C5, etc.
The fault distribution is shown in Figure 26. Table 12 compares the fluid properties of the
modelled hydrocarbon accumulations to the ones reported in Edwards et al. (2004).
The contributions of the different source rock units (Table 13) show that the accumulation
modelled for the area of Puffin has a dominance of Plover generation products (~mol 65%),
together with additional accumulations around the Puffin well. The rest of the modelled area
shows only minor contributions of Plover generation products of up to ~mol 10%. The fluid
composition of the modelled hydrocarbon accumulations is very similar to the ones mod-
elled in Scenario 3.
A very small oil accumulation of about 0.8MMbbls is trapped (exclusively in this scenario) at
the faults at Octavius 1. No accumulation was modelled for Audacious, as the modelled oil is
trapped on the western side of fault west of the well (Figure 25).
Figure 25 Rotated view on fault pattern an d accumulations at the two wells.
The assigned fault properties resulted in a general reduction of both Vulcan and Plover gen-
eration products in the accumulations encountered within the Vulcan Sub-basin (e.g. Jabiru
here: 185MMbbls, 365MMbbls in scenario 3). Such Plover products are restricted to very
specific areas around Puffin. In general, the introduction of the faults in this scenario lead to
larger hydrocarbon accumulations in many areas throughout the basin, e.g. at Maple, Doug-
las and Swift/Skua, as hydrocarbon migration is hindered in those areas by the faults. As a

result the accumulations are comparably larger at those sites. However, other areas do not
show significant influence on either the distribution or size of HC accumulations.
Figure 27 summarizes the total cumulative volumes of hydrocarbons which were generated,
expelled and accumulated. Here it should be taken into account that un-expelled petroleum
as well as residual petroleum saturations are included in the “accumulated” volumes. Addi-
tionally, due to an error in the PetroReport extraction routine “expelled volumes” are incor-
rect. This data could, however, not be removed from the graphics as a user-defined output
graphic is not available for this option in PetroMod.
Table 12 Vulcan Sub-basin source-related petroleum groups (Edwards et al., 2004) and the modelled results.
Edwards et al. (2004) Scenario_5
Well/Field °API GOR (stb/scf)
Inferred source rock
HC Type °API GOR (stb/scf)
SR HC Type
Leeuwin-1 ? ? ? gas - - - No accum.
Swan-1,3 40-55
? L.+U. Vulcan?
gas 28 400000 LV g/o
Tahbilk-1 ? ? L. Vulcan + Plover?
g/c 23 684 LV g/c
Cassini-1 40 250 L. Vulcan g/o 33 585 LV oil
Skua-2,3,4,5,8,9 ? 700-2000 L. Vulcan g/o 27 2135 LV g/o
Birch-1ST1 43 222 L. Vulcan oil 47 40000 LV g/o
Challis-1,3,7,8 40 326 L. Vulcan oil 37 813 LV traces
Eclipse-2 30-49
? L. Vulcan g/o 51 30000 LV g/o
Jabiru-1A,8A,11 42.5 260-350 L. Vulcan oil 30 832 LV g/o
Octavius-1 37.5 L. Vulcan oil 23 763 LV oil
Talbot-1,2 50 L. Vulcan oil 23 638 LV oil
Tenacious-1 49 520 L. Vulcan oil - - - No accum.
Audacious-1 55 264 L. Vulcan oil - - - No accum.
Puffin-1,2,3,5 45 105-197 L. Vulcan +? oil 19 811
L. Vulcan +Plover
g/o
Pengana-1 45 ? L. Vulcan +? g/c 30 827 LV oil
Oliver-1 31.8 628 L. Vulcan + Plover?
g/o - - - No accum.
Montara-1, 2 34.6 324 Plover? g/o 23 656 LV oil
Padthaway-1 34.6 3613 Plover? g/c 23 660 LV oil
Crux-1 53.7 ? Plover? g/c - - - No accum.
Maple-1 ? ? Plover? g/o 30 2068 LV g/o
Bilyara-1 ST1 37 976 Plover? oil - - - No. Accum.
Maret-1 39.7 ? Plover coal condensate - - - No accum.
47

Table 13 Fluid compositions (mass fractions, %), calculated with PetroFlash.
Sw
an 1
Cas
sini 1
Tah
bilk
-1
Sku
a 1
Bir
ch 1
Ecl
ipse
1
Jabir
u 1
Tal
bot
Puff
in
Pen
gana
1
Pad
thaw
ay 1
Map
le 1
Methane 85.0 5.1 5.4 18.9 69.0 69.1 8.0 5.1 5.5 8.0 5.2 17.0 C2-C5 12.2 9.1 9.3 7.4 16.4 13.7 7.2 9.4 3.4 7.2 9.4 11.3 PK_C6-C14 1.8 49.5 33.2 33.8 9.5 13.0 44.4 33.9 14.3 44.5 33.6 37.0 PK_C15+ 0.1 35.7 49.7 28.6 0.3 0.2 35.0 51.6 12.4 34.9 51.0 31.4 Pl_Methane 0.0 0.0 0.1 0.1 0.8 0.2 0.0 0.0 1.6 0.0 0.0 0.2 Pl_C2-C5 0.1 0.0 0.2 0.4 0.9 0.8 0.2 0.0 4.1 0.2 0.1 0.3 Pl_PK_C6+ 0.2 0.1 0.9 4.3 2.2 3.0 2.4 0.0 24.8 2.4 0.3 1.2 Pl_PK_C15+ 0.6 0.3 1.2 6.4 0.9 0.1 2.9 0.0 34.0 2.9 0.4 1.5 Sum 100 100 100 100 100 100 100 100 100 100 100 100
Figure 26 Fault distribution, oil and gas accumulations and flow paths (green/red) in the uppermost Plover Sand_1 (present day, colour overlay is depth). The pie diagrams show the compositions of the Jaribu, Tahbilk and Padthaway 1 accumulations.
48

Figure 27 Overview of timing and total volumes of the generated, expelled and accumulated hydrocarbons over time for the entire digital model. Please note that only the generated volumes described here are reliable as discussed in the summary and conclusions.
49

50
Summary and Conclusions
Several scenarios of an original 3D model based on the petroleum systems model of Fujii et
al. (2004) were simulated using the PetroMod™ 3D V.10 modeling software.
In general the results of the modelling study presented here confirms the modelling results
of Fujii et al. (2004) with respect to the timing of generation in the different sub-basins as
well as present day maturity. The main differences between the work of Fujii et al. (2004)
and the work presented here are based on the use of PhaseKinetic models for the individual
source rock formations and the ensuing compositional predictions of the fluids in different
fields.
Source rock transformation ratios as well as the bulk generation rates indicate that the
source rocks are presently still generating. The Central Swan Graben area is presently more
mature than the other kitchen area of the Vulcan Sub-basin, the Cartier Trough.
Within the Swan Graben, the main phase of petroleum generation and migration occurred
for all scenarios between the upper Late Jurassic to the Early Cretaceous. Within the Cartier
Trough, generation/migration occurred later, in the middle and late Tertiary. The modelling
results suggest that both reservoir and sealing units were sufficiently developed to retain
even the initial charge. The Vulcan source rock shows an increase in the degree of kerogen
transformation during the Neogene burial up to the present day indicating currently ongoing
petroleum generation.
Predictions regarding the timing of main hydrocarbon generation match those reported by
Fujii et al. (2004) closely, indicating that the kinetic models used in both cases were also
grossly similar.
The locations of predicted accumulations coincide with the locations of most of the proven
fields. In many cases accumulation sizes and predicted column heights are large, mainly
due to the fact that the resolution of the numerical model is low which leaves rather large
volumes of the cells to be filled.
Modelling results predict a series of accumulations at locations which have, as yet, not been
tested. However, most of them depend on fault closure, thus increasing exploration risk.
The main risks as observed from this modelling exercise are
• source rock presence and definition,
• definition of the traps,
• resolution of the input model,
• cap rock properties, which are still largely unconstrained.
The different scenarios modelled show distinct variations with respect to predicted petroleum
distribution as well as the physical properties of the accumulated fluids. Interestingly Sce-
narios 1 and 2, where only the Vulcan Formation was defined as a source rock, show the
highest GORs. Scenarios 3, 4 and 5 which included the Plover Formation show a predomi-
nance of accumulations with lower GORs which better match the natural fluid compositions.
The reduced gas-proneness of the Plover models indicates that fluids generated by the

deeper source rock probably facilitate expulsion and increase migration efficiency from the
Vulcan source rock in the model. This effect is due to the early saturation of migration path-
ways with hydrocarbons, reducing thus the losses of Vulcan-generated fluids in the form of
residual petroleum saturation. As expulsion from the source rock in the model is controlled
by kerogen conversion, adsorption and pressure gradients within the source rock release of
fluids occurs both in an upward and downward direction. In view of the relatively imperme-
able formations overlying the Vulcan source the bulk of generated hydrocarbons is expelled
into the underlying Plover carrier system, as also indicated by Fujii et al. (2004). If an active
Plover source rock contributes fluids from below into the same carrier system obviously the
migration pathways would be saturated by this early charge first, paving the way for later
Vulcan sourced fluids.
The general observation that GORs sink when the Plover source rock is included is not valid
for all accumulations. A large structural closure east of Maple shows a shift from an oil to an
oil-rimmed gas accumulation in going from Scenarios 1 and 2 to Scenarios 3, 4 and 5. Here
it appears likely that the slight increase in total generated volumes affects the phase state in
a given accumulation. As discussed above, the early saturation of migration pathways by
Plover products would increase migration efficiency of Vulcan products resulting in earlier
migration and accumulation of low maturity petroleum. In the course of simulated time in
the model this would lead to a shift in the maturity of migrating fluids between the two Sce-
nario types (with Plover and without), where in the Vulcan–only case a slightly higher ma-
turity of migrating fluids at any timestep would be expected as compared to slightly lower
maturities where both source rocks are included. Depending then on whether a reservoir
traps the cumulative products generated or an instantaneous phase (only a portion of the
total migrating fluid) then drastic differences in the reservoir fluid composition can be ex-
pected. Identifying the exact process leading to the definition of the fluid type trapped in a
specific trap in a basin model is, however, due to the complexity of the models extremely
difficult.
Due to errors identified in the PetroReport data extraction routine a complete mass balance
of volumes of petroleum generated, expelled and accumulated could not be performed. As
corroborated by IES, when secondary cracking is taken into account the extraction routines
fail to correctly address expelled and accumulated volumes. Generated volumes, however,
are correct as can be seen from the comparison of generated and accumulated volumes of
all Scenarios where differences are only minor. The calculation of the “accumulation effi-
ciency” of the individual scenarios run, which is the percentage of oil accumulated in the Puf-
fin and Plover reservoirs as a function of the total generated, results in values below 2% for
Scenarios 1 to 4 and 2.9% for Scenario 5 where vertical permeable faults were taken into
account. Here it should be noted, that variations in the generated volumes up to around 10-
15% do not imply a drastically different geologic history. Due to the forward modelling ap-
proach used in PetroMod every simulation is unique and a perfect reproduction of earlier re-
sults of e.g. the same simulation is not actually possible. Due to the continuous correction of
sediment deposition rates to decrease the difference between input tops and calculated tops
(the so called “optimisation” procedure in PetroMod) slight differences in sediment thick-
nesses occur between different simulations resulting in slightly different calculation results
with respect to e.g. the amount of hydrocarbons generated.
According to IES the error found in the PetroReport data extraction routines is due to the
complexity of tracking cracking products from different sources as well as the occurrence of
51

cracking both within the source as well as outside of it. It appears unlikely that this error in
PetroMod will be repaired as part of Version 10 patches, or even within Version 11. The er-
ror, however, seems to lie within the data extraction tool and not in the simulation itself. Ac-
cordingly we expect that the results available in the 3D PetroMod viewer are correct and
only data extractions of expelled volumes by PetroReport are in error.
Secondary migration as modelled in the study area is dominantly controlled by capillary fail-
ure of the seals at structural closures or stratigraphic pinch outs. Versions of the model run
taking variable fault properties into account did not result in significant changes in hydrocar-
bon distribution. Even in Scenario 5, where vertical, temporarily permeable faults were im-
plemented no significant increase in accumulation efficiency was monitored (increase from
an average of around 2% to 2.9% in Scenario 5). These results are an artefact of the migra-
tion method used. The Hybrid migration method of PetroMod, where the sedimentary se-
quence is subdivided into carriers and non-carriers based on a permeability threshold, uses
different methods for the calculation of migration in carriers and non-carriers. In non-
carriers migration is calculated assuming Darcy flow. Accordingly permeability, saturation,
viscosity and time are taken into account. In carriers a ray tracing approach is applied,
where migration is instantaneous within the carrier and all fluids in a carrier are moved to
the structurally highest position forming an accumulation or leaking into the next sedimen-
tary unit. In the implementation of vertical faults as conduits of migration the applied Hybrid
migration method hence would only lead to significant vertical flow of hydrocarbons along a
fault if an accumulation is present in contact with the fault. Otherwise the instantaneous
movement of fluids in the carrier to the highest position largely bypasses the faults.
Model resolution and the degree of geologic simplification are the main reasons for the ob-
served controls on migration processes. As discussed earlier, homogeneous sedimentary fa-
cies are assumed for most of the stratigraphic units. In combination with continuous layers
as defined by the maps provided this results in a relatively clear “layer cake” model in which
sedimentary pinch-outs, facies changes and faults play a very subordinate role. Accordingly
capillary entry pressure is the main leakage mechanism modelled, simply because more
complex geologic situations could not be included in the model. Regarding the interpretation
of Kivior et al. (2002), where top seal capillary failure was not seen as the main mechanism
for trap failure, it must be taken into account that the implementation of seal capacity
measurements into a regional model such as the one presented here is complex due to up-
scaling requirements from lab scale to regional scale as well as the implicit assumption that
the measurement made is actually correct for the entire cap rock. Both subjects are the top-
ics of intense discussion both in basin modelling and reservoir engineering circles.
Where terminations were included large stratigraphic accumulations are modelled, e.g. along
the western flank of the Swan Graben within the Plover sand, which is here assumed to be
juxtaposed to the older non-permeable strata along the main boundary fault. The Lower
Cretaceous and Vulcan units provide the cap rocks for these accumulations. While the valid-
ity of this trap type has not been tested in the area it could be indicative of a potential new
play, especially in view of the fact that most of the Cretaceous accumulations west of the
main boundary fault depend on focussing of migration along the flanks of the basin and ver-
tical leakage into the Cretaceous carrier.
Significant variations in predicted versus observed fluid API gravities are due to the lack of
predictive capacity of the compositional kinetic models used. In general even PhaseKinetic
models are not API predictive, as the physical properties of the liquid pseudo-components
52

are identical for all source rock models used. Accordingly these models predict a realistic, al-
beit, limited range of API gravities (usually extending from roughly 30° API during primary
cracking to 50° API when secondary cracking becomes dominant). The 4-compound models
used in this study are known to produce too heavy API gravities; however, the phase behav-
iour of the fluids generated matches that of the PhaseKinetic models (see Appendix 2).
Tagging of the kinetic models for the Vulcan and Plover Formations allowed the recognition
of relative contributions of the individual source units to specific accumulations. In most of
the accumulations a clear dominance of Vulcan generation products is observed, as is the
case for the Eclipse (>95%) or Talbot (100%) accumulations. The Puffin field, however,
shows a marked discrepancy in the model: roughly 70% of the oil is modelled to have been
generated by the Plover Formation. This is most likely due to the location of a high porosity
sandstone defining the drainage area of the Puffin accumulation. This sandstone lies directly
above one of the main depocenters of the Swan Graben, and, hence, catches high maturity
products migrating in a vertical direction. Edwards et al. (2004) argue in favour of migration
up the main boundary fault on the basin margin during fault movement or reactivation. As
discussed earlier the use of faults as vertical migration pathways in PetroMod is difficult to
implement. Accordingly which mechanism is more likely to be the right one is difficult, or
even impossible to test. However, whether the fluids migrate up the fault and into the car-
rier sand or vertically through the Jurassic and Cretaceous sequences via capillary failure
and then into the late Cretaceous carrier system does not make a big difference. Based on
the model results, should the natural composition of the Puffin oil indicate a dominant Vul-
can source then the Puffin Cretaceous drainage area needs to be revised.
Limitations of the 3D model developed in this study are clearly to be found in the model
resolution. A smaller grid size and higher resolution would help in better investigating the
evolution of the study area especially with respect to migration and reservoir filling. A prime
example is the modelled continuous Eclipse accumulation. In the natural system these res-
ervoirs are most likely a series of fault bounded rotated fault blocks; in the model they con-
sist of softly folded continuous sands. Accordingly individual reservoir compartments can not
be modelled and all fluids reaching any of the prospects mix into one single accumulation.
The Tahbilk, Montara, Bilyara and Padthaway fields, as well as the nearby located undrilled
structural closures, are other examples of resolution and geologic simplification problems.
Structural closures in these location were either extremely subtle or essentially absent in the
maps provided, whereas structural closures occur where neighbouring undrilled accumula-
tions are modelled. Definition of a fault bounded trap for these fields was not implemented
due to lack of information regarding the actual prospect structures. For the assessment of
fluid composition and physical properties the structural closure and accumulation west of the
Montara well in the model were assumed to be representative of these fields. In the case of
Bilyara no nearby accumulation was modelled and hence the fields could not be included in
the assessment of Plover vs. Vulcan contributions.
Fluid occurrence and compositional predictions in the South-Western area of the models
were not entirely satisfactory. The predicted main source for the Montara field is the Lower
Vulcan Formation in the model, whereas Edwards et al. (2004) identified a likely Plover ori-
gin of the hydrocarbons. These modelling results possibly indicate that the assumption of
the presence of a Vulcan source rock in the area may be questionable. Additionally, the pos-
sible contribution from a kitchen area outside (South East) of the modelled area supplying
hydrocarbons to this field, e.g. from the Heywood Graben, should be taken into account.
53

Edwards et al. (2004) indicated that the Puffin Field although assigned to their Group A (Vul-
can sourced) could contain an additional input from the Plover formation. Modelling results
indicate a significant Plover contribution as discussed above, attributable to the presence of
an Upper Cretaceous sand body which drapes over the Swan Graben and focusses fluids en-
tering vertically from the Graben towards the flanks of the basin where the Puffin structure
is located. Here again the predicted fluid compositions are obviously controlled by the geo-
logic assumptions implemented into the model.
This study was performed in order to see whether fluid compositional predictions can be
made at a basin scale. In general those models in which both source rocks had been taken
into account gave the best results with respect to predicting the overall distribution of oil vs.
gas in the study area. A high fluid variability was predicted with the co-occurrence of single
phase oil, two phase systems as well as single phase gas accumulations. In general also the
regional distribution was reproduced. When it comes to GOR prediction, the modelling re-
sults tended to be generally in the ball park, but by far not perfect. Predicted GORs are
roughly twice as high as observed, e.g. in Cassini, Challis, Jabiru, Montara and Puffin. Pre-
diction vs. observation of gas and condensate occurrence matched for Swan and Maple. Two
phase systems were correctly predicted for East Swan, Eclipse, Maple and Skua. All of these
results are based on Scenario 3.
The question whether Plover coals generate and expel liquid hydrocarbons can not be an-
swered conclusively by this study. Based on the compositional kinetic models available, one
for each source rock, the Plover source can generate and expel liquids. Plover and Vulcan
source rocks do not differ drastically based on the products they generate upon artificial
maturation. The question remains whether the samples used for the determination of com-
positional kinetics are actually representative for the source rocks in the basin, or whether
facies and ensuing kinetic variability may play an important role in the Vulcan Sub-Basin.
As compared to their studies regarding compositional predictions on a prospect to basin
scale, it has become evident that the larger the scale of the basin, the more difficult it is to
correctly reproduce natural GORs. Studies performed at GFZ as part of industry collabora-
tions have shown that accurate GOR predictions are possible when working close to the
prospect scale (e.g. di Primio & Neumann, 2008; di Primio & Skeie, 2004). Working at a
semi regional to regional scale immediately implies a much lower resolution and therefore a
lower GOR predictive capacity. As seen in the present Vulcan Sub-Basin study, predictions
regarding fluid type and general GOR are, however, still relatively good offering the explora-
tionist at least a rough assessment of the fluid type to be expected and reducing, thus, ex-
ploration risk. For an accurate prediction of petroleum phase and physical properties, how-
ever, a much higher resolution of the model is required, in a stratigraphic, facies, temporal
and structural sense.
54

References Andresen, B., Throndsen, T., Barth, T., Bolstad, J., (1994) Thermal generation of carbon dioxide and organic
acids from different source rocks. Organic Geochemistry, 21(12), 1229-1242.
Behar, F., Ungerer, P., Kressmann, S., Rudkiewicz, J.L., (1991) Thermal evolution of crude oils in sedimentary basins; experimental simulation in a confined system and kinetic modeling. Revue de l'Institut Francais du Petrole, 46(2), 151-181.
Berner, U., Faber, E., Scheeder, G., Panten, D., (1995) Primary cracking of algal and landplant kerogens; ki-netic models of isotope variations in methane, ethane and propane, Processes of natural gas forma-tion, 126; 3-4, pp. 233-245. Elsevier, Amsterdam, Netherlands.
Bradshaw, M.T., Bradshaw, J., Murray, A.P., Needham, D.J., Spencer, L., Summons, R.E., Wilmot, J., Winn, S., (1994) Petroleum systems in West Australian basins. The Sedimentary Basins of Western Australia: Proceedings of Petroleum Exploration Society of Australia Symposium, 1, 93-118.
Cadman, S.J., Temple, P.R., (2003) Bonaparte Basin, NT, WA, AC & JPDA. In: Australian Petroleum Accumula-tions Report 5, 2nd Edition, pp. 335. Geoscience Australia, Canberra.
Chen, G., Hill, K.C., Hoffmann, N., (2002) 3D structural analysis of hydrocarbon migration in the Vulcan sub-basin, Timor Sea. In: The Sedimentary Basins in Western Australia 3, Proceedings in the PESA Sympo-sium, Perth, WA (Ed. by M. Keep, S.J. Moss), Perth.
di Primio, R., Dieckmann, V., Mills, N., (1998) PVT and phase behaviour analysis in petroleum exploration. Organic Geochemistry, 29(1-3), 207-222.
di Primio, R., Horsfield, B., (2004) Development of compositional kinetic models for hydrocarbon generation and phase behaviour modelling. In: Goldschmidt Conference, Copenhagen.
di Primio, R., Horsfield, B., (2006) From petroleum type organofacies to hydrocarbon phase prediction. AAPG Bulletin, 90(7), 1031-1058.
di Primio, R., Neumann, V., (2008) HPHT reservoir evolution: a case study from Jade and Judy fields, Central Graben, UK North Sea. In: International Journal of Earth Sciences, 97 (Ed. by U. Bayer, D. Gajewski, R. Littke), pp. 1101-1114. Springer.
di Primio, R., Skeie, J.E., (2004) Development of a compositional kinetic model for hydrocarbon generation and phase equilibria modelling: a case study from Snorre Field, Norwegian North Sea. In: J.M. Cubitt, Eng-land, W. A., Larter, S. (Ed.), Understanding Petroleum Reservoirs: towards an Intefrated Reservoir En-gineering and Geochemical Approach, 237 (Ed. by J.M. Cubitt, England, W. A., Larter, S.), pp. 157-174. Geological Society, London.
Dieckmann, V., Schenk, H.J., Horsfield, B., Welte, D.H., (1998) Kinetics of petroleum generation and cracking by programmed-temperature closed-system pyrolysis of Toarcian Shales. Fuel, 77(1-2), 23-31.
Edwards, D.S., Preston, J.C., Kennard, J.M., Boreham, C.J., van Aarssen, B.G.K., Summons, R.E., Zumberge, J.E., (2004) Geochemical characteristics of hydrocarbons from the Vulcan Sub-basin, western Bona-parte Basin, Australia. Special Publication - Northern Territory Geological Survey, 1, 31.
Erdmann, M., (1999) Gas generation from overmature Upper Jurassic source rocks, Northern Viking Graben, pp. 128. Berichte des Forschungszentrum Jülich.
Fujii, T., O'Brien, G.W., Tingate, P.R., Chen, G., (2004) Using 2D and 3D basin modelling to investigate controls on hydrocarbon migration and accumulation in the Vulcan Sub-basin, Timor Sea, Northwestern Austra-lia. APPEA Journal, 93-122.
Horsfield, B., Schenk, H.J., Mills, N., Welte, D.H., (1992) An investigation of the in-reservoir conversion of oil to gas; compositional and kinetic findings from closed-system programmed-temperature pyrolysis, Ad-vances in organic geochemistry 1991; Part 1, Advances and applications in energy and the natural en-vironment, 19; 1-3, pp. 191-204. Pergamon, Oxford-New York, International.
IES, (2002) PetroMod© Reference Manual - version 8.0. Jülich, Germany, Jülich, Germany.
55

Kennard, J.M., Deighton, I., Edwards, D.S., Colwell, J.B., O'Brien, G.W., Boreham, C.J., Anonymous, (1999) Thermal history modelling and transient heat pulses: new insights into hydrocarbon expulsion and "hot flushes" in the Vulcan Sub-Basin, Timor Sea. APPEA Journal, 39(1), 177-207.
Kivior, T., Kaldi, J.G., Lang, S.C., (2002) Seal potential in Cretaceous and Late Jurassic rocks of the Vulcan Sub-basin, North West Shelf, Australia. APPEA Journal, 42(1), 203-224.
Longley, I.M., Buessenschuett, C., Clydsdale, L., Cubitt, C.J., Davis, R.C., Johnson, M.K., Marshall, N.M., Murray, A.P., Somerville, R., Spry, T.B., Thompson, N.B., (2002) The North West Shelf of Australia; a Woodside perspective. The Sedimentary Basins of Western Australia: Proceedings of Petroleum Explo-ration Society of Australia Symposium, 3, 27-88.
Mango, F.D., (1996) Transition metal catalysis in the generation of natural gas. Organic Geochemistry, 24(10-11), 977-984.
Mango, F.D., (1997) The light hydrocarbons in petroleum: a critical review. Organic Geochemistry, 26(7-8), 417-440.
Michels, R., Enjelvin-Raoult, N., Elie, M., Mansuy, L., Faure, P., Oudin, J.-L., (2002) Understanding of reservoir gas compositions in a natural case using stepwise semi-open artificial maturation. Marine and Petro-leum Geology, 19(5), 589-599.
Pedersen, K.S., Fredenslund, A., Thomassen, P., (1989) Properties of oils and natural gases. Gulf Publishing Company, Houston.
Schenk, H.J., Horsfield, B., Krooss, B., Schaefer, R.G., Schwochau, K., (1997) Kinetics of petroleum formation and cracking, Petroleum and basin evolution; insights from petroleum geochemistry, geology and ba-sin modeling. Springer, Berlin, Federal Republic of Germany.
Yalcin, M.N., Littke, R., Sachsenhofer, R.F., (1997) Thermal history of sedimentary basins, Petroleum and basin evolution; insights from petroleum geochemistry, geology and basin modeling, pp. 71-167. Springer, Berlin, Federal Republic of Germany.
Yielding, G., Freeman, B., Needham, D.T., (1997) Quantitative fault seal prediction. AAPG Bulletin, 81(6), 897-917.
56

Appendix 1
Compositional Kinetic Models
Table 14 Activation energies and frequency factors used for each compound of the compositional kinetic models.
G005732 4-Comp_Crack
Methane
C2-C5
PK_C6-C14
PK_C15+
Ratio [%] 6.09 10.98 35.57 47.36 Sorption [g/gKerC] 0.1 0 0 0 Frequency Factor [my-1] 5.1924E+26 5.1924E+26 5.1924E+26 5.1924E+26 Activation Energy Initial Ratio 44 0.06 0.067 0.073 0.091 45 0.045 0.05 0.055 0.068 46 0.534 0.592 0.652 0.803 47 0.105 0.117 0.129 0.158 48 0 0 0 0 49 0 0 0 0 50 17.605 19.471 22.197 26.53 51 23.035 24.838 27.51 30.732 52 18.953 19.215 18.94 19.719 53 20.069 18.038 15.404 11.081 54 7.275 6.539 5.585 4.017 55 4.553 4.092 3.494 2.514 56 2.853 2.564 2.19 1.575 57 2.219 1.994 1.703 1.225 58 0 0 0 0 59 0.807 0.725 0.619 0.445 60 1.542 1.386 1.183 0.851 61 0 0 0 0 62 0.346 0.311 0.265 0.191 63 0 0 0 0 64 0 0 0 0 Sum 100 100 100 100 G005733 4-Comp_Crack_Plover
Methane
C2-C5
PK_C6-C14
PK_C15+
Ratio [%] 7.96 10.83 33.71 47.51 Sorption [g/gKerC] 0.1 0 0 0 Frequency Factor [my-1] 4.8386E+28 4.8386E+28 4.8386E+28 4.8386E+28 Activation Energy Initial Ratio 46 0 0 0 0 47 0 0 0 0 48 0 0 0 0 49 0.146 0.207 0.247 0.237 50 0 0 0 0 51 0.254 0.361 0.429 0.413 52 0.127 0.18 0.215 0.206 53 0 0 0 0 54 0 0 0 0 55 10.373 14.747 17.547 16.867 56 7.513 10.398 18.16 15.419 57 9.216 11.564 18.928 16.07 58 7.121 9.049 12.584 10.592 59 7.507 9.308 11.209 8.707 60 4.866 6.033 7.265 5.643 61 11.929 8.606 3.025 5.829 62 7.49 5.403 1.899 3.66 63 7.111 5.13 1.803 3.475 64 4.355 3.142 1.104 2.128 65 4.187 3.02 1.062 2.046 66 1.641 1.184 0.416 0.802 67 4.628 3.339 1.174 2.262 68 0 0 0 0 69 4.081 2.945 1.035 1.994 70 1.473 1.062 0.373 0.72 71 0.505 0.364 0.128 0.247 72 0 0 0 0 73 5.47 3.946 1.387 2.673 Sum 99.99 99.99 99.99 99.99
57

Figure 28 Distribution of activation energies of the source rocks and subdivision of the individual energies into potentials for different compounds. Upper: Compositional kinetic G005732 4-Comp_Crack (Vulcan se-quence). Lower: G005733 4-Comp_Crack_Plover for the Plover source rock interval. Grey: Methane, blue: C2-C5, pink: PK C6-C14; green: PK C15+.
58

Figure 29 Generation rates and curves Vulcan source rock compositional kinetics.
Figure 30 Generation rates and curves for the Plover source rock compositional kinetics.
59

Cumulative Volumes
Table 15 Cumulative masses (in Mtons) of the petroleum systems calculated for Scenario 1.
Scenario 1 Remaining Generation Generated by Facies Potential Accumulated Liquid Vapor Adsorbed Balance Primary Cracking Pliocene 0.0 3.1 3.1 0.0 0.0 0.0 0.0 Mionene 0.0 4.8 4.8 0.0 0.0 0.0 0.0 Eocene 0.0 7.5 7.5 0.0 0.0 0.0 0.0 Paleocene 0.0 6.6 6.6 0.0 0.0 0.0 0.0 U_Creta_SS50% 0.0 6.9 6.9 0.0 0.0 0.0 0.0 U_Creta_SS75% 0.0 0.5 0.5 0.0 0.0 0.0 0.0 U_Cret_(Puffin) 0.0 18.2 18.2 0.0 0.0 0.0 0.0 L_Cretaceous 0.0 39.7 39.6 0.1 0.0 0.0 0.0 U_Vulcan(sq-4c) 0.0 54.7 54.1 0.6 0.0 0.0 0.0 L_Vulcan_U(sq-4b) 0.0 206.7 204.7 2.0 0.0 -10.1 0.0 L._Vulcan_L(sq-4a)_SW 0.0 0.0 0.0 0.0 0.0 0.0 0.0 L._Vulcan_L(sq 4a)_(Montarra) 14601.0 12450.0 8770.7 493.1 3185.9 14649.0 20823.0 Plover_Res 0.0 378.1 356.8 21.3 0.0 -65.6 0.0 Plover_Res 0.0 0.0 0.0 0.0 0.0 0.0 0.0 M_Jura_and_Triassic 0.0 0.0 0.0 0.0 0.0 0.0 0.0 total 14601.0 13176.7 9473.4 517.1 3185.9 14573.3 20823.0
Table 16 Cumulative masses (in Mtons) of the petroleum systems calculated for Scenario 2.
Scenario 2 Remaining Generation Generated by Facies Potential Accumulated Liquid Vapor Adsorbed Balance Primary Cracking Pliocene 0.0 3.0 3.0 0.0 0.0 0.0 0.0 Mionene 0.0 4.8 4.8 0.0 0.0 0.0 0.0 Eocene 0.0 7.4 7.4 0.0 0.0 0.0 0.0 Paleocene 0.0 6.5 6.5 0.0 0.0 0.0 0.0 U_Creta_SS50% 0.0 7.7 7.7 0.0 0.0 0.0 0.0 U_Creta_SS75% 0.0 0.7 0.7 0.0 0.0 0.0 0.0 U_Cret_(Puffin) 0.0 18.6 18.6 0.0 0.0 0.0 0.0 L_Cretaceous 0.0 39.9 39.8 0.1 0.0 0.0 0.0 U_Vulcan(sq-4c) 0.0 54.2 53.6 0.6 0.0 0.0 0.0 L_Vulcan_U(sq-4b) 0.0 207.2 205.2 2.0 0.0 -9.9 0.0 L._Vulcan_L(sq-4a)_SW 428.6 179.8 98.9 0.0 80.9 205.8 208.3 L._Vulcan_L(sq 4a)_(Montarra) 14639.0 12429.0 8750.2 494.5 3184.8 14624.0 20786.0 Plover_Res 0.0 398.9 377.7 21.1 0.0 -64.6 0.0 Plover_Res 0.0 0.0 0.0 0.0 0.0 0.0 0.0 M_Jura_and_Triassic 0.0 0.0 0.0 0.0 0.0 0.0 0.0 total 15067.6 13357.8 9574.3 518.4 3265.7 14755.3 20994.3
Table 17 Cumulative masses (in Mtons) of the petroleum systems calculated for Scenario 3.
Scenario 3 Remaining Generation Generated by Facies Potential Accumulated Liquid Vapor Adsorbed Balance Primary Cracking Pliocene 0.0 5.4 5.4 0.0 0.0 0.0 0.0 Mionene 0.0 6.6 6.6 0.0 0.0 0.0 0.0 Eocene 0.0 9.4 9.4 0.0 0.0 0.0 0.0 Paleocene 0.0 7.1 7.1 0.0 0.0 0.0 0.0 U_Creta_SS50% 0.0 4.8 4.8 0.0 0.0 0.0 0.0 U_Creta_SS75% 0.0 0.2 0.1 0.1 0.0 0.0 0.0 U_Cret_(Puffin) 0.0 22.5 22.4 0.1 0.0 0.0 0.0 L_Cretaceous 0.0 36.9 35.5 1.4 0.0 0.0 0.0 U_Vulcan(sq-4c) 0.0 40.7 24.9 15.8 0.0 0.0 0.0 L_Vulcan_U(sq-4b) 0.0 210.6 25.8 184.8 0.0 -0.3 0.0 L._Vulcan_L(sq-4a)_SW 431.7 178.3 97.5 0.0 80.8 204.6 205.3 L._Vulcan_L(sq 4a)_(Montarra) 14752.0 14142.0 6717.2 4239.4 3184.9 18138.0 20739.0 Plover_Res 0.0 317.4 287.8 29.6 0.0 -21.9 0.0 Plover_SR 4155.2 401.8 17.4 0.0 384.4 1419.3 1419.3 Plover_Res 0.0 206.0 206.0 0.0 0.0 0.0 0.0 M_Jura_and_Triassic 0.0 0.0 0.0 0.0 0.0 0.0 0.0 total 19338.9 15589.7 7468.0 4471.1 3650.2 19739.8 22363.6
60

Table 18 Cumulative masses(in Mtons) of the petroleum systems calculated for Scenario 4.
Scenario 4 Remaining Generation Generated by Facies Potential Accumulated Liquid Vapor Adsorbed Balance Primary Cracking Pliocene 0.0 5.4 5.4 0.0 0.0 0.0 0.0 Mionene 0.0 6.6 6.5 0.0 0.0 0.0 0.0 Eocene 0.0 9.6 9.6 0.0 0.0 0.0 0.0 Paleocene 0.0 7.6 7.6 0.0 0.0 0.0 0.0 U_Creta_SS50% 0.0 4.7 4.7 0.0 0.0 0.0 0.0 U_Creta_SS75% 0.0 0.2 0.1 0.1 0.0 0.0 0.0 U_Cret_(Puffin) 0.0 22.5 22.4 0.1 0.0 0.0 0.0 L_Cretaceous 0.0 37.8 36.5 1.3 0.0 0.0 0.0 U_Vulcan(sq-4c) 0.0 41.1 25.3 15.8 0.0 0.0 0.0 L_Vulcan_U(sq-4b) 0.0 213.6 25.3 188.3 0.0 -0.3 0.0 L._Vulcan_L(sq-4a)_SW 428.5 180.9 100.0 0.0 80.9 207.6 208.4 L._Vulcan_L(sq 4a)_(Montarra) 14631.0 14029.0 6497.9 4343.3 3187.4 18146.0 20794.0 Plover_Res 0.0 319.0 289.5 29.6 0.0 -20.6 0.0 Plover_SR 4138.3 405.3 17.8 0.0 387.5 1435.0 1435.0 Plover_Res 0.0 202.7 202.7 0.0 0.0 0.0 0.0 M_Jura_and_Triassic 0.0 0.0 0.0 0.0 0.0 0.0 0.0 total 19197.8 15485.8 7251.2 4578.5 3655.8 19767.7 22437.3
Table 19 Cumulative masses(in Mtons) of the petroleum systems calculated for Scenario 5.
Scenario 5 Remaining Generation Generated by Facies Potential Accumulated Liquid Vapor Adsorbed Balance Primary Cracking Pliocene 0.0 6.0 6.0 0.0 0.0 0.0 0.0 Mionene 0.0 7.1 7.1 0.0 0.0 0.0 0.0 Eocene 0.0 9.2 9.2 0.0 0.0 0.0 0.0 Paleocene 0.0 5.4 5.4 0.0 0.0 0.0 0.0 U_Creta_SS50% 0.0 12.2 12.1 0.0 0.0 0.0 0.0 U_Creta_SS75% 0.0 2.5 2.5 0.0 0.0 0.0 0.0 U_Cret_(Puffin) 0.0 26.6 26.6 0.0 0.0 0.0 0.0 L_Cretaceous 0.0 40.0 39.4 0.6 0.0 0.0 0.0 U_Vulcan(sq-4c) 0.0 70.4 59.6 10.8 0.0 0.0 0.0 L_Vulcan_U(sq-4b) 0.0 235.1 76.7 158.3 0.0 -0.8 0.0 L._Vulcan_L(sq-4a)_SW 347.9 254.1 174.0 0.0 80.1 295.3 297.7 L._Vulcan_L(sq 4a)_(Montarra) 13398.0 13023.0 6782.4 2913.3 3327.7 19997.0 22529.0 Plover_Res 0.0 687.2 659.8 27.4 0.0 -29.5 0.0 Plover_SR 3937.2 446.0 21.0 0.0 425.0 1592.7 1592.7 Plover_Res 0.0 381.4 381.4 0.0 0.0 0.0 0.0 M_Jura_and_Triassic 0.0 0.0 0.0 0.0 0.0 0.0 0.0 total 17683.1 15206.0 8263.1 3110.5 3832.8 21854.6 24419.4
61

Appendix 2
Comparison of petroleum physical property predictions of 4-compound and PhaseKinetic models
In the generation of compositional kinetic models using the PhaseKinetic approach the bulk
kinetics of the individual samples are populated with compositional data from closed system
pyrolysis experiments at increasing levels of transformation (di Primio & Horsfield, 2006).
As the initial compositional information is derived from the same experiment in each case a
difference with respect to the physical properties of the fluids calculated can only be due to
differences in the physical properties of the compound groups or pseudo-components.
Figure 31 shows a comparison of 4-compound and 14-compound physical property predic-
tions for one of the standard PetroMod PhaseKinetic models. The results shown are based
on implementation of the kinetics in a simple PetroMod 2D model in which a static geologic
scenario is heated at a constant geologic heating rate of approximately 1°/Ma. The model
used is described in di Primio and Skeie (2004). The evolution of saturation pressure and
GOR in Figure 31 indicates that both kinetic models provide essentially very similar predic-
tions, as expected.
IES_Woodford Shale
0
50
100
150
200
250
300
0 50 100 150 200 250 300 350
GOR (Sm3/Sm3)
Psat
(bar
)
4-Comp
14-Comp
Figure 31 Comparison of 4-compound vs. 14-compound kinetic model predictions for saturation pressure (Psat) and GOR.
The results shown in Figure 31 are based on the calculations of primary cracking only. In
order to take secondary cracking into account the reaction kinetics of cracking, the com-
pounds generated by cracking as well as the proportion of dead carbon remaining need to
be defined for each compound which is expected to crack as a function of increasing thermal
stress.
In the secondary cracking model implemented in the PhaseKinetics approach, the assump-
tion is made that the entire phase generated by the source rock behaves uniformly with re-
62

spect to its adsorption potential to dead kerogen. No differentiation is made between a
more-adsorptive oil phase and a less adsorptive gas phase as described by Pepper and
Corvi (1995). Accordingly the definition of the adsorption potential (0.1 equivalent to 10%)
in PetroMod applies to all components and not only the one it is defined for. In the applied
model cracking of the adsorbed entire phase (or only those compound for which cracking is
defined, i.e. the liquid compounds from C7 onwards) results in the generation of methane
by secondary cracking. Due to the change in composition, the volume of the adsorbed
phase increases and excess volume is expelled. Methane was selected as the only product
of cracking based on observations made on natural petroleum maturity series.
0
5
10
15
20
25
43.4
45.4
47.4
49.4
51.4
53.4
55.4
57.4
59.4
61.4
63.4
65.4
67.4
69.4
Ea (kcal)
Pote
ntia
l (%
)
Type I Type IIType IIS
0
2
4
6
8
10
12
14
16
18
43.4
45.4
47.4
49.4
51.4
53.4
55.4
57.4
59.4
61.4
63.4
65.4
67.4
69.4
71.4
Ea (kcal)
Pote
ntia
l (%
)
Type IIIType III-IV
Figure 32 Activation energy distributions for secondary cracking of oil to gas for products different kerogen types after Pepper and Corvi (1995).
63

Pepper and Corvi (1995) defined secondary cracking kinetics for products of different kero-
gen types for a two compound system. The main assumption there was that liquid hydro-
carbons retained by adsorption to dead carbon within the source rock cracked to gaseous
hydrocarbons following the kinetics defined by the parent kerogen type. The activation en-
ergy (Ea) distributions for secondary cracking for individual kerogen types are shown in
Figure 32. Here it is evident that the Ea distributions are very similar for products from
kerogen types I, II and II-S, and for types III and IV. Since all Ea distributions were as-
signed the same frequency factor differences in kinetics are controlled exclusively by the Ea
distribution. For the PhaseKinetic approach the Pepper and Corvi (1995) model had to be
expanded to multi component systems. Here the simplification was made that only two Ea
distributions are required: one for kerogen types I, II and II-S and a second for the types
III and IV. For PhaseKinetics the Type II cracking kinetics of Pepper and Corvi (1995) were
subdivided into six sets of kinetics, one for each pseudo-component. In each case a gaus-
sian Ea distribution was assigned to a pseudo-component and each Ea distribution increased
by 1 kcal with increasing pseudo-component number. Figure 33 shows the summed crack-
ing kinetics for secondary cracking of the pseudo-components of the 14-compound kinetic
models. For the 4-compound kinetics only two liquid pseudo-components are defined. The
first is identical to the pseudo-C10 definition of the 14-compound model; the second is
equivalent to the sum of the other five pseudo-components. The secondary cracking model
was thus simply downscaled from that of the 14-compound model. The cracking kinetics of
the 4-compound model are shown in Figure 34.
0
5
10
15
20
25
49.4
50.4
51.4
52.4
53.4
54.4
55.4
56.4
57.4
58.4
59.4
60.4
61.4
62.4
63.4
64.4
65.4
66.4
Ea (kcal)
Pote
ntia
l (%
)
PK_60+PK_50PK_40PK_30PK_20PK_10
Figure 33 Cracking kinetics implemented in the 14-compound PhaseKinetic models.
64

0
5
10
15
20
25
49.4
50.4
51.4
52.4
53.4
54.4
55.4
56.4
57.4
58.4
59.4
60.4
61.4
62.4
63.4
64.4
65.4
66.4
Ea (kcal)
Pote
ntia
l (%
)
PK_15+PK_7-14
Figure 34 Cracking kinetics implemented in the 4-compound PhaseKinetic models.
As the initial data from which both cracking models were defined is identical the resulting
predictions regarding amount and timing of gas generation from secondary cracking is also
identical.
Secondary cracking models for Type III and IV kerogen follow the same methodology.
65

Methodology and background information on the PhaseKinetics approach.
The phase behaviour of migrating petroleum fluids is controlled by the fluids composition.
The geological conditions upon which a migrating oil separates into oil and gas are strongly
controlled by the gas (C1-C5) composition of the fluid (di Primio et al., 1998). For petro-
leum phase behaviour gas composition plays the dominant role with respect to the fluids
saturation pressure and shrinkage behaviour, however, influence of the liquid fraction com-
position should not be neglected.
The gross description of oil and gas generation from closed system pyrolysis results, and
the surface GORs derived therefrom, are very similar to the GOR distributions observed in
nature. Hence, it appears that the relative gas and oil proportions generated as a function of
maturity can be estimated based on laboratory experiments.
Compositional predictions are, however, not as straight forward. High methane contents
generally result in phase separation at relatively high pressures, i.e. at great depth. A very
wet gas composition results in a much lower saturation pressure (Psat) for a given fluid. The
sensitivity of gas composition on phase behaviour of migrating hydrocarbons has severe im-
plications for the prediction of petroleum phase behaviour during petroleum generation and
migration. Mango (1996; 1997) documented the discrepancy between gas compositions
generated by pyrolysis of source rocks or oils and natural fluids. As discussed by Mango
(1996; 1997) natural fluids display a much stronger predominance of methane in their gas
fractions than observed in source rock pyrolysates. Interestingly, the lack of predictive abil-
ity of laboratory experiments is common to all experimental approaches: published gas
compositions from closed system hydrous pyrolysis (Andresen et al., 1994), closed system
anhydrous pyrolysis (Behar et al., 1991; Dieckmann et al., 1998; Erdmann, 1999; Michels
et al., 2002) and open system pyrolysis (Berner et al., 1995) of Type I, II and III source
rocks all show the same systematics.
It is commonly known that for genetically related fluids saturation pressure correlates line-
arly to GOR and formation volume factor (Bo). As discussed above the methane content of a
fluid is the most important factor controlling its saturation pressure. Hence, a correction of
the gas compositions generated by pyrolysis is possible assuming a linear relationship be-
tween the methane proportion of the gas phase (C1-C5) and the fluids GOR. The equation
used for methane correction in this study is based on linear regression using a natural data-
set from the North Sea representative of the black oil to gas-condensate range (correlation
coefficient for the relationship between GOR and C1/C2-5 r2=0.98). The original GOR used
as a starting point for the methane correction was that determined on the MSSV pyrolysates
and converted to volumetric data by a single stage flash using PVT simulation software.
The characterisation of the generated fluids oil composition (C6+) for phase behaviour as-
sessment is based on the compositional information from MSSV analysis. The resolved com-
pounds from C6 onwards were quantified, their proportions converted to molar amounts and
these were summed to a total description of the liquid phase which consisted of a pseudo
compound C6 (containing all resolved compounds in the range eluting after Pentane until
and including Hexane) and a C7+ fraction (containing the rest of the resolved compounds).
The C7+ fraction was further characterised by a molecular weight and density. The molecu-
lar weight of the C7+ fraction was determined by subdividing the GC hump (MSSV total mi-
66

nus resolved compounds) into boiling ranges according to the resolved n-alkanes, and using
the average molecular weights of the resolved compounds as representative of the respec-
tive hump range. Quantification of the subdivisions led thus to an averaged molecular
weight of the entire hump. The density of the C7+ fraction was determined using a C7+
molecular weight – density correlation for natural petroleums from the North Sea.
The compositional description obtained by these methods is ideal for initial phase behaviour
calculations. For the determination of a compositional kinetic model, however, a C7+ frac-
tion consisting of molar amount, molecular weight and density was inappropriate. In PVT
simulators the C7+ fraction definition is used to calculate a distribution of components rep-
resenting the total liquid phase. This so called C7+ characterisation consists in representing
the hydrocarbons with seven and more carbon atoms as a reasonable number (generally
12) of pseudo-components (with specific equation of state parameters) whereby a logarith-
mic relationship between the molar concentration zN, of a given fraction and the corre-
sponding carbon number, CN, for CN >7 is assumed (Pedersen et al., 1989). This charac-
terisation leads to the automatic definition of a set of additional compounds of increasing
molecular weight (usually up to the molecular weight range corresponding to alkane
chainlengths of C80-C100). For this study a series of 6 pseudo compounds were defined:
P10, P20, P30, P40, P50 and P60+. The physical properties of the individual pseudo com-
pounds remain constant for all sample types, only their molar proportion varies depending
on the samples original composition. This subdivision of the C7+ fraction into 6 additional
fractions was tested to be the minimum number of pseudo compounds required for satisfac-
tory calculation of phase behaviour.
The determined PVT descriptions of the fluids at different transformation ratios are used for
the definition of the compositional kinetic models. The individual potentials per activation
energy derived from the bulk kinetic analysis of the samples are subdivided into 14 sub-
potentials, one for each compound described in the PVT dataset. The PVT data is assigned
to individual bulk potentials based on its transformation ratio. For example bulk potentials
below a TR of 20% were assigned the compositional description of the 10% TR MSSV ex-
periment, from 20 to under 40% TR the 30% TR compositional description is used, etc. The
final compositional kinetic models, hence, consist of an activation energy distribution for
each compound (potentials normalised to 100%) as well as a total potential for each com-
pound (again normalised to 100%). In combination with the sample HI and TOC absolute
potentials can be calculated.
67