Embed Size (px)
Citation preview
Source Parameter Source Parameter Estimates from Radiosonde Estimates from Radiosonde
Data.Data.
by by
Marvin A. Geller - Stony Brook UniversityMarvin A. Geller - Stony Brook University
Jie Gong - Stony Brook UniversityJie Gong - Stony Brook University
Ling Wang - Colorado Research AssociatesLing Wang - Colorado Research Associates

The “holy grail’ in gravity wave research is to The “holy grail’ in gravity wave research is to develop a practical, physically justified develop a practical, physically justified gravity wave parameterization for use in gravity wave parameterization for use in general circulation models.general circulation models.
McLandress and Scinocca (JAS, 1995, 2394-McLandress and Scinocca (JAS, 1995, 2394-2413) compared the performance of a number 2413) compared the performance of a number of gravity wave parameterization schemes of gravity wave parameterization schemes and concluded that they gave very similar and concluded that they gave very similar results if their wave breaking occurred as results if their wave breaking occurred as similar altitudes. This implies that similar altitudes. This implies that determination of the source spectrum is the determination of the source spectrum is the most important thing.most important thing.

In a series of two papers (Vincent and In a series of two papers (Vincent and Alexander, Alexander, JGRJGR, , 105105, 17,971-17,982 and , 17,971-17,982 and
Alexander and Vincent, Alexander and Vincent, JGRJGR, , 105105, 17,983-, 17,983-17,993) derived time series of gravity wave 17,993) derived time series of gravity wave energy and vertical flux of zonal momentum energy and vertical flux of zonal momentum from high vertical-resolution radiosonde data from high vertical-resolution radiosonde data
for 6-years of data from Cocos Islandfor 6-years of data from Cocos Island
(12 (12 00S, 97 S, 97 00E). They then did a best fit analysis E). They then did a best fit analysis to determine the gravity wave source spectrum to determine the gravity wave source spectrum
that was most consistent with these results.that was most consistent with these results.

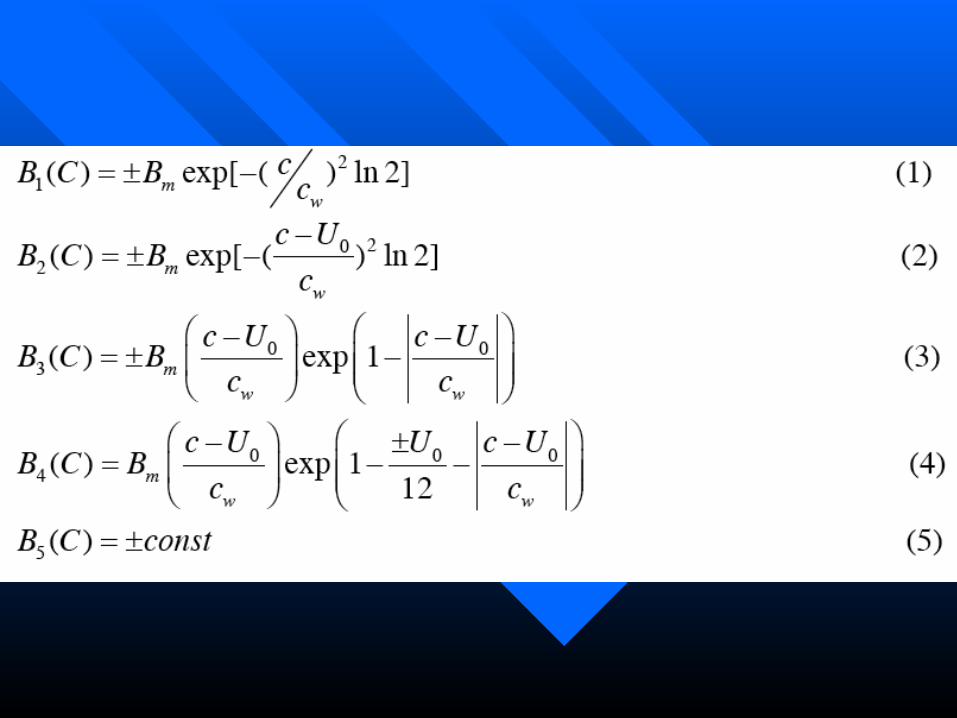
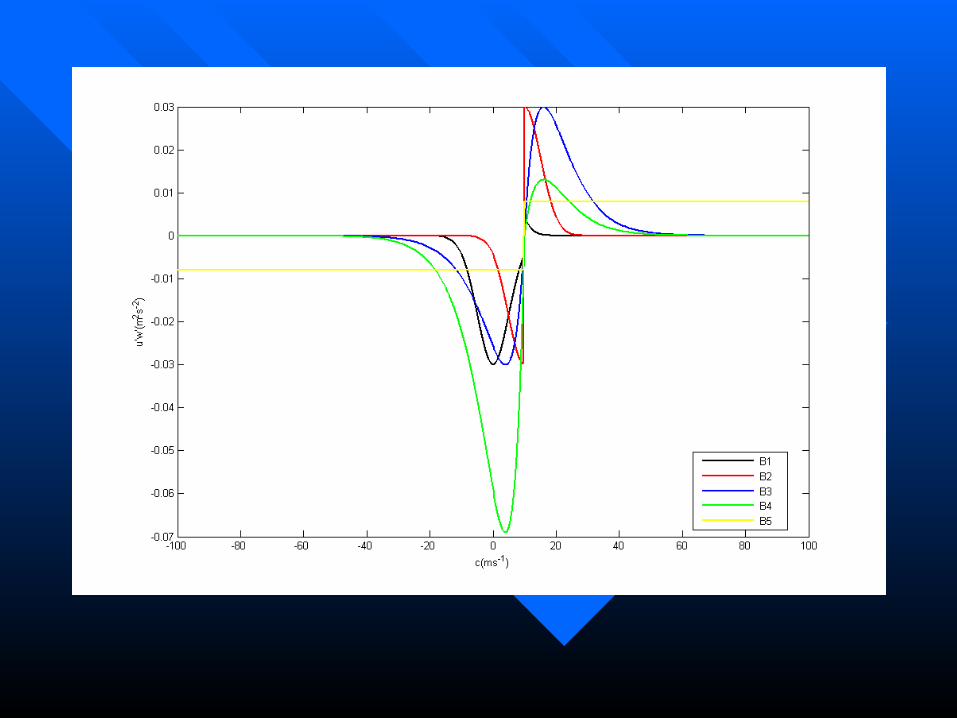
Solid Line - Gaussian, c = 0
Dotted Line = Gaussian, c = u0
Dashed Line - Antisymmetric, Isotropic
Dash-Dot Line - Antisymmetric, anisotropic (“moving mountain) Pfister et al., 1993, JGR
From Alexander and Vincent (2000)


In his PhD thesis, Dr. Ling Wang did a similar In his PhD thesis, Dr. Ling Wang did a similar analysis for 21 US radiosonde sites. He found analysis for 21 US radiosonde sites. He found
that using the techniques of Alexander and that using the techniques of Alexander and Vincent (2000), he could get good fits to the time Vincent (2000), he could get good fits to the time
series for a four-year time series for lower series for a four-year time series for lower stratosphere gravity wave energy and vertical stratosphere gravity wave energy and vertical flux of zonal momentum for 9 of these sites.flux of zonal momentum for 9 of these sites.
Ms. Jie Gong, a Stony Brook PhD student, is Ms. Jie Gong, a Stony Brook PhD student, is extending this work to all of the 93 US extending this work to all of the 93 US
radiosonde sites for an 8-year time series. Here, radiosonde sites for an 8-year time series. Here, I show some early results.I show some early results.


High Correlation ExamplesHigh Correlation ExamplesSt. Paul Island, AK Koror/Palau Island
r = 0.633
r = 0.577
r = 0.564
r = 0.553

Low Correlation ExamplesLow Correlation ExamplesWilmington, OH Yap Island
r = 0.874
r = 0.380
r = 0.510
r = 0.324

Some ConclusionsSome Conclusions
1.1. Among the 93 stations for which we have data, 4 lack Among the 93 stations for which we have data, 4 lack sufficiently complete data to be analyzed.sufficiently complete data to be analyzed.
2.2. Correlations have been calculated for 62 of these stations, and Correlations have been calculated for 62 of these stations, and 31 have absolute values for the correlation, 31 have absolute values for the correlation, rr > 0.25, > 0.25, between the lower stratospheric gravity wave energy and the between the lower stratospheric gravity wave energy and the vertical momentum flux of and vertical momentum flux of and rr > 0.34 for the correlation > 0.34 for the correlation between the source flux and the simulated momentum flux, between the source flux and the simulated momentum flux, which Dr. Ling Wang found to be necessary to get a “good which Dr. Ling Wang found to be necessary to get a “good fit” (Efit” (Ett -> -> rr > 0.5, > 0.5,
mom. flux -> mom. flux -> rr > 0.3, all with the same intermittency). > 0.3, all with the same intermittency).
3.3. Simulations have been run so far for 32 stations, out of which Simulations have been run so far for 32 stations, out of which a “good fit” is found for 19 of these, all of which satisfy a “good fit” is found for 19 of these, all of which satisfy Wang’s criteria.Wang’s criteria.

Some Conclusions (continued)Some Conclusions (continued)
4.4. Correlation for ECorrelation for Ett rr > 0.5 can be obtained for all the > 0.5 can be obtained for all the
simulated 32 stations with at least one combination of simulated 32 stations with at least one combination of parameters.parameters.
5.5. The B1 spectral shape tends to give the “best fit” for The B1 spectral shape tends to give the “best fit” for > 30 > 30 00N, N, while the B4 spectral shape tends to give the “best fit for while the B4 spectral shape tends to give the “best fit for
< 30 < 30 00N.N.
6.6. For the B1 type, For the B1 type, xx generally increases with latitude, while generally increases with latitude, while
there’s no obvious trend for the B4 types.there’s no obvious trend for the B4 types.
7.7. All the “good fit” simulations are obtained with a source All the “good fit” simulations are obtained with a source altitude of 17.75 km.altitude of 17.75 km.