Embed Size (px)
Citation preview
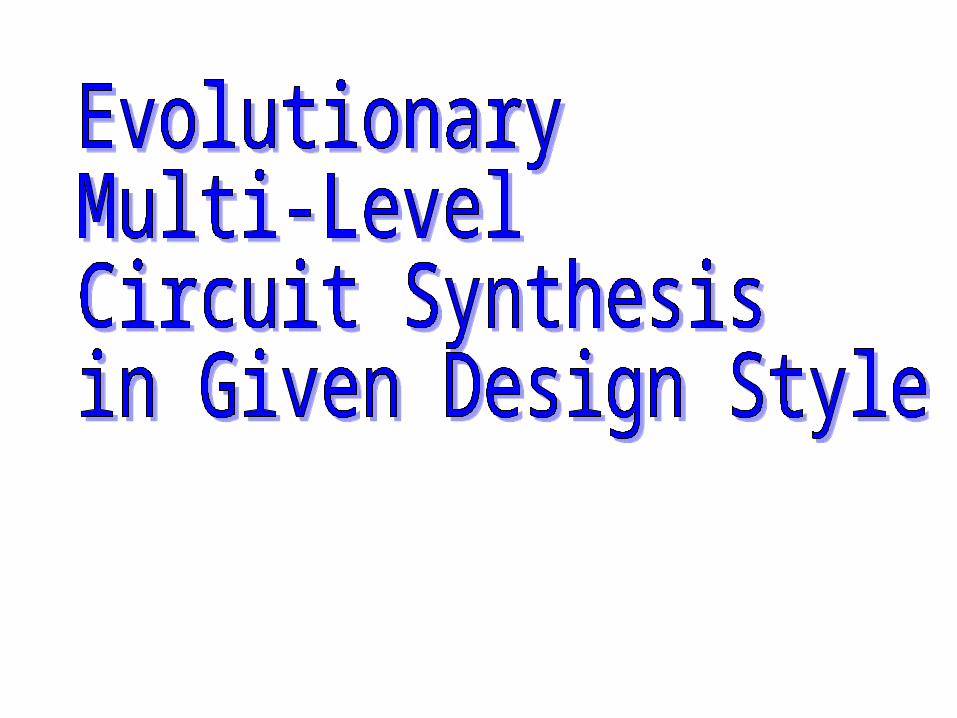
SOURCE Life as Darwin theory of random mutation under selective
pressure
SURPRIZE Utilization for circuit design
APPROACH Partition of search space + target design style +
Information measures
BENEFIT Clever algorithms for circuit design + massive parallelism
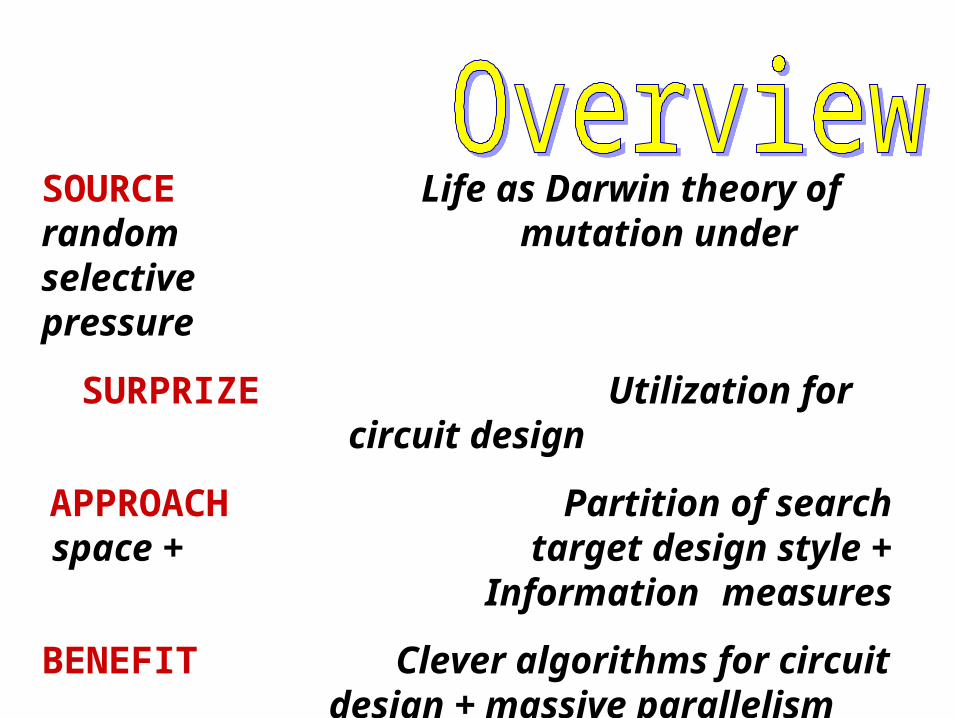
Eyes, hands, brain,.... - all of which share characteristics of
species: they are the products of the
random mutations and genetic mixing of
evolution
Darwin Theory (1859)Darwin Theory (1859)
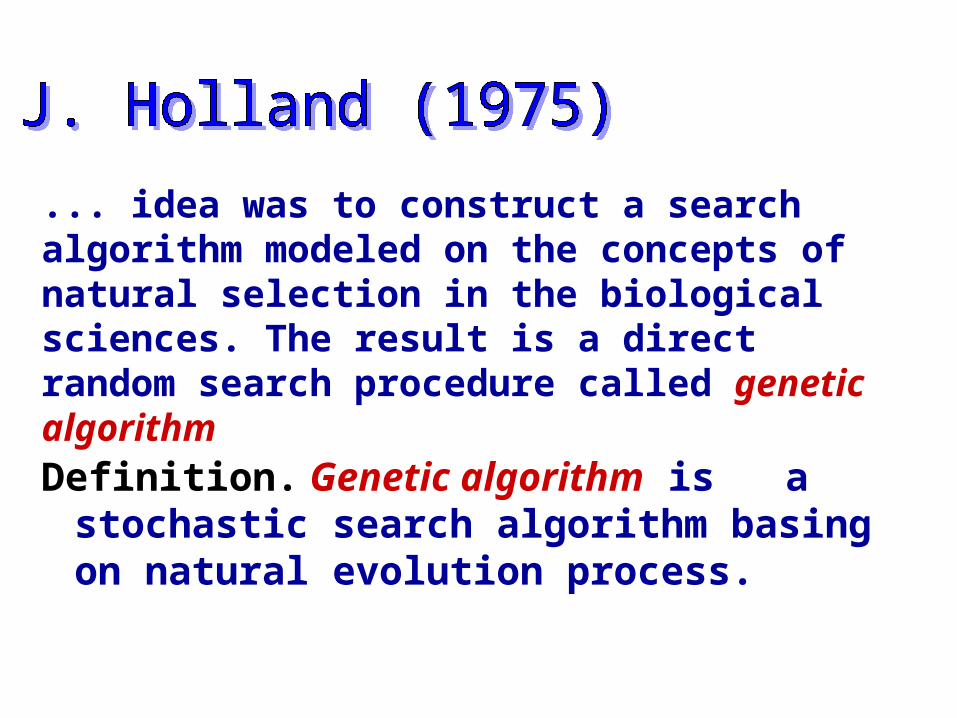
... idea was to construct a search algorithm modeled on the concepts of natural selection in the biological sciences. The result is a direct random search procedure called genetic algorithm
Definition. Genetic algorithm is a stochastic search algorithm basing on natural evolution process.
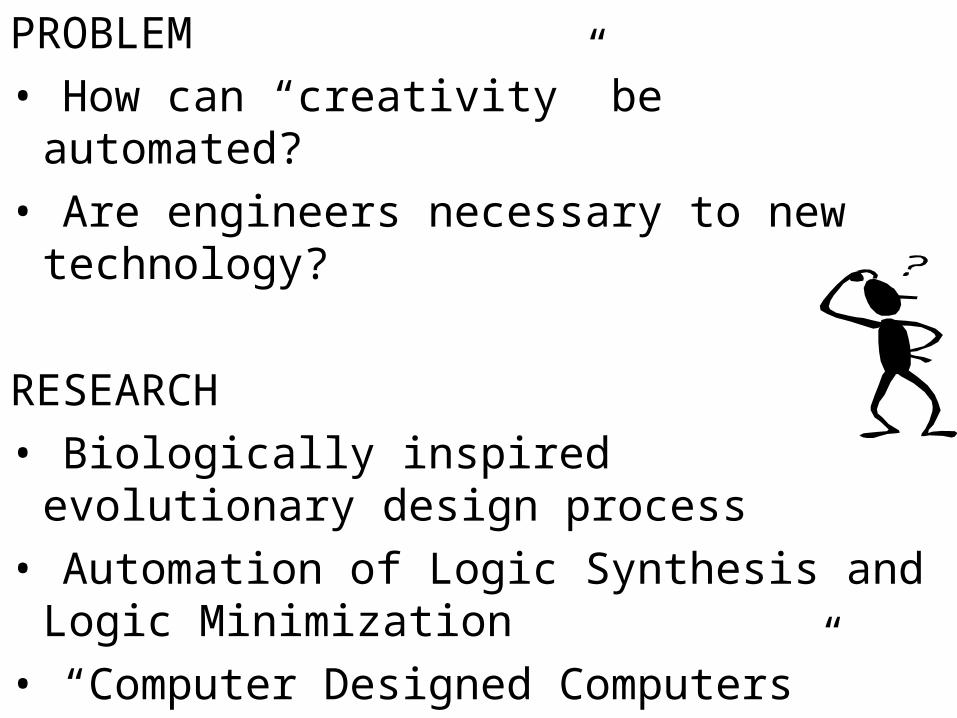
PROBLEM
• How can “creativity” be automated?
• Are engineers necessary to new technology?
RESEARCH
• Biologically inspired evolutionary design process
• Automation of Logic Synthesis and Logic Minimization
• “Computer Designed Computers”
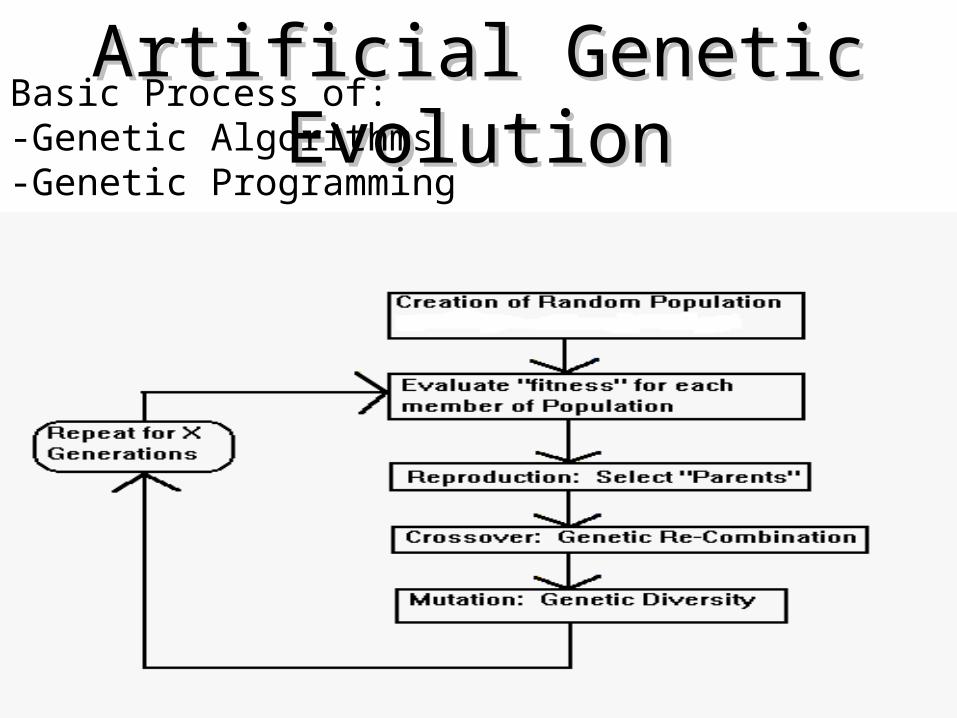
Artificial Genetic EvolutionArtificial Genetic EvolutionBasic Process of:-Genetic Algorithms-Genetic Programming
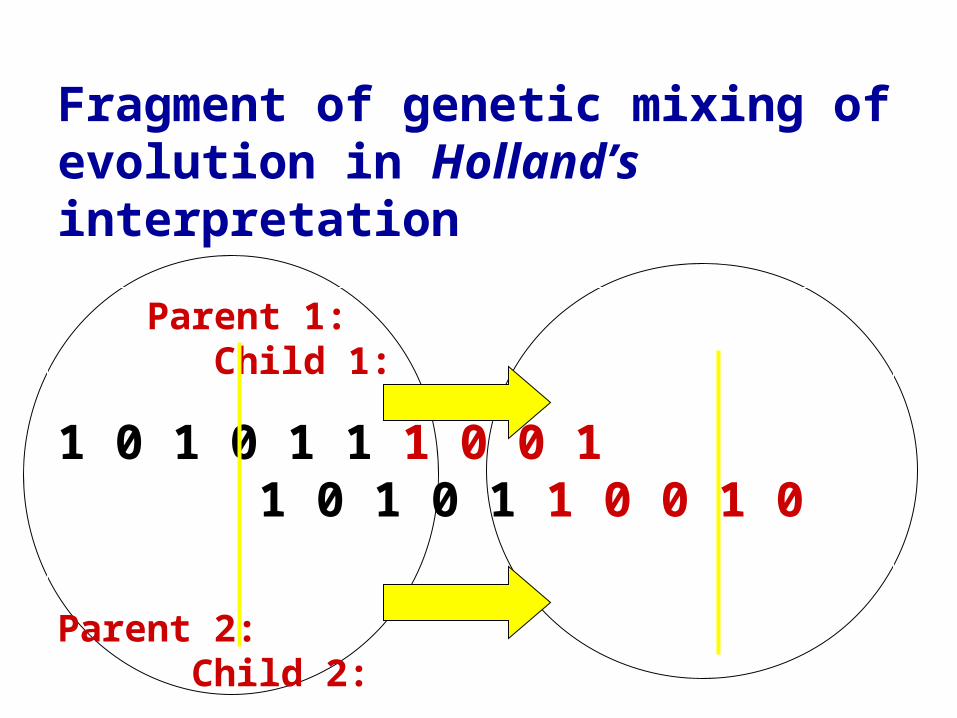
Fragment of genetic mixing of evolution in Holland’s interpretation
Parent 1: Child 1:
1 0 1 0 1 1 1 0 0 1 1 0 1 0 1 1 0 0 1 0
Parent 2: Child 2:
1 1 0 0 1 1 0 0 1 0 1 1 0 0 1 1 1 0 0 1
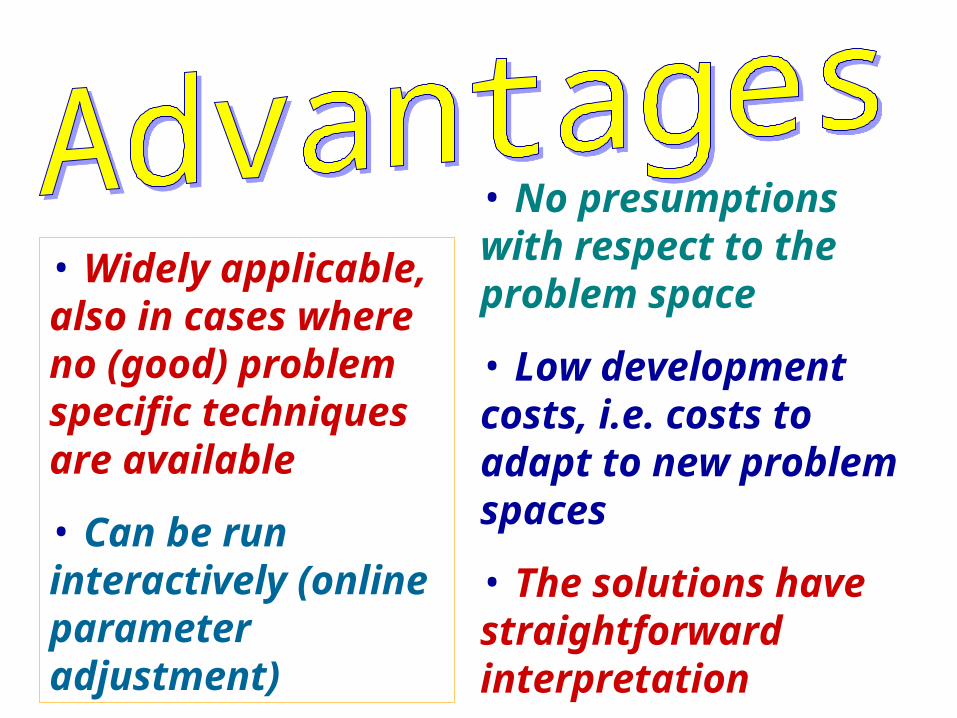
• No presumptions with respect to the problem space
• Low development costs, i.e. costs to adapt to new problem spaces
• The solutions have straightforward interpretation
• Widely applicable, also in cases where no (good) problem specific techniques are available
• Can be run interactively (online parameter adjustment)
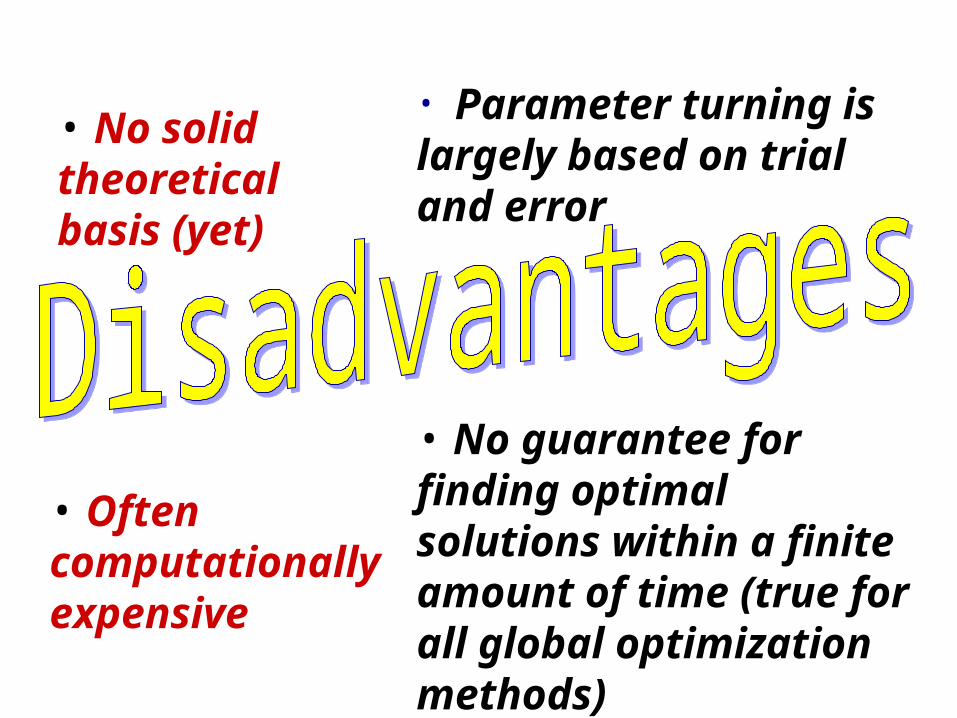
• Parameter turning is largely based on trial and error
• No guarantee for finding optimal solutions within a finite amount of time (true for all global optimization methods)
• Often computationally expensive
• No solid theoretical basis (yet)

Population (set of circuits)
Individual (circuit)
Fitness function (contains all information about the evolving circuit)
Gene (type of gate, inputs and outputs, etc)
Chromosome (coded circuit)
Probabilistic operators: Crossover, Mutation and Selection
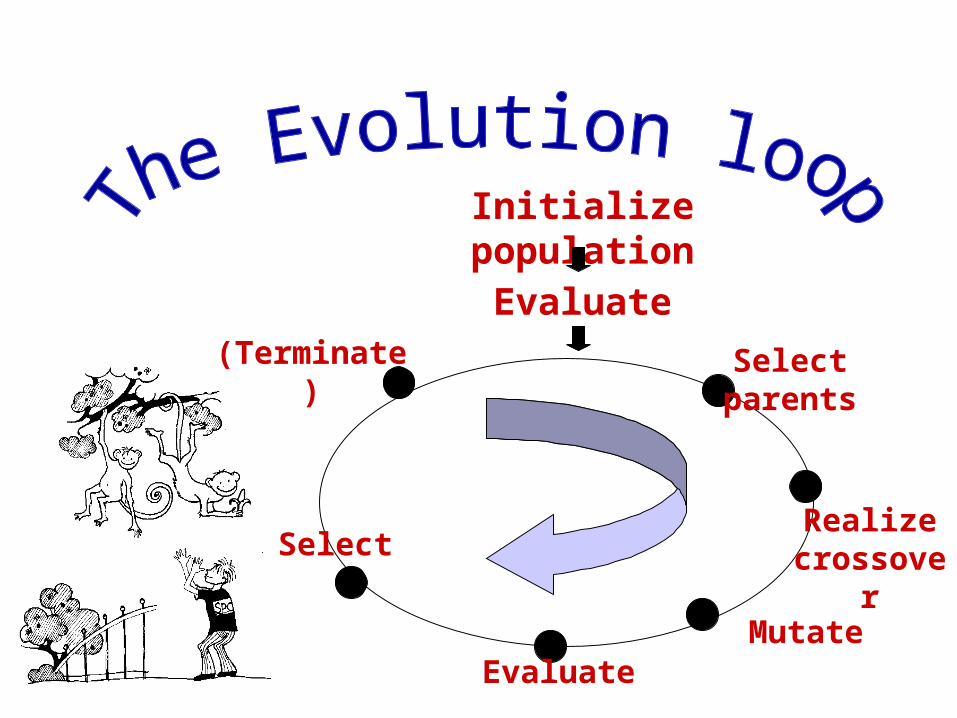
Initialize population
Evaluate
Select parents
Realize crossover
MutateEvaluate
Select
(Terminate)
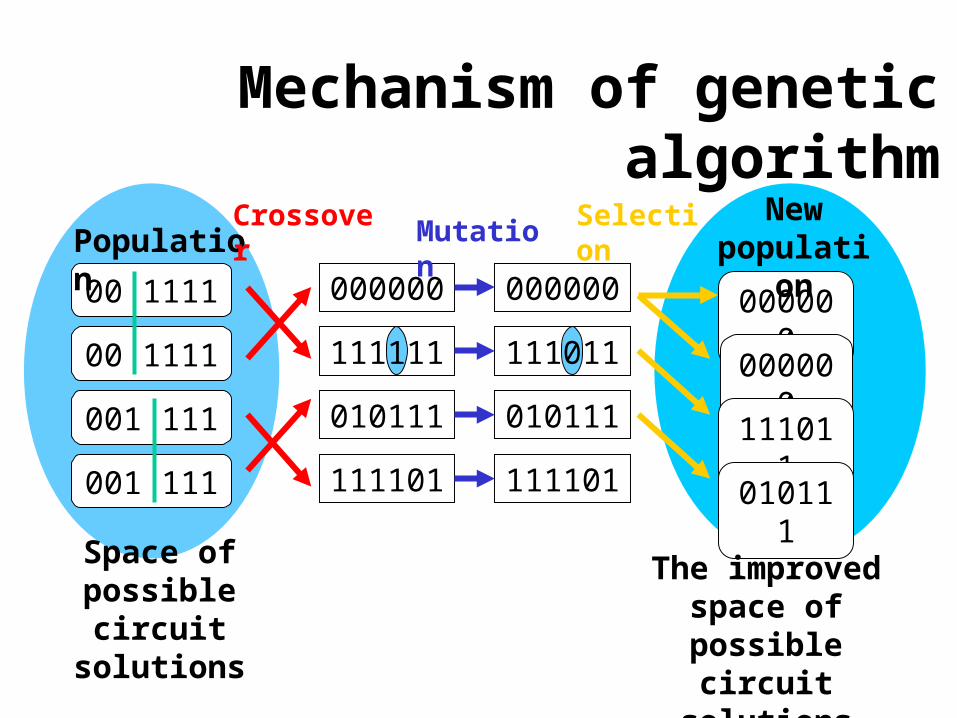
Mechanism of genetic algorithm
000000
000000
111011
010111
00 1111
00 1111
001 111
001 111
PopulationNew
population000000
111111
010111
111101
000000
111011
010111
111101
Crossover Mutation Selection
Space of possible circuit
solutions
The improved space of possible circuit solutions

Definition. Fitness function is a kind of objective, or cost, function which contains all information* about the problem.
In biology, fitness is the number of offsprings that survive to reproduction.
In genetic algorithm, one must map objective
function to a fitness function
* in our case - all information about the evolving logical network
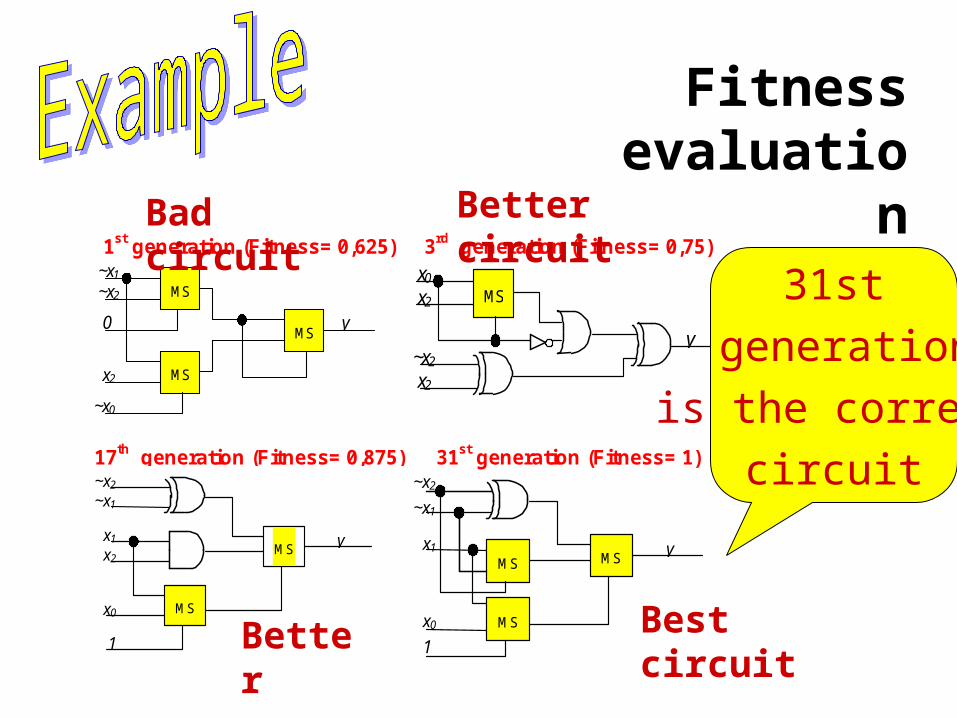
1st generation (Fitness= 0,625)~x1
~x2
0
x2
~x0
y
MS
MS
MS
3rd generation (Fitness= 0,75)x0
x2
~x2
x2
y
MS
17th generation (Fitness= 0,875)~x2
~x1
x1
x2
x0
1
y
MS
MS
31st generation (Fitness= 1)~x2
~x1
x1
x0
01
yMS
MS
MS
Fitness evaluatio
n31st
generation
is the correct
circuit
Bad circuit Better circuit
Better Best circuit
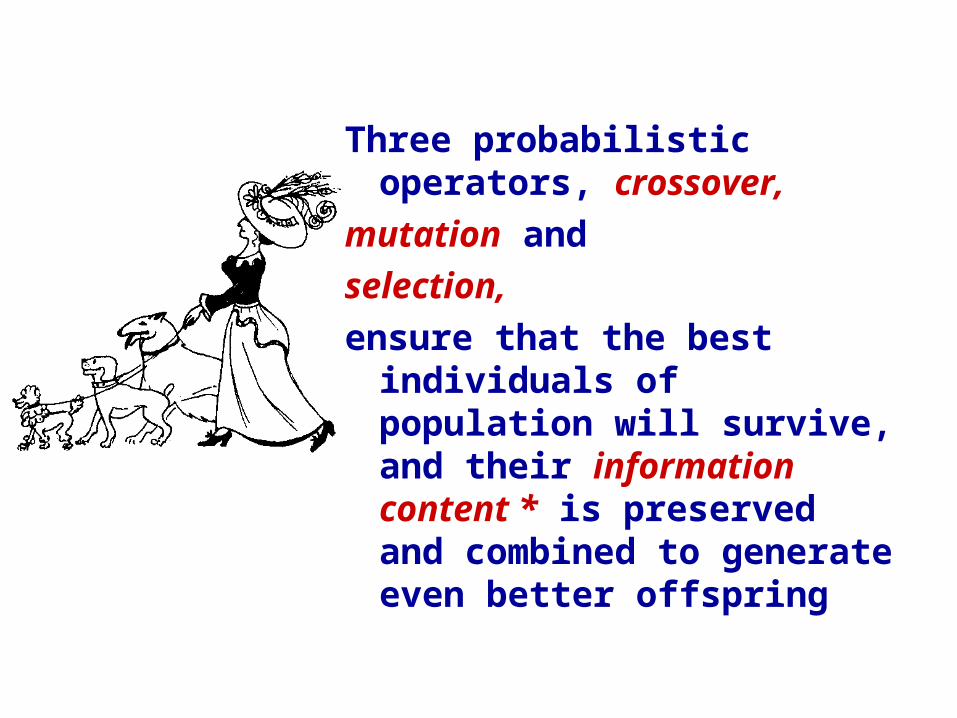
Three probabilistic operators, crossover,
mutation and
selection,
ensure that the best individuals of population will survive, and their information content * is preserved and combined to generate even better offspring

Simple crossoverThe crossover operator aims to make a better individual by replacing a part of an individual with a better part of another individual, i.e. combining valuable information of the individuals (parents)
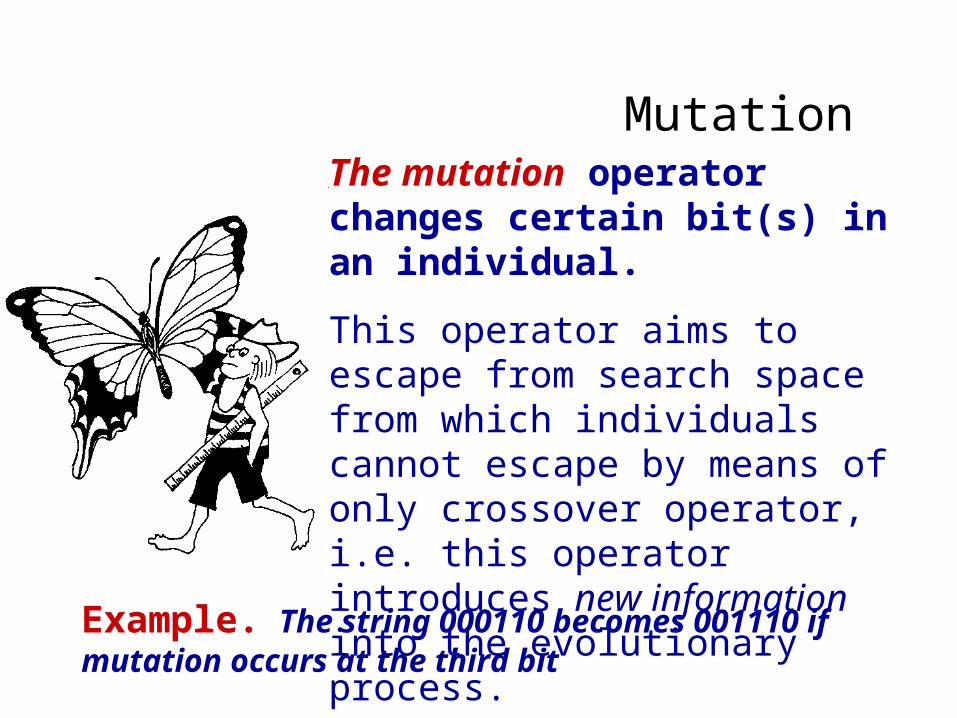
MutationThe mutation operator changes certain bit(s) in an individual.
This operator aims to escape from search space from which individuals cannot escape by means of only crossover operator, i.e. this operator introduces new information into the evolutionary process.
Example. The string 000110 becomes 001110 if mutation occurs at the third bit
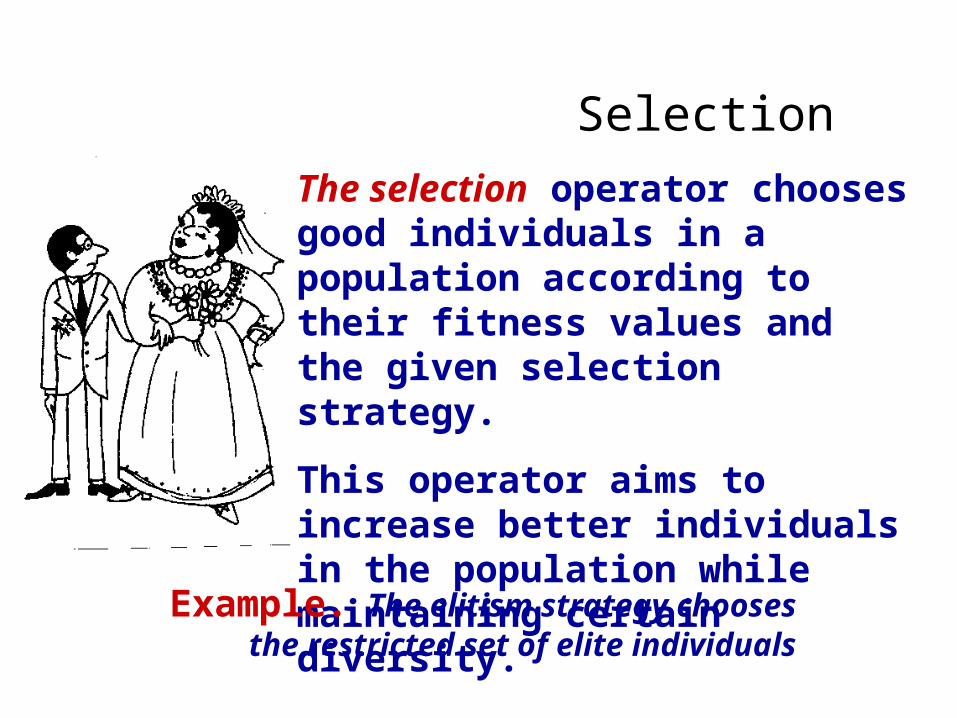
Selection
The selection operator chooses good individuals in a population according to their fitness values and the given selection strategy.
This operator aims to increase better individuals in the population while maintaining certain diversity.
Example. The elitism strategy chooses the restricted set of elite individuals
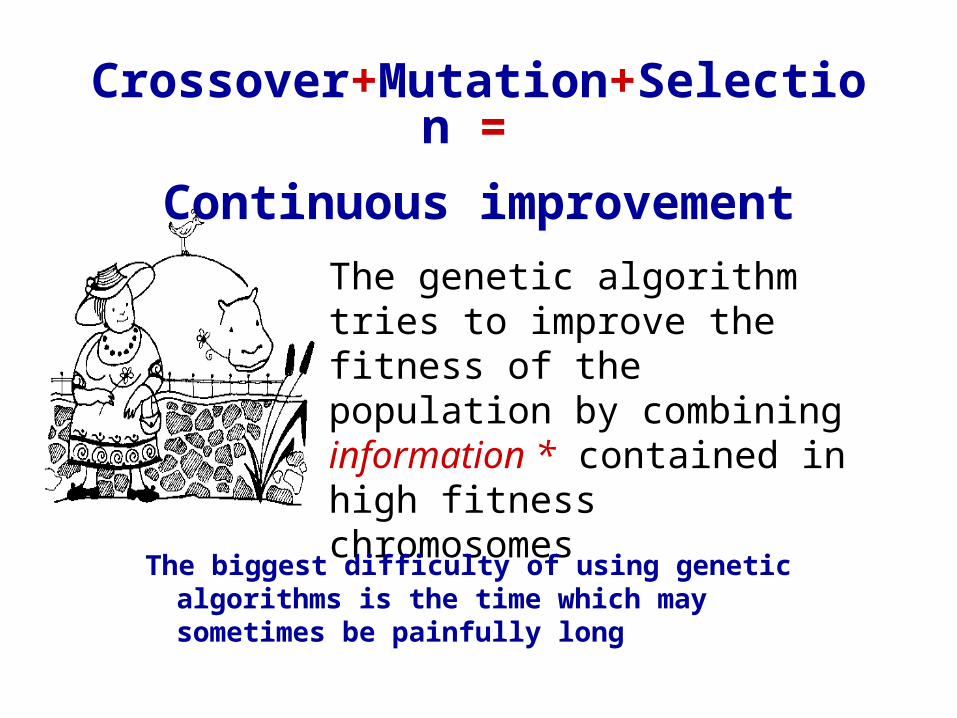
Crossover+Mutation+Selection =
Continuous improvement
The genetic algorithm tries to improve the fitness of the population by combining information * contained in high fitness chromosomes
The biggest difficulty of using genetic algorithms is the time which may sometimes be painfully long
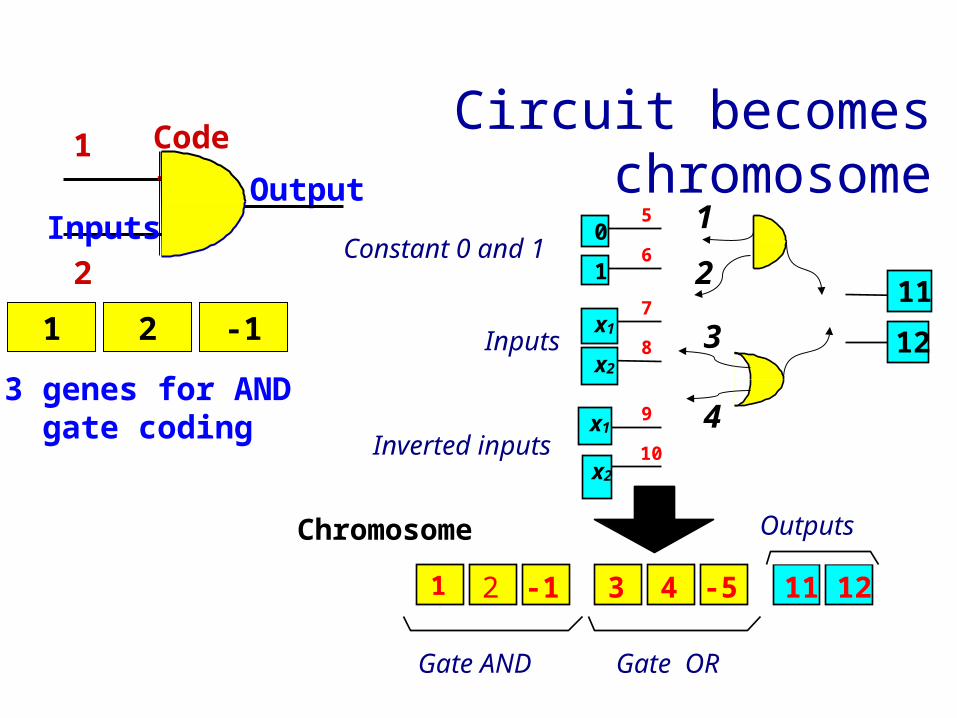
Circuit becomes chromosomeOutput
Inputs
3 genes for AND gate coding
1 2 -1
1
2
Code --1
5
6
7
8
9
10
0
1
x1
x2
x1
x2
11
12
1 2 -1 3 4 -5 11 12
Chromosome
Gate AND Gate OR
Outputs
Constant 0 and 1
Inputs
Inverted inputs
1
2
3
4
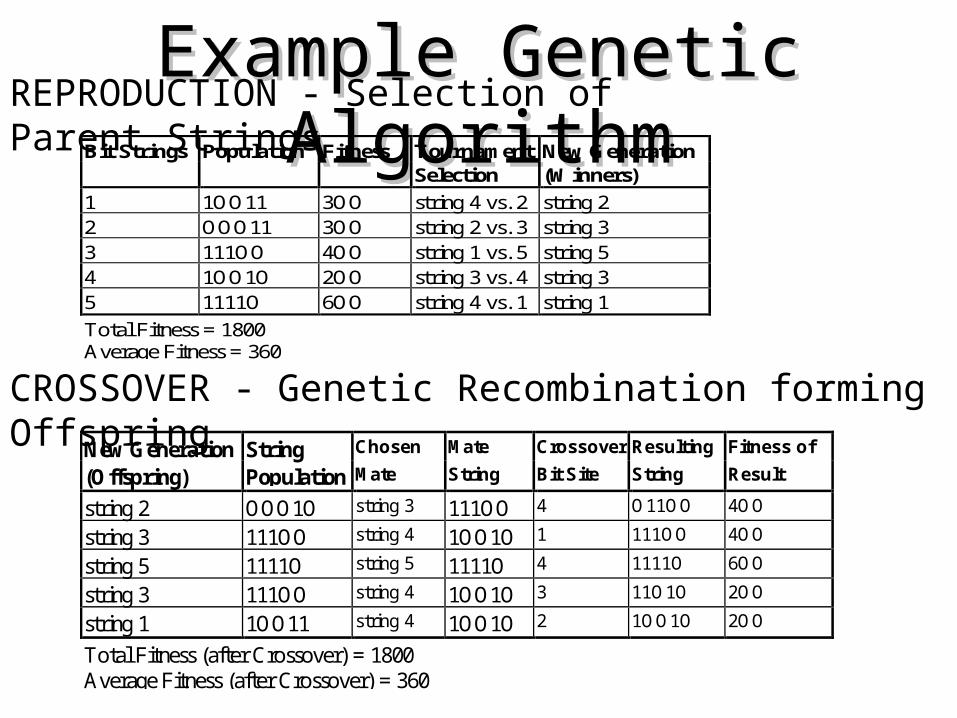
Example Genetic AlgorithmExample Genetic AlgorithmREPRODUCTION - Selection of Parent Strings
Bit Strings Population Fitness Tournament New GenerationSelection (Winners)
1 1OO11 3OO string 4 vs. 2 string 22 OOO11 3OO string 2 vs. 3 string 33 111OO 4OO string 1 vs. 5 string 54 1OO1O 2OO string 3 vs. 4 string 35 1111O 6OO string 4 vs. 1 string 1
Total Fitness = 1800Average Fitness = 360
CROSSOVER - Genetic Recombination forming Offspring
New Generation String Chosen Mate Crossover Resulting Fitness of
(Offspring) Population Mate String Bit Site String Result
string 2 OOO1O string 3 111OO 4 O11OO 4OO
string 3 111OO string 4 1OO1O 1 111OO 4OO
string 5 1111O string 5 1111O 4 1111O 6OO
string 3 111OO string 4 1OO1O 3 11O1O 2OO
string 1 1OO11 string 4 1OO1O 2 1OO1O 2OO
Total Fitness (after Crossover) = 1800Average Fitness (after Crossover) = 360
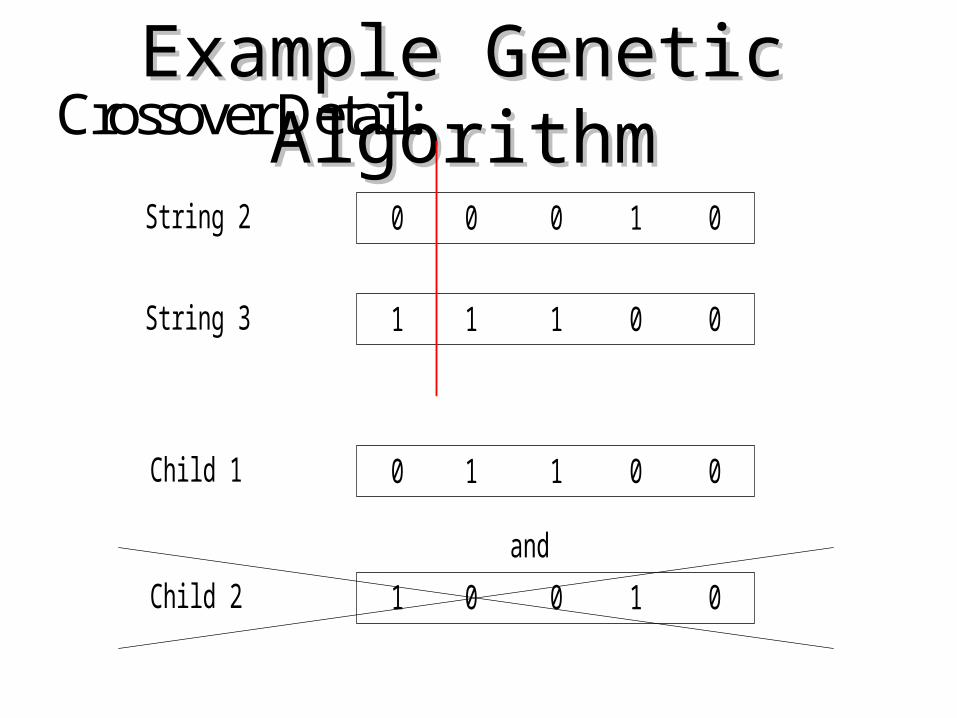
Example Genetic AlgorithmExample Genetic AlgorithmCrossover Detail:
0 10 0 0
1 01 1 0
0 01 1 0
and
1 10 0 0
Child 1
Child 2
String 2
String 3
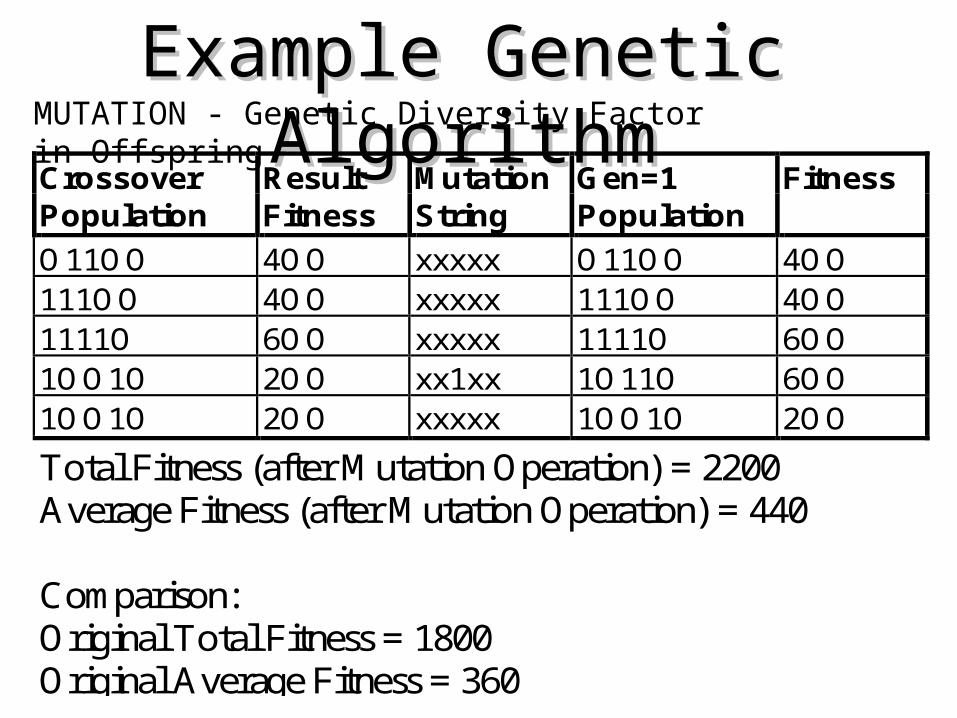
Example Genetic AlgorithmExample Genetic AlgorithmMUTATION - Genetic Diversity Factor in Offspring
Crossover Result Mutation Gen=1 FitnessPopulation Fitness String PopulationO11OO 4OO xxxxx O11OO 4OO111OO 4OO xxxxx 111OO 4OO1111O 6OO xxxxx 1111O 6OO1OO1O 2OO xx1xx 1O11O 6OO1OO1O 2OO xxxxx 1OO1O 2OO
Total Fitness (after Mutation Operation) = 2200Average Fitness (after Mutation Operation) = 440
Comparison:Original Total Fitness = 1800Original Average Fitness = 360

SCHEMA THEOREM: SCHEMA THEOREM: Success Theory of GASuccess Theory of GA
Schemata Propagation in Reproduction Schemata Pattern Bit Population Schemata Tournament Winners Schemata
Strings Membership Selection Membership
Schema A 1O*** 1 1OO11 Schema A, D string 4 vs. 2 string 2 Schema B, D
Schema B OOO** 2 OOO11 Schema B, D string 2 vs. 3 string 3 Schema C, E
Schema C *11*O 3 111OO Schema C, E string 1 vs. 5 string 5 Schema C, E
Schema D *OO1* 4 1OO1O Schema A, D string 3 vs. 4 string 3 Schema C, E
Schema E 11*** 5 1111O Schema C, E string 4 vs. 1 string 1 Schema A, D
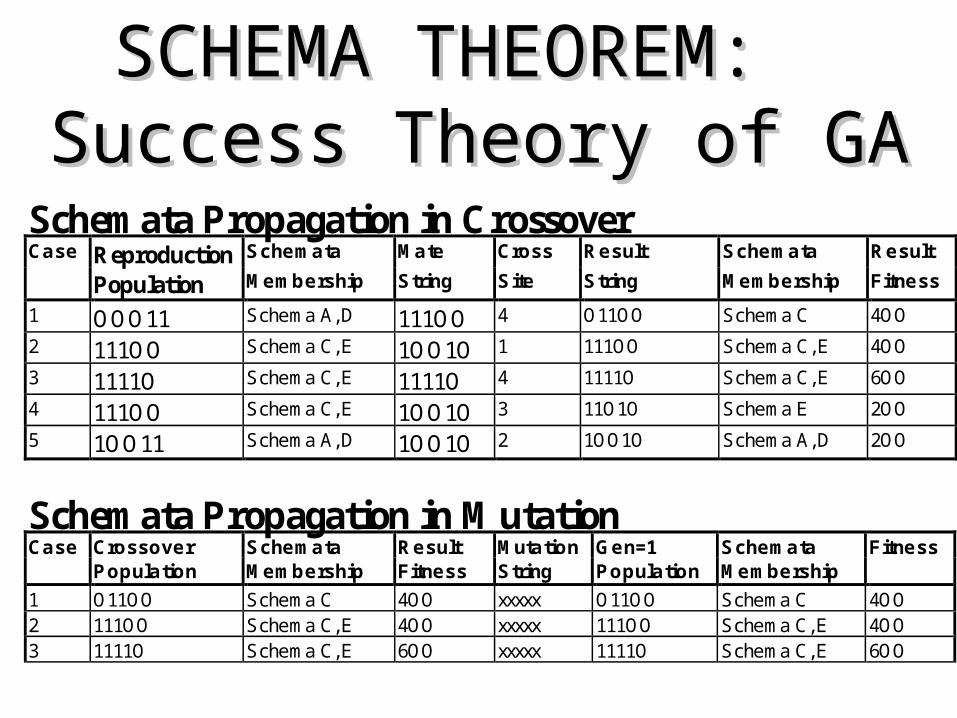
SCHEMA THEOREM: SCHEMA THEOREM: Success Theory of GASuccess Theory of GA
Schemata Propagation in Crossover Case Reproduction Schemata Mate Cross Result Schemata Result
Population Membership String Site String Membership Fitness
1 OOO11 Schema A, D 111OO 4 O11OO Schema C 4OO
2 111OO Schema C, E 1OO1O 1 111OO Schema C, E 4OO
3 1111O Schema C, E 1111O 4 1111O Schema C, E 6OO
4 111OO Schema C, E 1OO1O 3 11O1O Schema E 2OO
5 1OO11 Schema A, D 1OO1O 2 1OO1O Schema A, D 2OO
Schemata Propagation in Mutation Case Crossover Schemata Result Mutation Gen=1 Schemata Fitness Population Membership Fitness String Population Membership
1 O11OO Schema C 4OO xxxxx O11OO Schema C 4OO 2 111OO Schema C, E 4OO xxxxx 111OO Schema C, E 4OO 3 1111O Schema C, E 6OO xxxxx 1111O Schema C, E 6OO
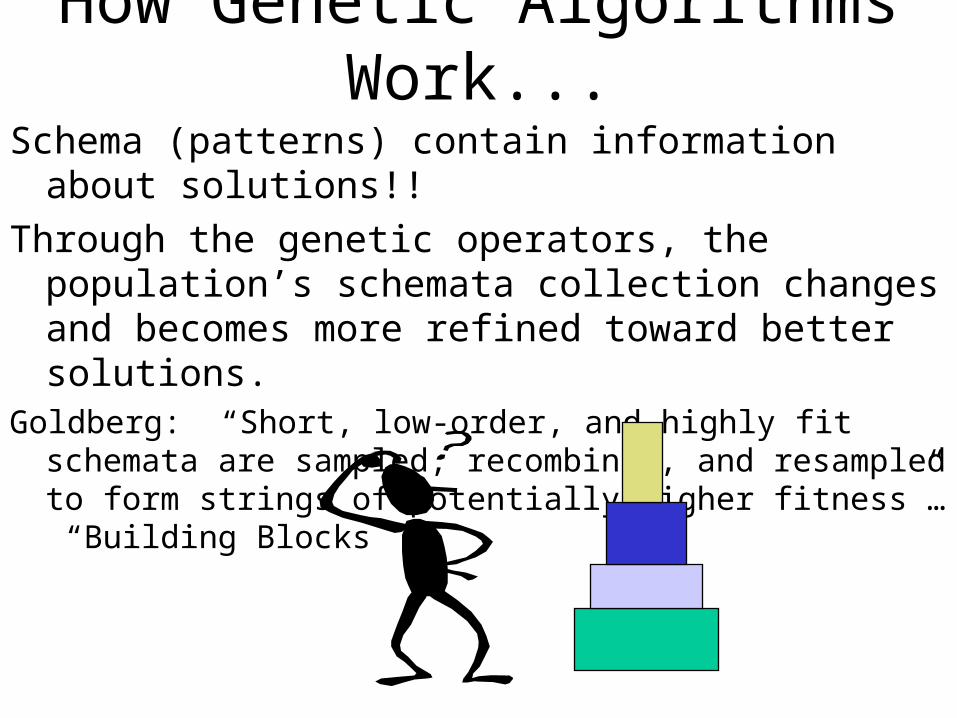
How Genetic Algorithms Work...
Schema (patterns) contain information about solutions!!
Through the genetic operators, the population’s schemata collection changes and becomes more refined toward better solutions.
Goldberg: “Short, low-order, and highly fit schemata are sampled, recombined, and resampled to form strings of potentially higher fitness”… “Building Blocks”
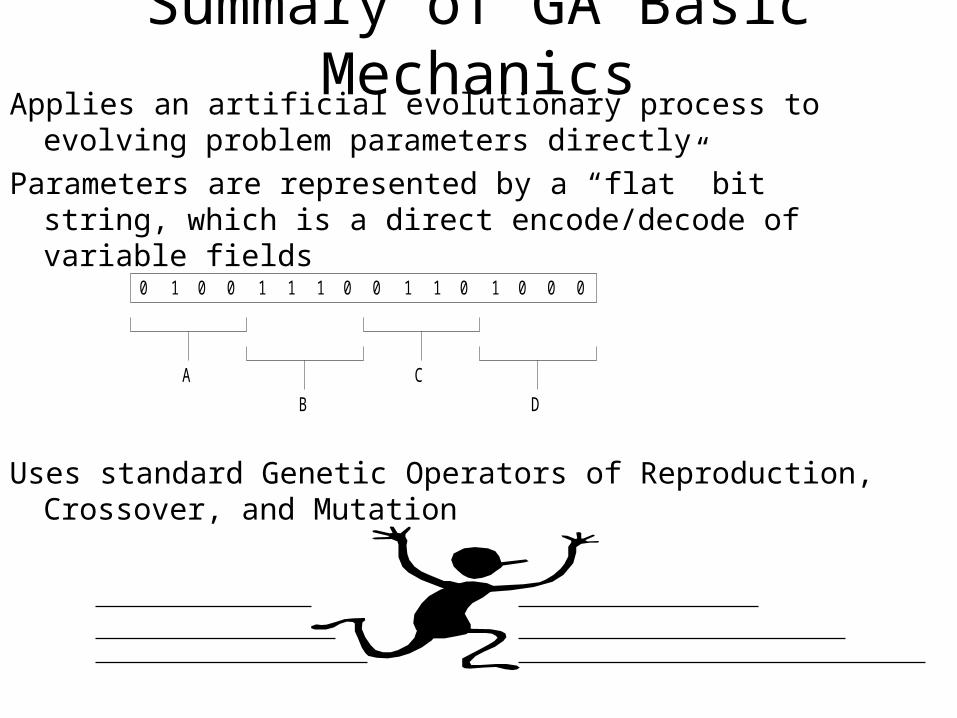
Summary of GA Basic MechanicsApplies an artificial evolutionary process to evolving problem
parameters directly
Parameters are represented by a “flat” bit string, which is a direct encode/decode of variable fields
Uses standard Genetic Operators of Reproduction, Crossover, and Mutation
0 1 0 0 00 0 0 0 01 1 1 1 1 1
A
B
C
D
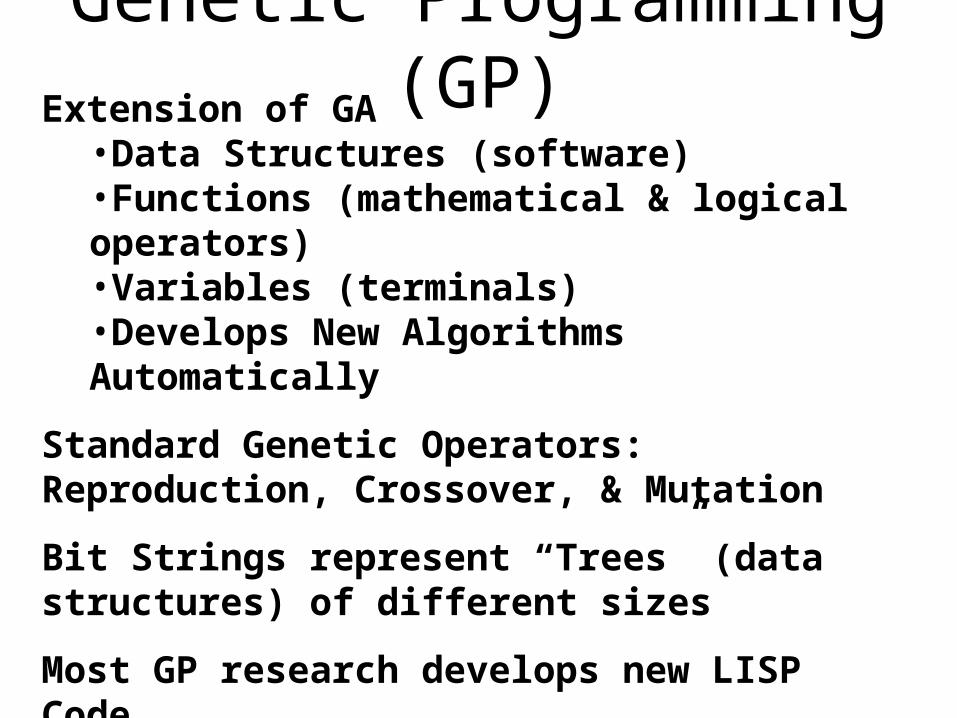
Genetic Programming (GP)Extension of GA
•Data Structures (software)•Functions (mathematical & logical operators)•Variables (terminals)•Develops New Algorithms Automatically
Standard Genetic Operators: Reproduction, Crossover, & Mutation
Bit Strings represent “Trees” (data structures) of different sizes
Most GP research develops new LISP Code
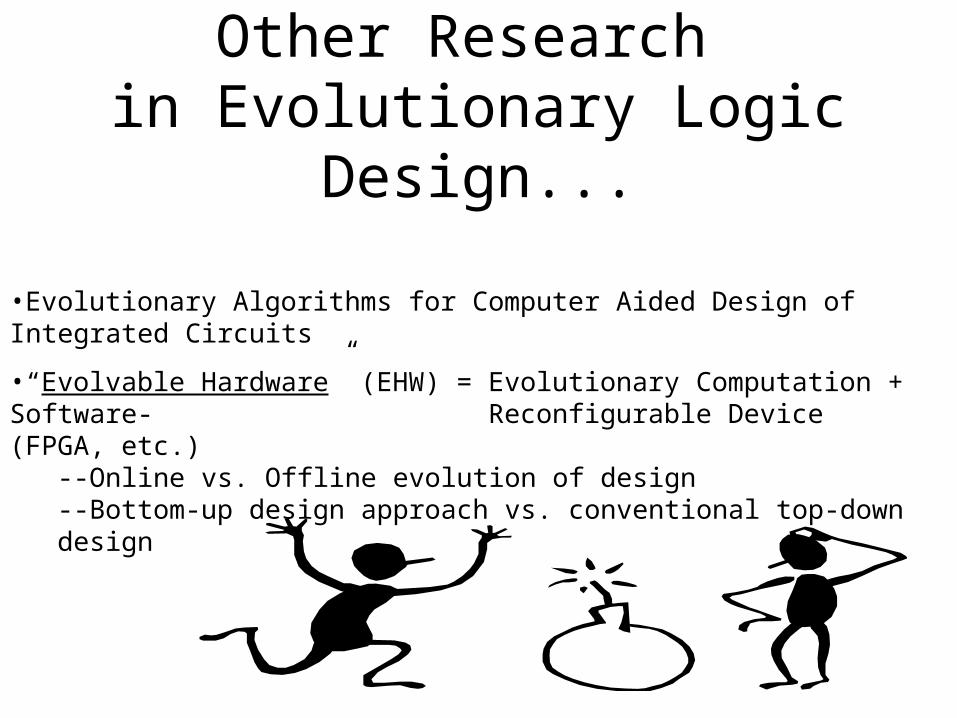
Other Research in Evolutionary Logic Design...
•Evolutionary Algorithms for Computer Aided Design of Integrated Circuits
•“Evolvable Hardware” (EHW) = Evolutionary Computation + Software-Reconfigurable Device (FPGA, etc.)
--Online vs. Offline evolution of design --Bottom-up design approach vs. conventional top-down design
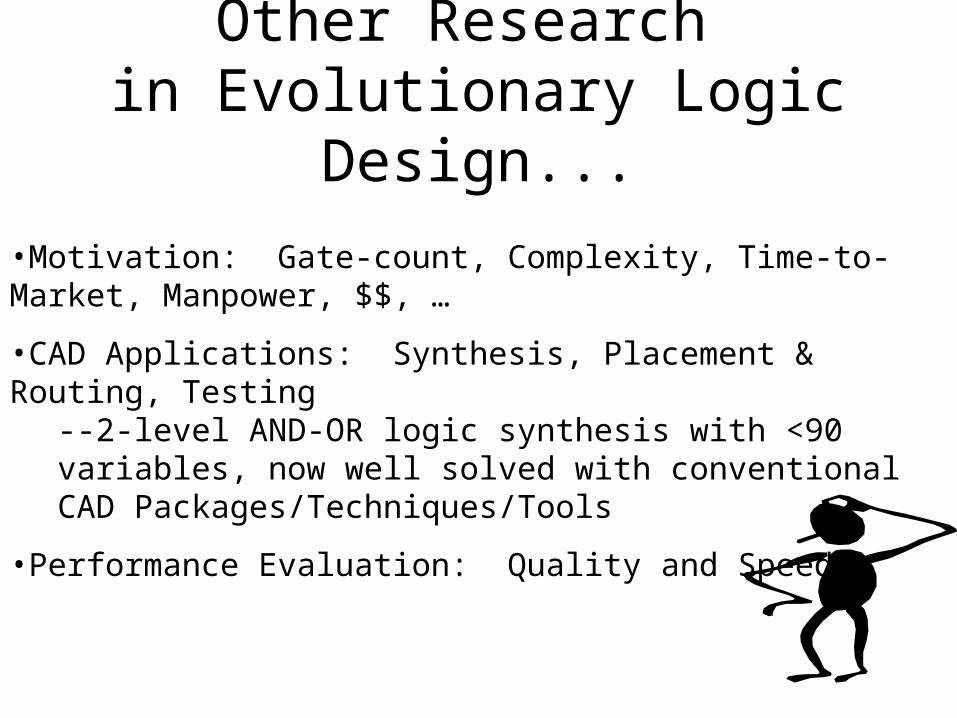
Other Research in Evolutionary Logic Design...
•Motivation: Gate-count, Complexity, Time-to-Market, Manpower, $$, …
•CAD Applications: Synthesis, Placement & Routing, Testing--2-level AND-OR logic synthesis with <90 variables, now well solved with conventional CAD Packages/Techniques/Tools
•Performance Evaluation: Quality and Speed
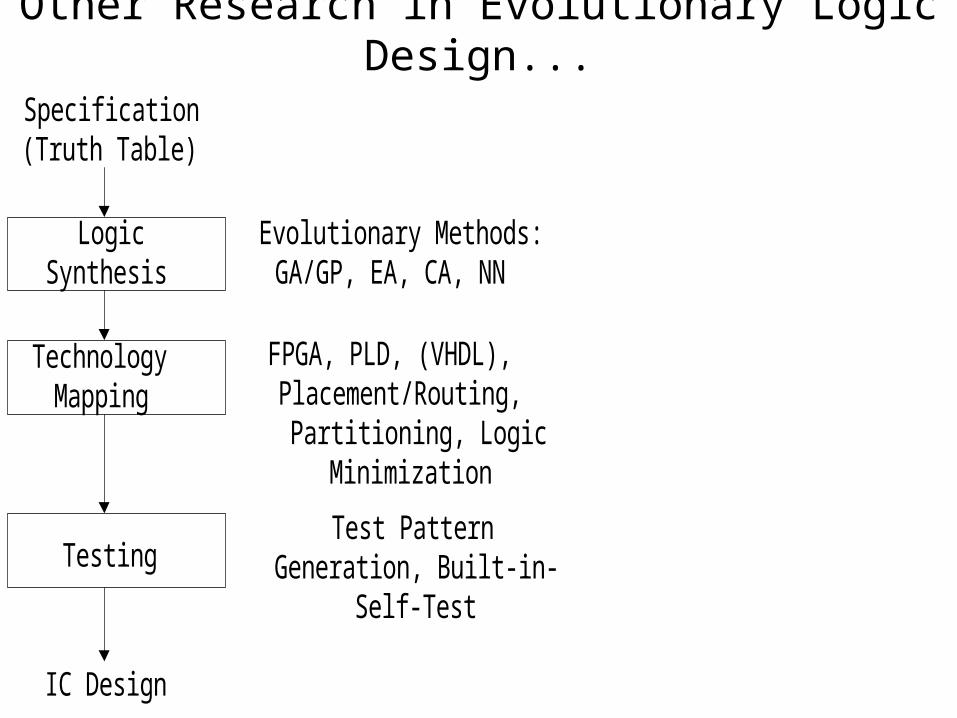
Other Research in Evolutionary Logic Design...
TechnologyMapping
LogicSynthesis
Specification(Truth Table)
Testing
IC Design
Evolutionary Methods:GA/GP, EA, CA, NN
FPGA, PLD, (VHDL),Placement/Routing,Partitioning, Logic
Minimization
Test PatternGeneration, Built-in-
Self-Test

Current Research in Evolutionary Logic Design...
• JAPANJAPAN--Robotic Control/Navigation: T. Higuchi, et al., ETL--Pattern Recognition Systems; Data Compression: M. Iwata, et al., ETL--Hardware Evolution at Function Level; Adaptive Equalization of Digital Communication Channels; On-line Adaptive Neural Networks: M. Murakawa, et al., U. of Tokyo--ATM Cell Scheduling by Function Level EHW: W. Liu, et al., NEDO--Adaptive Architecture Methodology with Hardware Description Language: H. Hemmi, et al., ATR--CAM (Artificial) BRAIN (evolve NN w/GA): H. de Garis, et al., ATR
• U.K.U.K.--Robotic Control; Tone Discriminator: A. Thompson, et al., U. of Sussex--Evolving Robot Morphology: H. Lund, U. of Edinburgh

Current Research in Evolutionary Logic Design...• SWITZERLANDSWITZERLAND
-- Self-Reproduction & Repair of Hardware: D. Mange, et al., Swiss Federal Institute of Technology, Lausanne--Phylogenetic, Ontogenetic and Epigenetic (POE) Model; “Firefly Machine” for on-line CA: M. Sipper, et al., Swiss Federal Institute of Technology, Lausanne-- “Bio-dule” (Artificial Cell) Embryonic Electronics, Self-structuring VLSI, Fault Tolerant Hardware: P. Marchal, et al., Centre Suisse d’Electronique et de Microtechnique
• GERMANYGERMANY--Test Pattern Generation; Learning Heuristics; FPRM Logic Logic Minimization: R. Drechsler, et al., U. of Freiburg--VLSI Routing: N. Gockel, et al., U. of Freiburg
• U.S.A.U.S.A.--Analog Circuit Design: J. Koza, et al., Stanford University

Growing Digital CircuitsGrowing Digital Circuits
In the Pacific Northwest (Portland, Oregon, USA), we live in the “Silicon Forest” and now we can grow a “forest” in the silicon.
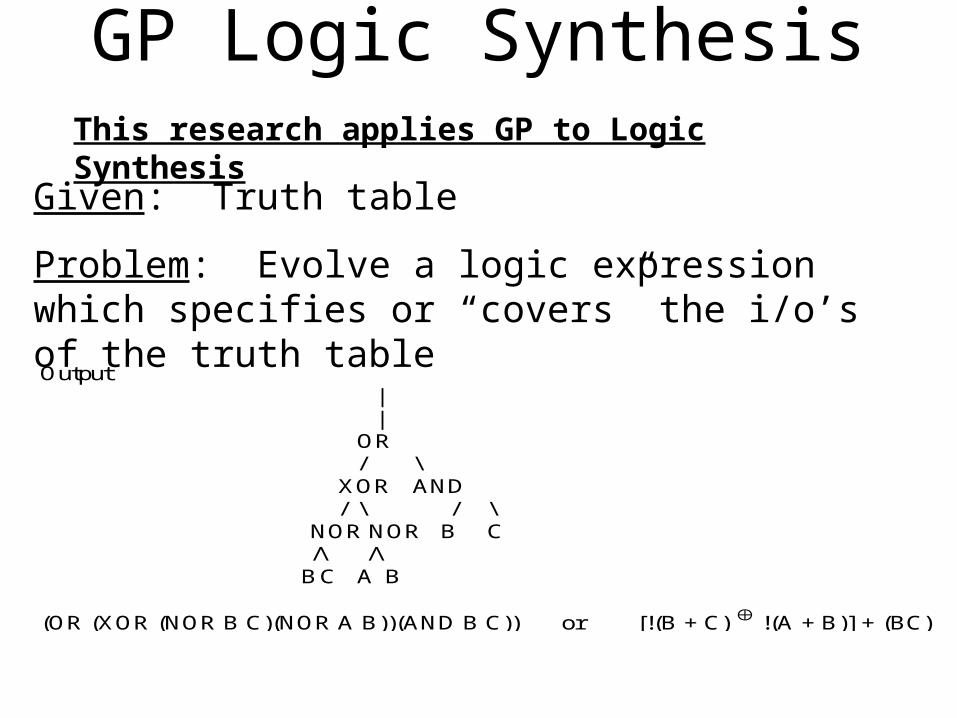
GP Logic SynthesisThis research applies GP to Logic Synthesis
Output||
OR/ \
XOR AND/ \ / \
NOR NOR B C/\ /\
BC A B
(OR (XOR (NOR B C)(NOR A B))(AND B C)) or [!(B + C) !(A + B)] + (BC)
Given: Truth table
Problem: Evolve a logic expression which specifies or “covers” the i/o’s of the truth table
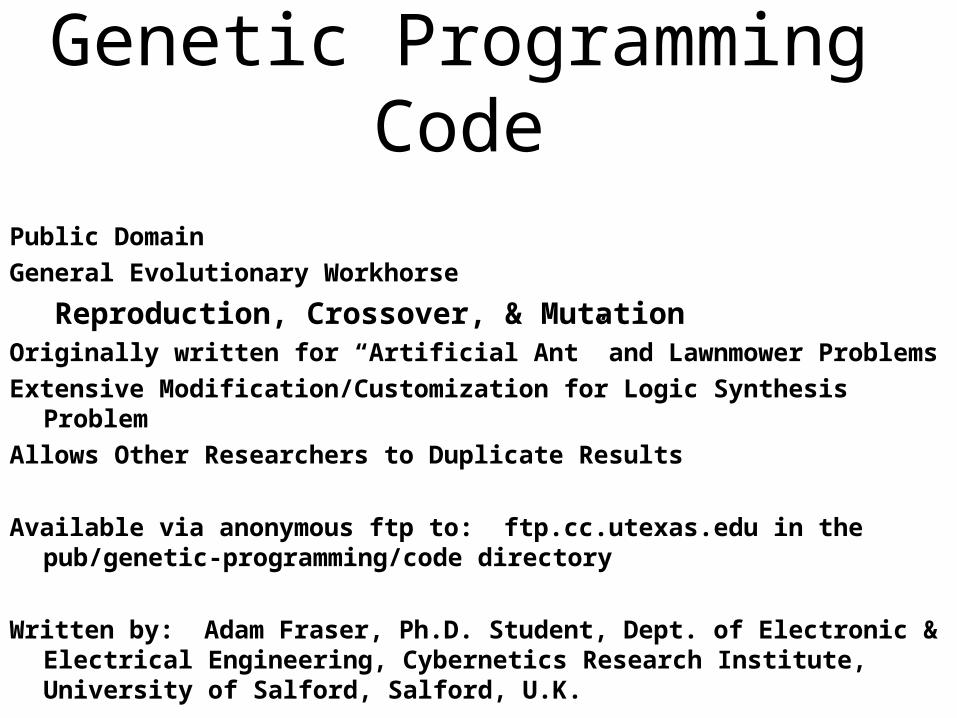
Genetic Programming Code
Public Domain
General Evolutionary Workhorse
Reproduction, Crossover, & MutationOriginally written for “Artificial Ant” and Lawnmower Problems
Extensive Modification/Customization for Logic Synthesis Problem
Allows Other Researchers to Duplicate Results
Available via anonymous ftp to: ftp.cc.utexas.edu in the pub/genetic-programming/code directory
Written by: Adam Fraser, Ph.D. Student, Dept. of Electronic & Electrical Engineering, Cybernetics Research Institute, University of Salford, Salford, U.K.
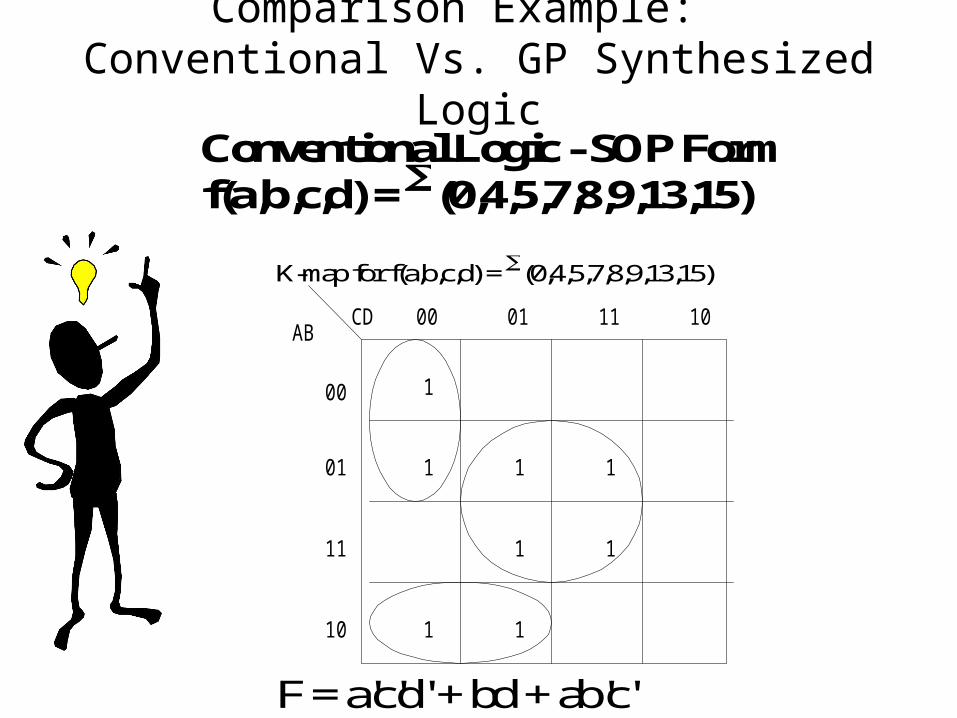
Comparison Example: Conventional Vs. GP Synthesized Logic
Conventional Logic - SOP Formf(a,b,c,d) = (0,4,5,7,8,9,13,15)
K-map for f(a,b,c,d) = (0,4,5,7,8,9,13,15)
ABCD
00
01
11
10
00 01 11 10
1
11
11
1
1
1
F = a'c'd' + bd + ab'c'
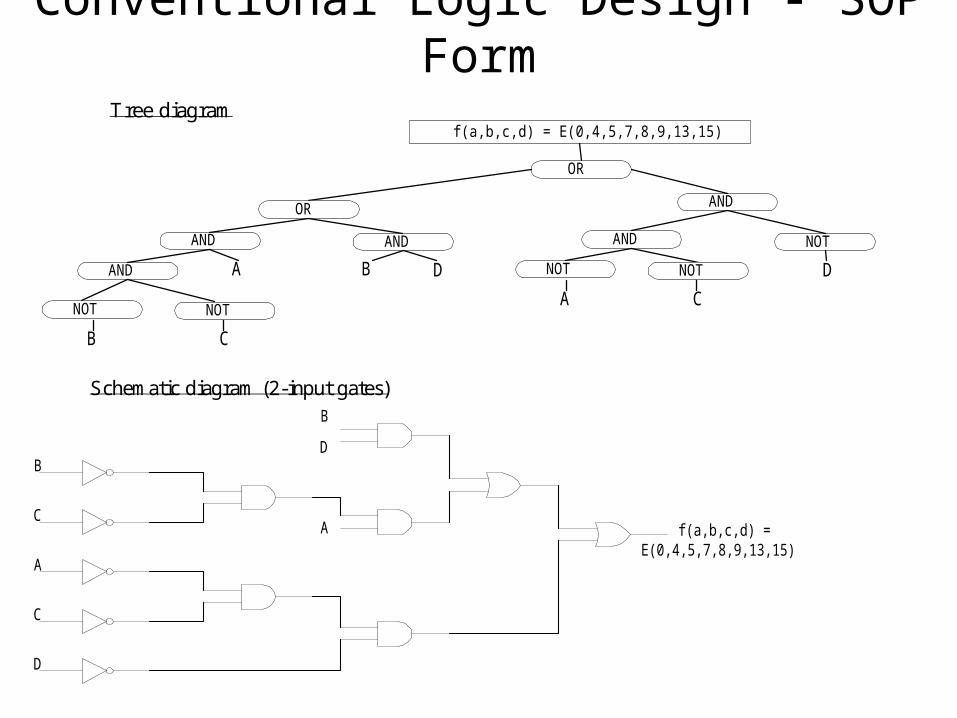
Conventional Logic Design - SOP Form
Tree diagramf(a,b,c,d) = E(0,4,5,7,8,9,13,15)
OR
AND
D
NOTAND
OR
ANDAND
DBAAND NOT NOT
CANOT NOT
CB
Schematic diagram (2-input gates)
D
C
A
AC
BD
B
f(a,b,c,d) =E(0,4,5,7,8,9,13,15)
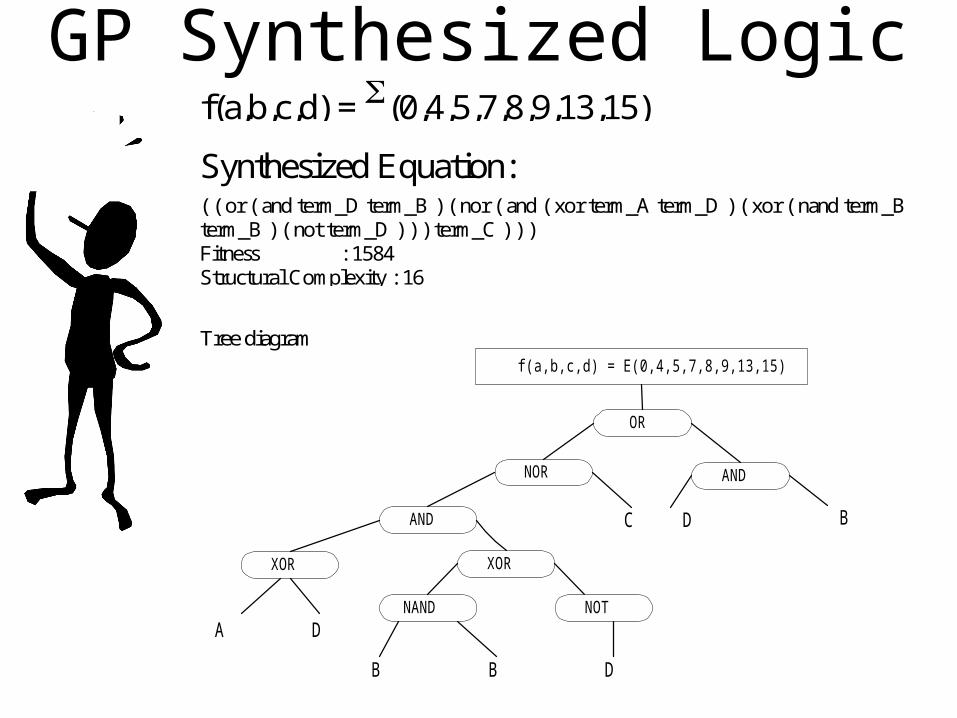
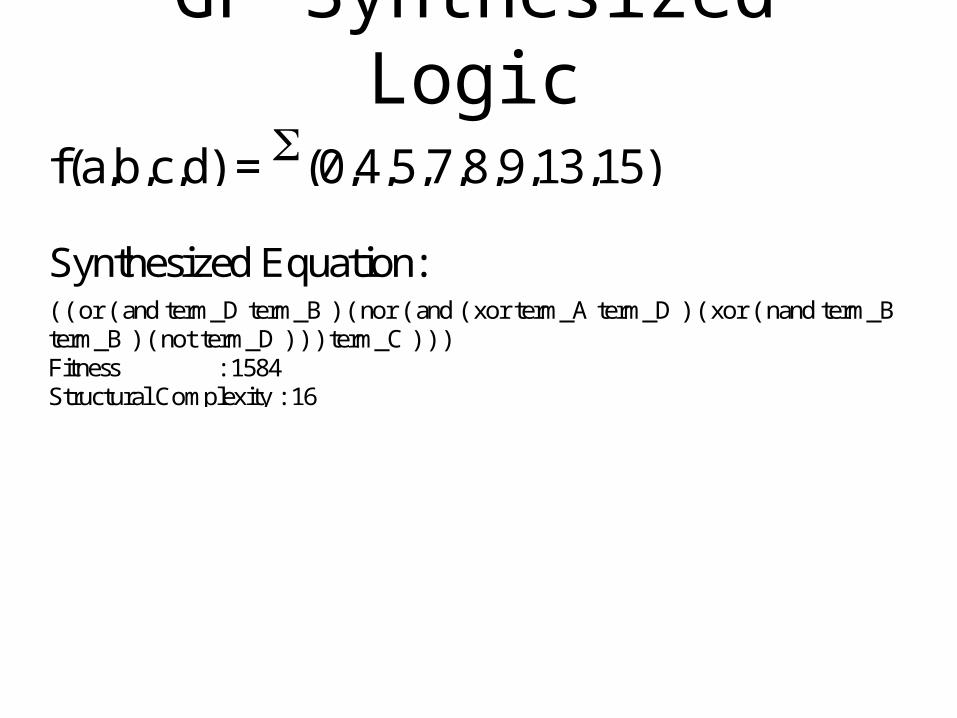
GP Synthesized Logicf(a,b,c,d) = (0,4,5,7,8,9,13,15)
Synthesized Equation:( ( or ( and term_D term_B ) ( nor ( and ( xor term_A term_D ) ( xor ( nand term_Bterm_B ) ( not term_D ) ) ) term_C ) ) )Fitness : 1584Structural Complexity : 16
Tree diagram
f(a,b,c,d) = E(0,4,5,7,8,9,13,15)
OR
NOR
AND
XOR XOR
NAND
AND
NOT
A D
B B D
C D B
GP Synthesized Logic
f(a,b,c,d) = (0,4,5,7,8,9,13,15)
Synthesized Equation:( ( or ( and term_D term_B ) ( nor ( and ( xor term_A term_D ) ( xor ( nand term_Bterm_B ) ( not term_D ) ) ) term_C ) ) )Fitness : 1584Structural Complexity : 16
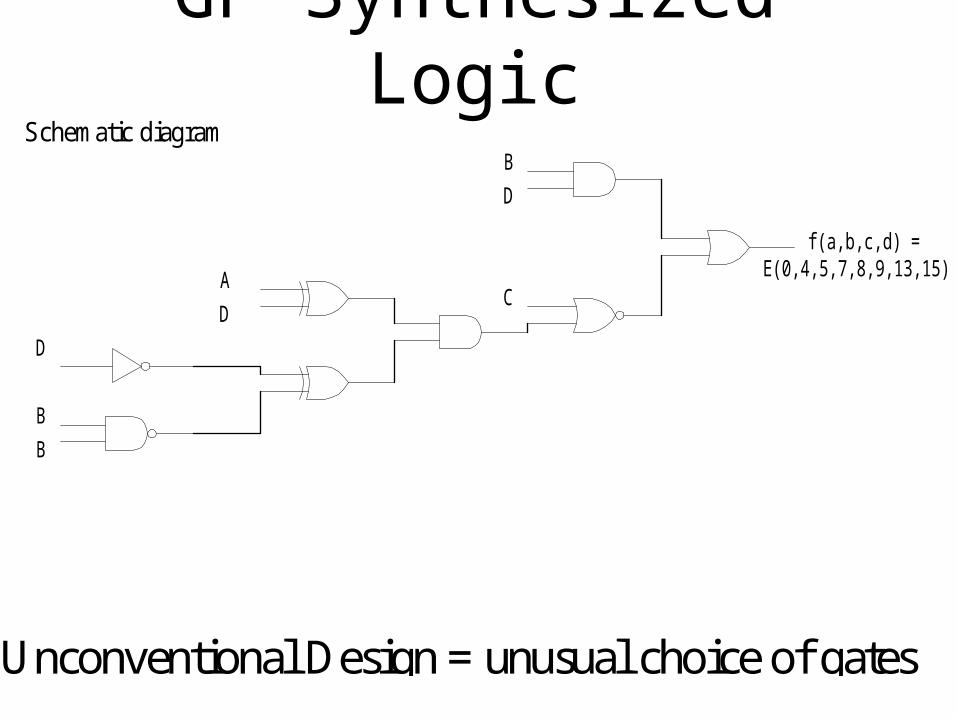
GP Synthesized Logic
Unconventional Design = unusual choice of gates
Schematic diagramB
DC
A
D
B
B
D
f(a,b,c,d) =E(0,4,5,7,8,9,13,15)
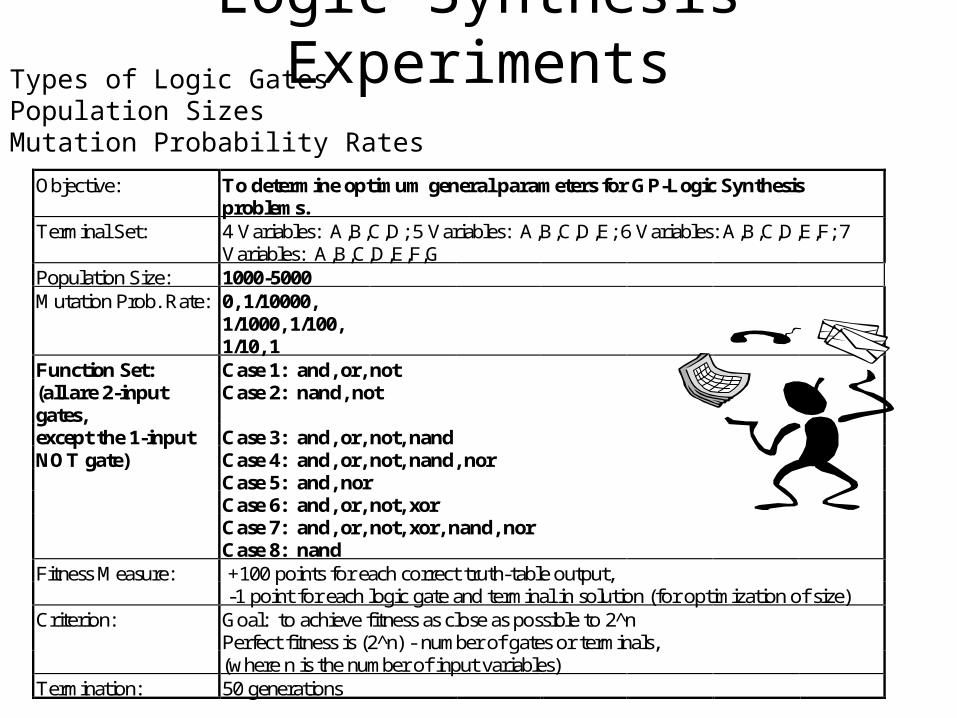
Logic Synthesis ExperimentsTypes of Logic GatesPopulation SizesMutation Probability Rates
Objective: To determine optimum general parameters for GP-Logic Synthesisproblems.
Terminal Set: 4 Variables: A,B,C,D; 5 Variables: A,B,C,D,E; 6 Variables: A,B,C,D,E,F; 7Variables: A,B,C,D,E,F,G
Population Size: 1000-5000Mutation Prob. Rate: 0, 1/10000,
1/1000, 1/100,1/10, 1
Function Set: Case 1: and, or, not(all are 2-inputgates,
Case 2: nand, not
except the 1-input Case 3: and, or, not, nandNOT gate) Case 4: and, or, not, nand, nor
Case 5: and, norCase 6: and, or, not, xorCase 7: and, or, not, xor, nand, norCase 8: nand
Fitness Measure: +100 points for each correct truth-table output, -1 point for each logic gate and terminal in solution (for optimization of size)
Criterion: Goal: to achieve fitness as close as possible to 2^nPerfect fitness is (2^n) - number of gates or terminals,(where n is the number of input variables)
Termination: 50 generations
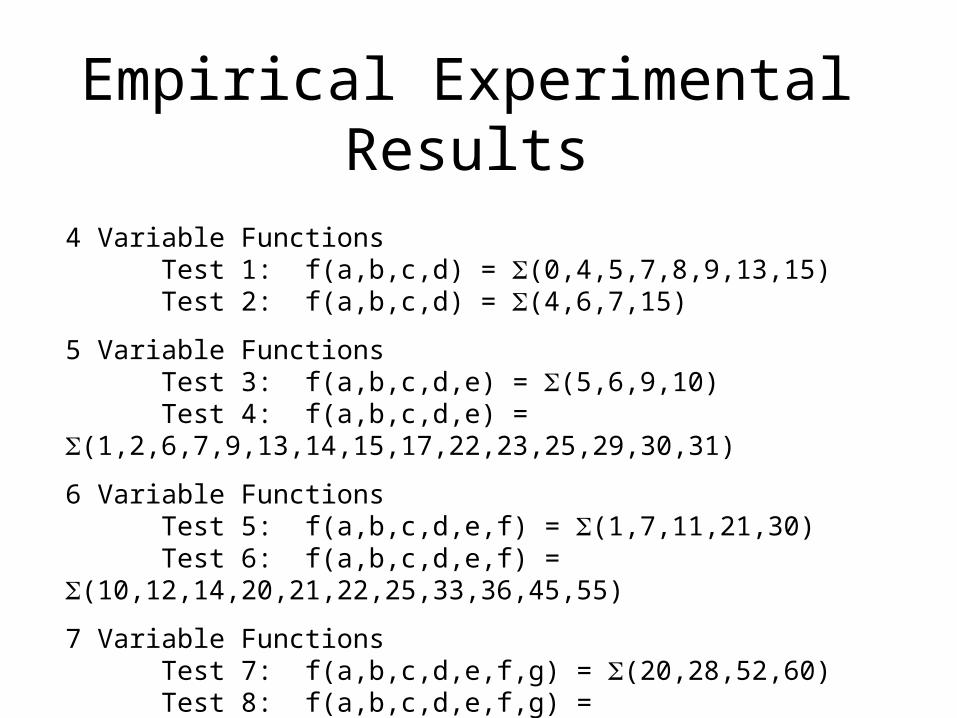
Empirical Experimental Results
4 Variable FunctionsTest 1: f(a,b,c,d) = (0,4,5,7,8,9,13,15)Test 2: f(a,b,c,d) = (4,6,7,15)
5 Variable FunctionsTest 3: f(a,b,c,d,e) = (5,6,9,10)Test 4: f(a,b,c,d,e) = (1,2,6,7,9,13,14,15,17,22,23,25,29,30,31)
6 Variable FunctionsTest 5: f(a,b,c,d,e,f) = (1,7,11,21,30)Test 6: f(a,b,c,d,e,f) = (10,12,14,20,21,22,25,33,36,45,55)
7 Variable FunctionsTest 7: f(a,b,c,d,e,f,g) = (20,28,52,60)Test 8: f(a,b,c,d,e,f,g) = (20,28,38,39,52,60,102,103,127)
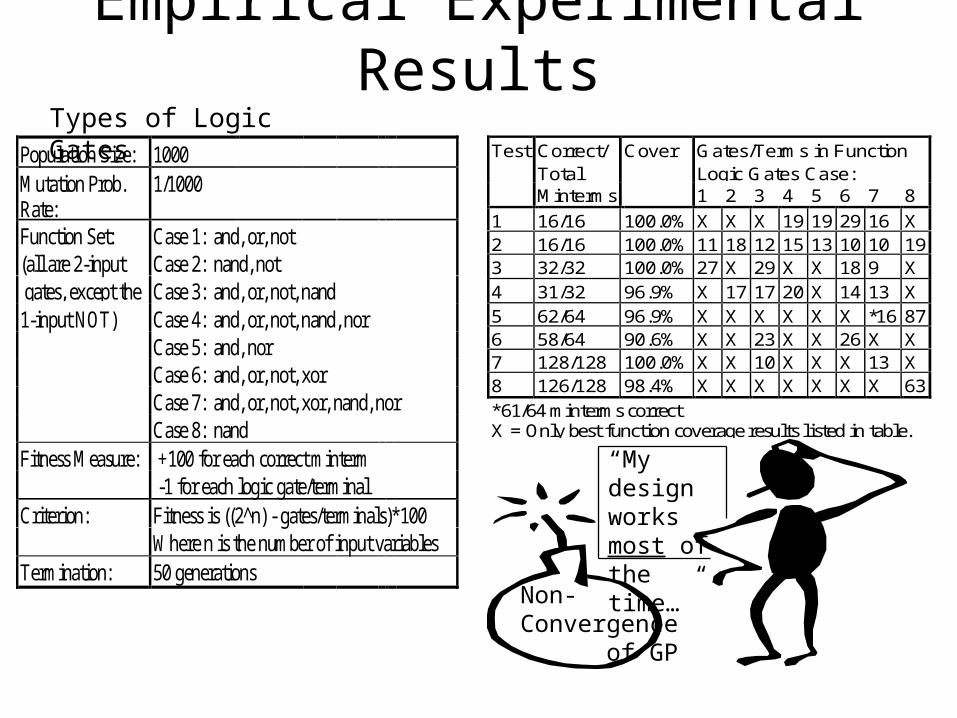
Empirical Experimental Results
Population Size: 1000Mutation Prob.Rate:
1/1000
Function Set: Case 1: and, or, not(all are 2-input Case 2: nand, not gates, except the Case 3: and, or, not, nand1-input NOT) Case 4: and, or, not, nand, nor
Case 5: and, norCase 6: and, or, not, xorCase 7: and, or, not, xor, nand, norCase 8: nand
Fitness Measure: +100 for each correct minterm -1 for each logic gate/terminal
Criterion: Fitness is ((2^n) - gates/terminals)*100Where n is the number of input variables
Termination: 50 generations
Types of Logic GatesTest Correct/ Cover Gates/Terms in Function
Total Logic Gates Case:Minterms 1 2 3 4 5 6 7 8
1 16/16 100.0% X X X 19 19 29 16 X2 16/16 100.0% 11 18 12 15 13 10 10 193 32/32 100.0% 27 X 29 X X 18 9 X4 31/32 96.9% X 17 17 20 X 14 13 X5 62/64 96.9% X X X X X X *16 876 58/64 90.6% X X 23 X X 26 X X7 128/128 100.0% X X 10 X X X 13 X8 126/128 98.4% X X X X X X X 63*61/64 minterms correctX = Only best function coverage results listed in table.
Non-Convergence of GP
“My design works most of the time…”
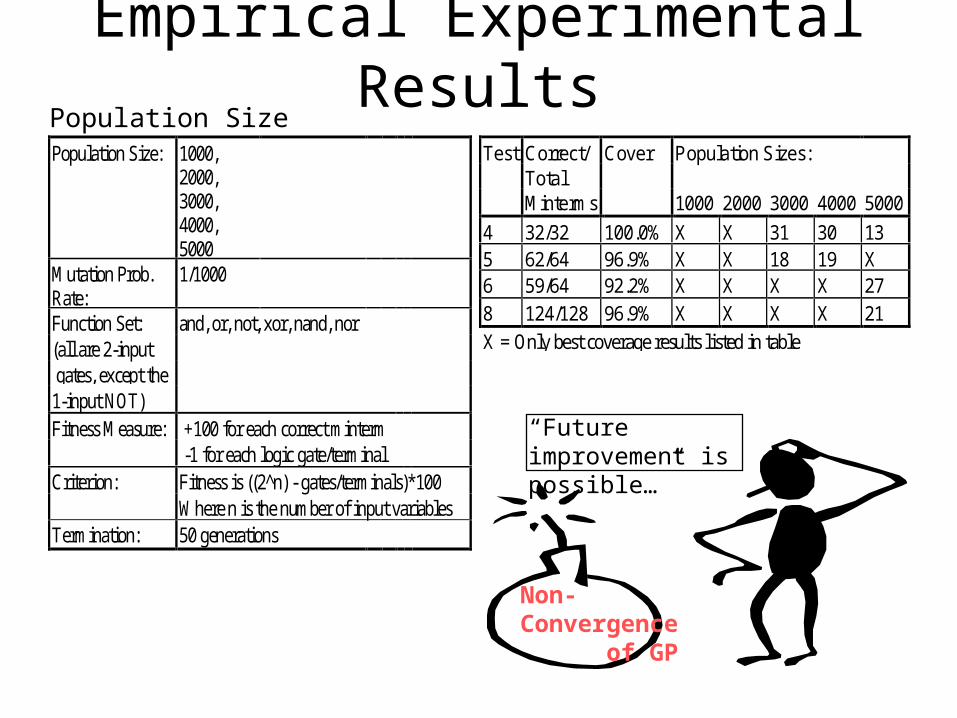
Empirical Experimental ResultsPopulation Size
Non-Convergence of GP
Population Size: 1000,2000,3000,4000,5000
Mutation Prob.Rate:
1/1000
Function Set: and, or, not, xor, nand, nor(all are 2-input gates, except the1-input NOT)Fitness Measure: +100 for each correct minterm
-1 for each logic gate/terminalCriterion: Fitness is ((2^n) - gates/terminals)*100
Where n is the number of input variablesTermination: 50 generations
“Future improvement is possible…”
Test Correct/ Cover Population Sizes:TotalMinterms 1000 2000 3000 4000 5000
4 32/32 100.0% X X 31 30 135 62/64 96.9% X X 18 19 X6 59/64 92.2% X X X X 278 124/128 96.9% X X X X 21X = Only best coverage results listed in table
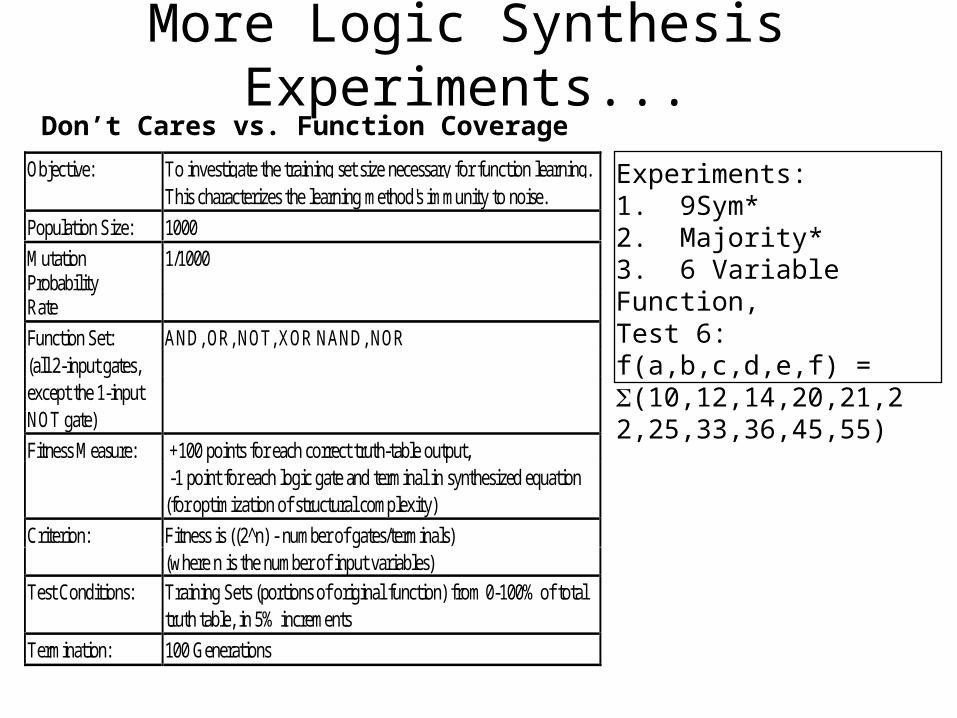
More Logic Synthesis Experiments...
Experiments:1. 9Sym*2. Majority*3. 6 Variable Function, Test 6: f(a,b,c,d,e,f) = (10,12,14,20,21,22,25,33,36,45,55)
Objective: To investigate the training set size necessary for function learning.This characterizes the learning method's immunity to noise.
Population Size: 1000
MutationProbability
1/1000
Rate
Function Set: AND, OR, NOT, XOR NAND, NOR(all 2-input gates,except the 1-inputNOT gate)
Fitness Measure: +100 points for each correct truth-table output, -1 point for each logic gate and terminal in synthesized equation(for optimization of structural complexity)
Criterion: Fitness is ((2^n) - number of gates/terminals)(where n is the number of input variables)
Test Conditions: Training Sets (portions of original function) from 0-100% of totaltruth table, in 5% increments
Termination: 100 Generations
Don’t Cares vs. Function Coverage
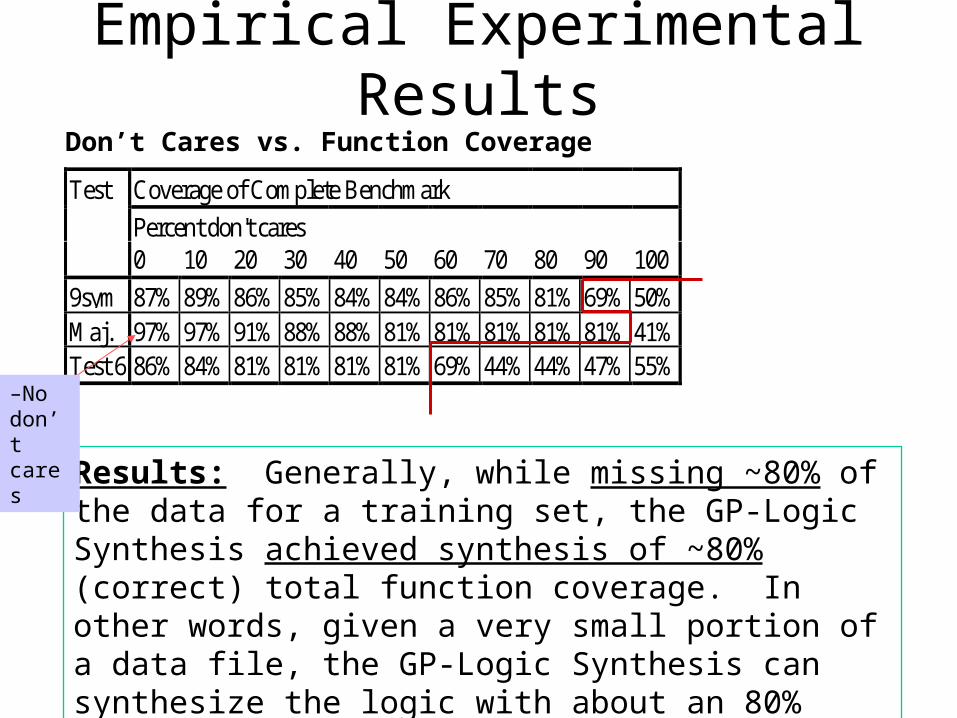
Empirical Experimental Results
Results: Generally, while missing ~80% of the data for a training set, the GP-Logic Synthesis achieved synthesis of ~80% (correct) total function coverage. In other words, given a very small portion of a data file, the GP-Logic Synthesis can synthesize the logic with about an 80% accuracy.
Test Coverage of Complete Benchmark
Percent don't cares0 10 20 30 40 50 60 70 80 90 100
9sym 87% 89% 86% 85% 84% 84% 86% 85% 81% 69% 50%Maj. 97% 97% 91% 88% 88% 81% 81% 81% 81% 81% 41%Test 6 86% 84% 81% 81% 81% 81% 69% 44% 44% 47% 55%
Don’t Cares vs. Function Coverage
–No don’t cares
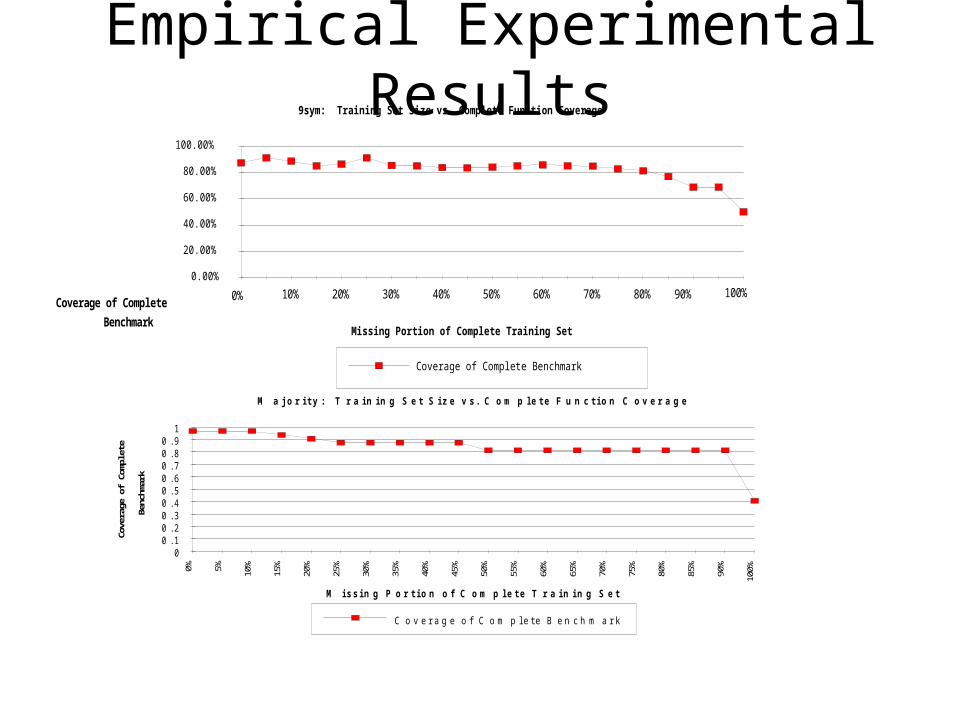
Empirical Experimental Results9sym: Training Set Size vs. Complete Function Coverage
Missing Portion of Complete Training Set
Coverage of Complete
Benchmark
0.00%
20.00%
40.00%
60.00%
80.00%
100.00%
0% 10% 20% 30% 40% 50% 60% 70% 80% 90% 100%
Coverage of Complete Benchmark
M a j o r i t y : T r a i n i n g S e t S i z e v s . C o m p l e t e F u n c t i o n C o v e r a g e
M i s s i n g P o r t i o n o f C o m p l e t e T r a i n i n g S e t
Cov
erag
e of C
ompl
ete
Benc
hmar
k
00 . 10 . 20 . 30 . 40 . 50 . 60 . 70 . 80 . 9
1
0% 5% 10%
15%
20%
25%
30%
35%
40%
45%
50%
55%
60%
65%
70%
75%
80%
85%
90%
100%
C o v e r a g e o f C o m p l e t e B e n c h m a r k
Empirical Experimental Resultsf(a,b,c,d,e,f) = E(10,12,14,20,21,22,25,33,36,45,55): Training Set Size vs.
Complete Function Coverage
00.10.20.30.40.50.60.70.80.9
1
0%
10
%
20
%
30
%
40
%
50
%
60
%
70
%
80
%
90
%
10
0%
Missing Portion of Complete Training Set
Co
vera
ge
of
Co
mp
lete
Ben
chm
ark
(%
)
Coverage of Complete Benchmark
Result SummaryTypes of Logic Gates:•Large Gate Selection (AND, OR, NOT, XOR, NAND, NOR)•The universal gate NAND (alone), sometimes showed good results
Population Sizes:•Improved coverage with larger populations•Theorized that larger populations increase the total pool of genetic diversity, increasing available traits and characteristics•But, larger populations slow the rate of evolution, by increasing necessary computations
Mutation Rates:•Small mutation rates usually introduce an appropriate amount of diversity not already available in the population•Mutation Rates must be moderate:
-Too small: no diversity available as the evolutionary process converges-Too big: unbounded diversity creates a chaotic environment
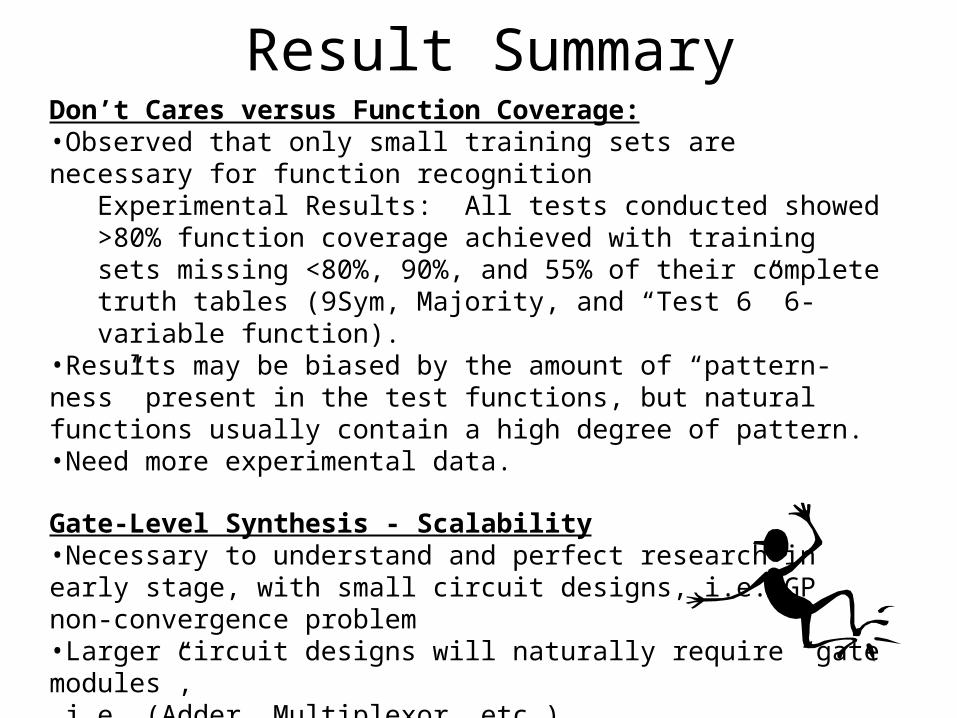
Result SummaryDon’t Cares versus Function Coverage:•Observed that only small training sets are necessary for function recognition
Experimental Results: All tests conducted showed >80% function coverage achieved with training sets missing <80%, 90%, and 55% of their complete truth tables (9Sym, Majority, and “Test 6” 6-variable function).
•Results may be biased by the amount of “pattern-ness” present in the test functions, but natural functions usually contain a high degree of pattern.•Need more experimental data.
Gate-Level Synthesis - Scalability•Necessary to understand and perfect research in early stage, with small circuit designs, i.e. GP non-convergence problem•Larger circuit designs will naturally require “gate modules”, i.e. (Adder, Multiplexor, etc.)

Future GP-Logic Synthesis Future GP-Logic Synthesis Research...Research...Use Circuit Modules (Adders, Comparators,
Multiplexors, etc.) as “functions”, (Automatically Defined Functions)
Create Custom Gate ModulesApply research to larger functions/designs and
Standard BenchmarksSystem Design - Computer ArchitecturesReduce Synthesis Error!Goal: 100% Synthesized Function Design CoverageFuture Design Tool

New New approachapproach
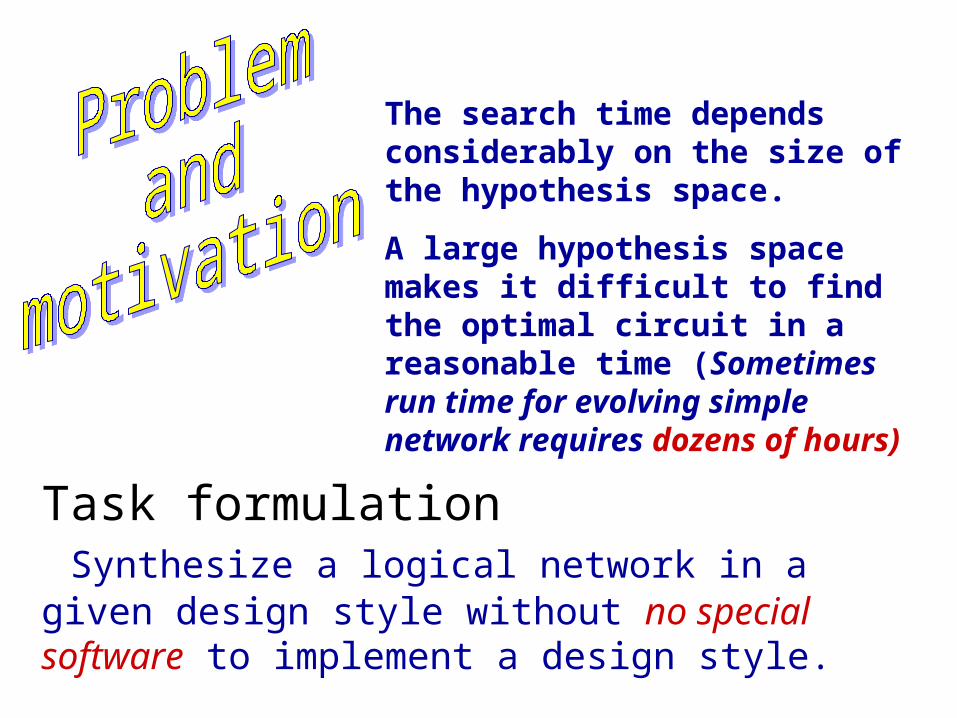
The search time depends considerably on the size of the hypothesis space.
A large hypothesis space makes it difficult to find the optimal circuit in a reasonable time (Sometimes run time for evolving simple network requires dozens of hours)
Task formulation Synthesize a logical network in a given design style without no special software to implement a design style.
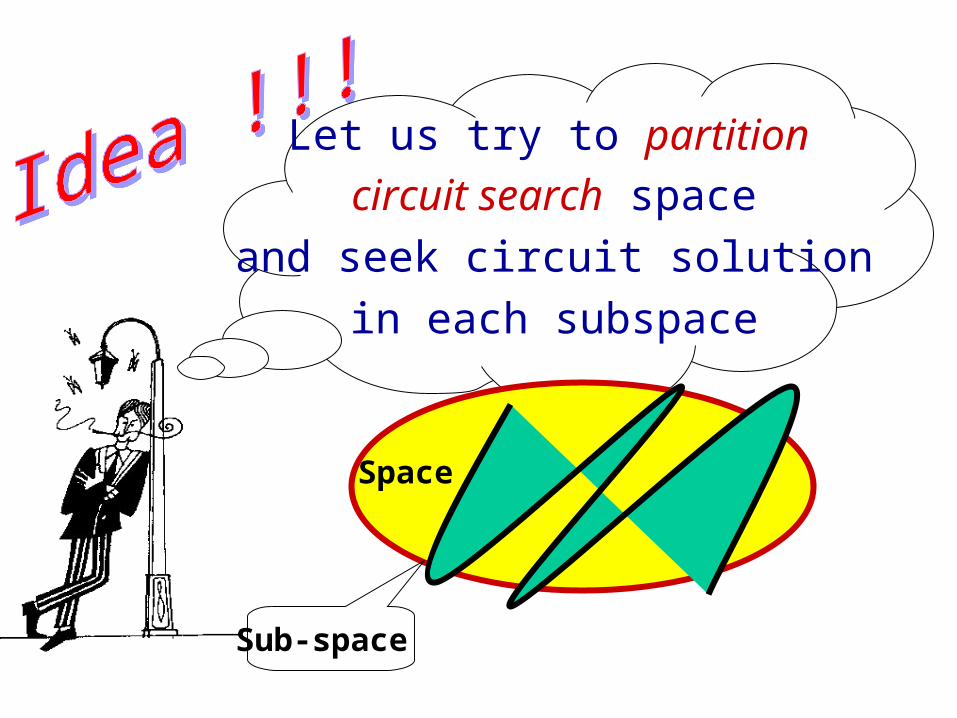
Let us try to partition circuit search space
and seek circuit solution in each subspace
Space
Sub-space
GM2xN2
a1a0b1b0
a1 a0 b1 b0
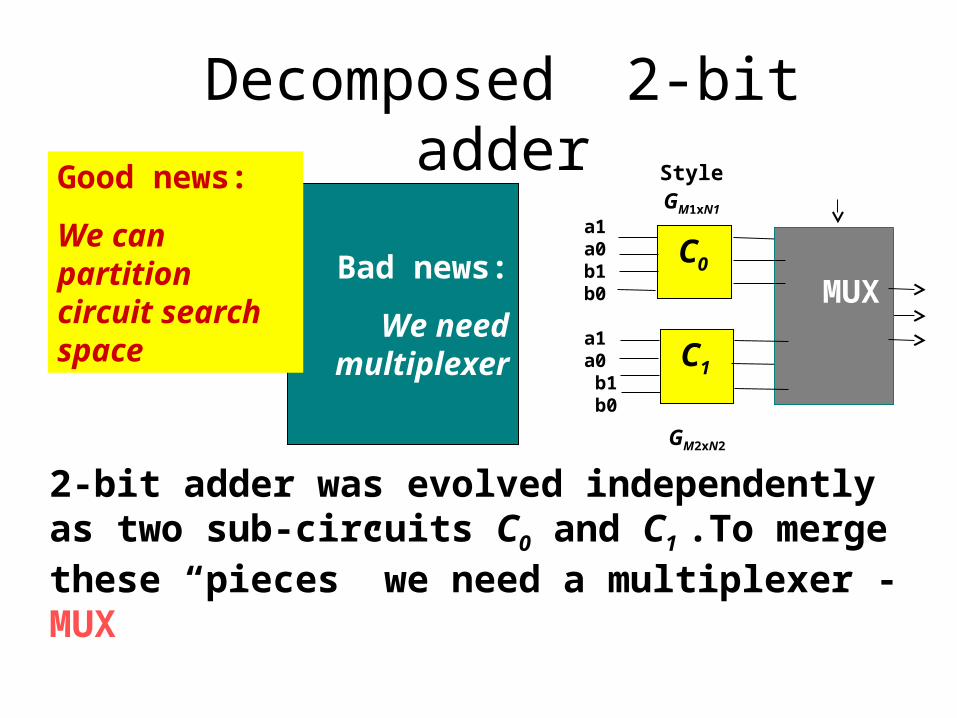
StyleGM1xN1
C0
C1
MUXBad news:
We need multiplexer
Good news:
We can partition circuit search space
Decomposed 2-bit adder
2-bit adder was evolved independently as two sub-circuits C0 and C1 .To merge these “pieces” we need a multiplexer - MUX
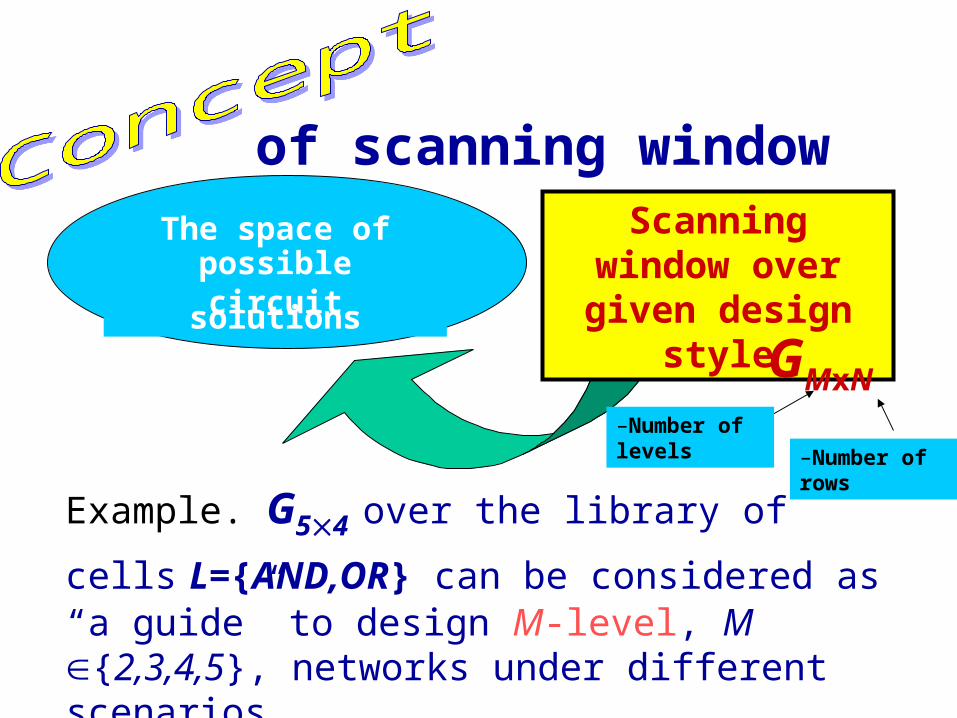
of scanning window
The space of possible
circuit solutions
Scanning window over given design
style
GMxN
Example. G54 over the library of cells L={AND,OR} can be considered as “a guide” to design M-level, M {2,3,4,5}, networks under different scenarios
–Number of levels –Number of
rows
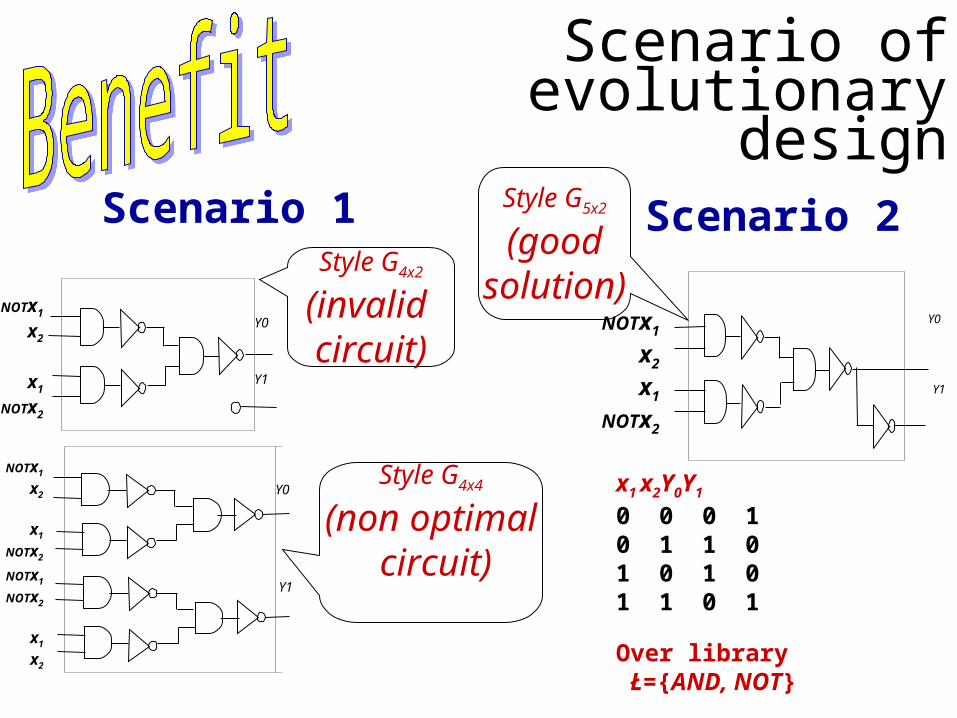
Scenario of evolutionary design
Y0
Y1
NOTx1
x2
x1
NOTx2
Scenario 1
NOTx1
x2
x1
NOTx2
Y0
Y1
Scenario 2
Y0
Y1NOTx1
NOTx2
x1
x2
NOTx1
x2
x1
NOTx2
x1 x2Y0Y1
0 0 0 10 1 1 01 0 1 01 1 0 1
Over library Ł={AND, NOT}
Style G4x2
(invalid circuit)
Style G5x2
(goodsolution)
Style G4x4
(non optimal circuit)
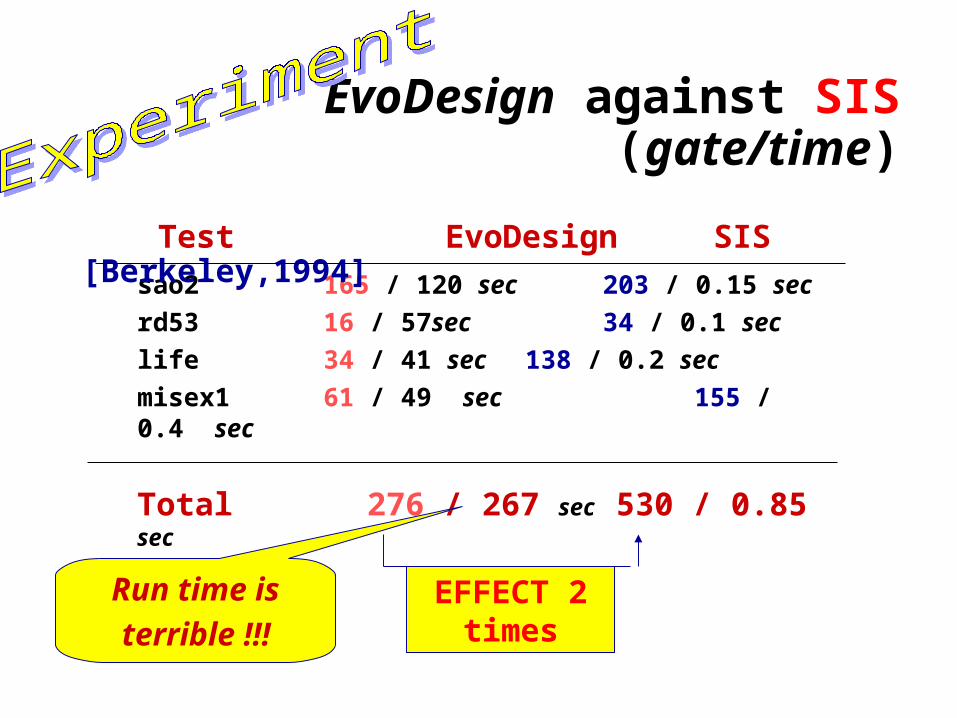
EvoDesign against SIS (gate/time)
sao2 165 / 120 sec 203 / 0.15 sec
rd53 16 / 57sec 34 / 0.1 sec
life 34 / 41 sec 138 / 0.2 sec
misex1 61 / 49 sec 155 / 0.4 sec
EFFECT 2 times
Test EvoDesign SIS [Berkeley,1994]
Total 276 / 267 sec 530 / 0.85 sec
Run time is
terrible !!!
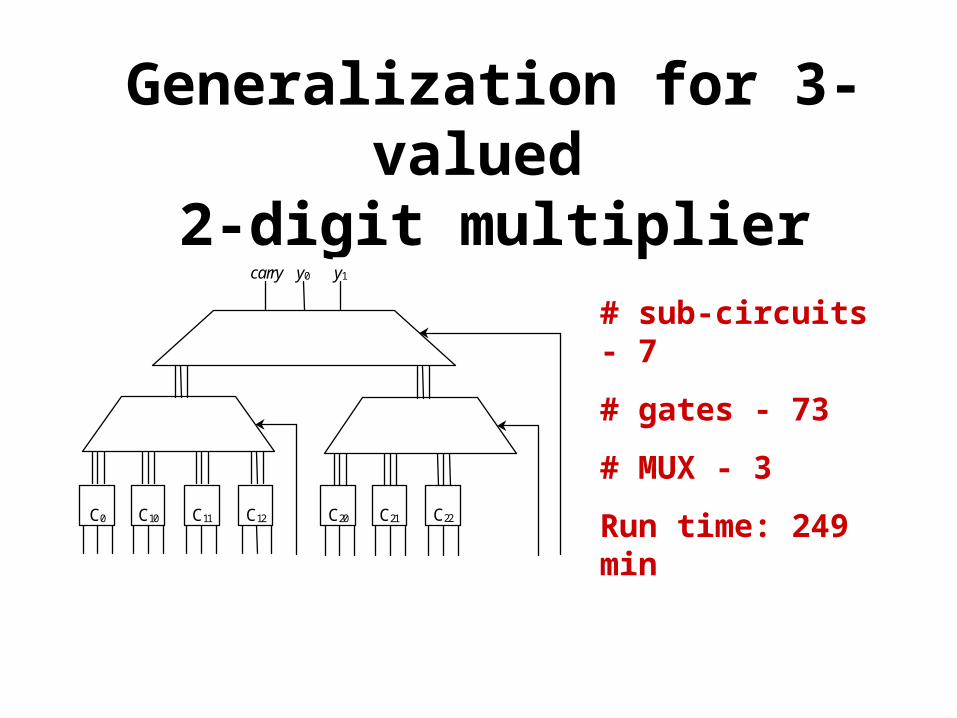
Generalization for 3-valued 2-digit multiplier
# sub-circuits - 7
# gates - 73
# MUX - 3
Run time: 249 min
carry y0 y1
C0 C12C11C10 C20 C22C21
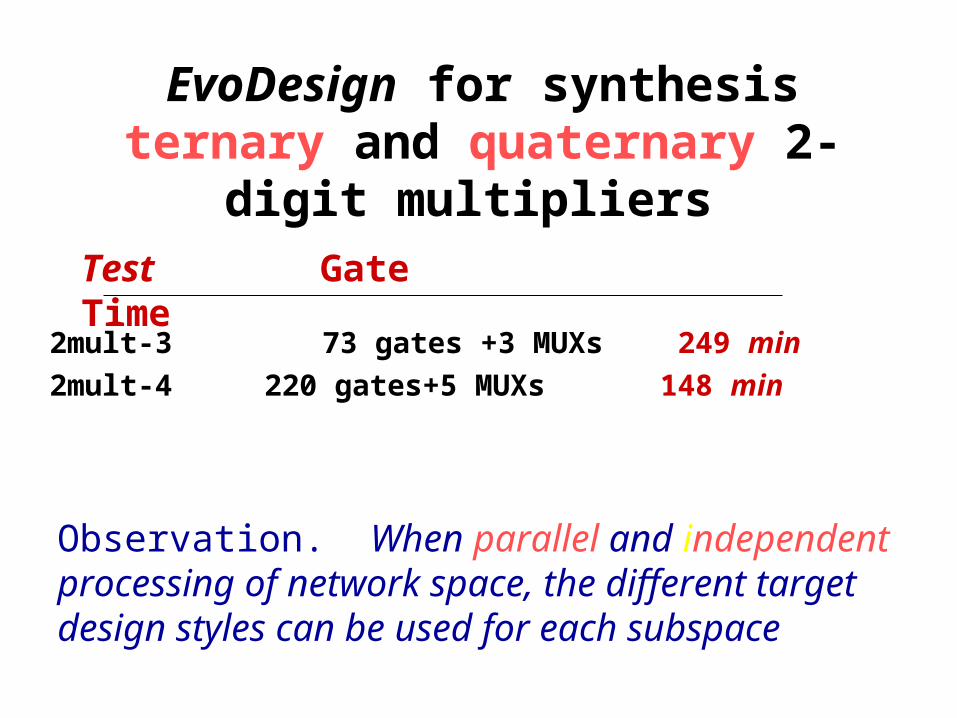
EvoDesign for synthesis ternary and quaternary 2-digit multipliers
2mult-3 73 gates +3 MUXs 249 min
2mult-4 220 gates+5 MUXs 148 min
Test Gate Time
Observation. When parallel and independent processing of network space, the different target design styles can be used for each subspace
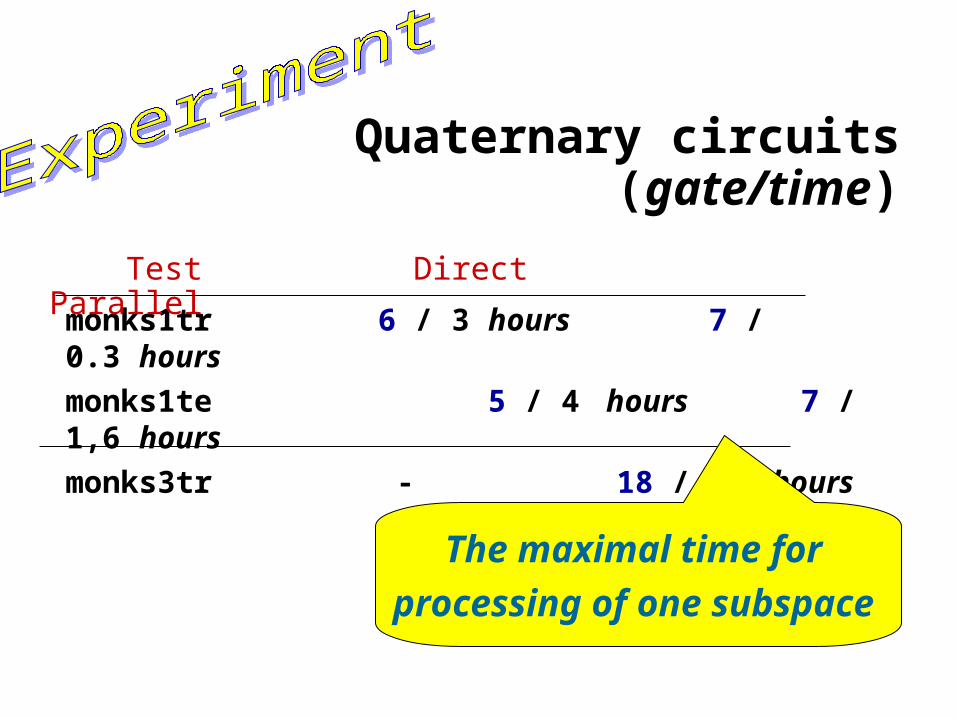
Quaternary circuits (gate/time)
monks1tr 6 / 3 hours 7 / 0.3 hours
monks1te 5 / 4 hours 7 / 1,6 hours
monks3tr - 18 / 6,1 hours
Test Direct Parallel
The maximal time for
processing of one subspace

of target design style
Library of cells L={AND,OR, EXOR, NOT, NAND, NOR}
Number of levels
Permissible interconnections between cells,
Types of gate in each level

EvoDesign against Sasao method
(I) Population size - 60 (ii) Maximal number of generations - 104
(iii) Crossover - 0.7 (iv) Level back - 3 (v) Tournament selection and - discriminator is 2 and 90%
Design style:END-OR-EXOR 3-level network with a single-
output EXOR-gate
Sasao methodEvoDesign algorithm
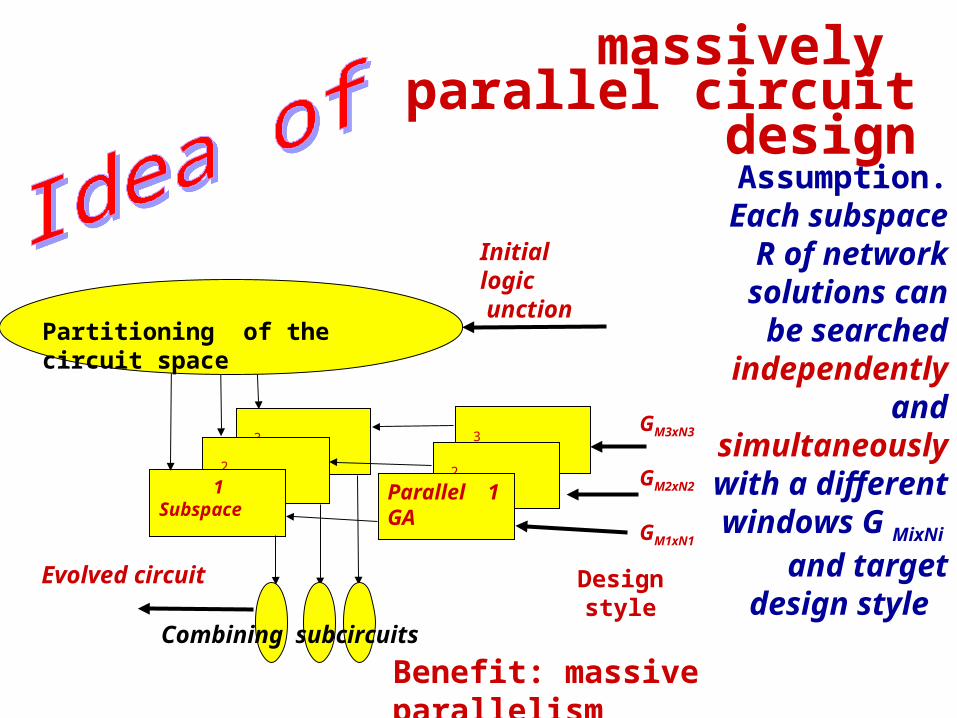
massively parallel circuit design
Design style
Evolved circuit
3
2
Parallel 1GA
3
2
1Subspace
Initial logic unction
GM3xN3
GM2xN2
GM1xN1
Partitioning of the circuit space
Combining subcircuits
Assumption. Each subspace
R of network solutions can
be searched independently
and simultaneously with a different windows G MixNi
and target design style
Benefit: massive parallelism
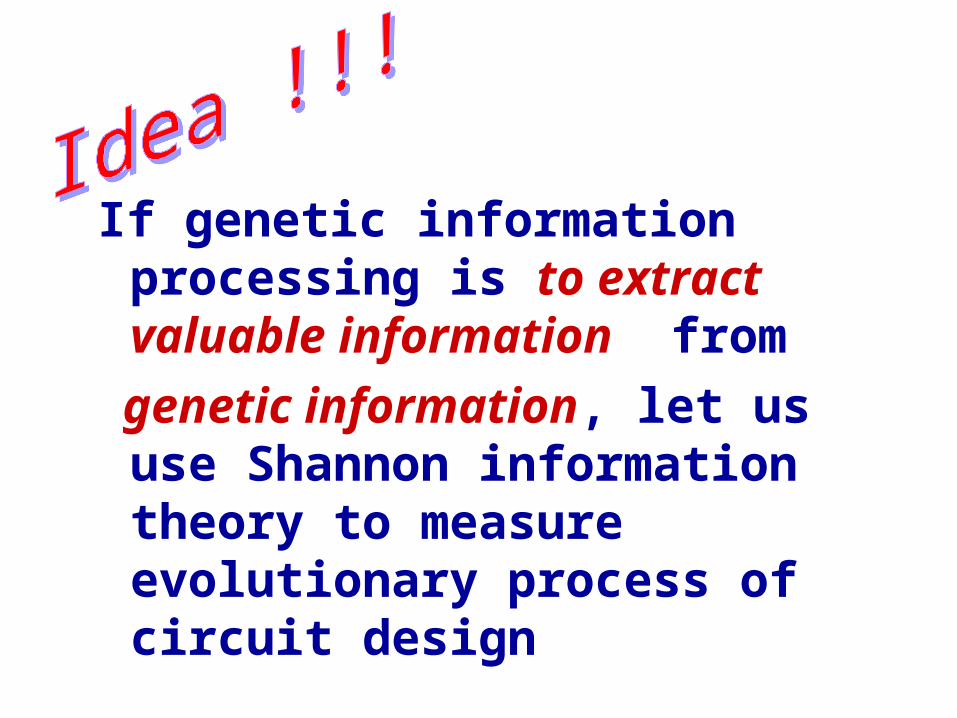
If genetic information processing is to extract valuable information from
genetic information, let us use Shannon information theory to measure evolutionary process of circuit design
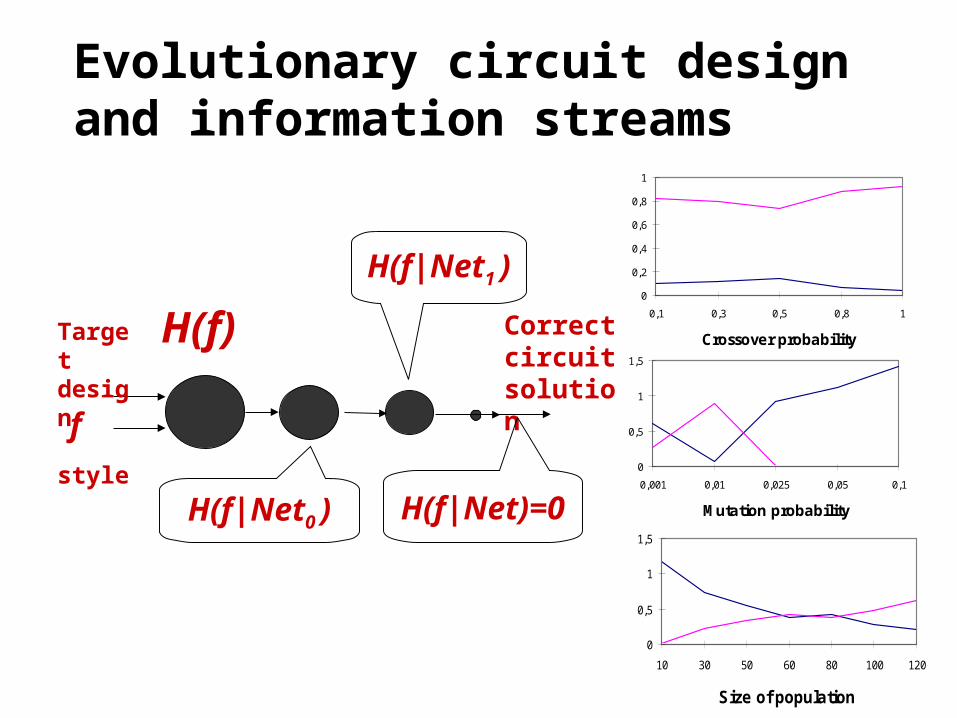
Evolutionary circuit design and information streams
f
H(f) Correct circuit solution
H(f|Net0 )
H(f|Net1 )
H(f|Net)=0
Target design style
0
0,2
0,4
0,6
0,8
1
0,1 0,3 0,5 0,8 1
Crossover probability
0
0,5
1
1,5
0,001 0,01 0,025 0,05 0,1
Mutation probability
0
0,5
1
1,5
10 30 50 60 80 100 120
Size of population
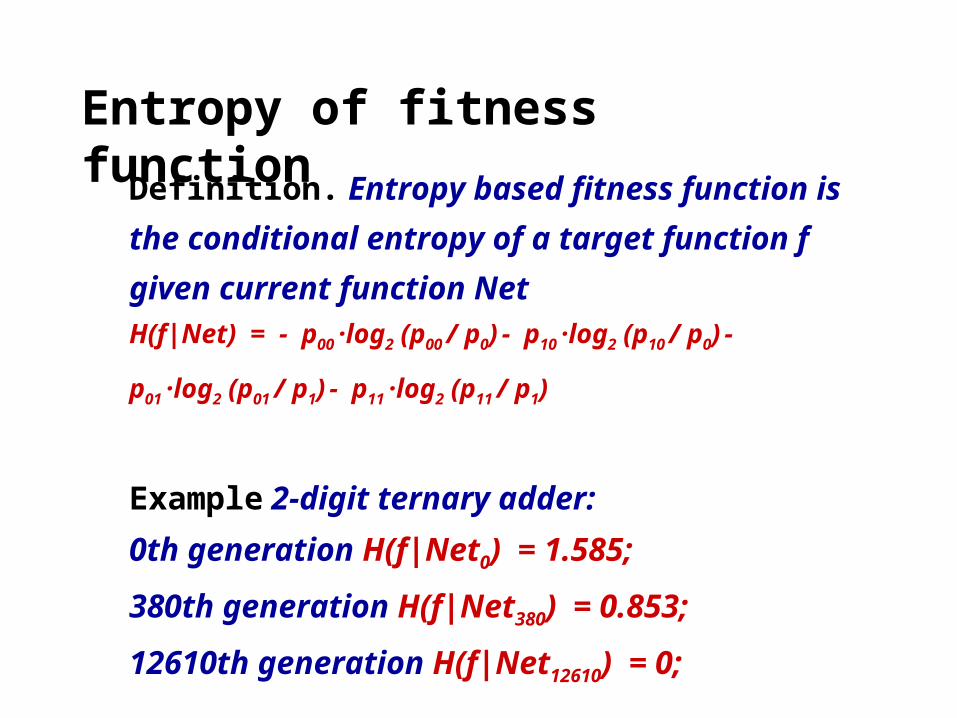
Entropy of fitness function
Definition. Entropy based fitness function is
the conditional entropy of a target function f
given current function NetH(f|Net) = - p00 ·log2 (p00 / p0) - p10 ·log2 (p10 / p0) -
p01 ·log2 (p01 / p1) - p11 ·log2 (p11 / p1)
Example 2-digit ternary adder:
0th generation H(f|Net0) = 1.585;
380th generation H(f|Net380) = 0.853;
12610th generation H(f|Net12610) = 0;
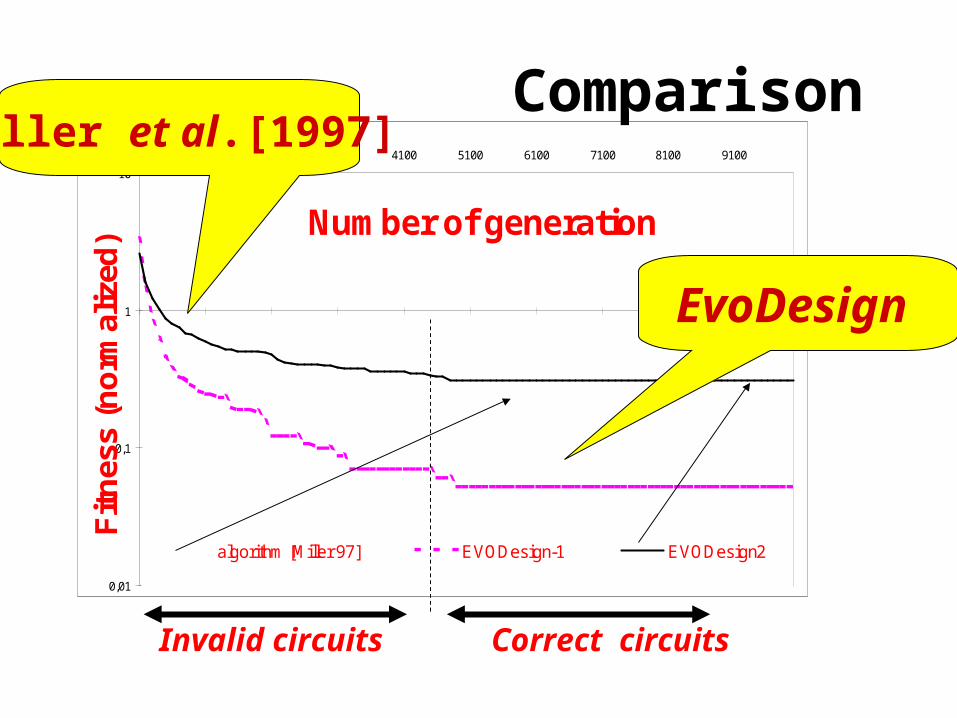
0,01
0,1
1
10
100 1100 2100 3100 4100 5100 6100 7100 8100 9100
Number of generation
Fit
nes
s (n
orm
aliz
ed)
algorithm [Miller 97] EVODesign-1 EVODesign2
Comparison
EvoDesign
Invalid circuits Correct circuits
Miller et al.[1997]
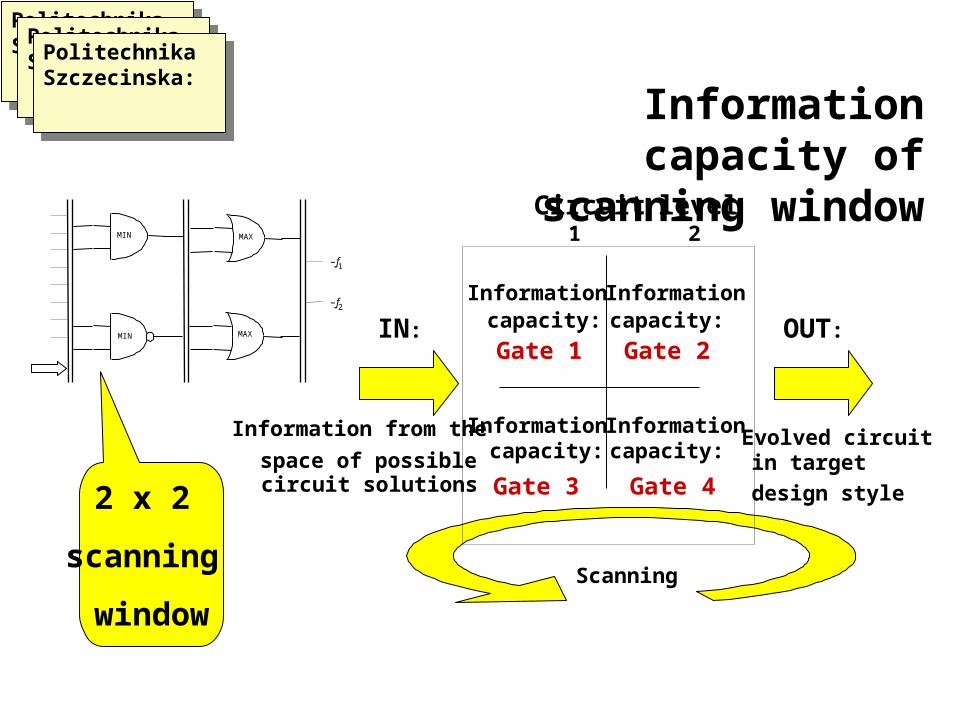
IN: OUT:
Informationcapacity:
Gate 1
Circuit level1 2
Informationcapacity:
Gate 3
Informationcapacity:
Gate 2
Informationcapacity:
Gate 4
Information from the
space of possiblecircuit solutions
Evolved circuitin target
design style
Scanning
MIN
MIN
MAX
MAX
–f–1
–f–2
Politechnika Szczecinska:
Politechnika Szczecinska:Politechnika
Szczecinska:
Politechnika Szczecinska:Politechnika
Szczecinska:
Politechnika Szczecinska:
2 x 2
scanning
window
Information capacity of scanning window
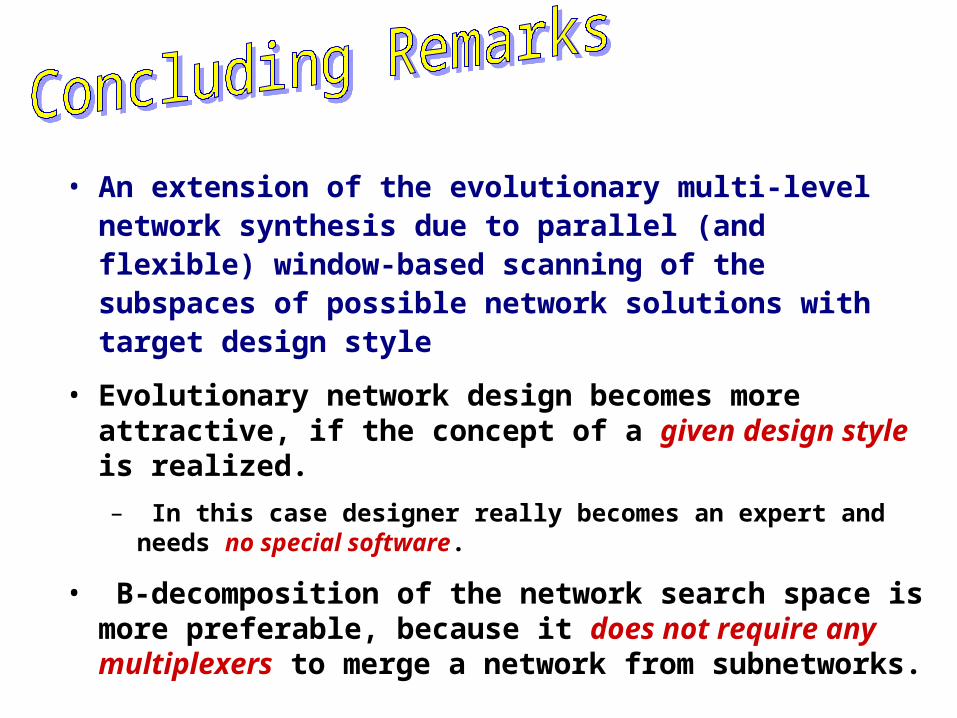
• An extension of the evolutionary multi-level network synthesis due to parallel (and flexible) window-based scanning of the subspaces of possible network solutions with target design style
• Evolutionary network design becomes more attractive, if the concept of a given design style is realized.
– In this case designer really becomes an expert and needs no special software.
• B-decomposition of the network search space is more preferable, because it does not require any multiplexers to merge a network from subnetworks.
– Can evolutionary computation be of practical interest for CAD Community?
– In which applications evolutionary computation can be an efficient support of traditional techniques?
References
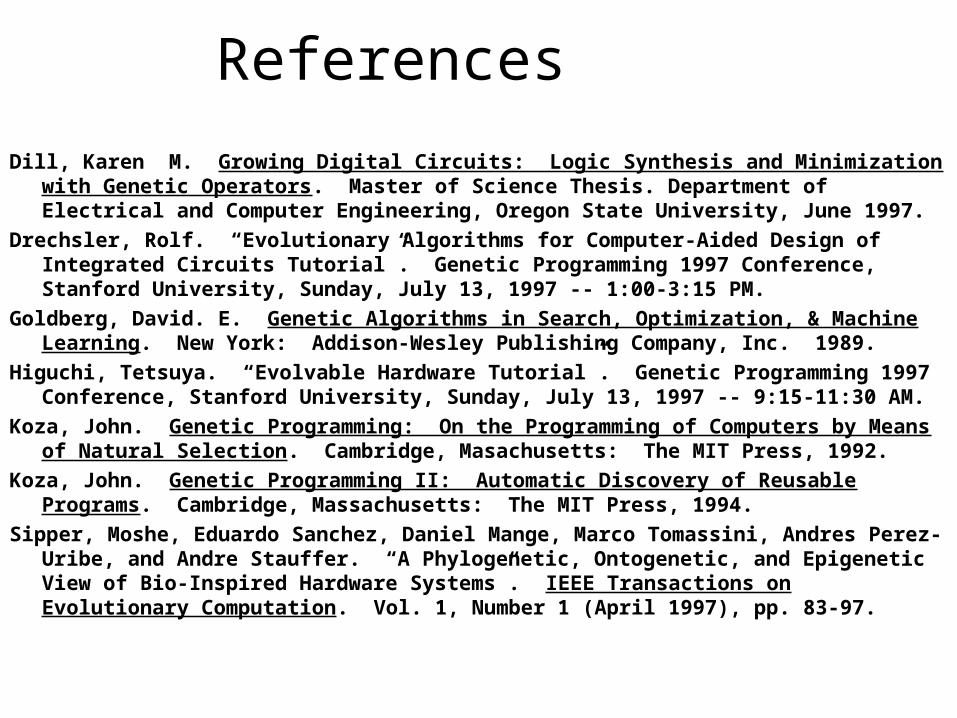
Dill, Karen M. Growing Digital Circuits: Logic Synthesis and Minimization with Genetic Operators. Master of Science Thesis. Department of Electrical and Computer Engineering, Oregon State University, June 1997.
Drechsler, Rolf. “Evolutionary Algorithms for Computer-Aided Design of Integrated Circuits Tutorial”. Genetic Programming 1997 Conference, Stanford University, Sunday, July 13, 1997 -- 1:00-3:15 PM.
Goldberg, David. E. Genetic Algorithms in Search, Optimization, & Machine Learning. New York: Addison-Wesley Publishing Company, Inc. 1989.
Higuchi, Tetsuya. “Evolvable Hardware Tutorial”. Genetic Programming 1997 Conference, Stanford University, Sunday, July 13, 1997 -- 9:15-11:30 AM.
Koza, John. Genetic Programming: On the Programming of Computers by Means of Natural Selection. Cambridge, Masachusetts: The MIT Press, 1992.
Koza, John. Genetic Programming II: Automatic Discovery of Reusable Programs. Cambridge, Massachusetts: The MIT Press, 1994.
Sipper, Moshe, Eduardo Sanchez, Daniel Mange, Marco Tomassini, Andres Perez-Uribe, and Andre Stauffer. “A Phylogenetic, Ontogenetic, and Epigenetic View of Bio-Inspired Hardware Systems”. IEEE Transactions on Evolutionary Computation. Vol. 1, Number 1 (April 1997), pp. 83-97.
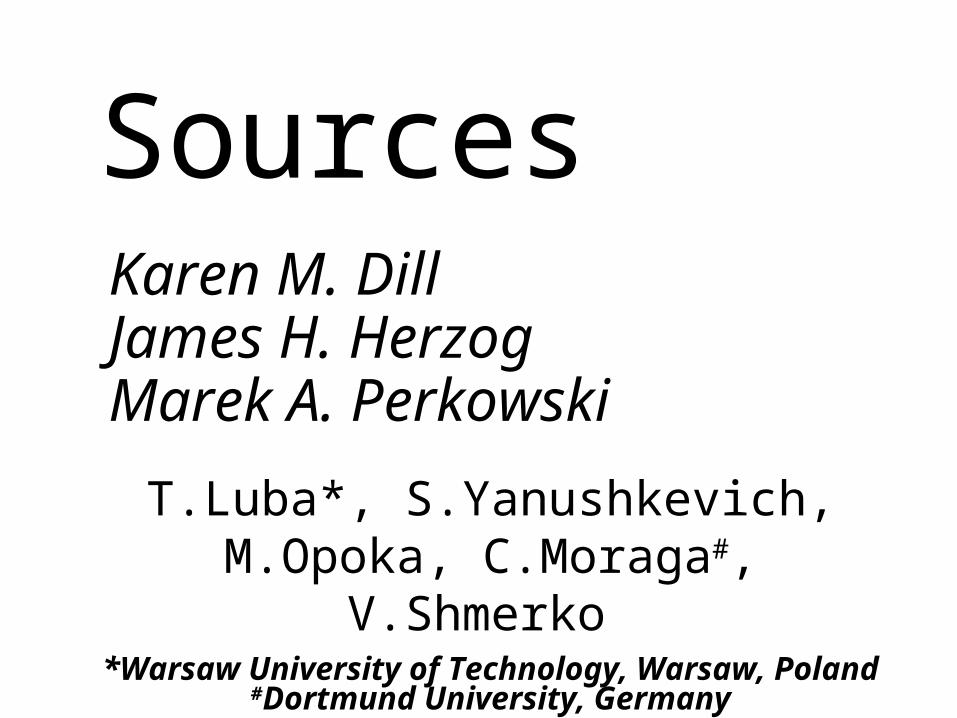
T.Luba*, S.Yanushkevich, M.Opoka, C.Moraga#, V.Shmerko
*Warsaw University of Technology, Warsaw, Poland#Dortmund University, Germany
Technical University, Szczecin, Poland
SourcesKaren M. Dill James H. HerzogMarek A. Perkowski