Embed Size (px)
Citation preview
Source Control Planning for Municipal Wastewater System
Permit Compliance
2018 TCEQ Autumn Environmental Conference and Expo
Baltazar Lucero-Ramirez, P.E.
Water Quality DivisionTexas Commission on Environmental Quality

Source Control Approach

Source Control Approach1. Identify pollutant(s) of concern
2. Find sources of pollutant(s)
3. Determine control strategies
4. Set realistic reduction goals
5. Implement strategies
6. Monitor progress
7. Reassess and make adjustments
8. Communicate results

1. Identify Pollutant(s) of ConcernWhat is the concern?
Prohibited discharges into publicly owned treatment works (POTW)?
Excessive wastewater treatment plant (WWTP) loading?
WWTP pass-through or interference?
Texas Surface Water Quality Criteria?
• Whole Effluent Toxicity Failures • Toxicity Identification and Reduction Evaluations• Sludge limits
TPDES permit limit violations?

Prohibited Discharges to POTWs[40 CFR §403.5(b)]
Pollutants which create a Fire or Explosion Hazard
Pollutants which will cause corrosive damage and not below pH 5.0 S.U.
Solid or viscous pollutants in amounts which will cause flow obstructions
Any pollutants discharged at a flow rate and/or concentration that will cause interference

Prohibited Discharges to POTWs[40 CFR §403.5(b)]
Heat in amounts which will inhibit biological activities
Oil, non-biodegradable cutting oil, or products of mineral oil origin in amounts which will cause interference or pass through
Pollutants that cause toxic gases, vapors or fumes within the POTW
Any trucked or hauled pollutants, except at discharge points designated by the POTW

1. Identify Pollutant(s) of Concern
WWTPIndustrial
Commercial
Domestic
Hauled Waste
Other Sources?
Pollutant Sources
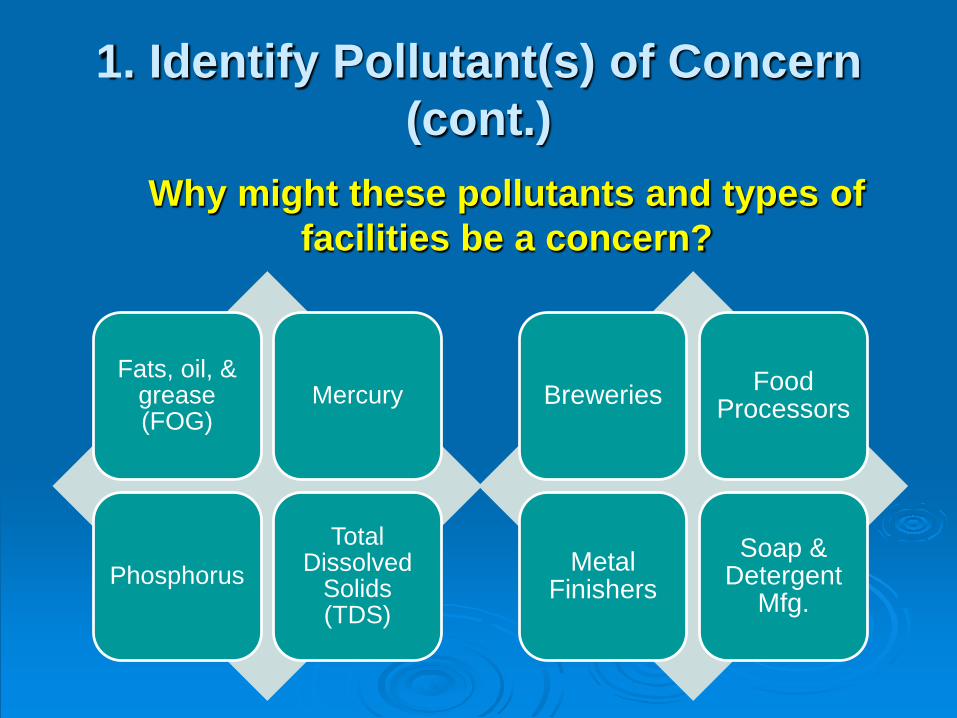
1. Identify Pollutant(s) of Concern (cont.)
Why might these pollutants and types of facilities be a concern?
Fats, oil, & grease (FOG)
Mercury
PhosphorusTotal
Dissolved Solids (TDS)
Breweries Food Processors
Metal Finishers
Soap & Detergent
Mfg.

1. Identify Pollutant(s) of Concern(cont.)
“Look for diamonds in your backyard”
Chemicals added to the collection system or WWTP
Hauled waste accepted at the WWTP (grease or grit waste, septic, RCRA, CERCLA)
Illegal dumping
Water or wastewater sludge discharged into the collection system

2. Find Sources of Pollutant
Identify sewer sub-basins in your collection
system
Sample at locations that capture each
sub-basin
Identify sub-basins with
high pollutant contributions Sewer Collection System Sub-Basin Map City of
Folsom, CA

3. Determine Prevention and Control Strategies (cont.)
Public Education?
• Requires dedicated outreach• Sensible to public perception• Continuous effort to maintain
desired behavior change
Suitable for multiple sources difficult to control (domestic)
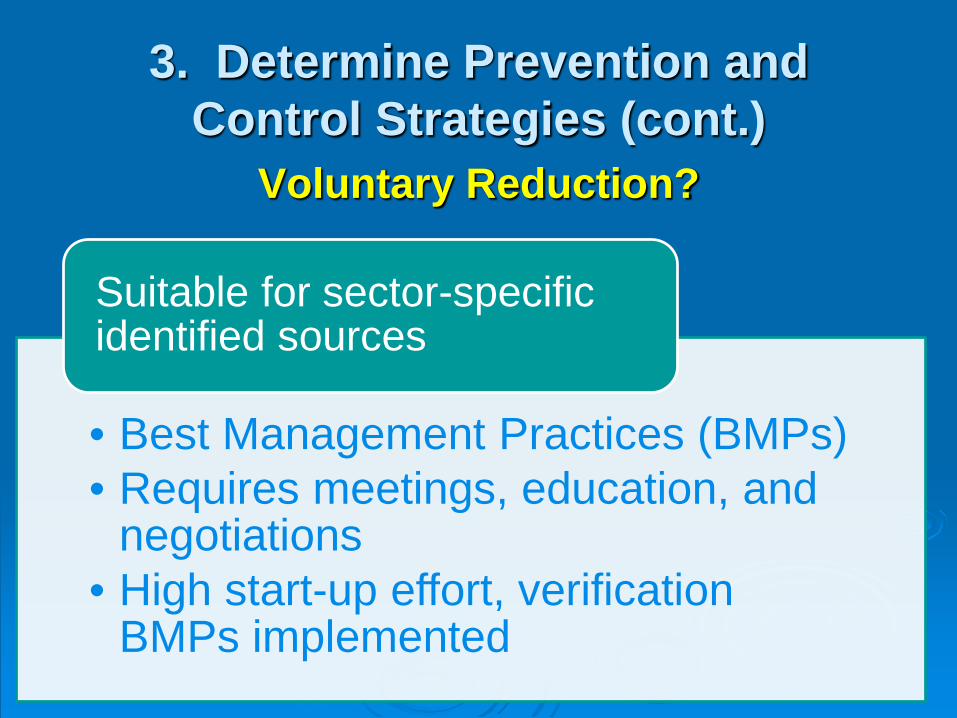
3. Determine Prevention and Control Strategies (cont.)
• Best Management Practices (BMPs)• Requires meetings, education, and
negotiations• High start-up effort, verification
BMPs implemented
Suitable for sector-specific identified sources
Voluntary Reduction?
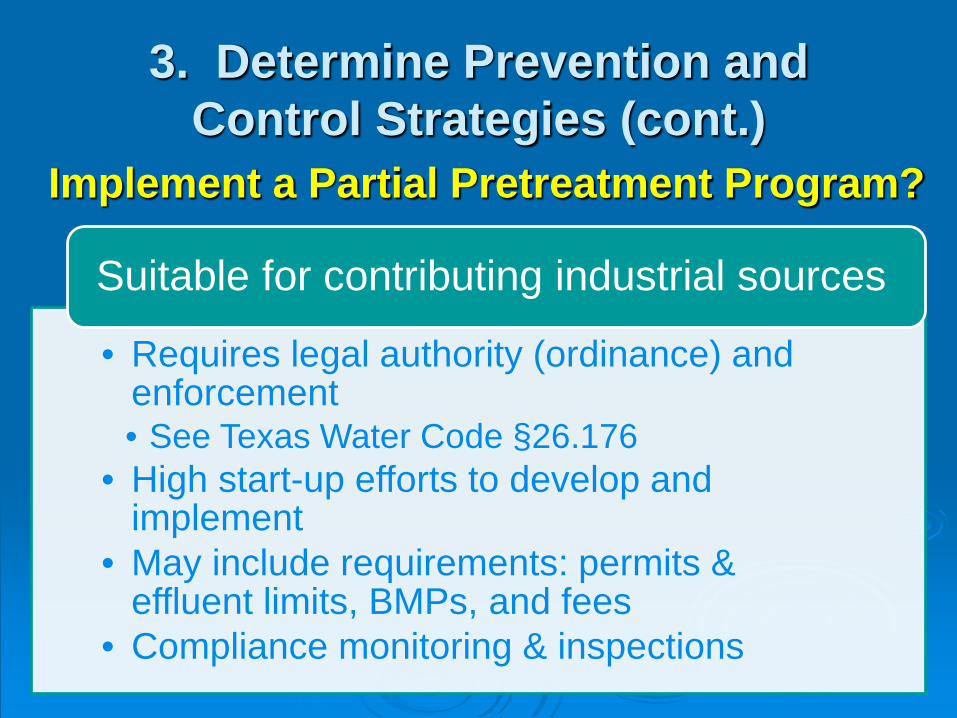
3. Determine Prevention and Control Strategies (cont.)
• Requires legal authority (ordinance) and enforcement • See Texas Water Code §26.176
• High start-up efforts to develop and implement
• May include requirements: permits & effluent limits, BMPs, and fees
• Compliance monitoring & inspections
Suitable for contributing industrial sources
Implement a Partial Pretreatment Program?

3. Determine Prevention and Control Strategies (cont.)
Calculate and rank contributions of total loading from identified sources

4. Set Reduction Goals
Determine how much the WWTP can treat
Determine effluent concentration goal (permit limit, water quality standard)
Calculate allowable influent
concentration based on effluent
limit
Where,[L]in = Allowable influent loading
(mass)[C]eff = Effluent limit concentration
(mass/volume)Q = Wastewater flow
(volume/time)RE = Removal efficiency
(design or measured )
𝐿𝐿 𝑖𝑖𝑛𝑛 =𝐶𝐶 𝑒𝑒𝑒𝑒𝑒𝑒 ∗
𝑄𝑄1 − 𝑅𝑅𝑅𝑅

4. Set Reduction Goals (cont.)
• Does the loading from the identified contributing sources exceed allowable influent (headworks) loading or inhibition limit?
• What reduction is needed at the headworks and from each source or group of sources?
• Set realistic reduction goal(s)• Consider a safety factor
Compare loading from sources to allowable influent loading to set reduction goal

5. Implement Strategy
Select the control strategies to be implemented• Consider how progress will be
measured• How will you know if your actions
are successful?• Multiple strategies can be used
(more than one for each type of source)
• Consider implementation period, resource needs, costs, and benefits

5. Implement Strategy (cont.)
Budget
Funding
Buy-in
Cost/benefits
Planning and ImplementingEducation and outreach activities
Meetings and negotiations
Pretreatment program development
Monitoring and evaluating
Communicating results

6. Monitor Progress
Continue sampling
Collection system sub-
basins
WWTP influent and
effluentContributing
facilities
Track compliance or
progress toward goal
Graph data to visualize trends and evaluate
and monitor progress

7. Reassess & Adjust
Are the implemented strategies achieving the
goal (consistently)?
• If not, why not?
Look for additional sources that can be
prevented or controlled
• Have new sources moved into town and not identified?
• Have facilities added new sources?
• Continuously update the list of potential sources

8. Communicate Results
Management
Public
FacilitiesWIFM

Source Control Case Studies

Case Study: WCWD Vehicle Service Facility Pollution Prevention Program
West County Wastewater DistrictEstablished a voluntary pollution prevention (P2)
program
• 46 vehicle service facilities
• 24 discharge wastewater (not permitted, but must comply with local limits in ordinance)
• 22 facilities are “zero” discharge

Case Study: WCWD Vehicle Service Facility P2 Program
West County Wastewater District
Each facility gets BMP
information
Required annual
sampling of Cu, Hg, Pb,
and Zn(at WCWD expense)
Implement BMPs to get free annual
sampling.....or.....
Resampling done at
customer expense
when exceeding local limit if BMPs not
implemented

Case Study: WCWD Vehicle Service Facility P2 Program
19.9
0.5449.9
0.0735.1 0.14
0.0012 0.0002
02468
101214161820
1995 1998
Zinc
Lead
Copper
Mercury
Zinc Lead Copper Mercury
Vehicle Service Monitoring Results for Zn, Pb, Cu, & Hg (1995- 98)

Case Study: 2013 City of Cleburne
Feb. 2013 - POTW failed sublethal WET tests (Water Flea - Ceriodaphnia dubia)
Began investigating potential sources in the industrial park
Sampled sewer system
• Found high selenium levels downstream from an industry, power plant, and the POTW, but no known sources ???

Case Study: 2013 City of Cleburne (cont.)
• Lab started using inductively coupled plasma mass spectrometry (ICP-MS) & helium collision cell
Further investigation revealed false-positive
results for selenium due to bromide interference
Found industry started discharging a
wastestream containing bromide
25% of POTW effluent reused at power plant so
may also elevate bromide levels in influent

Case Study: 2013 City of Cleburne (cont.)
• Conducted study to demonstrate WET failures due to bromide
• TPDES permit and City required industry to not discharge wastestream containing bromide
The City did NOTwant a WET
limit in permit

Brewery Case StudyCity requested assistance
from TCEQ’s Small Business and Local
Government Assistance Program (SBLGA)
Excessive TSS discharge from brewery was
allegedly causing pass through and
interference
Recurring TSS violations and enforcement
action
City’s Industrial Waste Ordinance had a limit for
BOD5 but not for TSS
Brewery installed anaerobic biological treatment:
BOD5 <300 mg/L
TSS measured downstream of
discharge ~ 2,000 mg/L
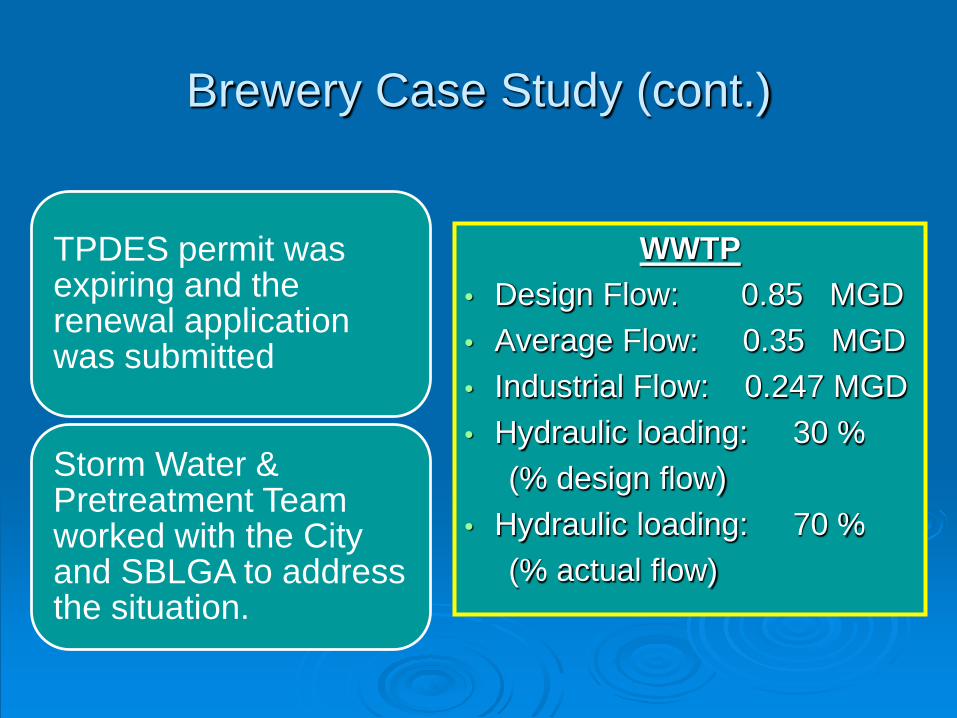
Brewery Case Study (cont.)
WWTP• Design Flow: 0.85 MGD• Average Flow: 0.35 MGD• Industrial Flow: 0.247 MGD • Hydraulic loading: 30 %
(% design flow)• Hydraulic loading: 70 %
(% actual flow)
TPDES permit was expiring and the renewal application was submitted
Storm Water & Pretreatment Team worked with the City and SBLGA to address the situation.

Brewery Case StudyOutcome
Issued TPDES permit that required implementation of a partial pretreatment program
Conduct industrial
waste surveyUpdate
ordinance
Develop and adopt
technically-based local
limits for conventional
pollutants and metals
Develop enforcement
response plan and
procedures

Source Control and Reduction of Phosphorous

CASE STUDY: 2013 CITY OF SEGUIN
Phosphorus Limit
TPDES Permit Renewal
• POTW effluent samples collected
High Concentration of Phosphorous
• Draft TPDES permit with P limit
City says “No’
• Submit a P reduction study workplan

CASE STUDY: 2013 CITY OF SEGUIN
The phosphorous
reduction study began from 2011 to
2014.
Samples were taken
from different location.
Identified BMPs to
control the source.

CASE STUDY: 2013 CITY OF SEGUINSamples were collected from different locations: IU’s effluentManholes downstream of IU Upstream of WWTP lift station and WWTP influent

CASE STUDY: 2013 CITY OF SEGUINFurther Investigation Results: Narrowed down to two
industrial users (IUs) that discharge to the POTW.
Poultry Processor (PP)Influent Flow: 1 million gallon per day (MGD) • Poultry processing facility• Major source of influent phosphorus
to POTW
Construction Equipment Manufacturer (CEM)Influent Flow: 0.01 MGD• Equipment cleaning• Occasionally having higher
phosphorus concentration than PP
• 12.6mg/L
Average Influent
P
• 14.9 mg/L
Average Influent
P

CASE STUDY: 2013 CITY OF SEGUINActions taken to reduce phosphorus concentration
PP
• Installed a system of pipes, pumps, and tanks to capture the marinade
• Eliminated cleaning products that contain phosphorus (e.g. Trisodiumphosphate)
• Added ferric sulfate to the wastewater treatment process to lower phosphorus levels
CEM
• Reviewed Safety Data Sheets list to identify chemicals that contained phosphorus
• Cleaned out oil-water separators that are used to dump mop buckets and floor scrubbers
• Reviewed correlation of fats, oils, and grease (FOG) levels to phosphorus levels

Phosphorus Source Control Resources
Phosphorus Management Plan Guide (Minnesota Pollution Control Agency, 2006)
Six Municipalities, One Watershed: A Collaborative Approach to Remove Phosphorus in the Assabet River Watershed (EPA 820-R-15-097, 2015)

Summary
• Identify known and potential sources of pollutants of concern
Know your service area and
contributors
• Influent, effluent, and sludge limits for current and draft permits
• Look for trends (anticipate limits)
Be familiar with your TPDES permit
requirements
• Look for trends• If not making progress, ask “why
not?”
Set goals, monitor and evaluate progress, and
reassess strategies
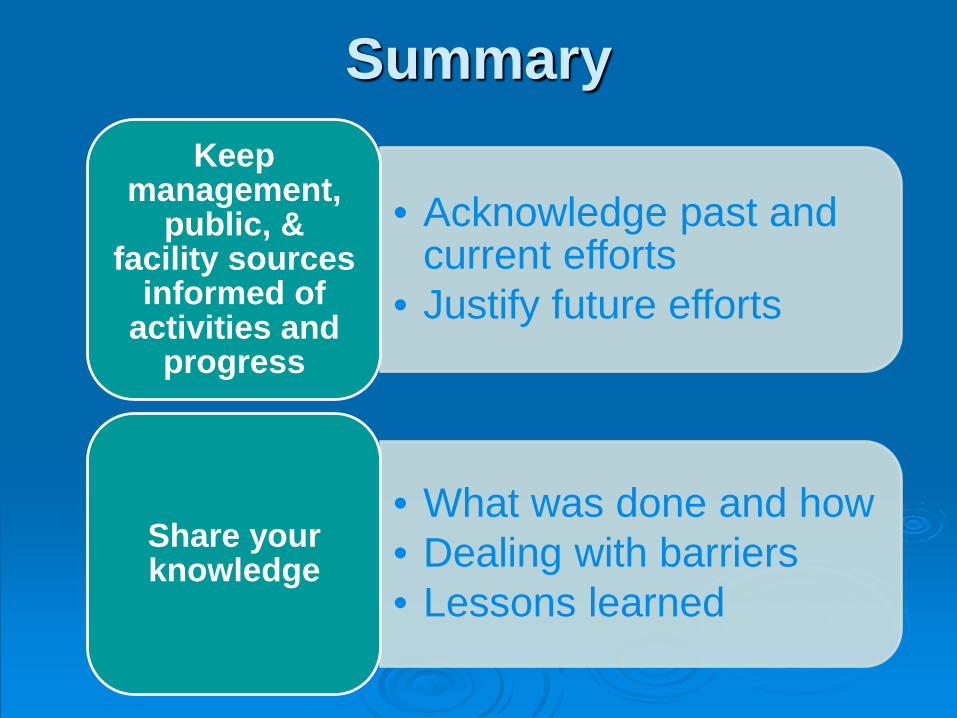
Summary
• Acknowledge past and current efforts
• Justify future efforts
Keep management,
public, & facility sources
informed of activities and
progress
• What was done and how• Dealing with barriers• Lessons learned
Share your knowledge

SOME SECTOR-SPECIFIC RESOURCES FOR:
• Food Processing• Mercury
• Breweries• Phosphorus

Food Processing Source Control Resources EPA Multimedia
Environmental Compliance Guided for Food Processors (EPA 305-B-99-005) http://www.epa.gov/complia
nce/resources/publications/assistance/sectors/multifood.pdf
Minnesota Technical Assistance Program http://mntap.umn.edu/food/
wastewater.htm

Food Processing Source Control Resources
Waste Reduction in Food Processing http://infohouse.p2ric.org/ref/02/01228.pdf
Wastewater Reduction and Recyclingin Food Processing Operations http://infohouse.p2ric.org/ref/24/23261.htm
Meat, Food, and Dairy Processing Industry-Waste Streams & Pollution Prevention http://www.waterboards.ca.gov/coloradoriver/water_is
sues/programs/pretreatment/docs/rev_food_processors.pdf

Mercury Reduction ResourcesMercury-Added Products Found at
Drinking Water & Wastewater Treatment Facilities The Northeast Waste Management Officials’
Association (NEWMOA) http://www.newmoa.org/prevention/mercury/pr
ojects/WWT/Mercury-AddedProductsatWWTPlants.pdf
EPA Dental Amalgam http://www.epa.gov/hg/dentalamalgam.html

Mercury Source Control Resources
Blueprint for Mercury Reduction Guidance for WWTPs Western Lake
Superior Sanitation District
http://www.wlssd.com/WLSSD_Blueprint_Mercury_Reduction.pdf

Mercury Source Control Resources EPA Recommended Management and
Disposal Options for Mercury-Containing Products Consumer products: home items Medical pharmaceutical products Consumer products: automotive parts Commercial products Alternatives to Mercury-Containing Products http://www.epa.gov/mercury/mgmt_options.ht
ml#commercial

Brewery Source Control Resources
Examples of EPA Brewery Inspections http://www.epa.gov/region9/water/pretreatme
nt/files/firestone-brewery-ins.pdf http://www.epa.gov/region09/water/pretreatm
ent/files/sierra_nevada_brewery_2004-10-08_inspection.pdf

Questions?