Embed Size (px)
Citation preview
lable at ScienceDirect
Atmospheric Environment 97 (2014) 182e194
Contents lists avai
Atmospheric Environment
journal homepage: www.elsevier .com/locate/atmosenv
Source contributions to primary and secondary inorganic particulatematter during a severe wintertime PM2.5 pollution episode in Xi'an,China
Dexiang Wang a, Jianlin Hu b, Yong Xu a, Di Lv a, Xiaoyang Xie a, Michael Kleeman b,Jia Xing c, Hongliang Zhang b, d, *, Qi Ying e, **
a College of Forestry, Northwest A&F University, Yangling, Shaanxi 712100, Chinab Department of Civil and Environmental Engineering, University of California, Davis, CA 95616, USAc Atmospheric Modeling and Analysis Division, National Exposure Research Laboratory, US Environmental Protection Agency, Research Triangle Park, NC27711, USAd Department of Civil and Environmental Engineering, Louisiana State University, Baton Rouge, LA 70803, USAe Zachry Department of Civil Engineering, Texas A&M University, College Station, TX 77843, USA
h i g h l i g h t s
� An extremely high PM2.5 concentrations episode in January 2013 was simulated.� Source contributions to primary/secondary inorganic PM in Xi'an were quantified.� Industrial and residential activities are the dominating sources for primary species.� Energy production industries are the major source for secondary nitrate/sulfate.
a r t i c l e i n f o
Article history:Received 31 May 2014Received in revised form8 August 2014Accepted 11 August 2014Available online 11 August 2014
Keywords:Xi'anSource apportionmentParticulate matterWRF/CMAQEDGAR
* Corresponding author. Department of Civil andLouisiana State University, Baton Rouge, LA 70803, US** Corresponding author.
E-mail addresses: [email protected], hlzhangcivil.tamu.edu (Q. Ying).
http://dx.doi.org/10.1016/j.atmosenv.2014.08.0201352-2310/© 2014 Elsevier Ltd. All rights reserved.
a b s t r a c t
Average PM2.5 concentrations of ~250 mg m�3 and peak concentrations of ~500 mg m�3 were observed inXi'an, the largest city in Northwest China during an extreme event in January 2013. The source-orientedversions of the Community Multi-scale Air Quality (CMAQ) model with anthropogenic emissions fromEmissions Database for Global Atmospheric Research (EDGAR) were used to study the source contri-butions of six different source categories including energy production, industries, transportation, resi-dential activities, “other” (agriculture, biomass, waste burning, and biogenic sources), and windblowndust to primary and secondary inorganic PM2.5 (nitrate and sulfate) during this episode. The modelgenerally captured the variation and magnitude of PM2.5 concentrations at monitoring sites. The monthlyaverage concentration of the predicted PM2.5 in Xi'an was >200 mg m�3, comparing favorably with themeasurement of ~250 mg m�3. Predicted concentrations of elemental carbon (EC), organic aerosol (OA),sulfate, nitrate, and ammonium were 6, 35, 18, 22, and 12 mg m�3, respectively. Chemically unresolvedPM2.5 components (PM2.5 Other) were ~80 mg m�3. Industries and residential activities dominated EC,organic carbon (OC) and PM2.5 Other, contributing 85%, 95%, and 83%, respectively. Energy production(mainly coal combustion) was the dominating source for secondary nitrate, contributing 46%. Other localand upwind sources were also important, contributing 43% and 11% of total nitrate, respectively. Primarysulfate was ~10 mg m�3 in vicinity surrounding point sources. Secondary sulfate from upwind sourceswas also important with concentrations of ~4e5 mg m�3. Secondary sulfate formed by SO2 emitted fromlocal sources was dominated by energy production. Based on the contributions of different sources toprimary components and secondary nitrate and sulfate, the contributions of different sources to PM2.5
total mass in Xi'an during the extremely polluted months are: energy 5%, industries 58%, transportation
Environmental Engineering,A.
@lsu.edu (H. Zhang), qying@

D. Wang et al. / Atmospheric Environment 97 (2014) 182e194 183
2%, residential activities 16%, dust 4%, and other (including other components, inexplicit sources, andupwind sources) 15%.
© 2014 Elsevier Ltd. All rights reserved.
1. Introduction
Extremely high levels of airborne particulate matter (PM) inChina have been reported as a result of the rapid economic growthand urbanization without sufficient controls on pollutant emis-sions. Sustained exposure to air pollution causes respiratory dis-eases and significantly reduces life expectancy (Chen et al., 2013;Poschl, 2005). To protect the public health, the Chinese CentralGovernment and Ministry of Environmental Protection (MEP) hastaken urgent actions to set up newair quality standards by adoptingPM2.5 as a new criteria pollutant and formulating the AtmosphericPollution Prevention Action Plan (MEP, 2012a,b). Since early 2013,real time measurements of criteria pollutants including PM2.5 andPM10 in all the large cities have been made available to the public(Hu et al., 2014; Wang et al., 2014). Understanding the formationprocesses and source contributions of PM2.5 pollution in regionswith significantly different economies, terrain and climate is crucialfor developing effective emissions reduction plans. While manystudies have been conducted on this topic, the majority have eitherfocused on the entire East Asia region with relative low spatialresolution (Tang et al., 2004; Wang et al., 2010; Yamaji et al., 2006;Zhang et al., 2012) or the most economically developed areas ofChina such as Beijing and surrounding areas (An et al., 2007; Chenet al., 2007; Streets et al., 2007; Xing et al., 2011), the Yangtze RiverDelta area (Li et al., 2008, 2011; Tie et al., 2009), and the Pearl RiverDelta (Fan et al., 2011; Feng et al., 2007; Wang et al., 2013b; Weiet al., 2012; Wu et al., 2012). Few studies have been conductedfor other parts of China, such as the Central and Western regions.
Xi'an is the Provincial capital of Shaanxi Province and the largestcity in Northwest Chinawith a population of more than 8million. Itis located in the center of the Guanzhong Plain with a topographicbasin surrounded by the Qinling Mountains to the south and theLoess Plateau to the north. High emissions from anthropogenicsources such as coal combustion, transportation and industriescombined with limited ventilation capability in the air basin canlead to elevated concentrations of pollutants in the atmosphere,especially during stagnation events. Windblown dust from theLoess Plateau can significantly aggravate the pollution during pe-riods with higher wind speeds (Wang et al., 2012).
Only a few studies have been carried out to characterize theatmospheric aerosols in Xi'an and the Guanzhong plain area. Sec-ondary inorganic aerosol including sulfate, nitrate, and ammoniumwere shown to account for a significant portion (20e60%) of thetotal PM (Zhang et al., 2002). Local coal combustion and vehicleemissions were identified to be the main sources of carbonaceousparticles (Cao et al., 2009, 2005; Han et al., 2009). However,quantitative contributions of emissions sources to the primary andthe secondary PM components over a regional scale are not avail-able to assist policy makers to formulate efficient control strategies.
An extremely severe air pollution event swept across theNorthern China in January 2013, exposing 0.6 billion people to un-healthy levels of pollution. In Xi'an, maximum hourly PM2.5 con-centrations higher than 700 mg m�3 were observed, with monthlyaverage concentrations measured to be ~250 mg m�3. Quan et al.(2014) found that PBL height in haze days of this month was lowercompared to normal days, leading to an increase in the surfaceaerosol concentrations and higher heterogeneous conversions of
NOx and SO2 from gas to particle phases were observed. Wang et al.(2013a) simulated themonth over BeijingeTianjingeHebei area andpointed out industrial and domestic sources are the major localsources and regional contributions of domestic and agriculturalsources from provinces to the south are also important. Althoughthese two studies provide insights to the formation and sourcescontributing to themainpollutants during this event, there is lack ofunderstanding of the sources that are responsible for the observedhigh PM2.5 concentrations over the Xi'an region.
Source-oriented chemical transport models (CTMs) are able toquantitatively predict regional source contributions to primary andsecondary PM mass and component concentrations by directlytracking the emission, transport, chemical transformation andremoval processes of primary PM and secondary PM precursors fromdifferent emission categories or regions (Berglen et al., 2004;Kleemanand Cass, 2001; Napelenok et al., 2006; Ying and Kleeman, 2006;Zhang et al., 2014b). The Community Multi-scale Air Quality (CMAQ)modelmaintainedbyUSEPA iswidely usedby researchers around theworld due to its open-source framework that easily allows for inclu-sion of user-developed features. Source-oriented versions of theCMAQmodel have been developed and applied to track sources of gasphase species (Zhang et al., 2013; Zhang and Ying, 2011a), secondaryinorganic PM (Zhang et al., 2012), and secondary organic aerosols(SOA) (Zhang and Ying, 2011b) in the United States and East Asia.
Here we apply the source-oriented CMAQ models based onCMAQ v4.7.1 developed in previous studies to determine the sourcecontributions to primary and secondary PM in Xi'an during theJanuary 2013 high PM2.5 episode. Anthropogenic emissionsextracted from a high resolution (0.1� � 0.1�) global emission in-ventory are used as the starting point for the calculation. Theconcentrations of PM and gas species predicted by simulations ofatmospheric transport, chemical reaction, phase change, anddeposition are evaluated against measurements at all availablesurface sites in and around Xi'an. The main sources of primary PMand secondary inorganic PM components over the Xi'an region areidentified. To the best of the authors' knowledge, this is the firststudy of regional PM2.5 source apportionment conducted overNorthwest China. Results from this paper demonstrate the ability ofa state-of-the-science source-oriented CTM to act as a useful tool toinvestigate severe pollution events and provide crucial informationneeded to design effective control strategies.
2. Model description
2.1. Source-oriented CMAQ model
Three sets of simulations were conducted in the present study.The first base case simulation used the unmodified CMAQ model(v4.7.1) (Byun and Schere, 2006). The second simulation used asource-oriented CMAQ model for primary PM source apportion-ment and the third simulation used another modified version ofsource-oriented CMAQ for secondary inorganic PM source appor-tionment. Both source apportionment models are based on theoriginal CMAQ v4.7.1 and use the samemodel options for horizontaland vertical transport, emission, and dry/wet deposition.
The source-oriented version of CMAQ for primary PM wasdesigned to efficiently determine the contributions of many
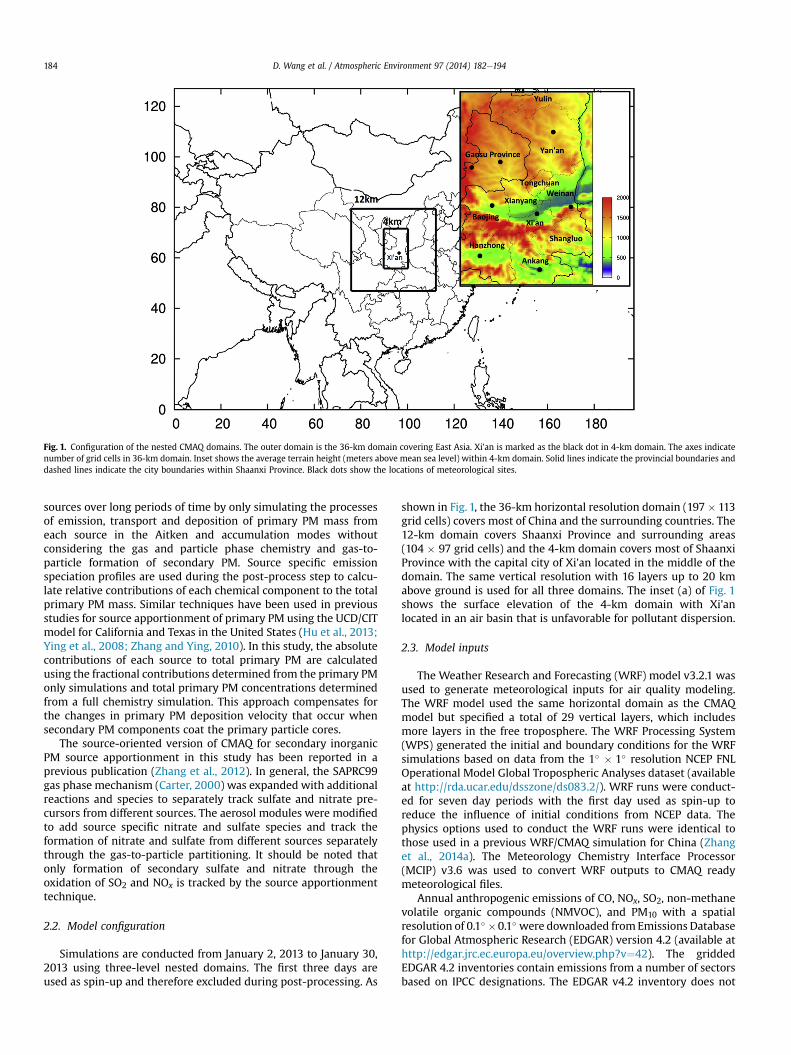
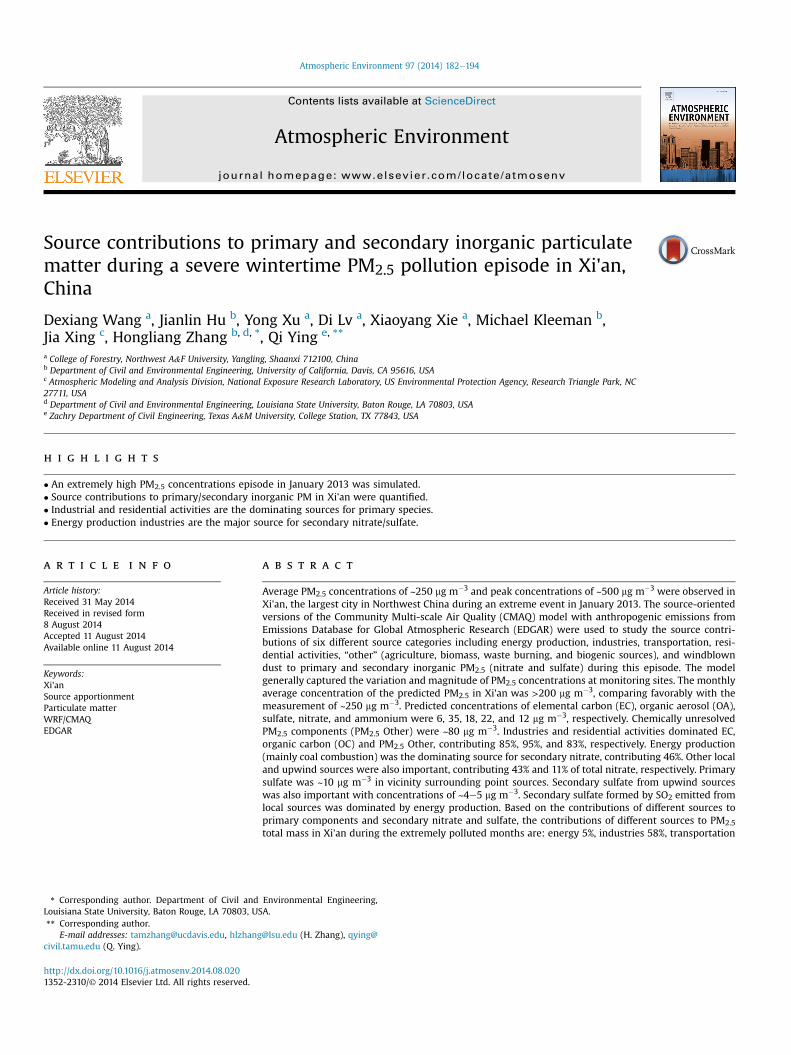
Fig. 1. Configuration of the nested CMAQ domains. The outer domain is the 36-km domain covering East Asia. Xi'an is marked as the black dot in 4-km domain. The axes indicatenumber of grid cells in 36-km domain. Inset shows the average terrain height (meters above mean sea level) within 4-km domain. Solid lines indicate the provincial boundaries anddashed lines indicate the city boundaries within Shaanxi Province. Black dots show the locations of meteorological sites.
D. Wang et al. / Atmospheric Environment 97 (2014) 182e194184
sources over long periods of time by only simulating the processesof emission, transport and deposition of primary PM mass fromeach source in the Aitken and accumulation modes withoutconsidering the gas and particle phase chemistry and gas-to-particle formation of secondary PM. Source specific emissionspeciation profiles are used during the post-process step to calcu-late relative contributions of each chemical component to the totalprimary PM mass. Similar techniques have been used in previousstudies for source apportionment of primary PM using the UCD/CITmodel for California and Texas in the United States (Hu et al., 2013;Ying et al., 2008; Zhang and Ying, 2010). In this study, the absolutecontributions of each source to total primary PM are calculatedusing the fractional contributions determined from the primary PMonly simulations and total primary PM concentrations determinedfrom a full chemistry simulation. This approach compensates forthe changes in primary PM deposition velocity that occur whensecondary PM components coat the primary particle cores.
The source-oriented version of CMAQ for secondary inorganicPM source apportionment in this study has been reported in aprevious publication (Zhang et al., 2012). In general, the SAPRC99gas phase mechanism (Carter, 2000) was expanded with additionalreactions and species to separately track sulfate and nitrate pre-cursors from different sources. The aerosol modules were modifiedto add source specific nitrate and sulfate species and track theformation of nitrate and sulfate from different sources separatelythrough the gas-to-particle partitioning. It should be noted thatonly formation of secondary sulfate and nitrate through theoxidation of SO2 and NOx is tracked by the source apportionmenttechnique.
2.2. Model configuration
Simulations are conducted from January 2, 2013 to January 30,2013 using three-level nested domains. The first three days areused as spin-up and therefore excluded during post-processing. As
shown in Fig. 1, the 36-km horizontal resolution domain (197 � 113grid cells) covers most of China and the surrounding countries. The12-km domain covers Shaanxi Province and surrounding areas(104 � 97 grid cells) and the 4-km domain covers most of ShaanxiProvince with the capital city of Xi'an located in the middle of thedomain. The same vertical resolution with 16 layers up to 20 kmabove ground is used for all three domains. The inset (a) of Fig. 1shows the surface elevation of the 4-km domain with Xi'anlocated in an air basin that is unfavorable for pollutant dispersion.
2.3. Model inputs
The Weather Research and Forecasting (WRF) model v3.2.1 wasused to generate meteorological inputs for air quality modeling.The WRF model used the same horizontal domain as the CMAQmodel but specified a total of 29 vertical layers, which includesmore layers in the free troposphere. The WRF Processing System(WPS) generated the initial and boundary conditions for the WRFsimulations based on data from the 1� � 1� resolution NCEP FNLOperational Model Global Tropospheric Analyses dataset (availableat http://rda.ucar.edu/dsszone/ds083.2/). WRF runs were conduct-ed for seven day periods with the first day used as spin-up toreduce the influence of initial conditions from NCEP data. Thephysics options used to conduct the WRF runs were identical tothose used in a previous WRF/CMAQ simulation for China (Zhanget al., 2014a). The Meteorology Chemistry Interface Processor(MCIP) v3.6 was used to convert WRF outputs to CMAQ readymeteorological files.
Annual anthropogenic emissions of CO, NOx, SO2, non-methanevolatile organic compounds (NMVOC), and PM10 with a spatialresolution of 0.1� �0.1� were downloaded fromEmissions Databasefor Global Atmospheric Research (EDGAR) version 4.2 (available athttp://edgar.jrc.ec.europa.eu/overview.php?v¼42). The griddedEDGAR 4.2 inventories contain emissions from a number of sectorsbased on IPCC designations. The EDGAR v4.2 inventory does not

Table 1Performance statistics of wind speed (WSPD) and wind direction (WDIR) for January2013. Values in parenthesis are suggested benchmarks by Emery et al. (2001).
Variables Statistics
OBS PRE MB GE RMSE
WSPD (m s�1) 2.83 3.01 0.19 (�±0.5) 1.38 (�2.0) 1.85 (�2.0)WDIR (deg) 194.19 177.65 �11.12 (�±10) 49.30 (�±30) 67.83
OBS: mean observation. PRE: mean prediction. MB: mean bias. GE: gross error.RMSE: root mean square error.
D. Wang et al. / Atmospheric Environment 97 (2014) 182e194 185
include PM2.5 emissions yet. PM2.5/PM10 ratios for each sourcecategory were estimated based on Zhang et al. (2007a) and thenapplied to estimated PM2.5 emissions. NMVOC and PM2.5 emissionswere mapped to model species needed by the SAPRC99 photo-chemical mechanism and the AERO5 aerosol module. Representa-tive profiles for each EDGAR source category were taken from theSPECIATE 4.3, a speciation profile data base developed by the USEPA. Tables S1 and S2 show the profiles for NMVOC and PM2.5,respectively, and the corresponding profile numbers in theSPECIATE v4.3 data base. The sectorial EDGAR inventories werethen grouped into five broad source categories: energy, trans-portation, industries, residential activities, and other sources(agriculture, waste, and biomass burning). Details of the EDGARemission sectors and their grouping into the model source cate-gories are included in Table S3 of the Supplementary materials.Fig. S1 shows the emissions of PM2.5 from each grouped source.Speciation was performed before the emissions were lumped intothe five broad source groups. These gridded annual emissions wereremapped to the CMAQmodel grids. An in-house preprocessor wasused to generate hourly emissions based on monthly (Zhang et al.,2007b), weekly (Wang et al., 2010) and diurnal (Olivier et al., 2003)temporal allocation profiles. This temporal allocation approach hasbeen used in a previous CMAQ modeling study for China (Zhanget al., 2012). It should be noted that the resolution of EDGARemissions is coarser than the resolution of the finest domain. Itdoes not change the locations and rates of emissions, but allowsyield more detailed spatial distribution results by taking advantageof the higher resolution of land use, biogenic emissions andmeteorology. This approach has been used by other studies (forexample, Li et al., 2013).
The base year of EDGAR emission is 2008. The number of ve-hicles increased rapidly from ~1.5 million to ~4.1 million (Zhang,2013) between 2008 and 2012 with further increases likely inlater years. This rapid increase by a factor of 2.7 in the number ofvehicles warrants an adjustment of the vehicle emissions as theyare much higher than uncertainties in reported vehicle emissioninventories (Zhao et al., 2011b). Thus, the emission from thetransportation source category at each grid cell is adjusted uni-formly by a factor of 2.7. As higher emission vehicles are phased outand newer (cleaner) vehicles are adopted in China (the Chinesenational emissions standards enacted in 2010 are equivalent toEURO 4), this approach may slightly over-estimate emissions fromon-road vehicles. More accurately estimating the change in thevehicle emissions through emissions testing and roadside moni-toring is beyond the scope of the current study. Emissions fromother source sectors were not adjusted in the EDGAR emissionsinventory. While this static treatment could be a potential source oferror in model results, projected emission inventories might notrepresent actual emissions in 2013 better than the 2008 inventorydue to large uncertainties in the emission activities and the emis-sion factors used in these calculations.
MEGAN v2.04 (Guenther et al., 2006) was used to generatebiogenic emissions driven by WRF meteorology predictions.Windblown dust emissions from soil erosion were generated usingan in-house emission processor as described in Zhang et al. (Zhanget al., 2012). WRF initialization data were used to provide the 16-category soil type distribution and 20-category land use/landcover data. Soil moisture and surface frication velocity from WRFsimulation were used to adjust windblown dust emission.
The initial conditions for air quality simulations for all the threenested domains and the boundary conditions were generated withdefault CMAQ profiles that represent relatively clean troposphericconcentrations. Boundary conditions for the 12-km and 4-km do-mains were generated using CMAQ results from their respectiveparent domains.
2.4. Simulations conducted
Firstly, a simulationwithout any modification to CMAQmodel isconducted to run as a base case, which is used for model validationagainst observations. Then, the source-oriented CMAQ model forprimary particles is applied to determine the fractional contribu-tions of individual EDGAR source sectors to EC, primary OC (POC),and total primary PM2.5 mass. The primary source apportionmentcode is applied in all three nested domains. Although the resultspresented in Section 3 shows contributions to 5 lumped emissionsource groups, the primary source apportionment simulationtracks all EDGAR source sectors separately to calculate the contri-butions from the lumped sources during the post-processing step.Lastly, source apportionment results to secondary nitrate and sul-fate are obtained from the combination of non-source-orientedsimulation for the 36 km resolution domain and source-orientedsimulations for 12 km and 4 km domains. Boundary conditions ofNOx, SO2, nitrate and sulfate entering the 12 km domain, as deter-mined by the 36 km simulation, are tracked separately as ”upwindsources” to differentiate them from the local source categorieswithin the 12-km domain. The reported upwind contributions inthe following discussion are actually contributions from sourcesoutside the 12-km domain.
3. Results and discussion
3.1. Model performance
Observed meteorological data were downloaded from the Na-tional Climatic Data Center (NCDC) (ftp://ftp.ncdc.noaa.gov/pub/data/noaa/). 8 stations with observations every three hours wereavailable for the 4 km domain as shown in inlet (a) of Fig. S1. Onlyone stationwas available near the city center of Xi'an. Table 1 showsthe performance statistics of wind speed (WSPD) and wind direc-tion (WDIR) at 10 m above surface based on the 4 km domain re-sults and all available observations. The statistics include meanobservation (OBS), mean prediction (PRE), mean bias (MB), grosserror (GE), and root mean square error (RMSE). Wind speeds wereas low as 2.83 m s�1 during the episode. The model slightly over-predicts wind speed with a MB of 0.19 m s�1. Performance onwind speed meets the benchmarks suggested by Emery et al.(2001) while the bias for wind direction is slightly larger than thetarget benchmarks. Overall, the model performance is similar toother studies usingWRF (Fast et al., 2006; Misenis and Zhang, 2010;Zhang et al., 2014a).
Observed concentrations of SO2, NO2, PM2.5 and PM10 concen-trations were downloaded from the Xi'an Environmental Moni-toring Center (http://www.xianemc.gov.cn/) to validate the modelsimulation. Locations of the 12 observation sites are shown inFig. S2. It should be noted that all sites are located in dense popu-lation centers to support the goal of broadcasting a relevant airpollution index to the public.

Table 2Mean fractional biases (MFB) of gas and PM species at 12 observation sites in Xi'anwithin the 4 km domain. MFB ¼ ð2=NÞPðPi � OiÞ=ðPi þ OiÞ.
Stations NO2 SO2 PM2.5 PM10
Gaoya �0.90 �0.65 �0.28 �0.22Xingqing �0.61 �0.47 0.12 �0.11Fangzhi �0.81 �0.03 0.05 �0.11Xiaozhai �0.27 �0.46 0.25 �0.17Tiyuchang �0.66 �0.01 0.06 �0.14Gaoxin �0.46 0.04 �0.22 �0.35Jiankai 0.19 0.48 �0.14 0.07Changan 0.07 �0.04 0.15 0.12Yanliang 0.48 0.25 �0.33 �0.26Lintong �1.27 �0.39 �0.35 �0.04Qujiang �0.85 0.45 0.05 �0.08Guangyun �0.79 0.15 �0.22 �0.29
D. Wang et al. / Atmospheric Environment 97 (2014) 182e194186
Fig. 2 shows the comparison of observed and predicted 24-h average PM2.5 concentrations. The observed PM2.5 concentra-tions in January 2013 are extremely high throughout all sites. Themaximum concentrations at Gaoya, Gaoxin, and Jingkai are close toor greater than 500 mg m�3. Concentrations at other sites are lower,with maximum values of ~400 mg m�3. The model generally cap-tures the day-to-day variations of the PM2.5 concentrations at allstations but under-predicts the extreme high concentrations. Un-derestimation of the extreme high concentrations could be due tovarious reasons, including emission inventory uncertainties, coarseresolution of air quality model (1 km or even 250 mmay be neededfor localized high concentrations) (Joe et al., 2014), meteorologyuncertainties, and exclusion of the interactions between meteo-rology and aerosols especially for such an extreme event (Zhanget al., 2014b). Relatively small spatial gradients of PM2.5 were pre-dicted at all sites, with the concentration changes in the 9 grid cellssurrounding each site smaller than 10%. Due to the lack of obser-vations, model performance on PM2.5 components is not validated.A comparisonwith observations during different periods (Cao et al.,2012; Han et al., 2010; Shen et al., 2009, 2011) (see Table S4) showsthat the predicted ratios of EC and nitrate to total PM2.5 concen-trations are within the range of observations. Predicted total OC islower mostly due to the under-prediction of secondary organicaerosol (SOA) and sulfate is lower as well. Since the episodes aredifferent and emissions in Xi'an changed dramatically, we believethe results are acceptable.
A comparison of predicted and observed concentrations of NO2,SO2, and PM10 is shown in Figs. S3eS5 of Supplemental material.Generally, the model reproduces the measured trends of thesespecies with under-prediction of NO2 concentrations. As a sec-ondary product of chemical reactions, NO2 underestimation is
Fig. 2. Predicted and observed 24-h average PM2.5 mass concentrations in Xi'an. Horizontamass in units of mg m�3. Solid lines are predicted concentrations at the exact grid cells wmedian and inner 50% quartile of the concentrations within 3 grid cell by 3 grid cell regio
possibly caused by both emissions and the chemical mechanismused. It has been reported that OH stabilizing processes in China aremissing and oxidation of the atmosphere is underestimated incurrent models (Hofzumahaus et al., 2009). Table 2 summarizes themodel statistical performance for gas and PM species at the 12observation sites using the metric of mean fractional biases (MFB).MFB values of gas phase species vary greatly among stations for thesame species. As the predictions show little spatial gradients nearthe stations, it is likely that some stations are more influenced bynear-by emissions sources whose impact cannot be captured with4 km grid resolution, or some emissions are missing in the EDGARinventory. The numbers of stations with under-predicted and over-predicted SO2 concentrations are comparable. NO2 is under-predicted except at Jingkai, Changan, and Yanliang. MFB values
l axis shows the day of the month, and vertical axis shows the concentrations of PM2.5
here the stations are located. The boxewhisker plot shows the minimum, maximum,ns that surround the observation stations.
D. Wang et al. / Atmospheric Environment 97 (2014) 182e194 187
for PM2.5 and PM10 are all within the model guidance and compa-rable to US values (Boylan and Russell, 2006; Zhang et al., 2014a).
3.2. Regional source contributions to primary PM2.5 components
Fig. 3(a) shows the predicted episode-average concentrations ofPM2.5 total mass and its major components in the 4-km domainsurrounding Xi'an. Monthly averaged wind field is also shown inthe panel. The Guanzhong plain is separated from north and southsides with very low wind speeds at the connection areas, whilepollutants could be transported from the east entrance of the plainby high wind speeds. Monthly PM2.5 concentrations were up to>200 mg m�3 during this severely polluted episode. High PM2.5concentrations occurred in the urban Xi'an area, the industrial areabetween Xi'an and Tongchuan to the north of Xi'an, and along thetransportation corridor from Xi'an to Baoji to the west. Concen-trations in the north area and south area of Shaanxi provincecovered by the 4-km domain were around 40 and 100 mg m�3,respectively. Major industrial activities between Xi'an and Tong-chuan are coal mining, cement production, power generation, andnon-ferrous metal smelting with intensive emissions of primaryPM and precursors for secondary inorganic PM. The highway andrailroad across Shaanxi province from west to east is the busiesttransportation corridor connecting West China and East China (SeeFig. S2).
Predicted elemental carbon (EC) concentrations are 4e5 mg m�3
within the entire Guanzhong plain with the highest concentrationsin the urban Xi'an area as shown in Fig. 3(b). Fig. 3(c) shows theconcentrations of primary organic carbon (POC) which have asimilar spatial pattern as EC but with a maximum concentration of~20 mg m�3. A factor of 1.4/1 was used for the conversion of POA toPOC (Turpin and Lim, 2001). Total organic aerosol (OA) has thesame pattern as POC with concentrations of 25e35 mg m�3 in Xi'anas shown in Fig. 3(d). SOA predicted during January 2013 is small
Fig. 3. Episode averaged concentrations of PM2.5 mass and its major components. (a) also share different.
(with a maximum of less than 2 mg m�3) compared to total OA. SOAconcentrations during extreme events in other places of China havebeen reported (Sun et al., 2014), but it is not clear in Xi'an during tolack of observations. More studies are needed on SOA modeling inChina, but the topic is not covered in this study. Episode averagesulfate concentrations shown in Fig. 3(e) include both primary andsecondary sulfate. The highest predicted concentrations of sulfateare in the urban Xi'an area and the industrial area between Xi'anand Tongchuan. The highest concentrations of ~18 mg m�3 are dueto contributions from significant primary emissions on top of aregional secondary sulfate background. Section 3.3 discusses thesulfate sources in more details. Nitrate and ammonium concen-trations are uniformly distributed in the Guanzhong Plain betweenthe Losses Plateau to the north and the Qingling Mountains to thesouth, with maximum concentrations of 22 and 12 mg m�3,respectively. Fig. 3(h) shows the concentrations of other PM2.5components other than the explicit species (PM2.5 Other), whichare 60e140 mg m�3 in Xi'an area and 30e50 mg m�3 in theGuanzhong Plain.
Fig. 4 shows the predicted source contributions to PM2.5 EC. ECemitted from the energy sector contributes less than 0.1 mg m�3 inurban Xi'an as shown in Fig. 4(a). Industrial sources contribute asmuch as 1.8 mgm�3 of EC near urban Xi'an and the industrial area tothe north, as shown in Fig. 4(b). Contribution of transportation ismore regional in a belt shape from east to west along the Guanz-hong Plain with the highest concentration of 0.45 mg m�3 nearurban Xi'an where traffic density is the highest. Residential activ-ities, such as burning coal and wood for cooking and heating, arethe major contributor to EC with a maximum concentration of4.5 mg m�3 as shown in Fig. 4(d). Fig. 4(e) indicates that windblowndust also contributes ~0.2 mg m�3 to EC in Xi'an area. Fig. 4(f) showsthat other sources including agriculture, biomass fires, and wasteburning are not significant sources of EC in the episode.
ows the monthly averaged surface wind field. Units are mg m�3. The scales of the panels

Fig. 4. Episode averaged contributions to PM2.5 EC. Units are mg m�3. The scales of the panels are different. (Note: Residential category (d) contains contributions from residentialwood combustion. (f) “Other Sources” indicates contribution from inexplicit sources including agriculture, biomass fires, and waste burning as well as upwind sources. The same forFig. 5 and 6.).
D. Wang et al. / Atmospheric Environment 97 (2014) 182e194188
Fig. 5 shows the source types contributing to POC in January2013. The general spatial pattern of POC contributions from eachsource is similar to that of EC. Industries (Fig. 5(b)) and residentialactivities (Fig. 5(d)) are the major sources, contributing to ~4 and12 mg m�3, respectively. Contributions from transportation(Fig. 5(c)), dust (Fig. 5(e)), and other sources (Fig. 5(f)), are~0.5 mg m�3, while contributions from energy production (Fig. 5(a))are very small. Generally, patterns of contributions from varioussource types to other primary components are similar to those of ECand POC since they are tracked together in the model with differentprofiles. As shown in Fig. 6, the highest contributions to primaryPM2.5 “other components” such as crustal material are associatedwith industrial activities (~100 mg m�3), residential activities(~10 mg m�3), windblown dust (12 mg m�3), and “Other” sources(~7 mg m�3).
3.3. Regional source contributions to PM2.5 nitrate and sulfate
Nitrate and sulfate are secondary PM components that accountfor a significant fraction of PM2.5 total mass. Fig. 7 shows theepisode averaged regional contribution that each source categorymakes to PM2.5 nitrate in the 4-km domain. The energy sector is thedominant nitrate source, accounting for ~10 mg m�3. High nitrateconcentrations from energy production are evenly distributed inthe Guanzhong Plain and much lower concentrations are distrib-uted in the valley areas to the south and north. Industrial activitiesmake the second largest contribution to nitrate with concentra-tions of ~3.5 mg m�3 over urban Xi'an area as shown in Fig. 7(b).Transportation and residential activities each contribute >2 mg m�3
to total nitrate. Contributions from other sources including
agriculture, biomass, and waste burning are relatively small asshown in panel (e) of Fig. 7. Fig. 7(f) shows the contributions fromprimary nitrate and nitrate from upwind sources. Primary nitrateconcentrations are very small compared to upwind sources. Thespatial distribution of nitrate in Fig. 7(f) suggests that nitrate fromupwind sources entering the Guanzhong plain from the east is asignificant source of nitrate in Xi'an.
Fig. 8 shows the contributions of different source types tomonthly averaged PM2.5 sulfate in the 4 km domain over Xi'an.Panels 8 (aed) show the concentration of sulfate formed by sec-ondary reactions from SO2 emissions from the indicated sourcecategory. Energy production is the dominant source with acontribution of up to 5 mg m�3 throughout the Guanzhong plainand the southeast boundary of the 4 km domain. The concentra-tions in Northern Shaanxi are ~2 mg m�3 over the Losses Plateau.Spatial distributions of sulfate from industry, transportation, andresidential activities are similar with maximum values of 2, 0.09,and 1 mg m�3, respectively. Panel 8 (f) shows the contributions ofprimary sulfate sources and sulfate sources upwind of the 12 kmdomain to concentrations in the Xi'an region. Primary sulfateconcentrations are isolated in the vicinity of the emissions sourcebut reach peak concentrations of 9e10 mg m�3 above the upwindsignal. Sulfate transported from upwind sources has a muchsmoother regional distribution than primary sulfate indicating thatit formed through the oxidation of SO2 from upwind sources. Theconcentration of the upwind sulfate is 4e5 mg m�3 over the 4 kmdomain. Resolving the primary sulfate contributions from upwindsources and the contribution of each upwind source type or regionrequires further investigation for the design of control strategies.
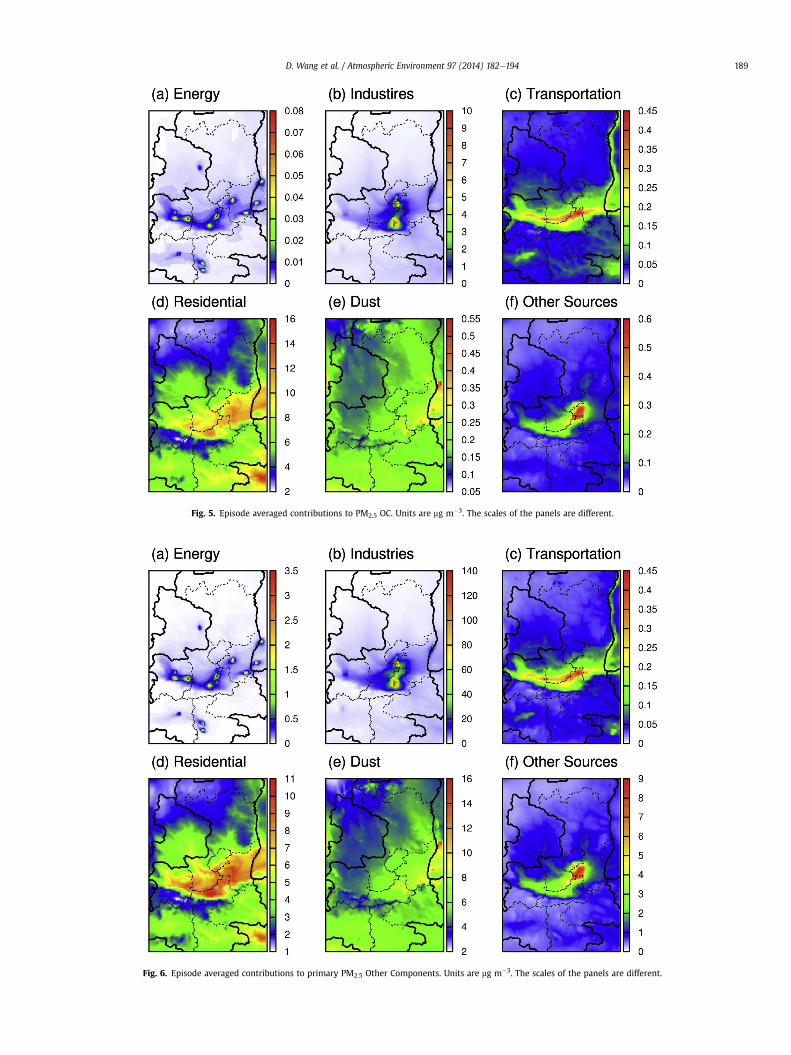
Fig. 5. Episode averaged contributions to PM2.5 OC. Units are mg m�3. The scales of the panels are different.
Fig. 6. Episode averaged contributions to primary PM2.5 Other Components. Units are mg m�3. The scales of the panels are different.
D. Wang et al. / Atmospheric Environment 97 (2014) 182e194 189
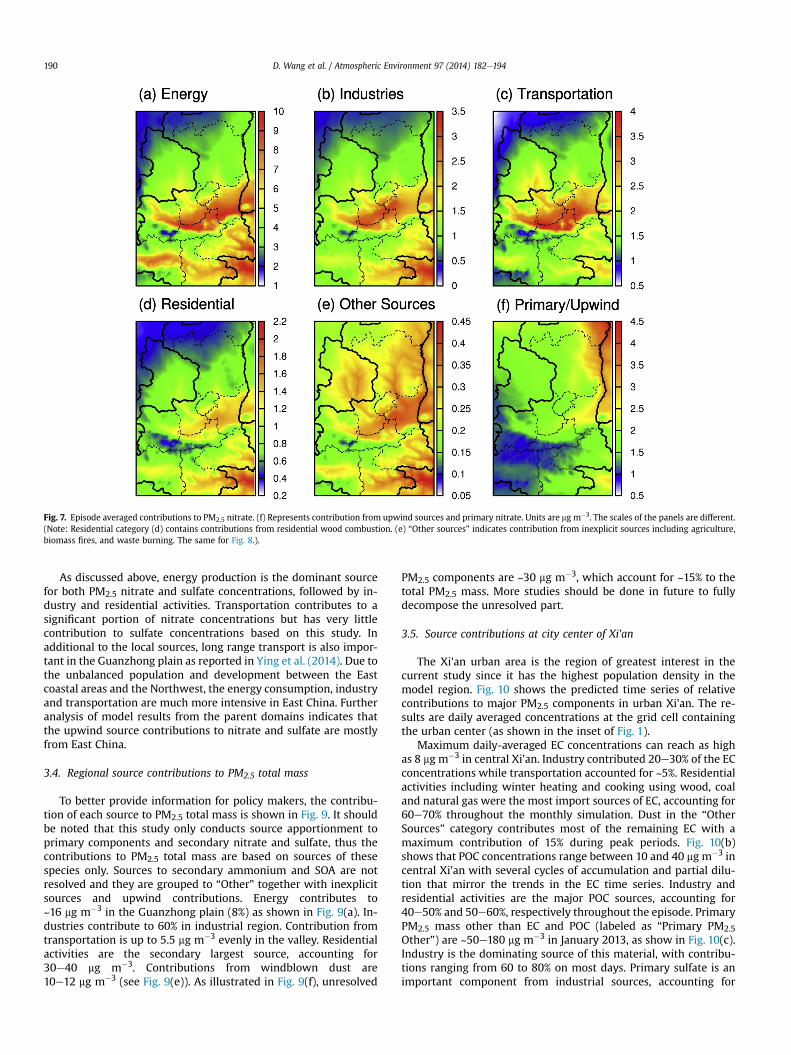
Fig. 7. Episode averaged contributions to PM2.5 nitrate. (f) Represents contribution from upwind sources and primary nitrate. Units are mg m�3. The scales of the panels are different.(Note: Residential category (d) contains contributions from residential wood combustion. (e) “Other sources” indicates contribution from inexplicit sources including agriculture,biomass fires, and waste burning. The same for Fig. 8.).
D. Wang et al. / Atmospheric Environment 97 (2014) 182e194190
As discussed above, energy production is the dominant sourcefor both PM2.5 nitrate and sulfate concentrations, followed by in-dustry and residential activities. Transportation contributes to asignificant portion of nitrate concentrations but has very littlecontribution to sulfate concentrations based on this study. Inadditional to the local sources, long range transport is also impor-tant in the Guanzhong plain as reported in Ying et al. (2014). Due tothe unbalanced population and development between the Eastcoastal areas and the Northwest, the energy consumption, industryand transportation are much more intensive in East China. Furtheranalysis of model results from the parent domains indicates thatthe upwind source contributions to nitrate and sulfate are mostlyfrom East China.
3.4. Regional source contributions to PM2.5 total mass
To better provide information for policy makers, the contribu-tion of each source to PM2.5 total mass is shown in Fig. 9. It shouldbe noted that this study only conducts source apportionment toprimary components and secondary nitrate and sulfate, thus thecontributions to PM2.5 total mass are based on sources of thesespecies only. Sources to secondary ammonium and SOA are notresolved and they are grouped to “Other” together with inexplicitsources and upwind contributions. Energy contributes to~16 mg m�3 in the Guanzhong plain (8%) as shown in Fig. 9(a). In-dustries contribute to 60% in industrial region. Contribution fromtransportation is up to 5.5 mg m�3 evenly in the valley. Residentialactivities are the secondary largest source, accounting for30e40 mg m�3. Contributions from windblown dust are10e12 mg m�3 (see Fig. 9(e)). As illustrated in Fig. 9(f), unresolved
PM2.5 components are ~30 mg m�3, which account for ~15% to thetotal PM2.5 mass. More studies should be done in future to fullydecompose the unresolved part.
3.5. Source contributions at city center of Xi'an
The Xi'an urban area is the region of greatest interest in thecurrent study since it has the highest population density in themodel region. Fig. 10 shows the predicted time series of relativecontributions to major PM2.5 components in urban Xi'an. The re-sults are daily averaged concentrations at the grid cell containingthe urban center (as shown in the inset of Fig. 1).
Maximum daily-averaged EC concentrations can reach as highas 8 mg m�3 in central Xi'an. Industry contributed 20e30% of the ECconcentrations while transportation accounted for ~5%. Residentialactivities including winter heating and cooking using wood, coaland natural gas were the most import sources of EC, accounting for60e70% throughout the monthly simulation. Dust in the “OtherSources” category contributes most of the remaining EC with amaximum contribution of 15% during peak periods. Fig. 10(b)shows that POC concentrations range between 10 and 40 mg m�3 incentral Xi'an with several cycles of accumulation and partial dilu-tion that mirror the trends in the EC time series. Industry andresidential activities are the major POC sources, accounting for40e50% and 50e60%, respectively throughout the episode. PrimaryPM2.5 mass other than EC and POC (labeled as “Primary PM2.5Other”) are ~50e180 mg m�3 in January 2013, as show in Fig. 10(c).Industry is the dominating source of this material, with contribu-tions ranging from 60 to 80% on most days. Primary sulfate is animportant component from industrial sources, accounting for
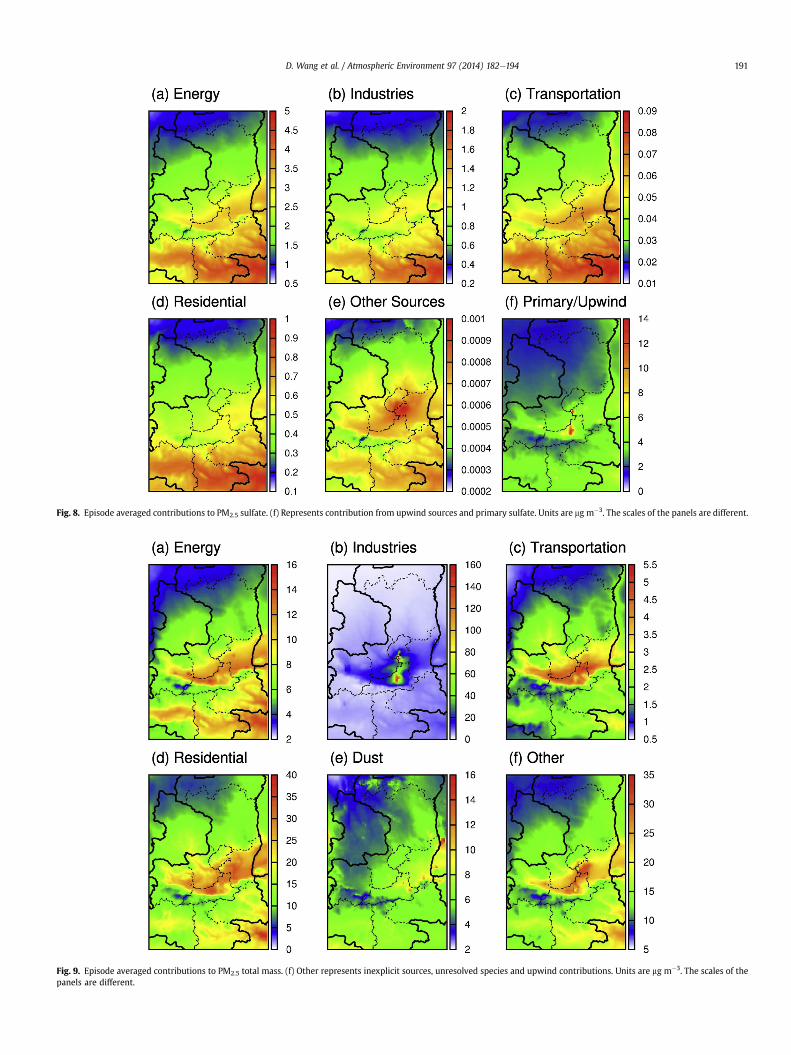
Fig. 8. Episode averaged contributions to PM2.5 sulfate. (f) Represents contribution from upwind sources and primary sulfate. Units are mg m�3. The scales of the panels are different.
Fig. 9. Episode averaged contributions to PM2.5 total mass. (f) Other represents inexplicit sources, unresolved species and upwind contributions. Units are mg m�3. The scales of thepanels are different.
D. Wang et al. / Atmospheric Environment 97 (2014) 182e194 191

Fig. 10. Time series of relative source contributions to EC, primary OC (POC), total primary PM2.5 mass, nitrate and sulfate at city center of Xi'an in January 2013. The black circles arepredicted absolute concentrations of these species. Type “Other sources” indicates contribution from inexplicit sources including agriculture, biomass fires, and waste burning. Type“Other” for EC (a), POC (b), and primary PM2.5 Other (c) represents contributions from dust and upwind while it represents upwind and primary concentrations for nitrate (d) andsulfate (e). For (f) PM2.5 total, “Other Sources” represents dust and inexplicit sources while “Other” represents unresolved species and upwind contributions.
D. Wang et al. / Atmospheric Environment 97 (2014) 182e194192
~6e10% based on the profiles used. The minimum industrialcontribution was ~50% on 20 January and the maximum was ~90%on 15 January and 23 January. Residential activities contribute toabout 10e15% of the “Primary PM2.5 Other” component with lessvariability than the industrial signal. Contributions from dust andupwind sources in the “Other” category to the “Primary PM2.5
Other” component ranged between 10 and 30%.Fig. 10(d) shows the predicted contribution that each source
type makes to daily-averaged nitrate concentrations. Nitrate con-centrations are generally higher in days before 20 January (up to25 mg m�3) than in days after 20 January (less than 15 mg m�3).Energy generation is the most important source with contributionsto nitrate ranging between 40 and 50% on most of the simulateddays. Industrial sources make the second largest contribution,
accounting for 10e20%. Contributions from transportation andresidential activities are similar (5e10% each). Relative contribu-tions from upwind sources in the “Other” group were relative sig-nificant (up to 30%) on days with the lowest absolute nitrateconcentrations but were not important (5e10%) on days with thehighest absolute nitrate concentrations. Predicted concentrationsof sulfate in central Xi'an reached values as high as 20 mg m�3 asshown in Fig. 10(e). Energy production was the largest source ofsulfate, with contributions reaching 20e40%. Industry is the secondlargest source of secondary sulfate followed by residential activ-ities, with a combined total contribution of 10e20% from thesecategories. As mentioned above, primary and upwind sources in“other” group accounted for the majority of sulfate (40e80%).

D. Wang et al. / Atmospheric Environment 97 (2014) 182e194 193
Fig. 10(f) shows the contributions of different sources to PM2.5total mass. Generally, energy production contributes to less than10%. Industries are the dominating sources with contributions from30% to 70%. Transportation contributes only ~3% based on thisstudy. Contributions from residential activities are ~20%throughout the months. Dust and inexplicit sources contribute to5e10% while the unresolved components and upwind contribu-tions contribute to the rest 10e40%.
4. Conclusion
A severe polluted event during the month of January 2013 inprovince of Shaanxi China was simulated using the WRF/CMAQmodeling system with source-oriented techniques to quantify themajor source contributions to primary and secondary PM2.5 com-ponents. To the authors knowledge, this is the first regional sourceapportionment study in Northwest China. Comparison with theobserved gas species, PM2.5 and PM10 shows that the modelingsystem is able to simulate the observed high PM2.5 concentrationsreaching ~500 mg m�3. The major components of PM2.5 includeprimary species such as EC, OC and other chemically unresolvedcomponents, and secondary species such as sulfate and nitrate.
Contributions from each source sector to primary and secondaryinorganic PM2.5 components are key information for designingefficient pollution control strategies. This study finds that industrialand residential activities are the dominating sources for EC, POC,and total PM2.5 mass. Windblown dust is also a significant source tototal PM2.5 mass in Xi'an. Energy production is the dominant sourceof PM2.5 nitrate, with additional contributions from upwind sourceson days with lower absolute concentrations. Primary sulfateemitted from industrial point sources can reach the concentrationsof 10 mg m�3 over localized regions near those sources. Concen-trations of secondary sulfate from upwind sources are 4e5 mg m�3
uniformly in the plain area. The upwind source-identity was notresolved in the current study. Secondary sulfate formed by SO2emitted from local sources dominated by energy production ac-counts for the balance of the total sulfate concentration. Summingup the contributions of different sources to total primary compo-nents and secondary nitrate and sulfate, the generally importanceof sources to PM2.5 total mass are ranked industries > residentialactivities > energy > dust > transportation besides the contribu-tions of other components, inexplicit sources, and upwind sources.
The ability of the WRF/CMAQ model to predict the observedhigh PM2.5 concentrations demonstrates the ability of a state-of-the-science CTM to act as a useful tool to investigate severepollution events and provide crucial information needed to designeffective control strategies. However, uncertainties associated withmodel inputs may affect the predicted source contributions.Emissions in Asia based on top-down method have significantuncertainties (Ohara et al., 2007; Zhang et al., 2009; Zhao et al.,2011a). China specific source profiles are generally not available,leaving large fraction of PM2.5 mass species categorized as “un-known”. Future studies should focus on reducing the uncertaintiesin the emissions inventory and apply China specific data to improvethe model performance and the accuracy of source apportionmentinformation. In addition, measurement-based source apportion-ment studies should also be considered to provide additionalverification of emission inventories and CTM-predicted sourceapportionment results. .
Acknowledgment
This study is supported by the ‘948’ project from the StateForestry Administration of China (grant #2013-4-56). The authorsthank the Texas A&M Supercomputing Facility (http://sc.tamu.edu)
and the Texas Advanced Computing Center (http://www.tacc.utexas.edu/) for providing computing resources.
Appendix A. Supplementary materials
Supplementary materials related to this article can be found athttp://dx.doi.org/10.1016/j.atmosenv.2014.08.020.
References
An, X., Zhu, T., Wang, Z., Li, C., Wang, Y., 2007. A modeling analysis of a heavy airpollution episode occurred in Beijing. Atmos. Chem. Phys. 7, 3101e3114.
Berglen, T.F., Berntsen, T.K., Isaksen, I.S., Sundet, J.K., 2004. A global model of thecoupled sulfur/oxidant chemistry in the troposphere: the sulfur cycle.J. Geophys. Res. 109.
Boylan, J.W., Russell, A.G., 2006. PM and light extinction model performance met-rics, goals, and criteria for three-dimensional air quality models. Atmos. Envi-ron. 40, 4946e4959.
Byun, D., Schere, K.L., 2006. Review of the governing equations, computational al-gorithms, and other components of the models-3 community multiscale airquality (CMAQ) modeling system. Appl. Mech. Rev. 59, 51e77.
Cao, J.-J., Shen, Z.-X., Chow, J.C., Watson, J.G., Lee, S.-C., Tie, X.-X., Ho, K.-F., Wang, G.-H., Han, Y.-M., 2012. Winter and summer PM2.5 chemical compositions infourteen Chinese cities. J. Air Waste Manag. Assoc. 62, 1214e1226.
Cao, J.-J., Zhu, C.-S., Chow, J.C., Watson, J.G., Han, Y.-M., Wang, G.-h., Shen, Z.-x.,An, Z.-S., 2009. Black carbon relationships with emissions and meteorology inXi'an, China. Atmos. Res. 94, 194e202.
Cao, J.J., Wu, F., Chow, J.C., Lee, S.C., Li, Y., Chen, S.W., An, Z.S., Fung, K.K., Watson, J.G.,Zhu, C.S., Liu, S.X., 2005. Characterization and source apportionment of atmo-spheric organic and elemental carbon during fall and winter of 2003 in Xi'an,China. Atmos. Chem. Phys. 5, 3127e3137.
Carter, W.P.L., 2000. Documentation of the SAPRC-99 Chemical Mechanism for VOCReactivity Assessment. Report to the California Air Resources Board. Availableat: http://cert.ucr.edu/~carter/absts.htm#saprc99 http://www.cert.ucr.edu/~carter/reactdat.htm.
Chen, D., Cheng, S., Liu, L., Chen, T., Guo, X., 2007. An integrated MM5-CMAQmodeling approach for assessing trans-boundary PM10 contribution to thehost city of 2008 Olympic summer games e Beijing, China. Atmos. Environ. 41,1237e1250.
Chen, Y., Ebenstein, A., Greenstone, M., Li, H., 2013. Evidence on the impact ofsustained exposure to air pollution on life expectancy from China's Huai Riverpolicy. Proc. Natl. Acad. Sci. 110 (32), 12936e12941. http://dx.doi.org/10.1073/pnas.1300018110.
Emery, C., Tai, E., Yarwood, G., 2001. Enhanced meteorological modeling and per-formance evaluation for two Texas episodes. In: p.b.E., Internatioanl Corp (Ed.),Report to the Texas Natural Resources Conservation Commission (Novato, CA).
Fan, S.J., Fan, Q., Yu, W., Luo, X.Y., Wang, B.M., Song, L.L., Leong, K.L., 2011. Atmo-spheric boundary layer characteristics over the Pearl River Delta, China, duringthe summer of 2006: measurement and model results. Atmos. Chem. Phys. 11,6297e6310.
Fast, J.D., Gustafson, W.I., Easter, R.C., Zaveri, R.A., Barnard, J.C., Chapman, E.G.,Grell, G.A., Peckham, S.E., 2006. Evolution of ozone, particulates, and aerosoldirect radiative forcing in the vicinity of Houston using a fully coupledmeteorology-chemistry-aerosol model. J. Geophys. Res. Atmos. 111.
Feng, Y.R., Wang, A.Y., Xu, X.D., 2007. The influence of tropical cyclone Melor onPM10 concentrations during an aerosol episode over the Pearl River Delta re-gion of China: numerical modeling versus observational analysis. Atmos. En-viron. 41, 4349e4365.
Guenther, A., Karl, T., Harley, P., Wiedinmyer, C., Palmer, P.I., Geron, C., 2006. Esti-mates of global terrestrial isoprene emissions using MEGAN (model of emis-sions of gases and aerosols from nature). Atmos. Chem. Phys. 6, 3181e3210.
Han, Y., Cao, J., Lee, S., Ho, K., An, Z., 2010. Different characteristics of char and sootin the atmosphere and their ratio as an indicator for source identification inXi'an, China. Atmos. Chem. Phys. 10, 595e607.
Han, Y.M., Cao, J.J., Chow, J.C., Watson, J.G., An, Z.S., Liu, S.X., 2009. Elemental carbonin urban soils and road dusts in Xi'an, China and its implication for air pollution.Atmos. Environ. 43, 2464e2470.
Hofzumahaus, A., Rohrer, F., Lu, K., Bohn, B., Brauers, T., Chang, C.-C., Fuchs, H.,Holland, F., Kita, K., Kondo, Y., Li, X., Lou, S., Shao, M., Zeng, L., Wahner, A.,Zhang, Y., 2009. Amplified trace gas removal in the troposphere. Science 324,1702e1704.
Hu, J., Wang, Y., Ying, Q., Zhang, H., 2014. Spatial and temporal variability of PM2.5and PM10 over the North China Plain and the Yangtze River Delta, China. Atmos.Environ. 95, 598e609.
Hu, J., Zhang, H., Chen, S.-H., Ying, Q., Wiedinmyer, C., Vandenberghe, F.,Kleeman, M., 2014. Identifying PM2.5 and PM0.1 sources for epidemiologicalstudies in California. Environ. Sci. Technol. 48 (9), 4980e4990.
Joe, D.K., Zhang, H., DeNero, S.P., Lee, H.-H., Chen, S.-H., McDonald, B.C., Harley, R.A.,Kleeman, M.J., 2014. Implementation of a high-resolution source-orientedWRF/chem model at the port of Oakland. Atmos. Environ. 82, 351e363.
Kleeman, M.J., Cass, G.R., 2001. A 3D Eulerian source-oriented model for an exter-nally mixed aerosol. Environ. Sci. Technol. 35, 4834e4848.

D. Wang et al. / Atmospheric Environment 97 (2014) 182e194194
Li, Li, Chen, Chang-Hong, Huang, Cheng, Huang, Hai-Ying, Li, Zuo-Pan, Fu, Joshua S.,Jang, Carey J., Streets, David G., 2008. Regional air pollution characteristicssimulation of O3 and PM10 over Yangtze River Delta Region. Environ. Sci. 29,237e245.
Li, L., Chen, C.H., Fu, J.S., Huang, C., Streets, D.G., Huang, H.Y., Zhang, G.F., Wang, Y.J.,Jang, C.J., Wang, H.L., Chen, Y.R., Fu, J.M., 2011. Air quality and emissions in theYangtze River Delta, China. Atmos. Chem. Phys. 11, 1621e1639.
Li, N., Fu, T.-M., Cao, J., Lee, S., Huang, X.-F., He, L.-Y., Ho, K.-F., Fu, J.S., Lam, Y.-F., 2013.Sources of secondary organic aerosols in the Pearl River Delta region in fall:contributions from the aqueous reactive uptake of dicarbonyls. Atmos. Environ.76, 200e207.
MEP, 2012a. China National Ambient Air Quality Standards. MEP, Beijing, China.MEP, 2012b. In: Protection, M.o.E. (Ed.), Technical Regulation on Ambient Air
Quality Index (On Trial). MEP, Beijing, China.Misenis, C., Zhang, Y., 2010. An examination of sensitivity of WRF/Chem predictions
to physical parameterizations, horizontal grid spacing, and nesting options.Atmos. Res. 97, 315e334.
Napelenok, S.L., Cohan, D.S., Hu, Y.T., Russell, A.G., 2006. Decoupled direct 3Dsensitivity analysis for particulate matter (DDM-3D/PM). Atmos. Environ. 40,6112e6121.
Ohara, T., Akimoto, H., Kurokawa, J., Horii, N., Yamaji, K., Yan, X., Hayasaka, T., 2007.An Asian emission inventory of anthropogenic emission sources for the period1980e2020. Atmos. Chem. Phys. Discuss. 7, 6843e6902.
Olivier, J., Peters, J., Granier, C., P�etron, G., Müller, J.F., Wallens, S., 2003. Present andFuture Surface Emissions of Atmospheric Compounds.
Poschl, U., 2005. Atmospheric aerosols: composition, transformation, climate andhealth effects. Angew. Chem. Int. Ed. 44, 7520e7540.
Quan, J., Tie, X., Zhang, Q., Liu, Q., Li, X., Gao, Y., Zhao, D., May 2014. Characteristics ofheavy aerosol pollution during the 2012e2013 winter in Beijing, China. Atmos.Environ. 88, 83e89. http://dx.doi.org/10.1016/j.atmosenv.2014.01.058.
Shen, Z., Cao, J., Arimoto, R., Han, Z., Zhang, R., Han, Y., Liu, S., Okuda, T., Nakao, S.,Tanaka, S., 2009. Ionic composition of TSP and PM2.5 during dust storms and airpollution episodes at Xi'an, China. Atmos. Environ. 43, 2911e2918.
Shen, Z., Cao, J., Liu, S., Zhu, C., Wang, X., Zhang, T., Xu, H., Hu, T., 2011. Chemicalcomposition of PM10 and PM2.5 collected at ground level and 100 metersduring a strong winter-time pollution episode in Xi'an, China. J. Air WasteManag. Assoc. 61, 1150e1159.
Streets, D.G., Fu, J.S., Jang, C.J., Hao, J.M., He, K.B., Tang, X.Y., Zhang, Y.H., Wang, Z.F.,Li, Z.P., Zhang, Q., Wang, L.T., Wang, B.Y., Yu, C., 2007. Air quality during the 2008Beijing Olympic Games. Atmos. Environ. 41, 480e492.
Sun, Y., Jiang, Q., Wang, Z., Fu, P., Li, J., Yang, T., Yin, Y., 2014. Investigation of thesources and evolution processes of severe haze pollution in Beijing in January2013. J. Geophys. Res. Atmos. 119, 2014JD021641.
Tang, Y.H., Carmichael, G.R., Seinfeld, J.H., Dabdub, D., Weber, R.J., Huebert, B.,Clarke, A.D., Guazzotti, S.A., Sodeman, D.A., Prather, K.A., Uno, I., Woo, J.H.,Yienger, J.J., Streets, D.G., Quinn, P.K., Johnson, J.E., Song, C.H., Grassian, V.H.,Sandu, A., Talbot, R.W., Dibb, J.E., 2004. Three-dimensional simulations ofinorganic aerosol distributions in East Asia during spring 2001. J. Geophys. Res.Atmos. 109.
Tie, X., Geng, F., Peng, L., Gao, W., Zhao, C., 2009. Measurement and modeling of O3variability in Shanghai, China: application of the WRF-Chem model. Atmos.Environ. 43, 4289e4302.
Turpin, B.J., Lim, H., 2001. Species contributions to PM2.5 mass concentrations:revisiting common assumptions for estimating organic mass. Aerosol Sci.Technol. 35, 602e610.
Wang, G.H., Zhou, B.H., Cheng, C.L., Cao, J.J., Meng, J.J., Li, J.J., Tao, J., Zhang, R.J.,Fu, P.Q., 2012. Impact of Gobi desert dust on aerosol chemistry of Xi'an, inlandChina during spring 2009: differences in composition and size distributionbetween the urban ground surface and the mountain atmosphere. Atmos.Chem. Phys. Discuss. 12, 21355e21397.
Wang, L.T., Wei, Z., Yang, J., Zhang, Y., Zhang, F.F., Su, J., Meng, C.C., Zhang, Q., 2013a.The 2013 severe haze over the southern Hebei, China: model evaluation, sourceapportionment, and policy implications. Atmos. Chem. Phys. Discuss. 13,28395e28451.
Wang, S., Wu, D., Wang, X.-M., Fung, J.C.-H., Yu, J.Z., 2013b. Relative contributions ofsecondary organic aerosol formation from toluene, xylenes, isoprene, andmonoterpenes in Hong Kong and Guangzhou in the Pearl River Delta, China: anemission-based box modeling study. J. Geophys. Res. Atmos. 118, 507e519.http://dx.doi.org/10.1029/2012JD017985.
Wang, X., Liang, X.Z., Jiang, W., Tao, Z., Wang, J.X.L., Liu, H., Han, Z., Liu, S., Zhang, Y.,Grell, G.A., Peckham, S.E., 2010. WRF-Chem simulation of East Asian air quality:sensitivity to temporal and vertical emissions distributions. Atmos. Environ. 44,660e669.
Wang, Y., Ying, Q., Hu, J., Zhang, H., 2014. Spatial and temporal variation of sixcriteria air pollutants in 31 provincial capital cities in China during 2013e2014.Environ. Int. (Revision submitted).
Wei, X., Liu, Q., Lam, K., Wang, T., 2012. Impact of precursor levels and globalwarming on peak ozone concentration in the Pearl River Delta Region of China.Adv. Atmos. Sci. 29, 635e645.
Wu, Q., Wang, Z., Chen, H., Zhou, W., Wenig, M., 2012. An evaluation of air qualitymodeling over the Pearl River Delta during November 2006. Meteorol. Atmos.Phys. 116, 113e132.
Xing, J., Zhang, Y., Wang, S.X., Liu, X.H., Cheng, S.H., Zhang, Q., Chen, Y.S.,Streets, D.G., Jang, C., Hao, J.M., Wang, W.X., 2011. Modeling study on the airquality impacts from emission reductions and atypical meteorological condi-tions during the 2008 Beijing Olympics. Atmos. Environ. 45, 1786e1798.
Yamaji, K., Ohara, T., Uno, I., Tanimoto, H., Kurokawa, J., Akimoto, H., 2006. Analysisof the seasonal variation of ozone in the boundary layer in East Asia using thecommunity multi-scale air quality model: what controls surface ozone levelsover Japan? Atmos. Environ. 40, 1856e1868.
Ying, Q., Kleeman, M.J., 2006. Source contributions to the regional distribution ofsecondary particulate matter in California. Atmos. Environ. 40, 736e752.
Ying, Q., Lu, J., Kaduwela, A., Kleeman, M., 2008. Modeling air quality during theCalifornia regional PM10/PM2.5 Air Quality Study (CPRAQS) using the UCD/CITsource oriented air quality model e part II. Regional source apportionment ofprimary airborne particulate matter. Atmos. Environ. 42, 8967e8978.
Ying, Q., Wu, L., Zhang, H., 2014. Local and inter-regional contributions to PM2.5nitrate and sulfate in China. Atmos. Environ. 94, 582e592.
Zhang, H., Chen, G., Hu, J., Chen, S.-H., Wiedinmyer, C., Kleeman, M., Ying, Q., 2014a.Evaluation of a seven-year air quality simulation using the weather researchand forecasting (WRF)/community multiscale air quality (CMAQ) models in theeastern United States. Sci. Total Environ. 473e474, 275e285.
Zhang, H., DeNero, S.P., Joe, D.K., Lee, H.H., Chen, S.H., Michalakes, J., Kleeman, M.J.,2014b. Development of a source oriented version of the WRF/chem model andits application to the California regional PM10/PM2.5 air quality study. Atmos.Chem. Phys. 14, 485e503.
Zhang, H., Li, J., Ying, Q., Guven, B.B., Olaguer, E.P., 2013. Source apportionment offormaldehyde during TexAQS 2006 using a source-oriented chemical transportmodel. J. Geophys. Res. Atmos. 118, 1525e1535.
Zhang, H., Li, J., Ying, Q., Yu, J.Z., Wu, D., Cheng, Y., He, K., Jiang, J., 2012. Sourceapportionment of PM2.5 nitrate and sulfate in China using a source-orientedchemical transport model. Atmos. Environ. 62, 228e242.
Zhang, H., Ying, Q., 2010. Source apportionment of airborne particulate matter inSoutheast Texas using a source-oriented 3D air quality model. Atmos. Environ.44, 3547e3557.
Zhang, H., Ying, Q., 2011a. Contributions of local and regional sources of NOx toozone concentrations in southeast Texas. Atmos. Environ. 45, 2877e2887.
Zhang, H., Ying, Q., 2011b. Secondary organic aerosol formation and sourceapportionment in southeast Texas. Atmos. Environ. 45, 3217e3227.
Zhang, Q., Streets, D.G., Carmichael, G.R., He, K.B., Huo, H., Kannari, A., Klimont, Z.,Park, I.S., Reddy, S., Fu, J.S., Chen, D., Duan, L., Lei, Y., Wang, L.T., Yao, Z.L., 2009.Asian emissions in 2006 for the NASA INTEX-B mission. Atmos. Chem. Phys. 9,5131e5153.
Zhang, Q., Streets, D.G., He, K., Klimont, Z., 2007a. Major components of China'santhropogenic primary particulate emissions. Environ. Res. Lett. 2, 045027.
Zhang, Q., Streets, D.G., He, K.B., Wang, Y., Richter, A., Burrows, J.P., Uno, I., Jang, C.J.,Chen, D., Yao, Z.L., Lei, Y., 2007b. NOx emission trends for China, 1995e2004: theview from the ground and the view from space. J. Geophys. Res. 112, D22306.
Zhang, X., 2013. Shaanxi Statistical Yearbook. In: S.P.B.o. (Ed.), Statistics. ChinaStatistics Press, Beijing, China.
Zhang, X.Y., Cao, J.J., Li, L.M., Arimoto, R., Cheng, Y., Huebert, B., Wang, D., 2002.Characterization of atmospheric aerosol over XiAn in the south margin of theLoess Plateau, China. Atmos. Environ. 36, 4189e4199.
Zhao, B., Xu, J., Hao, J., 2011a. Impact of energy structure adjustment on air quality: acase study in Beijing, China. Front. Environ. Sci. Eng. China 5, 378e390.
Zhao, Y., Nielsen, C.P., Lei, Y., McElroy, M.B., Hao, J., 2011b. Quantifying the un-certainties of a bottom-up emission inventory of anthropogenic atmosphericpollutants in China. Atmos. Chem. Phys. 11, 2295e2308.