Embed Size (px)
Citation preview

Sound Methods of Breaking Foam Fourth Year Project Report- Engineering Science, Finals Part II, 2007
James Winterburn, Pembroke College
Supervised by Dr P. Martin

ii
FINAL HONOUR SCHOOL OF
ENGINEERING SCIENCE
DECLARATION OF AUTHORSHIP You should complete this certificate. It should be bound into your fourth year project report, immediately after the title page. Three copies of the report should be submitted to the Chairman of Examiners for your Honour School, c/o Clerk of the Schools, Examination Schools, High Street, Oxford. Name (in capitals): JAMES WINTERBURN
College (in capitals): PEMBROKE
Supervisor: DR P.MARTIN
Title of project (in capitals): SOUND METHODS OF BREAKING FOAM Word count: 9571 (Including abstract) Please tick to confirm the following: I am aware of the University’s disciplinary regulations concerning conduct in examinations and, in particular, of the regulations on plagiarism.
The project report I am submitting is entirely my own work except where otherwise indicated.
It has not been submitted, either wholly or substantially, for another Honour School or degree of this University, or for a degree at any other institution.
I have clearly signalled the presence of quoted or paraphrased material and referenced all sources.
I have acknowledged appropriately any assistance I have received in addition to that provided by my supervisor.
I have not sought assistance from any professional agency.
The project report does not exceed 10,000 words plus 40 pages of diagrams, photographs etc.
I agree to retain an electronic version of the work and to make it available on request from the Chair of Examiners should this be required in order to confirm my word count or to check for plagiarism.
Candidate’s signature: …………………………………………….. Date: ………………………..

iii
Acknowledgements:
Thanks to my project supervisor Dr P. Martin for his knowledge and invaluable guidance
throughout the project.
Thanks to Jamie Condliffe for his advice and also sharing transducer pressure
calibrations.
Thanks to Richard Gaskell for information regarding transducer behaviour and electrical
characterisation of resonance.
Thanks to the EPSRC for loan of the Kodak EM high-speed camera.

iv
Abstract: A comprehensive literature review and experimental investigation of foam-ultrasound
interaction is presented. Detergent based foam was subjected to low power ultrasound
at two frequencies, 27.72kHz and 40.00kHz, allowing for any frequency dependency to
be observed. The effects of the two frequencies of ultrasound on foam height, liquid
drainage and collapse behaviour were compared to experiments conducted without
ultrasound. In the case of 40.00kHz ultrasound an increased liquid drainage rate was
observed and, for the first time, a pronounced increase and subsequent peak in mean
liquid holdup was measured experimentally. These observations are shown to be
independent of the initial liquid holdup of the foam. Photographic images of 40.00kHz
ultrasound induced foam collapse provide visual evidence of the increased rate of liquid
drainage and the change in the nature of collapse when ultrasound is involved.
Experimental observations are explained in terms of foam collapse mechanisms
identified in the literature review, and it is concluded that front rupture dominates
collapse for foam under the influence of ultrasound.

v
Contents: 1. Introduction 1 2. Foams 3 2.1 Background 3 2.2 Foam structure 3 2.3 Laplace equilibrium 5 2.4 Surface active agents (Surfactants) 6 2.5 Foam drainage and stability 7
3. Methods of Foam Breaking 10 3.1 Background 10 3.2 Physical foam breaking methods 10 3.3 Chemical defoaming methods 11 4. Ultrasound 12 4.1 Background 12 4.2 Piezoelectric effect 12 4.3 Transducers 14 4.4 Impedance boundaries 17 5. Foam-ultrasound Interaction 19 5.1 Coupling between foam and ultrasound 19 5.2 Mechanisms of film rupture and the influence of ultrasound 21 6. Experimental Technique 24 6.1 Ultrasound generation 24 6.2 Surfactant solution makeup 24 6.3 Method of foam formation and liquid drainage/foam height measurements 25 7. Results 27
7.1 Ultrasonic transducer calibrations 27 7.2 Cumulative liquid drainage 30
7.3 Liquid drainage rate 33 7.4 Foam height 37 7.5 Variation of mean liquid holdup during foam collapse 40
7.6 Images of foam collapse 42 7.7. Foam fraction and ultrasonic foam breaker integration 44 7.8 Experimental errors and reproducibility 45
8. Discussion of Results 46 8.1 Rate of liquid drainage and cumulative global drainage 46 8.2 Mean liquid holdup 47 8.3 Foam collapse 47
9.Project Extensions 50 10. Conclusions 51 Appendix A. Progress report 53 Appendix B. Plastic cup design 56 Appendix C. Ultrasonic transducer pressure calibrations 57 Appendix D. Preliminary ultrasonic bath experiment results 60 Appendix E. Risk Assessment 61 Appendix F. COSHH Assessment 62 Appendix G. References 63

4YP-Sound Methods of Breaking Foam James Winterburn
vi
Nomenclature:
C Capacitance (F)
D Average bubble diameter (mm)
F Frequency (Hz)
I Displacement of crystal faces (mm)
L Inductance (H)
dN Rupture events in time interval dt
N Total number of bubbles
P Pressure (Pa)
q Electrical charge (C)
r Radius of curvature (mm)
R Resistance (electrical) (Ω)
R Reflection coefficient
t Time (min)
T Transmission coefficient
V Voltage (V)
Greek Symbols:
α Dimensionless liquid fraction
ξ Dimensionless vertical position
ρ Density (kgm-3)
τ Dimensionless time
ω Probability of rupture per unit time and unit surface
Subscripts:
b Bubble
l Lamella
pb Plateau border
r Resonant

4YP-Sound Methods of Breaking Foam James Winterburn
1
1.Introduction:
Many practical situations arise in industry where the efficient destruction of foam is
necessary. These foams can either be an undesirable by-product of a particular reaction
or process, or an integral part of a specific unit operation. For instance nuisance foams
can form in aerated vessels, such as chemostats used for the fermentation of sugars to
alcohol using yeast (Perry and Green, 1984). Unwanted foam also occurs in the steam
drum of industrial boilers, this foam must be carefully controlled to prevent priming of
the boiler. Foam Fractionation is an example of a separation process that is used to
purify surface active molecules, such as proteins, through adsorption to the liquid-gas
interfaces in a foam, which is subsequently collapsed after liquid drainage has occurred,
an enriched product being recovered (Perry and Green, 1984).
Although foams are metastable and will eventually collapse, foam breaking, achieved by
chemical or mechanical means, is utilised to reduce the lifetime of the foam. Chemical
defoaming methods involve the use of an antifoam agent, typically silica based, which
work by reducing the stability of the thin liquid films (lamellae) within the foams
structure (Kralchevsky et al, 2002). Hence chemical antifoams also function as foam
inhibitors. Boiler feedwater is dosed with such antifoam agents to prevent foam
formation within the boiler. Mechanical foam breakers, including turbine, vaned disk
and paddle blades, destroy foam by inducing rapid pressure change and applying shear
and compressive forces to the foam leading to bubble rupture. Ultrasound is essentially
a mechanical foam breaking method, albeit one which is not widely used, with a varying
pressure field acting upon the foam. The use of ultrasound in destroying foams is
advantageous as the method is non-invasive and no chemical contaminants have to be
added to the system.
Previous research, Sandor and Stein (1993), Morey et al (1999), Dedhia et al (2003) has
demonstrated that ultrasound increases the rate at which foam collapses. However,
conflicting conclusions as to why this increased collapse rate was observed have been
drawn. Specifically, Dedhia et al (2003) contradict Sandor and Stein (1993) by refuting
the increase in liquid drainage rate from foam subjected to ultrasonic vibrations.
Sandor and Stein (1993) reason that this increase in liquid drainage rate is primarily
responsible for the destruction of foam using ultrasound. The effect of ultrasound on
liquid holdup (volume of liquid per volume of foam) is not discussed in the literature.

4YP-Sound Methods of Breaking Foam James Winterburn
2
Electrical power supplied to the ultrasonic transducer in these papers was of the order
of 25-110 Watts, compared to the 4 Watts used in the author’s experiments. (Supply
voltage was limited to 50v by health and safety constraints). All three studies positioned
the ultrasonic transducer in air a distance of centimetres above the foam. The large
impedance discontinuity between air and the lamellae of the foam means ≈99% of the
energy incident on the foam is reflected with this arrangement.
The aims of this project were to gain an appreciation of previous research concerning
foam destruction using ultrasound in the literature and to determine, for the first time
within Oxford University’s Department of Engineering Science, whether ultrasound has a
repeatable, observable effect on foam at useable power levels. An experimental set-up
was developed through insight gained from preliminary work using an ultrasonic cleaning
bath, in which foam was formed and observed. Consideration was also given to coupling
between the ultrasound (27.72kHz and 40.00kHz) and foam. Height and liquid drainage
were measured for static foam with two different initial liquid holdups, results being
interpreted in terms of the two different rupture mechanisms identified by Monin,
Espert and Colin (2000); Homogeneous rupture and so-called Front rupture.
Several previous fourth year projects have explored foam fractionation as a separation
technique, the process being refined this year to incorporate reflux. One hindrance to
this work is collapsing the foamate efficiently in order to obtain the enriched solution
required to provide reflux for the foam column. At present mechanical, rotary, foam
breakers are used which generate a significant quantity of unwanted stable secondary
foam. An elegant ultrasound based method for collapsing foam would solve the problems
associated with the current inability to completely destroy foam as it exits the
fractionation column.

4YP-Sound Methods of Breaking Foam James Winterburn
3
2.Foams:
2.1 Background:
Foams are an example of minimum surface structures. In fact thin, single soap films
created between a wire frame are surfaces of zero mean curvature and hence of
minimal surface (Weaire and Hutzler, 1999). Interestingly these soap film surfaces are
useful in illustrating solutions to Plateau’s problem, which is concerned with finding a
surface of minimal area that spans a given contour in space.
This project is concerned with aqueous foams. A suitable definition of which is, a two-
phase system in which a large volume fraction of gas is dispersed as bubbles throughout
a continuous liquid matrix (Narsimhan and Wang, 2005 and Weaire and Hutzler, 1999).
To elaborate, these gas bubbles are contained by thin liquid films stabilised by the
presence of some form of surfactant (surface active molecules which preferentially
accumulate at the liquid-gas interface). These films are interconnected at their meeting
points via Plateau borders, forming a continuous liquid phase throughout the structure.
Foam stability is governed by drainage properties and coarsening (also referred to as
Otswald ripening). In certain circumstances foam will undergo topological
transformation to attain a state of lower surface energy, dissipating the excess energy
as heat.
2. 2 Foam structure:
Figure 2.2.1 illustrates a typical foam structure.
Fig 2.2.1- Foam Structure.
Gas phase Liquid phase
Plateau border
Vertex

4YP-Sound Methods of Breaking Foam James Winterburn
4
The structure of particular foam varies depending on the liquid fraction the foam
contains. Wet foam consists of approximately spherical bubbles, separated by thick
liquid films. In the limit of perfectly spherical, close packed (cubic or hexagonal) gas
bubbles, the gas fraction in the foam is ≈0.74. This results from the geometry of the
foam and is mathematically stated by Keplers Conjecture, this problem being studied by
mathematician Carl Gauss. In dry foam polyhedral gas cells are separated by thin liquid
films named ‘lamellae’. These lamellae intersect to form Plateau borders at angles of
120˚. The 120˚ angle is a consequence of the required equilibrium of forces acting at
the intersection due to surface tension of the lamellae. Connections between Plateau
borders and adjacent liquid films are smooth.

4YP-Sound Methods of Breaking Foam James Winterburn
5
2.3 Laplace equilibrium
The local equilibrium of a gas-liquid interface is governed by the Laplace equation. The
Laplace equation relates the pressure difference across the interface to its surface
tension. Equation 2.1 results from a force balance on the spherical bubble shown below
figure 2.3.1:
P - Pressure outside gas bubble
Pb – Bubble pressure
r - Radius of curvature
Fig 2.3.1 Gas Bubble
This relationship shows us that at constant P (i.e. at atmospheric conditions) Pb
increases as bubble radius decreases. Laplace’s law can be used to explain the drainage
of liquid from the lamellae into Plateau borders, from which the interstitial liquid flows
down through the interconnected Plateau border network under the influence of gravity.
Also the higher internal (Laplace) pressure of bubbles with small radii provides a driving
force for the diffusion of gas through the lamellae into larger radii bubbles. This gas
diffusion results in the average bubble radius of a particular foam sample increasing with
time, an effect called Otswald ripening or coarsening (Lim and Barigou, 2005). The gas
diffusion process is slow compared to other foam collapse mechanisms, with bubble size
actually increasing as time raised to the power half, t1/2, (Monin et al, 2000). There is no
change in the total quantity of gas entrained in the foam as coarsening occurs.
The Laplace equation does have limitations, for example problems can occur if viscous
drag effects have to be accounted for, i.e. when subjecting foams to shear forces (Marze
et al, 2005).
(2.1) r
PPbγ4=−

4YP-Sound Methods of Breaking Foam James Winterburn
6
2.4 Surface active agents (Surfactants):
Surfactants are molecules that are amphiphilic, meaning they posses a hydrophilic
‘head’ and a hydrophobic ‘tail’ (Weaire and Hutzler, 1999). When present in foams
surfactant molecules align themselves across the lamellae (see figure 2.4.1), satisfying
both ends of the molecule, whilst improving the stability of the film by a variety of
mechanisms, including lowering its surface tension (Barigou and Davidson, 1994).
Fig 2.4.1 – Surfactant molecule accumulation at a liquid air interface. Surfactants commonly utilised in foam generation include detergent, sodium dodecyl
sulphate (SDS), whey protein, bovine serum albumin and triton-X-100 (Dedhia et al,
2004, McDaniel and Holt, 2000 and Barigou and Davidson 1994). Figure 2.4.2 shows the
chemical formulae and molecular structures (Note the long hydrocarbon ‘tails’) of SDS
and Trition-X-100.
SDS: C12H25NaO4S
Triton-X-100: C14H22O(C2H4O)n
Polyethylene oxide hydrophilic group, naverage =9.5.
Fig 2.4.2 – Chemical composition and molecular structure of Surfactants. There is a limit to the number of surfactant molecules that can be adsorbed to the
liquid-gas interface before its surface becomes fully saturated. The concentration of
surfactant at which this occurs is termed the Critical Micelle Concentration (CMC).
Assuming the surfactant causes a reduction in film surface tension then the surface
tension of the liquid film is at a minimum at this point. Figure 2.4.3 shows the general
relationship between surfactant concentration and film surface tension, γ.

4YP-Sound Methods of Breaking Foam James Winterburn
7
Fig.2.4.3 – Surface tension vs. surfactant concentration.
The mechanisms by which surfactants stabilise thin liquid films, such as those in
existence in foams, are named the Marangoni effects. These effects are best understood
by considering the relationship between surfactant concentration and surface tension of
a single liquid film. Local thermal and mechanical perturbations cause local thinning of
the liquid film, potentially leading to rupture. At this local thinning the liquid-gas
interface is depleted of surfactant molecules, creating a surfactant concentration
gradient and hence an opposing surface tension gradient. This surface tension gradient
draws the film together, preventing rupture (Perry and Green, 1984). Marangoni effects
also resist liquid drainage from lamellae, reducing instability. Long surfactant
molecules, such as bovine proteins, provide extra stability as they can entangle and
form a physical network across the liquid film, providing a physical resistance to liquid
drainage and hence thinning.
2.5 Foam drainage and stability:
Foam is a thermodynamically unstable material, as foam generation actually results in
an increase of the Gibbs free energy of the system (Narsimhan and Wang, 2005). Thus it
is expected that foam of any composition will collapse given sufficient time.
Individual gas bubbles within a foam burst when their lamellae reach a critical thickness
(Sandor and Stein, 1993), the actual rupture of the film often being caused by thermal
perturbations. Lamellae reduce in thickness as liquid drains from them into the Plateau
borders. Liquid flows through the interconnected Plateau border network under the
influence of gravity so that the total liquid fraction present in the foam per unit volume
(liquid holdup) reduces with time.

4YP-Sound Methods of Breaking Foam James Winterburn
8
This drainage process from lamella to Plateau border can be understood by considering
the Laplace equilibrium law, equation 2.1, at the lamella and at the Plateau border.
This is shown in figure 2.5.1.
Pb – Bubble pressure
Pl – Pressure in lamella
Ppb – Pressure in Plateau border
rl - Radius of curvature at lamella
rpb – Radius of curvature at plateau border
pblpblb PPrrr
PP >∴<⇒=− γ4
Fig 2.5.1 – Intersection of lamellae at a Plateau border. Laplace’s law shows that as radius of curvature reduces the pressure increases. As the
radius of curvature of the lamella is much less than that of the Plateau border the
pressure in the lamella is much greater than that in the Plateau border. The
consequence of this pressure difference is a driving force, attempting to equalise the
pressure difference, which acts on liquid in the lamella, causing it to drain into the
Plateau border. This is known as Plateau border suction (Narsimhan and Wang, 2005).
(2.1)
Lamella
Plateau border

4YP-Sound Methods of Breaking Foam James Winterburn
9
The drainage equation, equation 2.2, (Weaire and Hutzler, 1999) provides a
hydrodynamic model of liquid drainage and is used to describe the variation of liquid
fraction of a foam as a function of position and time. The equation assumes Plateau
borders are randomly orientated and that liquid holdup is comprised of some
incompressible fluid (Monin et al, 2000). The second order term, which represents
capillary effects, can be neglected until α = 10-5.
0)2
( 2 =∂∂−
∂∂+
∂∂
ξααα
ξτα
α – Dimensionless liquid fraction
ξ – Dimensionless vertical position
τ – Dimensionless time
(2.2)

4YP-Sound Methods of Breaking Foam James Winterburn
10
3. Methods of Foam Breaking: 3.1 Background:
Many practical situations arise where the efficient destruction or inhibition of foam is
necessary. These range from the destruction of foam to recover surface active species
purified via foam fractionation, control of foam generated in aerated vessels such as
fermenters to foam prevention in industrial steam boilers to prevent priming. Currently
used defoaming techniques can be broadly separated into two categories; physical and
chemical (Perry and Green, 1984). Common physical foam breaking methods involve
mechanically transferring stress to the foam through some blade/paddle contacting
process. Chemical defoaming methods involve the use of an antifoam agent, which can
also function as a foam inhibitor, depending on where in a process it is introduced.
3.2 Physical foam breaking methods:
Different types of mechanical foam breakers, turbine, vaned disk and paddle blades, are
shown in figure 3.2.1 (Takesono et al, 2002). These foam breakers destroy foam by
inducing rapid pressure change and applying shear and compressive forces to the foam,
leading to bubble rupture (Takesono et al, 2002). The use of mechanical foam brakers is
more economical than chemical means as no expensive consumable antifoam agents are
required. One significant draw back of traditional mechanical foam breakers is that their
use results in the generation of stable secondary foam, a persistent, wet (high liquid
holdup) foam consisting of gas bubbles that are significantly smaller than those of the
primary foam (Gutwald and Mersmann, 1997).
Fig 3.2.1- Mechanical foam breakers; a) six bladed turbine b) six bladed vaned disk c)
two bladed paddle.

4YP-Sound Methods of Breaking Foam James Winterburn
11
Ultrasound is essentially a mechanical foam breaking method, albeit one which is not
used industrially, with a varying pressure field acting upon the foam. The use of
ultrasound in destroying foams is advantageous as the method is non-invasive, doesn’t
result in chemical contamination and is potentially easy to integrate into existing
processes.
3.3 Chemical defoaming methods:
Chemical antifoams typically consist of solid, hydrophobic filler particles dispersed in a
silicone or hydrocarbon based oil that acts as a carrier (Kukarni et al, 1977). Although
these oil and filler antifoam compounds are most efficient at destroying foams in certain
circumstances either component can be used singularly. Hydrophobic Silica is commonly
used as a filler at around 2-8 wt% (Kralchevsky et al, 2002). Discussion here is limited to
the effect of antifoam compounds as in most cases these are most effective and provide
a suitable benchmark to compare to mechanical foam breaking methods. Compound
antifoams collapse foam by causing rupture of the lamellae (Kralchevsky et al, 2002).
Lamellae rupture occurs as the hydrophobic filler particles effectively replace surface
active molecules accumulated at the gas-liquid interface of the lamellae. This
displacement of lamellae stabilising surface active molecules by the antifoam creates
surface tension gradients disrupting the mechanical Laplace equilibrium, rupturing the
foam bubble. Although both mechanical and chemical methods are invasive, chemical
methods involve contamination with additional chemical species, meaning product
purity and separation issues can be encountered.

4YP-Sound Methods of Breaking Foam James Winterburn
12
4. Ultrasound: 4.1 Background:
The highest frequency that the human ear can detect is, on average (as there are slight
variations from person to person and between age groups), 20kHz (Howard and Angus,
2006). Any sound generated above this upper limit is referred to as ultrasound.
Ultrasound has a wide range of applications including medical imaging, sonar, non-
destructive materials testing, foam generation and foam destruction (Ensminger and
Dekler, 1973, Lim and Barigou, 2005 and Sandor and Stein 1993). Ultrasound is
generated using a piezoelectric material that is typically incorporated into an ultrasonic
transducer, driven by a signal generator.
4.2 Piezoelectric effect:
The piezoelectric effect occurs in crystalline solids with unit cells that do not have a
centre of symmetry and was first demonstrated by the Curie brothers in 1880 (Blitz,
1956). Piezoelectric materials commonly used in ultrasonic transducers are Lead
Zirconate Titanate and Barium Titanate; these are both ceramics (Channel Industries,
1999). When a piezoelectric material is subjected to a mechanical strain it will produce
an electrical charge. Of more relevance to the generation of ultrasound is the reverse
effect, the occurrence of mechanical strain when an electrical field is applied to the
material (achieved by inducing equal and opposite charges on a pair of plane faces).
Figure 4.2.1 shows the charge developed on opposing plane faces of a piezoelectric
material when subjected to various stresses (Blitz, 1956).

4YP-Sound Methods of Breaking Foam James Winterburn
13
Fig 4.2.1 – Piezoelectric effect for different orientations of applied force.
The piezoelectric effect is quantified using the d coefficient (Blitz, 1956) measured in
CN-1 or Vm-1, equation 4.1:
F
qd =
I
Vd =
q – Value of total charge flowing
F – Applied force producing stress
V – Voltage applied across plane faces
I – Displacement of crystal faces
The ceramic materials mentioned previously must be subjected to an operation referred
to as ‘poling’ before they exhibit piezoelectric properties (www.channelindustries.com).
This is due to the fact that in their natural state ceramic materials are isotropic and not
polarised. The poling operation involves subjecting the material to a temporary static
electric field that aligns the Weiss domains (locally aligned dipoles within the material)
in the crystal structure. The result of this operation is that the material retains some
polarisation and will now show piezoelectric properties.
(4.1)

4YP-Sound Methods of Breaking Foam James Winterburn
14
4.3 Transducers:
A transducer is a device that converts one form of energy to another. In the case of
ultrasonic transducers electrical energy is converted to mechanical energy. A common
ultrasonic transducer design is the langevin-sandwich, which consists of active
piezoelectric elements sandwiched between two metal masses (Blitz, 1956 and
Ensminger and Dekler, 1973). A common configuration is shown in figure 4.3.1.
Fig 4.3.1 - Typical Transducer Design.
Several aspects of this transducer design make it advantageous. Firstly the metal masses
lower the fundamental resonant frequency as well as acting as electrodes. This means
transducers can be designed (i.e. masses chosen to enhance resonance, in terms of
increasing the mechanical ‘Q’ factor of the arrangement) to achieve resonance at a
particular frequency of interest. Secondly the masses also act as a heat sink. This is vital
as the piezoelectric elements cannot be allowed to reach the Curie temperature, the
temperature at which the piezoelectric effect vanishes (Blitz, 1956).
Piezoelectric elements
Metal mass
Horn
Metal contact

4YP-Sound Methods of Breaking Foam James Winterburn
15
The electromechanical properties of a transducer can be represented the equivalent
circuit shown below in figure 4.3.2. The parallel capacitance can be chosen to increase
the electrical ‘Q’ or change the resonant frequency at the expense of a high ‘Q’, the
latter procedure being referred to as ‘pulling’ the resonant frequency of the
piezoelectric crystal.
Ca – Equivalent capacitance of mechanical circuit
L – Equivalent inductance of mechanical circuit
R – Represents mechanical losses and also acoustic power dissipated
Cb – Electrical capacitance as described above
Fig 4.3.2 – Transducer equivalent electrical circuit (for frequencies around the first
resonant peak) (Morgan Electroceramics).
The values of the components in the equivalent circuit can be determined by considering
the resonant equivalent circuit and from a plot of impedance against frequency
(determined experimentally by measuring the voltage drop across the transducer and
current supplied, allowing impedance to be calculated, whilst sweeping the supply
frequency). A typical characteristic plot is shown below in figure 4.3.3.
Fig 4.3.3 – Typical Impedance vs. Frequency plot for an ultrasonic transducer (Morgan
Electroceramics).

4YP-Sound Methods of Breaking Foam James Winterburn
16
The characteristic plot shows that at resonance (frequency Fr) the impedance of the
system is at a minimum. Electrical resonance can be defined as a state when the energy
stored by both capacitive and inductive elements is equal, hence allowing energy to
‘shuttle’ between these components (McKenzie Smith et al, 2002). For a parallel
resonant circuit such as that shown in fig 4.3.2 the network resonates when V and I are
in phase leading to equation 4.2:
2
21
2
1
L
R
LCF
a
r −=π
However as impedance is at a minimum at Fr the following approximation can be made,
yielding equation 4.3:
a
r
a LCF
LCL
R 1
2
112
2
π≈⇒<<
As Ca is determined by the geometry and material properties of the piezoelectric
element the above equation allows L to be calculated. The effect of the electrical
capacitance, Cb, is to introduce a second resonant peak at frequency, Fa, that occurs at
a maximum impedance. Equation 4.4 relates equivalent circuit parameters to frequency
at this point:
ba
baa
CLC
CCF
+=
π21
(4.2)
(4.3)
(4.4)

4YP-Sound Methods of Breaking Foam James Winterburn
17
The signal chain for driving an ultrasonic transducer is illustrated in figure 4.3.4. A signal
generator provides an oscillating signal which is amplified to the voltage required to
drive the transducer. The drive circuit tunes the transducers resonance to improve the
‘Q’ factor and also contains a resistive element to ensure the output impedance of the
drive circuit is matched to the transducers impedance at resonance, maximising power
transfer.
Fig 4.3.4 – Block diagram of ultrasonic transducer arrangement.
4.4 Impedance boundaries:
The effect of an ultrasonic transducer is to create pressure variations in the surrounding
medium that vary with time, causing wave propagation. The wave equation, equation
4.5, (Howatson et al, 1991) is used to mathematically describe wave propagation (3-D):
uc
t
u 22
2
2
∇=∂∂
The travelling wave solution to the wave equation in 1-D is given by equation 4.6:
)(),( kxtjAetxy −= ω
As the ultrasound wave travels through a lossy medium it is attenuated due to viscous
damping. If a travelling wave is incident on an impedance boundary a proportion of the
wave’s energy will be reflected from the discontinuity and the rest transmitted to the
second medium. The impedance a material presents to the propagation of sound waves
is named ‘specific acoustical impedance’, analogous to electrical impedance, and is
defined as the ratio of acoustic pressure to velocity (of the sound wave), equation 4.7
(Blitz, 1956).
u
PZ a =
(4.5)
(4.6)
(4.7)
Signal Generator
Amplifier Drive Circuit
Transducer

4YP-Sound Methods of Breaking Foam James Winterburn
18
The effect of an impedance boundary on a plane travelling wave (of the form described
above) with normal incidence can be quantified by the coefficients of reflection and
transmission. Figure 4.4.1 illustrates the arrangement of a plane wave incident upon an
impedance boundary.
Fig.4.4.1-Impedance boundary and incident, reflected and transmitted waves. The transmission, T, and reflection, R, coefficients are defined below, equations 4.8 and
4.9 respectively (Brady, 2004):
221
21
)(
4
ZZ
Z
I
TT
+=
′=
221
221
)(
)(
ZZ
ZZ
I
RR
+−=
′=
Obviously the wave is continuous across the boundary; the incident and transmitted
waves are always in phase whereas a phase change can occur between the incident and
reflected waves.
(4.8)
(4.9)

4YP-Sound Methods of Breaking Foam James Winterburn
19
5. Foam-ultrasound interaction: 5.1 Coupling between foam and ultrasound:
Coupling from the medium that ultrasound is travelling to another is most efficient when
there is no discontinuity in acoustical impedance (see equation 4.7) (Blitz, 1956). This is
a distinct problem when foam is considered, as, in a simplistic sense, foam is a series of
air/water boundaries. Taking typical values for the specific acoustical impedance of air
(430 kgm-2s-1) and water (1.5 x 10⁶ kgm-2s-1) (Blitz, 1956) and considering a plane wave at
normal incidence to the air/water boundary the reflection coefficient is found from
equation 4.9:
9989.0)430105.1(
)430105.1(
)(
)('26
26
221
221 ≈
+×−×=
+−==ZZ
ZZ
I
RR
This extremely large reflection coefficient means that ≈99% of ultrasound incident on a
foam will simply reflect from the foam surface and not interact with the foam in any
significant manner. This leads to the expectation that ultrasound will not propagate very
far into the bulk of a foam due to reflection from impedance boundaries. Attenuation of
the travelling wave will further limit the depth of propagation.
Experiments conducted by Sandor and Stein (1993) and Morey et al (1999) both utilise
similar apparatus; an ultrasonic transducer (20kHz) positioned axially, above a column
containing foam which is generated in situ. A distance of the order of centimetres is
kept between the vibrating surface of the transducer and the top surface of the foam.
The apparatus used by Morey et al (1999) is shown in figure 5.1.1 (no diagram was
provided by Sandor and Stein (1993)). With this setup the high reflection coefficient due
to the impedance discontinuity makes it difficult to determine the energy transferred to
the foam by the ultrasound. Only qualitative conclusions such as those made by Sandor
and Stein about the dependence of foam stability on electrical power delivered to the
transducer can be drawn. Nothing can be said about the energy required to actually
collapse the foam itself. This is an experimental problem that requires rectification to
allow further insight into foam collapse stimulated by ultrasound to be gained.
(4.9)

4YP-Sound Methods of Breaking Foam James Winterburn
20
Fig 5.1.1-Experimental Apparatus used by Morey et al.
Unfortunately it is not clear from previous research how ultrasound interacts with the
continuous liquid phase in the foam. Only Dedhia et al (2003) draw attention to the issue
of the large reflection coefficient at the air/foam boundary. Again Dedhia et al (2003)
use 20kHz ultrasound, lower than either of the two frequencies used here, and two
transducer arrangements, one in intimate contact with the foam, the other at a distance
of 0.5 cm above the foam. Dedhia et al (2003) note that the collapse rate decreases as
distance from the foam surface is increased. This observation is consistent with the
understanding that attenuation occurs as the ultrasound waves propagate in a lossy
medium (Brady, 2004). Bearing previous work in mind it seems prudent to design
apparatus with the ultrasonic transducer axially aligned with a foam column of
comparable diameter to the diameter of the transducer face, but underneath the foam
in a similar arrangement to that of an ultrasonic bath. It is intended that this setup will
maximise the fraction of total foam volume that is influenced by the ultrasound and
minimise the amount of reflection occurring.

4YP-Sound Methods of Breaking Foam James Winterburn
21
5.2 Mechanisms of film rupture and the influence of ultrasound:
Once the issue of coupling between foam and ultrasound is negotiated, the actual
mechanisms by which ultrasound destroys foam require consideration. Various
ultrasound enhanced rupture mechanisms are suggested in the literature, although it is
not apparent which mechanism best describes the actual collapse process. It is desirable
to obtain experimental results that allow for differentiation between these possible
rupture mechanisms.
Sandor and Stein (1993) propose that ultrasonic vibrations cause surface waves to
develop in the lamellae within the foam structure, postulating that these waves will be
of “squeezing” mode type, causing accelerated film drainage and leading to the liquid
films reaching their critical thickness in a shorter time period, hence increasing the
foam collapse rate. This postulate is referenced in the works of Morey et al (1999) and
Dedhia et al (2003). It is important to distinguish between local drainage, which
ultrasound has a direct influence on, and global drainage, the drainage of interstitial
liquid from the bulk of the foam (observable as the reduction in average liquid holdup
with respect to time). It is expected that liquid released by the rupture of lamellae will
first taken up by the surrounding Plateau borders rather than directly draining into the
bulk of the surfactant solution. This accounts for the questions raised concerning the
validity of Sandor and Stein’s model raised by Dedhia et al (2003) who recorded global
liquid drainage via a manometer, measuring changes in static head with respect to time.
Little change in global drainage was noted by Dedhia et al (2003) when the foam was
subjected to ultrasound. Care must be taken when trying to measure foam drainage via
pressure readings as the practicality and accuracy of manometer use in an environment
with pressure gradients, due to the presence of ultrasound, is limited.

4YP-Sound Methods of Breaking Foam James Winterburn
22
The work of Monin et al (2000) pertains directly to foam collapse (without the influence
of ultrasound). Two distinct rupture mechanisms are identified; Homogeneous Rupture
and Front Rupture. Homogeneous rupture refers to breaking of lamellae independent of
position within the foam and hydrodynamic conditions. This process can be thought of as
probabilistic and quantified in terms of a probability of lamellae rupture per unit time
and unit surface, equation 5.1.
dtNDdN ωπ 2
2
1=
dN – Rupture events in time interval dt
N – Total number of bubbles
D - Average bubble diameter
ω – Probability of rupture per unit time and unit surface
As this process is independent of hydrodynamic conditions it is expected that ultrasound
will not influence the homogeneous rupture of foam.
Front Rupture describes bubble collapse that occurs when lamellae reach a critical
thickness. Films reach critical thickness after a certain amount of drainage has taken
place (dependent on bubble diameter, the presence of surfactant(s) and lamellae
viscosity). As global drainage progresses liquid holdup will reduce at the top or front of a
foam first; hence a rupture front exists and, in the case of a vertical column of foam, will
travel downwards as time progresses and bubbles rupture. As Front Rupture is stimulated
by liquid drainage it is likely that ultrasound will alter this mode of foam collapse. More
specifically, subjecting foam to ultrasound should cause critical thickness to be reached
in a shorter time period, making Front Rupture the dominant mechanism of foam
destruction.
Both the Homogeneous and Front Rupture mechanisms are explained by considering a
single film drainage model known as the Derjaguin-Landau-Verwey-Overbeek (DVLO)
theory (Monin et al, 2000). Essentially this theory describes the equilibrium of rigid film
interfaces in terms of molecular interactions.
(5.1)

4YP-Sound Methods of Breaking Foam James Winterburn
23
Barigou and Davidson (1993) present and compare a further two theories of single film
drainage; Reynolds model of hydrodynamic lubrication and the Swept film surface model.
It is found that the Reynolds model underestimates film drainage rates by several orders
of magnitude and results in a description of the film pressure distribution that is
parabolic with respect to radius. The inaccuracy is due to the assumption that the film is
bounded by inextensible interfaces, which is not the case when fluid interfaces are to be
considered i.e. liquid films within foams. The swept film surface model allows for fluid
interfaces and splits the film into three sections, the static plateau border region, the
transition region and the lamella region. All significant flow and viscous dissipation
occurs in the transition region, where surfactant concentration varies from a minimum to
a maximum at the exit of the region, with corresponding changes in the surface tension
of the film.

4YP-Sound Methods of Breaking Foam James Winterburn
24
6. Experimental Technique: 6.1 Ultrasound generation:
In order to investigate the frequency dependence of ultrasound induced foam collapse
two different frequencies of ultrasound, 27.72kHz and 40.00kHz, were used. Ultrasound
was generated using two similar langevin-sandwich type transducers each with a
different resonant frequency. See Appendix C for transducer pressure calibrations. Each
transducer was driven by a sinusoidal voltage, 50 Vp-p (17.7 Vrms) the maximum that could
be used due to health and safety constraints, via a Wavetek model 25 signal generator
and a FLC electronics P200 linear amplifier with a voltage gain of 10, see figure 6.1.1.
The average electrical power supplied to both transducers at resonance was
approximately 4 W.
Each transducer (27.72kHz and 40.00kHz) was attached to a plastic ‘cup’ (see Appendix B
for cup design) via a screw thread. The contact surfaces of the transducer and cup were
bonded with epoxy resin to minimise any impedance boundaries due to air pockets,
figure 6.1.2 shows this arrangement. The plastic cup provides a reservoir of surfactant
solution from which foam is generated, meaning the ultrasound is transmitted to the
continuous liquid phase of the foam without encountering any large air/water impedance
boundaries until the air bubbles within the foam are met.
6.2 Surfactant solution makeup:
For all experiments a surfactant solution composed of 5 Vol. % Teepol detergent and
95 Vol. % deionised water was used. This solution was chosen as it is benign and was also
used by Barigou and Davidson (1993) in their work concerning soap film drainage (see
section 5.2). The single film surface tension of the surfactant solution was measured
using a Krüss Tensiometer and found to be; σ = 35.14 mN/m, comparable to Barigou and
Davidson’s (1993) value; σ = 35.00 mN/m. The density of the solution was measured as
ρ=1005 kg/m3, whilst the value quoted by Barigou and Davidson (1993) was ρ=1006
kg/m3.

4YP-Sound Methods of Breaking Foam James Winterburn
25
6.3 Method of foam formation and liquid drainage/foam height measurements:
A photograph of the apparatus used in the author’s experiments is shown in figure 6.3.1.
This experimental set-up consisted of a glass column of height 420mm, internal diameter
75mm that was positioned vertically above the plastic cup surfactant reservoir and
transducer assembly. Foam was generated using a metal air sparger, air being supplied
by a Charles Austen Dymax 14 pump. Airflow rates were measured via a rotameter. The
cylindrical metal air sparger comprised of 6 horizontally aligned 2mm diameter holes. A
seal was formed between the air sparger and plastic cup using a rubber O-ring
arrangement.
Experimental runs were conducted using no ultrasound, 27.72 kHz and 40.00kHz
ultrasound for two different values of initial liquid holdup (experimentally it is extremely
difficult to tightly control this variable). Initial liquid holdup was altered by generating
foam using two different air flow rates; 1 L/min and 0.5 L/min respectively, the higher
airflow rate giving a larger initial liquid holdup. These values of airflow rate were chosen
as they represent the maximum possible airflow rate obtainable from the pump used and
also the minimum airflow rate at which the foam column could be filled, hence giving the
largest variation in initial liquid holdup achievable with this apparatus. Foam was
generated to an initial height of 300mm (volume of 1.325x106mm3), at which point the
air supply was terminated and ultrasound turned on (if required). Measurements of foam
height and liquid drainage were taken manually at 30-second intervals. Foam height was
measured using a ruler clamped vertically, adjacent to the foam column, and foam
drainage was recorded by measuring the mass of liquid collected in a beaker, positioned
on a top pan balance. Liquid was transferred to the beaker via the drainage line. Three
repeats of each experiment were conducted to allow for trends to be established and any
outliers to be identified.
Experiments were conducted in a random order to avoid introducing any systematic
error, which could be caused by depletion of surfactant in solution between runs due to
adsorption to the surfaces of the plastic cup.

4YP-Sound Methods of Breaking Foam James Winterburn
26
Fig 6.1.1- Wavetek signal generator and
FLC electronics linear amplifier used to
drive ultrasonic transducers.
Fig 6.1.2- Side and plan views of underside
of plastic cup arrangement showing
40.00kHz transducer and epoxy bonding.
Fig 6.3.1-Complete Apparatus (no foam).
Plastic cup
Ultrasonic Transducer
Glass column
Air line Drainage tube

4YP-Sound Methods of Breaking Foam James Winterburn
27
7. Results:
For all experiments an initial foam height of 300mm was generated by bubbling air
through a surfactant solution composed of 5 Vol. % Teepol detergent and 95 Vol. %
deionised water. Foam height and cumulative liquid drainage were directly measured
during experiments.
Two complete sets of experiments were conducted. The first group of experimental runs
measured foam height and cumulative liquid volume drained for foam generated using an
airflow rate of 1 L/min, to achieve a high initial liquid holdup, and subjected to no
ultrasound, 27.72kHz and finally 40.00kHz ultrasound. The second group of experiments
followed the same procedure only using a lower airflow rate of 0.5 L/min, to generate
foam with a lower initial liquid holdup. Bubble diameters were approximately constant
between experiments at a particular airflow, however the dependence of bubble
diameter on airflow rate gave rise to an undesirable change in bubble diameter between
foams generated at the two different airflows. An airflow rate of 1 L/min produced foam
with an approximate average bubble diameter in the range 7-8mm whilst the lower
airflow rate of 0.5 L/min resulted in a range of bubble diameters 4-5mm.
7.1 Ultrasonic transducer calibrations:
The resonant frequency of each ultrasonic transducer was identified by measuring the
voltages dropped across the transducer and an 18Ω series resistance. At resonance the
transducer impedance is purely resistive and at a minimum, corresponding to a maximum
in the voltage dropped across the series resistor. The values of resonant frequency
measured were confirmed by observing the phase relationship between the transducer
and resistor voltages on an oscilloscope (these voltages are in phase at resonance). For
all measurements the transducer-resistor series circuit was supplied with a sinusoidal
voltage of 50 Vp-p (17.7 Vrms) i.e. the voltage used in experiments. Figures 7.1.1 and 7.1.3
show the variation in the voltage dropped across the series 18Ω resistor with electrical
supply frequency. Sharp maxima at 40.00kHz and 27.72kHz respectively are observed.
Correspondingly figures 7.1.2 and 7.1.4 show the anticipated minimum in transducer
impedance at resonance, in both cases a sharp increase in impedance is noted for
frequencies just above resonance.

4YP-Sound Methods of Breaking Foam James Winterburn
28
Fig 7.1.1 – Voltage dropped across series resistance vs. Supply frequency for 40.00kHz
ultrasonic transducer.
Fig 7.1.2 – Ultrasonic transducer impedance vs. Supply frequency for 40.00kHz ultrasonic
transducer.

4YP-Sound Methods of Breaking Foam James Winterburn
29
Fig 7.1.3 – Voltage dropped across series resistance vs. Supply frequency for 27.72kHz
ultrasonic transducer.
Fig 7.1.4 – Ultrasonic transducer impedance vs. Supply frequency for 27.72kHz ultrasonic
transducer.

4YP-Sound Methods of Breaking Foam James Winterburn
30
7.2 Cumulative liquid drainage:
Raw cumulative mass (g) of liquid drained data from all eighteen experiments undertaken
is shown in figures 7.2.1 and 7.2.3. All of the curves obtained for no ultrasound, 27.72kHz
and 40.00kHz ultrasound show similar general trends; an increase and gradual levelling of
volume of liquid drained with time. Significant offsets exist between repeats due to
limitations of the experimental method used. These limitations are discussed in section
7.8.
Plots of mean cumulative volume (ml) of liquid drained for two different initial liquid
holdups are shown in figures in figures 7.2.2 and 7.2.4. These graphs are obtained from
averaging the raw data for the three repeats of each no ultrasound, 27.72kHz and
40.00kHz ultrasound experimental run, shown in figures 7.2.1 and 7.2.3, and converting
the measurements of liquid mass to volume by dividing by the surfactant solution
density, 1005 kg/m3. The total volume of liquid drained was standardised by taking the
mean across of the three experiments (no, 27.72kHz and 40.00kHz ultrasound) conducted
at each initial liquid holdup. The total volume of liquid drained from the high initial
liquid holdup foam was found to be 8.96ml, greater than that drained from the lower
liquid holdup foam, 8.49ml, as expected. The reduction in initial global drainage for the
40.00kHz ultrasound case is surprising, given that drainage rates are simultaneously
increased.

4YP-Sound Methods of Breaking Foam James Winterburn
31
Fig 7.2.1-Raw liquid drainage data for high initial liquid holdup.
Fig 7.2.2-Plot of averaged experimental data showing variation of liquid drained from
the foam with time for high initial liquid holdup.

4YP-Sound Methods of Breaking Foam James Winterburn
32
Fig 7.2.3-Raw liquid drainage data for low initial liquid holdup.
Fig 7.2.4-Plot of averaged experimental data showing variation of liquid drained from
the foam with time for low initial liquid holdup.

4YP-Sound Methods of Breaking Foam James Winterburn
33
7.3 Liquid drainage rate:
Drainage rate data for each experiment was obtained by numerically differentiating raw
experimental measurements of volume of liquid drained with respect to time, shown in
figures 7.3.1 and 7.3.4. Differentiating the liquid drainage data removes the
experimental offset errors that were present in the raw data.
Figures 7.3.2 and 7.3.5 show the variation of average liquid drainage rate with time for
two different initial liquid holdups. After initial transient behaviour (approximately the
first 2 minutes), which exists due to initial experimental offset errors, a significant
increase in liquid drainage rate is observed for the 40.00kHz ultrasound experiments.
There is not sufficient evidence to confirm this observation for 27.72kHz ultrasound. The
increase in liquid drainage rate caused by 40.00kHz ultrasound is clearer in figures 7.3.3
and 7.3.6, which show a magnified view of figures 7.3.2 and 7.3.5 after initial transient
behaviour.
Fig 7.3.1-Liquid drainage rate data for high initial liquid holdup.

4YP-Sound Methods of Breaking Foam James Winterburn
34
Fig 7.3.2-Drainage transients for foam with high initial liquid holdup.
Fig 7.3.3-Magnified view of drainage transients for foam with high initial liquid holdup.

4YP-Sound Methods of Breaking Foam James Winterburn
35
Fig 7.3.4-Liquid drainage rate data for low initial liquid holdup.
Fig 7.3.5-Drainage transients for foam with low initial liquid holdup.

4YP-Sound Methods of Breaking Foam James Winterburn
36
Fig 7.3.6-Magnified view of drainage transients for foam with high initial liquid holdup.

4YP-Sound Methods of Breaking Foam James Winterburn
37
7.4 Foam height:
The raw data showing the variation of foam height (cm) with time for all experiments
undertaken at each liquid holdup is shown in figures 7.4.1 and 7.4.2. Averages are taken
over each data set of three repeats to obtain the mean foam height data.
The variation of mean foam height with time is shown in figures 7.4.2 and 7.4.4. Error
bars indicate the standard error at each point. It was observed experimentally that for a
high initial liquid holdup 40.00kHz ultrasound collapses foam in 7 minutes, a shorter
period of time than the 8 minutes required for complete collapse in the case of 27.72kHz
ultrasound or in the absence of ultrasound, see figure 7.4.1. The general trend of figure
7.4.2 shows that the foam head is smaller for foam subjected to 40.00kHz ultrasound.
The same cannot be said for 27.72kHz ultrasound.
Figure 7.4.4 illustrates an observation made during experiments, foam of a lower initial
liquid holdup is more persistent, complete collapse not occurring within 8 minutes, even
in the case of 40.00kHz ultrasound. However this can be explained by the fact that
generating foam of a lower initial liquid holdup is achieved by using a lower airflow rate
(0.5L/min as opposed to 1 L/min). The result of the lower airflow rate being foam
generation takes significantly longer, during which time drainage, bubble rupture and
coarsening of the foam occur, leading to surfactant enrichment and hence a more stable
foam.

4YP-Sound Methods of Breaking Foam James Winterburn
38
Fig 7.4.1-Raw foam height data for high initial liquid holdup.
Fig 7.4.2-Averaged experimental variation of foam height with time for high initial liquid holdup.

4YP-Sound Methods of Breaking Foam James Winterburn
39
Fig 7.4.3-Raw foam height data for low initial liquid holdup.
Fig 7.4.4-Average experimental variation of foam height with time for low initial liquid
holdup.

4YP-Sound Methods of Breaking Foam James Winterburn
40
7.5 Variation of mean liquid holdup during foam collapse:
Values of liquid holdup (ml liquid entrained/cm3 of foam) were computed from
experimental cumulative liquid drainage and foam height data. As a consequence of this
the value of liquid holdup at each time interval is a ‘spatial’ average, as no variation in
liquid holdup with vertical position in the foam is accounted for. Initial liquid holdup
values are averaged across the three experiments conducted at two different initial
liquid holdups. Figure 7.5.1 shows a great variation in liquid holdup between foam
subjected to no ultrasound and foam subjected to 40.00kHz ultrasound. In the case of
the 40.00kHz ultrasound, low initial liquid holdup data mean liquid holdup increases by a
factor of ≈2.3. This significant increase in mean liquid holdup for both 40.00kHz plots is a
result of local drainage characteristics of the foam and the rate of foam collapse (height
reduction). The similar shapes of the two 40.00kHz ultrasound plots (one for each value
of initial liquid holdup), both with peaks at t=4 minutes, indicate that the observed
increase in mean liquid holdup is independent of the initial value of liquid holdup.

4YP-Sound Methods of Breaking Foam James Winterburn
41
Fig 7.5.1-Experimental data showing the variation in mean liquid holdup with time.

4YP-Sound Methods of Breaking Foam James Winterburn
42
7.6 Images of foam collapse:
The effects of foam drainage on lamellae thickness and foam collapse events were
recorded with a high speed (250 frames/sec) Kodak EM camera on loan from the EPSRC.
Figures 7.6.1 and 7.6.2 show the effect of liquid drainage on foam generated using 1
L/min airflow, subjected to no ultrasound and 40.00kHz ultrasound respectively. The
images are 0.04 seconds apart (10 frames). From figures 7.6.1 and 7.6.2 it can be seen
that 40.00kHz ultrasound causes increased thinning of lamellae, i.e. more liquid drainage
occurs over the time period, compared to that which occurs in the absence of
ultrasound.
Fig 7.6.1-Liquid drainage of foam subjected to no ultrasound, 0.04 seconds between
images.
Fig 7.6.2-Liquid drainage of foam subjected to 40.00kHz ultrasound, 0.04 seconds
between images.
Camera artefact
Camera artefact
Foam column
Foam column Area of lamellae thinning
Foam front showing no lamellae thinning

4YP-Sound Methods of Breaking Foam James Winterburn
43
Figure 7.6.3 shows images of foam collapse induced by 40.00kHz ultrasound. No such
collapse events were observed in foam not subjected to ultrasound. Images are each
0.004 seconds (1 frame) apart. Collapse can be seen in the upper right section of the
foam, a void being created after rupture.
Fig 7.6.3-Collapse of foam subjected to 40.00kHz ultrasound, 0.004 seconds between
images (rupture event lasts 0.012 seconds).
Location of localised foam collapse Foam column Camera artefact

4YP-Sound Methods of Breaking Foam James Winterburn
44
7.7. Foam fraction and ultrasonic foam breaker integration:
The ultrasonic transducer and plastic cup assembly was integrated with a fellow fourth
year engineering science student’s (David Wall, Mansfield College) foam fractionation
experimental apparatus in an attempt to improve upon the foam breaking achieved with
a mechanical rotating ‘stirrer’ arrangement. Efficient foam breaking is required by the
foam fractionation process in order to collapse foam and provide an enriched solution for
column reflux.
Figures 7.7.1 and 7.7.2 show photographs of the plastic cup and ultrasonic transducer
assembly being utilised as a foam collector and breaker. The ultrasonic foam breaker was
easily integrated with the foam fractionation column, but was ineffective at collapsing
the foam, neither controlling the volume of foam in the plastic cup (which overflowed) or
providing an adequate volume of liquid for reflux.
Fig 7.7.1- Foam fractionation and
40.00kHz ultrasound integration.
Fig 7.7.2- Foam fractionation and
27.72kHz ultrasound integration.
Foam fractionation
column
Plastic cup and transducer assembly

4YP-Sound Methods of Breaking Foam James Winterburn
45
7.8 Experimental errors and reproducibility:
Taking figures 7.2.1 and 7.2.3 it is clear that significant offset errors exist in the
cumulative liquid drainage data. These errors exist due to limitations of the
experimental methodology used; difficulties arose in choosing the t=0 minutes datum.
This datum was chosen manually using intuition rather than following a more systematic
procedure. The general trends of the cumulative drainage plots are consistent between
repeats however, so the offset error is eliminated in drainage rate plots (figures 7.3.1 to
7.3.6) by differentiation.
The fluctuations in the 40.00kHz liquid drainage rate shown in figures 7.3.5 and 7.3.6 are
due to unexplained behaviour during one repeat of the experiment. As this repeat was
carried out towards the end of the experimental run the author had built up enough
experimental experience to notice the change in behaviour, but no obvious change in
experimental conditions were found.
The increase and peak in the mean liquid holdup for foam of two different initial liquid
holdups subjected to 40.00kHz ultrasound demonstrates that experimental results are
repeatable. The existence of similar characteristics in two completely separate sets of
data also gives increased confidence in the validity of results obtained.

4YP-Sound Methods of Breaking Foam James Winterburn
46
8. Discussion of Results: 8.1 Rate of liquid drainage and cumulative global drainage:
The general increase in liquid drainage rate shown in figures 7.3.2, 7.3.3, 7.3.5 and
7.3.6, obtained from directly measuring the cumulative mass of liquid drainage is
confirmed visually by the images showing increased thinning of lamellae in a foam
exposed to 40.00kHz ultrasound, see figure 7.6.2. The consequence of the increased
liquid drainage rate is an increase in foam collapse rate, as demonstrated by foam height
results. These observations experimentally confirm the proposals made by Sandor and
Stein (1993) that ultrasound causes accelerated film drainage, leading to lamellae
reaching their critical thickness in a shorter time period, hence increasing the foam
collapse rate. It is also apparent from figure 7.6.3 that 40.00kHz ultrasound affects the
manner in which foam collapse occurs. One critical parameter that has not been
measured experimentally is lamellae thickness. Whilst liquid drainage and foam height
results confirm the existence of a threshold lamellae thickness, which is expected from
characterisations of the experimentally observed front rupture mechanism encountered
in the literature review, it has not been determined if 40.00kHz ultrasound actually
alters the threshold thickness or whether it is purely a function of foam rheology. A
frequency dependence is noted, similar observations were not made with 27.72kHz
ultrasound, which had no measurable effect on liquid drainage rate.
Considering the plots of cumulative liquid drainage, as shown in figures 7.2.2 and 7.2.4,
it seems that the significantly lower quantity of initial global liquid drainage in the case
of 40.00kHz ultrasound indicates that the threshold lamellae thickness is indeed
increased. However, the significant increase and peak in mean liquid holdup, shown in
figure 7.5.1, must also be considered. It is entirely possible that local drainage at the
rupture front of the foam is significantly increased, while the increase in mean liquid
holdup results in reduced global liquid drainage. To understand this requires
measurements of local liquid drainage from foam, a variable that was not measured
experimentally in this study.

4YP-Sound Methods of Breaking Foam James Winterburn
47
8.2 Mean liquid holdup:
The most prominent feature of the variation of mean liquid holdup with time, see figure
7.5.1, is the peak occurring after four minutes of drainage, enhanced by 40.00kHz
ultrasound, have elapsed. The similar results for both initial liquid holdups demonstrate
that the peak in mean liquid holdup is itself not a function of initial liquid holdup. The
observed peak in mean liquid holdup confirms that entrained liquid released by a rupture
event is first taken up by the surrounding plateau borders, rather than directly draining
into the bulk of the surfactant solution. The increased rate of bubble rupture, stimulated
by 40.00kHz ultrasound, leads to the rise and peak in liquid holdup. Immediately after
rupture there is a larger proportion of liquid still entrained in a reduced volume of foam,
these conditions giving rise to the peak in average liquid holdup. One other factor to
consider is the quantity of liquid that plateau borders can take up, a function of liquid
holdup itself. The subsequent decrease in mean liquid holdup after the peak at 4 minutes
is probably due to there being an insufficient volume of foam remaining to take up the
liquid released by bubble rupture, this excess liquid instead draining straight into the
bulk of the surfactant solution. Evidence for this can be seen in plots of foam height and
the rise in liquid drainage rates observed for 40.00kHz ultrasound after 4 minutes have
elapsed, figures 7.3.3, 7.3.6, 7.4.2 and 7.4.4.
8.3 Foam Collapse:
The experimentally observed increase in liquid drainage from foam subjected to
40.00kHz ultrasound is consistent with the expected mode of foam rupture, front
rupture, as described in section 5.2. Further understanding of the mechanics of foam
collapse requires consideration of simplified drainage and foam collapse scenarios and
comparison to a plot of experimental data showing foam height against cumulative liquid
drained, figures 8.3.1 (high initial liquid holdup) and 8.3.2 (low initial liquid holdup).

4YP-Sound Methods of Breaking Foam James Winterburn
48
Figure 8.3.3 shows the same foam height and volume of liquid drained relationship as
figures 8.3.1 and 8.3.2 for three simplified foam height and liquid holdup scenarios.
Curve 1 shows the idealised relationship between foam height and volume of liquid
drained for a foam in which no film rupture occurs, whilst liquid drainage proceeds at a
constant rate i.e. liquid holdup reduces with time. Curve 2 corresponds to random
bubble coalescence throughout the foam, with a constant total gas volume and liquid
holdup. Finally, curve 3 refers to foam undergoing collapse, with a rupture front at the
top surface, whilst no liquid drainage occurs; hence liquid holdup increases as foam
rupture progresses.
Comparison of figures 8.3.1, 8.3.2 and 8.3.3 allows for the dominant collapse regime of
the foams used in experimental work to be identified. From the shape of the 40.00kHz
ultrasound curve in figure 8.3.1 it is apparent that initially front rupture dominates,
with little global drainage occurring. As global drainage progresses the rate of liquid
drainage increases until a point is reached at which very little film rupture occurs. In the
case of 27.72kHz ultrasound and no ultrasound random coalescence of the foam causes a
significant amount of foam collapse. This was noted by the absence of large rupture
events at the top surface of the foam such as those shown in figure 7.6.3 for 40.00kHz
ultrasound. The flat plateau for t>6 minutes seen for 40.00kHz ultrasound in figure 8.3.2
suggests that at this point little foam collapse is occurring whilst drainage progresses.
This is consistent with the reduction in mean liquid holdup over this period, see figure
7.5.1. Whilst the apparent lack of bubble rupture ties in with experimental observations
of foam persistence due to surfactant enrichment in the case of foam generated at the
lower, 0.5 L/min, airflow rate.

4YP-Sound Methods of Breaking Foam James Winterburn
49
Fig 8.3.1-Foam height vs. volume of liquid drained. High initial liquid holdup.
Fig 8.3.2-Foam height vs. volume of liquid drained. Low initial liquid holdup.
Fig 8.3.3-Foam height and volume of liquid drained curves for three simplified drainage
scenarios.

4YP-Sound Methods of Breaking Foam James Winterburn
50
9. Project Extensions:
The most significant hurdle to further understanding of foam-ultrasound interaction is
quantifying the actual acoustic energy transferred to the foam by the ultrasonic
transducer. Overcoming this problem would allow conclusions to be drawn regarding the
amplitude of vibrations required to rupture lamellae. Measuring the ultrasonic pressure
field in the presence of foam would be the first step towards the solution.
Progression of experimental work requires the design of apparatus that allows for higher
voltages to be used safely (voltage was limited to 50v in this study by safety constraints)
so that the ultrasonic transducers can be supplied with more electrical power. The new
design must isolate the ultrasonic transducer from the foam to avoid any water-liquid
contact, whilst not creating any large impedance boundaries to reflect the ultrasound
and hinder coupling to the foam. Increasing the range of electrical power available would
allow for investigation of the relationship between power supplied to the transducer and
foam collapse rate.
In depth knowledge of the effect of ultrasound on local foam drainage is required, direct
measurement of the variation in local liquid holdup with time, using either a foam
sampling method or electrical resistance tomography (which measures changes in
conductivity as lamellae drain and thin), would provide this understanding. Both methods
have drawbacks however, notably foam sampling is intrusive and would disrupt the foam,
but could still be employed to indicate where the liquid holdup peak occurs. Further
investigation into the spatial variation of liquid drainage could also be related to the
acoustic pressure field.
In tandem with refinement of experimental procedures developing a model of foam
destruction by ultrasound would be beneficial. No such models currently exist; modelling
work would have to draw upon single film drainage models, the first step being
describing drainage under the influence of gravity (drainage equation) and ultrasound of
an idealised ordered foam. Linking this with existing research concerning acoustic
levitation of single bubbles and their normal modes of vibration (McDaniel and Holt,
2000). It is envisaged that constructing a successful model would also require more
detailed experimental work on ordered ‘bespoke’ foams to increase the understanding of
bubble resonance.

4YP-Sound Methods of Breaking Foam James Winterburn
51
10. Conclusions: This project has demonstrated, for the first time at the University of Oxford’s
Department of Engineering Science, that ultrasound can be effectively employed to
increase the collapse rate of detergent based foams. Application of knowledge gained
from undertaking a comprehensive literature review to designing the experimental
apparatus allowed for effective transmission of ultrasound to the foam, resulting in a
higher foam collapse rate being achieved at an average electrical power of 4 W (supplied
to the ultrasonic transducer); lower than any previous research encountered in the
literature.
Experimental results illustrate that ultrasound increases the rate of liquid drainage from
foam, and hence increases the foam’s collapse rate. This corroborates the observations
of Sandor and Stein (1993). The dominance of the front rupture collapse mechanism,
which is itself characterised by a threshold lamellae thickness, confirms that the
presence of ultrasound causes lamellae to reach critical thickness quicker than in its
absence. However it is not apparent if ultrasound also initiates lamellae rupture at a
greater critical thickness as this parameter was not measured. It has also been shown
that similar effects and trends are observable for two different values of initial liquid
holdup. All experimental data obtained show that 40.00kHz ultrasound has significantly
more pronounced effects than 27.72kHz ultrasound. It is likely that at higher powers this
frequency dependence may change, although further work is required to confirm this as
fact.
From analysing liquid drainage and foam height data the relationship between average
liquid holdup throughout the foam and time was obtained. It is evident that 40.00kHz
ultrasound causes a large increase in average liquid holdup. This confirms that liquid
released by a rupture event is first taken up by the surrounding plateau borders, rather
than directly draining into the bulk of the surfactant solution. In the case of 40.00kHz
ultrasound its was observed that foam collapse occurs at lower values of global drainage
than in the absence of ultrasound, meaning that immediately after rupture there is a
larger proportion of liquid still entrained in a smaller volume of foam than compared to
foam subjected to 27.72kHz ultrasound/no ultrasound. This coherent combination of
conditions gives rise to the peak in average liquid holdup. It is expected, due to the
front rupture mechanism, that the increase in liquid holdup is sharpest at the top of the

4YP-Sound Methods of Breaking Foam James Winterburn
52
foam, i.e. at the rupture front. Direct measurements of local liquid holdup would give a
more detailed understanding of the variation of local liquid holdup throughout the foam.
The plastic cup assembly was integrated with a fellow fourth year engineering science
student’s (David Wall, Mansfield College) foam fractionation experimental apparatus in
an attempt to improve upon the foam breaking achieved with a mechanical rotating
‘stirrer’ arrangement. It was found that the ultrasound was ineffective at controlling the
foam. More experiments are required at a higher electrical power to confirm whether
ultrasound can be successfully used in this application.

4YP-Sound Methods of Breaking Foam James Winterburn
53
Appendix: A. Progress Report: A.1 Description of project:
The main focus of this project is to investigate the effect of ultrasound (20kHz and
above) on the stability of foams. In industrial applications, such as fermentation, the
destruction of unwanted foams is often difficult and achieved either by mechanical or
chemical means, both involving contact and the potential for product contamination.
Ultrasound offers a ‘clean’ foam breaking method without the need for intimate contact
between the ultrasonic transducer and foam.
Alongside knowledge of the physics of foams themselves, information is required on the
generation of ultrasound- transducers and piezoelectric materials. The effective
transmission of ultrasound from air into foam requires attention (due to the large
impedance discontinuity).
A.2 Tasks identified:
Literature review to gain an understanding of basic concepts of foam stability,
drainage and collapse. An appreciation of past experimental procedures and
research is required.
Key parameters need to be decided on. Possible variables include: Ultrasound
amplitude, ultrasound frequency, transducer geometry, surfactant type, and
bubble diameter.
Design of a series of experiments to investigate foam stability, based upon the
variables identified. Aim to verify information gained from literature review and
gain an insight into ultrasound/foam contacting. Order equipment needed.
Photograph/document experiments for use in project report.
Carry out experimental work and data collection.
Analysis of results, leading to more experimental work if necessary.
Modelling of foam/ultrasound interaction and subsequent collapse.

4YP-Sound Methods of Breaking Foam James Winterburn
54
A.3 Results achieved so far:
So far the majority of time has been spent reading papers on the subject to form a
background of understanding as a basis of the project and on refining experimental
technique. Due to this only one set of meaningful results has been obtained see figure
A.3.1.
These results are from measuring liquid drainage with time from foam created in an
ultrasonic bath (ultrasound generated at 25kHz). Whilst repetition is needed to make
judgements with regard to errors, it can be said that the effect of ultrasound is to
increase the rate of liquid drainage from the lamellae within the foam structure. This
agrees with the mechanism for foam destruction proposed in the literature whereby
foam destruction occurs due to increased drainage, and hence enhanced film thinning,
leading to films attaining their critical thickness over a shorter time period.
Fig A.3.1-Initial foam drainage results.
A.4 Problems:
The biggest challenges to the success of this project are; the generation of relatively
uniform ‘bespoke’ foams (narrow bubble size distribution) and also accurately measuring
this parameter. This problem is being worked around by practising experimental
technique and applying knowledge gained from background reading. Another difficulty
lies in ensuring sufficient energy is transmitted from the ultrasound to the foam. So far

4YP-Sound Methods of Breaking Foam James Winterburn
55
no practical steps have been taken in this regard, but knowledge of impedance
boundaries is being revised (2nd year PDE’s course).
A.5 Future work:
Week 7,8 MT: Completion of preliminary experiments and design of final experimental
setup
Winter break: Write literature review section for project report and
characterise transducers obtained
Week 1,2 HT: Obtain any further equipment needed for experimental rig and make final
decision on experiments to be conducted
Week 3,4 HT: Begin conducting experiments
Week 5,6 HT: Aim to complete data collection
Week 7,8 HT: Analysis of results
Spring Break: Complete outstanding experimental work and write project report
Week 1,2 TT: Finish writing report and submit draft to project supervisor
Week 3,4 TT: Submit report to examiners

4YP-Sound Methods of Breaking Foam James Winterburn
56
B. Plastic Cup Design: Figure B.1 shows the design of the plastic cup arrangement used in experimental work.
Fig B.1–Plastic cup design drawing.

4YP-Sound Methods of Breaking Foam James Winterburn
57
C. Ultrasonic Transducer Pressure Calibrations: Figures C.1 to C.6 show the absolute, axial and transverse pressure calibrations for the
27.72kHz and 40.00kHz transducers. With thanks to Jamie Condliffe.
Fig C.1- 27.72kHz transducer absolute pressure calibration.
Fig C.2- 40.00kHz transducer absolute pressure calibration.

4YP-Sound Methods of Breaking Foam James Winterburn
58
Fig C.3-27.72kHz transducer axial calibration.
Fig C.4-40.00kHz transducer axial calibration.

4YP-Sound Methods of Breaking Foam James Winterburn
59
Fig C.5-27.72kHz transducer transverse calibration.
Fig C.6-40.00kHz transducer transverse calibration.

4YP-Sound Methods of Breaking Foam James Winterburn
60
D. Preliminary Results Figure D.1 contains results from preliminary ultrasonic bath experiments.
Fig D.1-Foam drainage data obtained from preliminary ultrasonic bath experiments.
25kHz ultrasound.
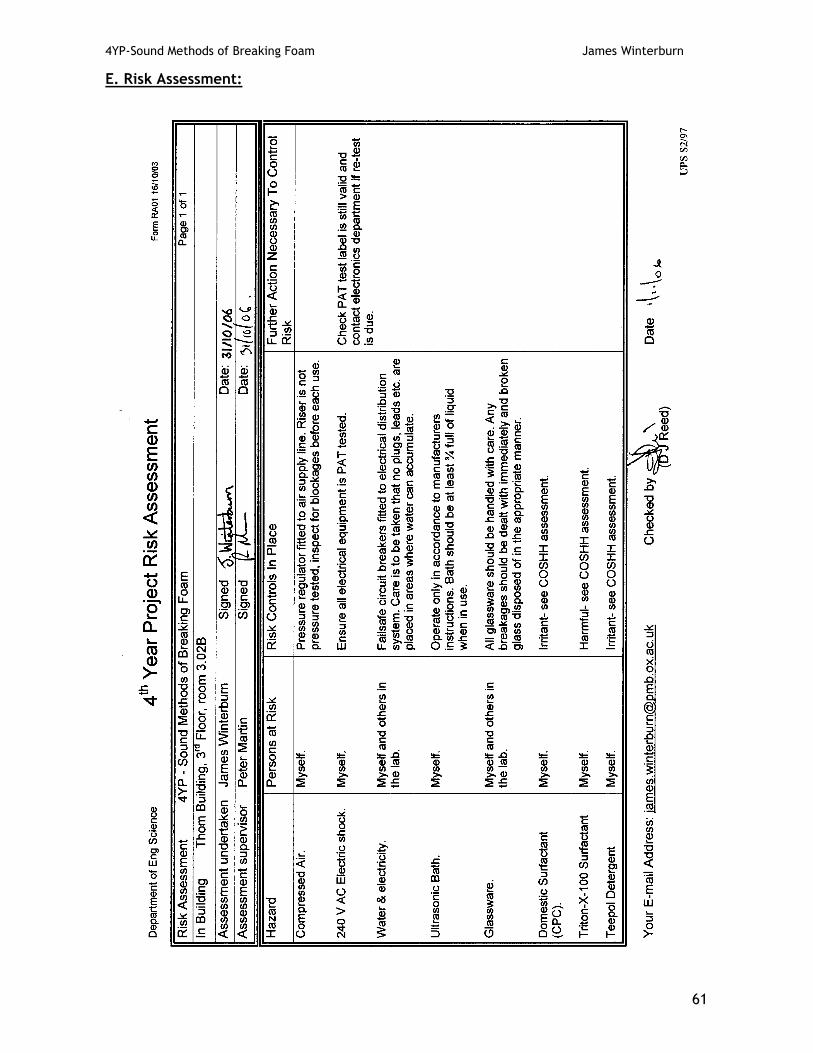
4YP-Sound Methods of Breaking Foam James Winterburn
61
E. Risk Assessment:

4YP-Sound Methods of Breaking Foam James Winterburn
62
F. COSHH Assessment:

4YP-Sound Methods of Breaking Foam James Winterburn
63
G. References:
Barigou, M. and Davidson, J.F. (1994) Soap film drainage: theory and experiment.
Chemical Engineering Science. 49(11), 1807-1819.
Blitz, J. (1956) Ultrasonics-Methods and Applications. 8th Edition. Butterworths.
Brady, M. (2004) 2nd year PDE lecture notes.
Coons, J.E., Halley, P.J., McGlasham, S.A. and Tran-Cong, T. (2005) Scaling laws for the
critical rupture thickness of common thin films. Colloids and Surfaces A: Physicochem.
Eng. Aspects. 263, 258-266.
Dedhia, A.C., Ambulgekar P.V. and Pandit, A.B. (2004) Static foam destruction: Role of
ultrasound. Ultrasonics Sonochemistry 11(2), 67-75.
Dexter, A.F., Malcolm, A.S. and Middleberg. A.P.J (2006) Reversible active switching of
the mechanical properties of a peptide film at the fluid-fluid interface. Nature Materials.
Advance online publication 21st May.
Ensminger, D. and Dekler, M. (1973) Ultrasonics- Low and High-Intensity Applications.
Gutwald, S. and Mersmann, A. (1997) Mechanical foam breaking- a physical model for
impact effects with high speed rotors. Chem. Eng. Technol. 20, 76-84.
Heller, J.P. and Kuntamukkula, M.S. (1987) Critical review of the foam rheology
literature. Ind. Eng. Chem. Res. 26, 318-325.
Howard, D.M. and Angus, J. (2006) Acoustics and Psychoacoustics. 3rd Edition. Focal
Press.
Howatson, Lund and Todd (HLT) (1991) Engineering Tables and Data, Chapman and Hall.

4YP-Sound Methods of Breaking Foam James Winterburn
64
Kralchevsky, P., Danov, K. and Denkov, N. (2002) Chemical Physics of Colloid Systems and
Interfaces. Extract from Handbook of Surface and Colloid Chemistry. 2nd Edition. CRC
Press.
Kukarni, R.D., Goddard. E.D. and Kanner. B. (1977) Mechanism of antifoaming: role of
filler particle. Ind. Eng. Chem., Fundam.16(4), 472.
Lim, K.S. and Barigou, M. (2005) Ultrasound-assisted generation of foam. Ind. Eng. Chem.
Res. 44, 3312-3320.
Marze, S.P.L., Saint-Jalmes, A. and Langevin, D. (2005) Protein and surfactant foams:
linear rheology and dilatancy effect. Colloids and Surfaces A: Physicochem. Eng. Aspects
263 121-128.
McDaniel, J.G. and Holt, R.G. (2000) Measurement of aqueous foam rheology by acoustic
levitation. Rapid Communications-Physical Review E 61(3).
McKenzie Smith, I. et al. (2002) Hughes Electrical and Electronic Technology. 8th Edition.
Pearson.
Monin, D., Espert, A. and Colin, A. (2000) A new analysis of foam coalescence: from
isolated films to three-dimensional foams. Langmuir 16 3873-3883.
Morey, M.D., Deshpande, N.S. and Barigou, M. (1999) Foam destabilization by mechanical
and ultrasonic vibrations. Journal of Colloid and Interface Science 219, 90-98.
Narsimhan, G. and Wang, Z. (2006) Rupture of equilibrium foam films due to random
thermal and mechanical perturbations. Colloids and Surfaces A: Physicochem. Eng.
Aspects 282-283, 24-36.
Perry, R.H. and Green, D. (1984) Perry’s Chemical Engineers’ Handbook. 6th Edition.
McGraw-Hill.

4YP-Sound Methods of Breaking Foam James Winterburn
65
Reira, E., Gallego-Juárez, J.A. and Mason, T.J. (2006) Airborne ultrasound for the
precipitation of smokes and powders and the destruction of foams. Ultrasonics
Sonochemistry 13(2),107-116.
Sandor, N. and Stein, H.N. (1993) Foam destruction by ultrasonic vibrations. Journal of
Colloid and Interface Science 161, 265-267.
Takesono, S., Onodera, M., Yoshida, M. and Yamagiwa, K. (2002) Performance
characteristics of mechanical foam breakers fitted to a stirred-tank reactor. Journal of
Chemical Technology and Biotechnology. 78, 48-55. (2002).
Weaire, D. and S.Hutzler, S. (1999) The Physics of Foams. Oxford University Press.
Wedlock, D.J. et al. (1994) Controlled Particle, Droplet and Bubble Formation.
Butterworth Heinemann.
http://www.channelindustries.com/chan_cat.pdf. (1999) Piezoelectric Ceramics.
Channel Industries Inc. Accessed 9/10/06
www.morganelectroceramics.com. Sensors and Transducers. Morgan ElectroCeramics.
Accessed 9/10/06
http://www.grasp.ulg.ac.be/research/foam/
Technical Notes. Given by supervisor Dr P.Martin