Embed Size (px)
Citation preview

http://dx.doi.org/10.5277/ppmp1851
Physicochem. Probl. Miner. Process., 54(2), 2018, 415-427 Physicochemical Problems of Mineral Processing
http://www.journalssystem.com/ppmp ISSN 1643-1049
© Wroclaw University of Science and Technology
Received August 11, 2017; reviewed; accepted September 28, 2017
CO2 - CH4 sorption induced swelling of gas shales: An experimental study on the Silurian shales from the Baltic Basin, Poland
Danuta Miedzińska 1, Marcin Lutyński 2
1 Military University of Technology, Faculty of Mechanical Engineering, Kaliskiego St. 2, 00-908 Warsaw, Poland
2 Silesian University of Technology, Faculty of Mining and Geology, Akademicka St. 2, 44-100 Gliwice, Poland
Corresponding author: [email protected] (Danuta Miedzińska)
Abstract: The main aim of the research presented in the paper was to study the phenomena of shale
swelling induced by CH4 and CO2 sorption. In the study, a Silurian gas shale sample from the Baltic
Basin in Poland was used. Samples represented typical characteristic features of polish shale gas
formations with relatively low total organic carbon (0.8%) and high clay mineral content. The first part
of the study was devoted to competitive adsorption of CO2 and CH4. The second part was devoted to
observation of the sorption induced swelling phenomena, where sample linear strains were monitored
with the use of strain gauges. Swelling tests were conducted up to the pressure of approximately 8
MPa with CO2, CH4 and helium as the baseline. Experimental results were compared with the Seidle
and Huitt model where Langmuir constants where determined with volumetric sorption tests. Results
of the study showed that matrix swelling in case of CO2 adsorption was greater than in the case of
CH4 adsorption. The swelling value was directly proportional to adsorption and was about 5 to 10
times smaller than in the case of coal. Sorption of methane and carbon dioxide in the gas-bearing shale
was about 10-times lower than in hard coals. The Seidle and Huitt model developed for coals was
equally suitable to describe the processes of shale swelling.
Keywords: shale rock, swelling, methane, carbon dioxide, sorption
1. Introduction
Despite high natural gas reserves, first shale gas production was started as far as 1821 but resulted in
very low efficiencies (Rutter and Keistead, 2012). In the last 30 years, an important progress was made
due to the development of drilling technology and the use of horizontal drilling coupled with
fracturing stimulation method. The most commonly used method of fracturing is the hydraulic
fracturing. This method consists of injecting into the well a large amount of water with proppants and
chemical additives in order to crack rocks and to release gas (Tsang and Apps, 2005).
Despite its widespread use, the method mentioned above causes many objections. It can cause
groundwater contamination by chemicals used in the fracturing process and requires the use of large
amounts of water (EPA, 2016). Consumption and contamination of such significant quantities of water
may arise objections in some countries (particularly in the European Union) (Briggs, 2003). A part of
water from the hydraulic process returns to the surface as the flowback water, however, it is
additionally contaminated with large amounts of dissolved solids, occasionally heavy metals, hence
requiring proper utilization methods (EPA, 2016). The described disadvantages of the hydraulic
fracturing method resulted in the search for other fracturing media, such as inert gas which is easily
condensable and widely available in the environment. One such media is CO2. A process of injection
of CO2 not only fractures rocks but it can also contribute to the carbon geological storage (Holloway et
al., 2006).
Some technologies using non-wetting fluid were presented in (Rogala et al., 2013), involving
fracturing with liquid CO2, nitrogen, LPG and explosive/propellant system - EPS. The current

Physicochem. Probl. Miner. Process., 54(2), 2018, 415-427 416
fracturing technology is applicable to specific areas with fluid sensitive shale rocks. Based on current
hydraulic fracturing performances in Poland, shale has certain volume of low density smectite clay
that has tendency to adsorb water based fracturing fluid and to swell (Rogala et al., 2013).
Shale is characterized by its dual porosity system: it contains both primary (micro pores and meso
pores) and secondary (macro pores and natural fractures) porosity systems. The primary porosity
system contains the vast majority of gas-in-place, while the secondary porosity system provides the
conduit for mass transfer to the wellbore. Primary porosity gas storage is dominated by adsorption
(Dahaghi, 2010).
Primary porosity is relatively impermeable due to its small pore size. Mass transfer for each gas is
dominated by diffusion that is driven by the concentration gradient. A flow through the secondary
porosity system is dominated by the Darcy law that relates a flow rate to the permeability and
pressure gradient (Dahaghi, 2010).
When the pressure of a natural fracture system in shale drops below the critical desorption
pressure, methane starts to desorb from the primary porosity system and is released into the
secondary porosity system. As a result, the adsorbed gas concentration in the primary porosity system
near the natural fractures is reduced. This reduction in pressure creates a concentration gradient that
results in mass transfer by diffusion through the micro and meso porosity (Dahaghi, 2010). The
adsorbed gas continues to be released as the pressure is reduced (Cipolla et al., 2009). On the basis of
those mechanisms the analyses of the new innovative method of gas shale fracturing and gas recovery
coupled with carbon dioxide storage have been developed in the Department of Mechanics and
Applied Computer Science of the Military University of Technology in Warsaw, Poland.
Fractured shale reservoir is to some extent similar to a coalbed, where the rock is also source and
the sink for the gas. Coal is also characterized by the dual porosity system where gas flows diffusely
from coal matrix and then with natural fractures to lower pressure regions (Swami, Settari, 2013).
The characteristic property of gas flow in coal structure is the matrix swelling effect, in which
during gas adsorption, coal matrix volume increases, what results in the decrease of coal permeability
by decreasing fracture apertures as shown in Fig. 1 (Durucan et al., 2009).
(a) (b)
Fig. 1. Rock matrix swelling effect caused by gas adsorption (a) and shrinkage effect caused by gas desorption (b)
During the gas desorption process, a contrary to swelling phenomenon occurs: coal matrix volume
decreases, what increases the fracture width and as a result - permeability. Swelling effect can be
described with the use of swelling ratio, which for methane sorption on coal is between 210-4 MPa to
1110-4 MPa and for CO2 sorption – from 210-4 MPa to 4010-4 MPa (Joubert et al., 1973; Crosdale et
al., 1998; Hildenbrand et al., 2006; Dutta et al., 2006; Day et al., 2008). Previous studies of swelling
phenomena on coal show that swelling caused by CO2 adsorption is approximately twice as much as
swelling caused by methane one. This effect has a dramatic impact on the permeability decrease
(particularly for low permeability coals < 2 mD) when CO2 is pumped into the reservoir (Day et al.,
2008). In general, swelling of coal is directly proportional to adsorption capacity (Hildenbrand et al.,
2006). It is anticipated that similar effect for CO2 and CH4 sorption will probably appear in gas bearing
shales.
The aim of the research presented in this paper is to study gas exchange effect and swelling
phenomenon caused by CO2 and methane sorption on shale gas rock sample. The samples were
Physicochem. Probl. Miner. Process., 54(2), 2018, 415-427 417
collected from a gas bearing horizon at the depth of 3 km in an exploratory well in Poland. The
presented research is a part of developed shale gas recovery Polish technology.
2. Experimental methods and materials
2.1 Sample description
For the purpose of the study Silurian shale rock from the Baltic Basin region with organic carbon
content (TOC) of 0.8% was selected. This value of TOC allows to consider rock as a maternal one for
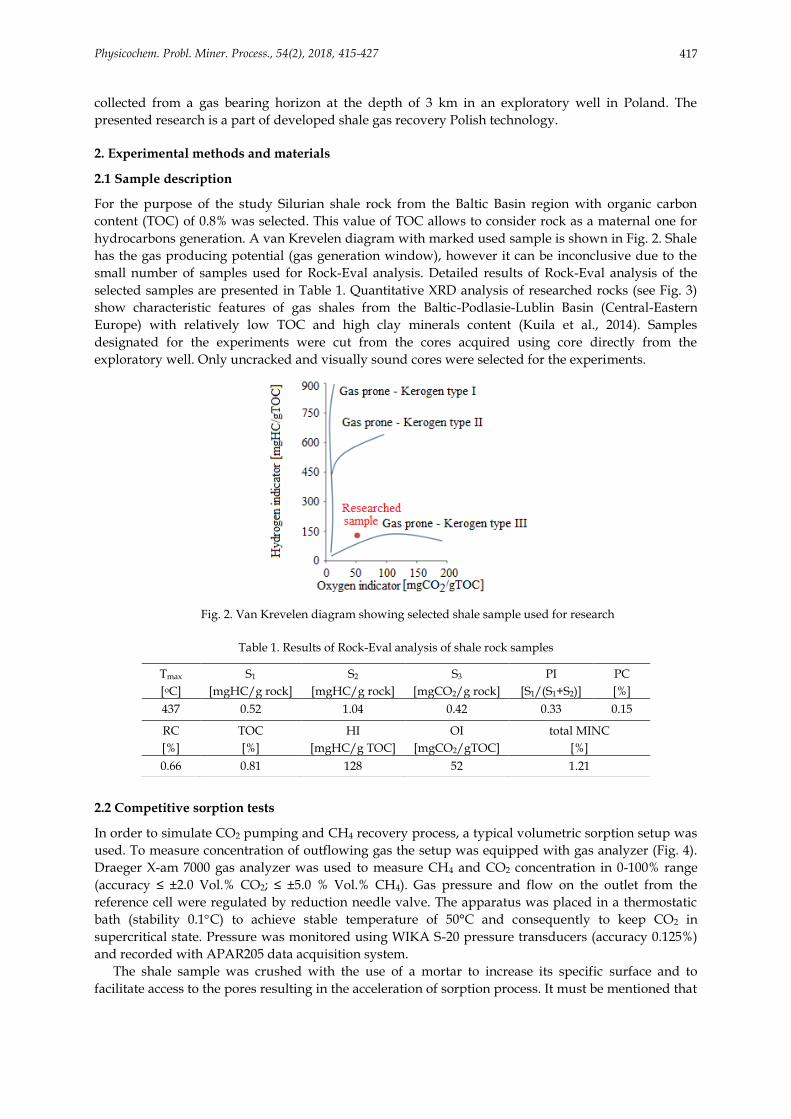
hydrocarbons generation. A van Krevelen diagram with marked used sample is shown in Fig. 2. Shale
has the gas producing potential (gas generation window), however it can be inconclusive due to the
small number of samples used for Rock-Eval analysis. Detailed results of Rock-Eval analysis of the
selected samples are presented in Table 1. Quantitative XRD analysis of researched rocks (see Fig. 3)
show characteristic features of gas shales from the Baltic-Podlasie-Lublin Basin (Central-Eastern
Europe) with relatively low TOC and high clay minerals content (Kuila et al., 2014). Samples
designated for the experiments were cut from the cores acquired using core directly from the
exploratory well. Only uncracked and visually sound cores were selected for the experiments.
Fig. 2. Van Krevelen diagram showing selected shale sample used for research
Table 1. Results of Rock-Eval analysis of shale rock samples
2.2 Competitive sorption tests
In order to simulate CO2 pumping and CH4 recovery process, a typical volumetric sorption setup was
used. To measure concentration of outflowing gas the setup was equipped with gas analyzer (Fig. 4).
Draeger X-am 7000 gas analyzer was used to measure CH4 and CO2 concentration in 0-100% range
(accuracy ≤ ±2.0 Vol.% CO2; ≤ ±5.0 % Vol.% CH4). Gas pressure and flow on the outlet from the
reference cell were regulated by reduction needle valve. The apparatus was placed in a thermostatic
bath (stability 0.1C) to achieve stable temperature of 50°C and consequently to keep CO2 in
supercritical state. Pressure was monitored using WIKA S-20 pressure transducers (accuracy 0.125%)
and recorded with APAR205 data acquisition system.
The shale sample was crushed with the use of a mortar to increase its specific surface and to
facilitate access to the pores resulting in the acceleration of sorption process. It must be mentioned that
Tmax
[oC]
S1
[mgHC/g rock]
S2
[mgHC/g rock]
S3
[mgCO2/g rock]
PI
[S1/(S1+S2)]
PC
[%]
437 0.52 1.04 0.42 0.33 0.15
RC
[%]
TOC
[%]
HI
[mgHC/g TOC]
OI
[mgCO2/gTOC]
total MINC
[%]
0.66 0.81 128 52 1.21

Physicochem. Probl. Miner. Process., 54(2), 2018, 415-427 418
a disk mill was not used for sample preparation since too large disintegration of the sample could
result in the changes of primary porosity system.
Fig. 3. XRD analysis of shale sample used in tests
Fig. 4. Scheme of the setup for CO2/CH4 competitive sorption tests
The experiment begun after measuring the void volume of the sample cell. For that purpose,
a non-sorptive gas (helium) was used. The void volume of the sample cell which consists of apparatus
dead volume and pore space was 64.58 cm3. In the first step of the test the shale rock sample was
saturated with methane to the pressure value of 13.71 MPa and sorption equilibrium was achieved
after 72 hours. The amount of adsorbed methane was 0.1769 mmol per gram of shale (3.96 m3 per Mg
of dry shale mass). The next steps of the experiment were as follows: methane release from the
reference cell with closed valve 1, CO2 pumping into reference cell to the pressure of 7.3 MPa
(supercritical phase), valve 1 opening – gases mixing (24 hours), pressure decrease to 9.07 MPa, valve
1 closing – measurement of gases concentration, gases mixture evacuation from the reference cell,
valve 1 opening – desorption and pressure decrease to 6.24 MPa, valve 1 closing – measurement of
gases concentration, gases mixture evacuation from the reference cell, valve 1 opening – desorption
and consequent pressure decrease to 3.84 MPa, final valve 1 closing – measurement of gases
concentration, gases mixture evacuation from the reference cell.
2.3 Swelling measurement method and apparatus
Some research on swelling/shrinkage phenomena of coal matrix can be found in the literature
(Reucroft, Sethuraman, 1987; Mazumder, Wolf, 2008; Majewska et al., 2009; Hol et al., 2014; Staib et al.,
2014). Swelling/shrinkage measurement methods of this phenomena can be divided into methods
using strain gauges, acoustic methods and optical ones.

Physicochem. Probl. Miner. Process., 54(2), 2018, 415-427 419
In the presented study method using strain sensors was applied for rock samples longitudinal
elongation measurements. This method was chosen because relatively large pieces of shales were
available and there was a possibility to glue strain gauges. Significant advantage of this method is the
fact that large samples are more representative for the in-situ conditions. On the other hand,
equilibration times are longer and experiments may last up to few months.
The experimental setup (Fig. 5) was designed to measure rock swelling induced by gas adsorption.
The apparatus was built of high pressure chamber, 8-channels strain gauges testing system TMX-
0108E, pressure transducer and recorder, automatic heating system, data acquisition system, high-
pressure pump.
Folic resistance extensometers were glued on the sample surfaces vertically and horizontally to the
shale layers with the use of epoxy resin and connected to measurement system. For the purpose of
strain measurements in comparison to the initial state it was decided to place the referenced samples
outside the high-pressure chamber.
Wires soldered to the strain gauges were led out from the high-pressure chamber (Fig. 5) via the
SWAGELOK through-connector system additionally filled with glue. Pressure was measured using a
pressure sensor WIKA while the temperature using Pt100 sensor (1/3 class B). Pressure of supplied
gas was increased by the pump MAXIMATOR DLE-15-30. Pressure and temperature readings were
recorded with APAR205 recorder while strain values using an eight-channel strain gauge
measurement system - TENMEX TMX-0108. The high-pressure chamber was wrapped with heating
tape and placed in an isolated chamber in order to simulate in-situ temperature conditions.
Fig. 5. Scheme of setup for gas shale swelling/shrinkage measurements
The apparatus contained four samples with two strain gauges for each one glued parallel and
perpendicularly to the lamination (Fig. 6). Samples (marked as S1, S2, S3) were cut out from the
drilling core and additionally divided into four equal quadrants cut along their diameter. The samples
were approximately 2 cm thick and had approximated dimensions of 3x3x3.5 cm.
Fig. 6. Strain gauges location on shale sample
After placing the samples in a high-pressure chamber and removal of the leakage in strain gauge
section there was a circuit disruption causing measurement problems for some of the samples. Finally,
the successful full range measurements were performed for two samples (vertical and horizontal
strain). Because of the lack of tested material, the standard error was not considered.
Physicochem. Probl. Miner. Process., 54(2), 2018, 415-427 420
Due to the limitations associated with the setup the tests were conducted up to the pressure of
8 MPa. Prior to the measurement, the measuring system was reset and the injection of the gas was
performed in increments of 1.5 MPa being the compromise between long equilibration time and
pressure increments commonly used in sorption measurements.
After completion of the inert gas experiments similar tests were continued on the same samples
using methane and carbon dioxide respectively. Between the tests, samples were gradually degassed
to atmospheric pressure, and then subjected to a vacuum for a period of several days in order to
remove residual gas. The process of sample degassing was terminated when the strain gauges
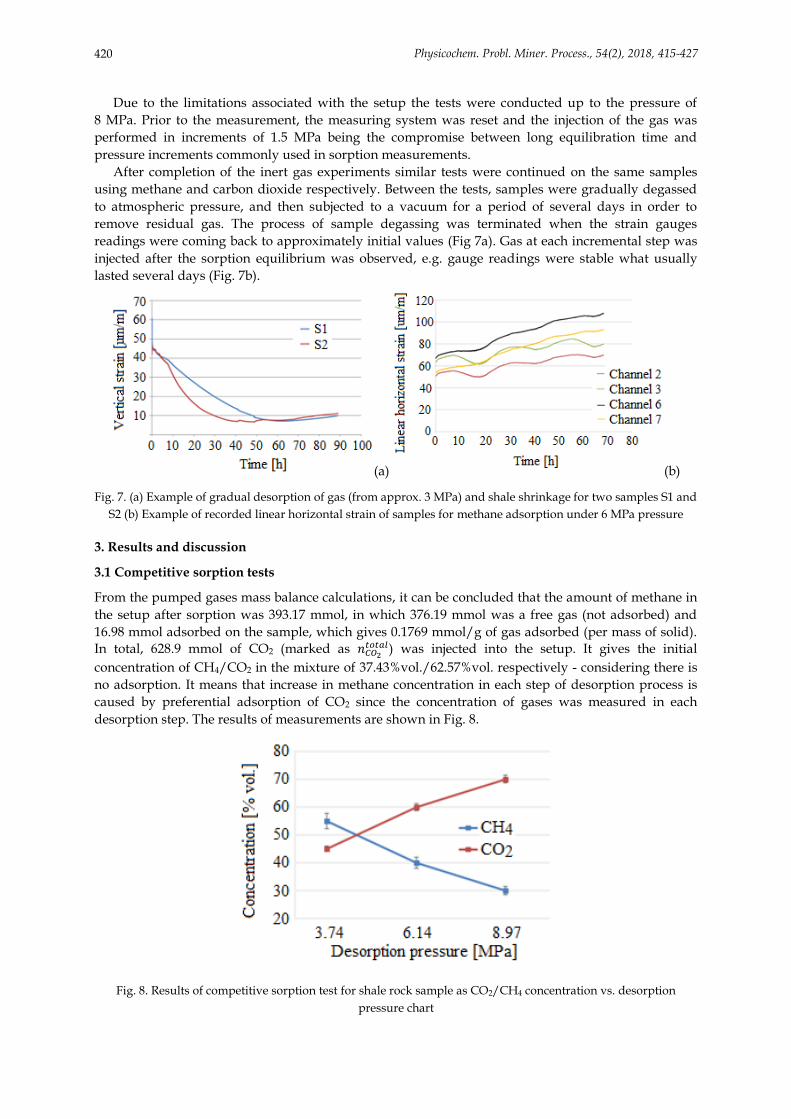
readings were coming back to approximately initial values (Fig 7a). Gas at each incremental step was
injected after the sorption equilibrium was observed, e.g. gauge readings were stable what usually
lasted several days (Fig. 7b).
(a) (b)
Fig. 7. (a) Example of gradual desorption of gas (from approx. 3 MPa) and shale shrinkage for two samples S1 and
S2 (b) Example of recorded linear horizontal strain of samples for methane adsorption under 6 MPa pressure
3. Results and discussion
3.1 Competitive sorption tests
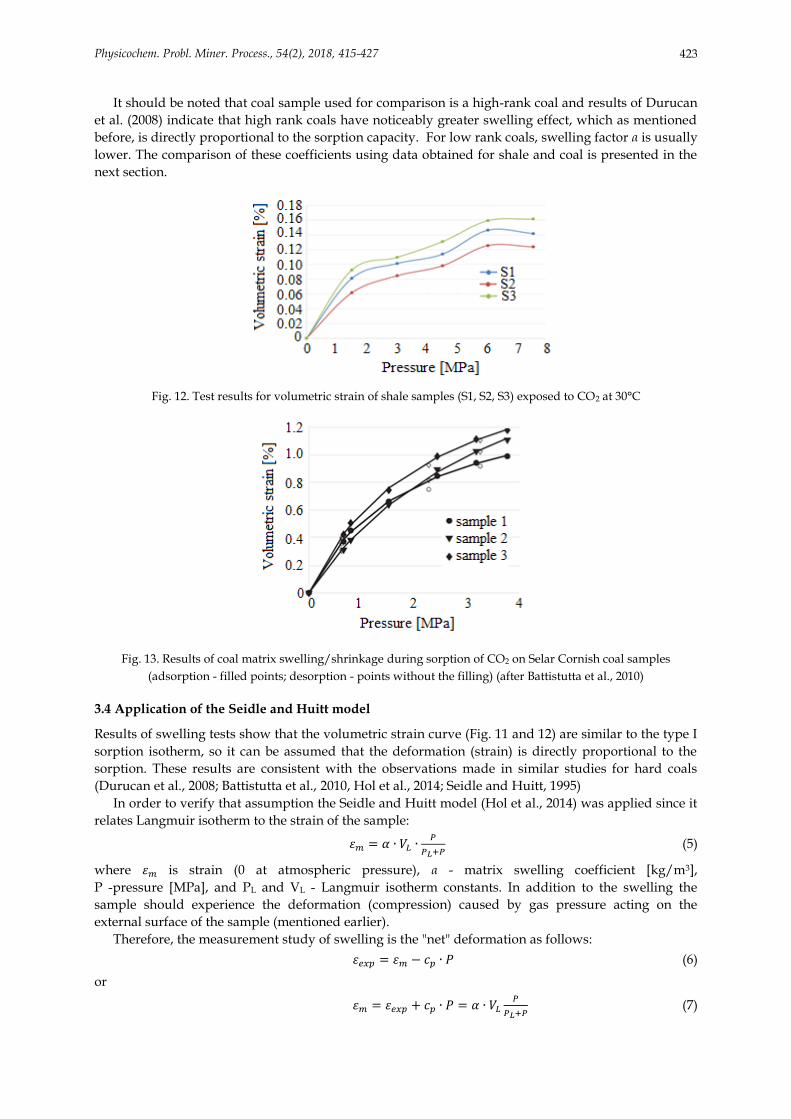
From the pumped gases mass balance calculations, it can be concluded that the amount of methane in
the setup after sorption was 393.17 mmol, in which 376.19 mmol was a free gas (not adsorbed) and
16.98 mmol adsorbed on the sample, which gives 0.1769 mmol/g of gas adsorbed (per mass of solid).
In total, 628.9 mmol of CO2 (marked as 𝑛𝐶𝑂2𝑡𝑜𝑡𝑎𝑙) was injected into the setup. It gives the initial
concentration of CH4/CO2 in the mixture of 37.43%vol./62.57%vol. respectively - considering there is
no adsorption. It means that increase in methane concentration in each step of desorption process is
caused by preferential adsorption of CO2 since the concentration of gases was measured in each
desorption step. The results of measurements are shown in Fig. 8.
Fig. 8. Results of competitive sorption test for shale rock sample as CO2/CH4 concentration vs. desorption
pressure chart

Physicochem. Probl. Miner. Process., 54(2), 2018, 415-427 421
Considering that it is difficult to precisely describe the amount of adsorbed gas on the base of its
concentration in free phase, it was assumed that:
𝑛𝐶𝑂2
𝑓𝑟𝑒𝑒=
𝑛𝐶𝐻4
𝑝𝐶𝐻4𝑎𝑣 − 𝑛𝐶𝐻4
(1)
where: 𝑛𝐶𝑂2
𝑓𝑟𝑒𝑒 is the calculated amount of free CO2 [mol], 𝑝𝐶𝐻4
𝑎𝑣 is the average partial pressure of CH4,
𝑛𝐶𝐻4 is the total amount of CH4 [mol]. Approximation of adsorbed CO2 can be calculated on the
assumption that:
𝑛𝐶𝑂2 𝑠𝑜𝑟𝑏 = 𝑛𝐶𝑂2
𝑡𝑜𝑡𝑎𝑙 − 𝑛𝐶𝑂2
𝑓𝑟𝑒𝑒. (2)
On the base of Eq. (2) the amount of adsorbed CO2 in the experiment was 78.47 mmol
(0.817 mmol per gram of shale sample). This amount is 4.5 times higher than the amount of adsorbed
methane. Experiments described in Section 3.5 proved this observation although the ratio of CO2:CH4
sorption is slightly lower.
Presented results show that alike in other organic sorbents preferential adsorption of CO2 to CH4 in
shale samples appeared, even for quite low pressure values. Hence, one can assume that the effect of
enhanced desorption of CH4 appeared.
3.2 Swelling tests - determination of mechanical compliance factor
The first stage of the swelling experiment was devoted to the determination of deformations that
occur during submission of shale samples to inert gases. As a consequence, the calculation of the
mechanical compliance factor (Cp) was carried out. For this purpose, a first set of swelling tests was
performed with helium.
Determination of the mechanical compliance factor (Cp) was performed to define strain of the
sample exposed to the external gas pressure. In experimental swelling tests, sorption deformation and
induced impact of the gas on the sample external surface cancel each other out (Fig. 9). Therefore, the
measured swelling of the sample is called the "net" deformation. It can be assumed that the
deformation of the sample (εr) is directly proportional to gas pressure:
εr = -Cp P (3)
where Cp is the mechanical compliance factor [MPa-1].
Fig. 9. Diagram of forces impacting rock sample during gas adsorption and related strains
Observation of the deformation caused by sorption of helium in coals showed that strain should be
negative causing the sample to shrink because gas is not adsorbed and does not contribute to the
swelling effect. In these experiments, similar observations were recorded. Apparently, shale matrix
shrunk under the pressure of inert gas. Linear strain with matching trend lines used for calculations of
Cp factor is shown in Fig. 10.
Linear strains of shale samples with calculated mechanical compliance factors (Cp) are shown in
Table 2. From Table 2 it is clear that the coefficients (factors) of mechanical compliance have similar
values for horizontal and vertical deformations (strains) for both samples. In each sample values of Cp
for vertical deformations are higher. This might be explained by the typical features of shales –

Physicochem. Probl. Miner. Process., 54(2), 2018, 415-427 422
lamination and cleavage. Different strains of the sample are the result of anisotropy of samples which
is often visible in uniaxial strength tests (Shovkun and Espinoza, 2017; Yan et al., 2017).
Fig. 10. Test results for linear strain for two shale samples in function of helium pressure
Table 2. Test results for linear strain of shale samples with calculated mechanical compliance factors (Cp)
Pressure [MPa] Strain [μm/m]
Vertical 1 Horizontal 1 Vertical 2 Horizontal 2
1.5 -24.06 -5.92 -13.47 -14.48
3.0 -27.72 -9.48 -32.56 -7.50
4.5 -40.76 -19.47 0.60 -10.26
6.0 -41.16 -20.23 -41.27 -33.33
7.5 -56.45 -39.86 -68.30 -43.29
Cp -0.786 -0.4407 -0.707 -0.497
3.3 CH4 and CO2 adsorption induced swelling
Linear strain recording εm is carried out in [μm/m] for two surfaces, however sample volumetric strain
is more representative and can be defined as the sum of vertical deformation and horizontal
deformation multiplied by two. This assumption is commonly used in rock mechanics (Wang, 2016): ∆𝑉
𝑉= 𝜀𝑣𝑒𝑟𝑡𝑖𝑐𝑎𝑙 + 2 ∙ 𝜀ℎ𝑜𝑟𝑖𝑧𝑜𝑛𝑡𝑎𝑙 . (4)
Methane adsorption induced volumetric strain is shown in Fig.11, while volumetric strain of shale
exposed to carbon dioxide adsorption – in Fig. 12.
Results presented in Figs. 11 and 12 show that volumetric strain in case of CO2 sorption is greater
than in case of methane one. The size of volumetric deformations, similarly to gas adsorption, is about
10-times lower than in case of coals. Results were compared with the results obtained in (Battistutta,
2010) for anthracite Selar Cornish coal from the UK (Fig. 13).
Fig. 11. Test results for volumetric strain of shale samples (S1, S2, S3) exposed to CH4 at 30°C
Physicochem. Probl. Miner. Process., 54(2), 2018, 415-427 423
It should be noted that coal sample used for comparison is a high-rank coal and results of Durucan
et al. (2008) indicate that high rank coals have noticeably greater swelling effect, which as mentioned
before, is directly proportional to the sorption capacity. For low rank coals, swelling factor α is usually
lower. The comparison of these coefficients using data obtained for shale and coal is presented in the
next section.
Fig. 12. Test results for volumetric strain of shale samples (S1, S2, S3) exposed to CO2 at 30°C
Fig. 13. Results of coal matrix swelling/shrinkage during sorption of CO2 on Selar Cornish coal samples
(adsorption - filled points; desorption - points without the filling) (after Battistutta et al., 2010)
3.4 Application of the Seidle and Huitt model
Results of swelling tests show that the volumetric strain curve (Fig. 11 and 12) are similar to the type I
sorption isotherm, so it can be assumed that the deformation (strain) is directly proportional to the
sorption. These results are consistent with the observations made in similar studies for hard coals
(Durucan et al., 2008; Battistutta et al., 2010, Hol et al., 2014; Seidle and Huitt, 1995)
In order to verify that assumption the Seidle and Huitt model (Hol et al., 2014) was applied since it
relates Langmuir isotherm to the strain of the sample:
𝜀𝑚 = 𝛼 ∙ 𝑉𝐿 ∙𝑃
𝑃𝐿+𝑃 (5)
where 𝜀𝑚 is strain (0 at atmospheric pressure), α - matrix swelling coefficient [kg/m3],
P -pressure [MPa], and PL and VL - Langmuir isotherm constants. In addition to the swelling the
sample should experience the deformation (compression) caused by gas pressure acting on the
external surface of the sample (mentioned earlier).
Therefore, the measurement study of swelling is the "net" deformation as follows:
𝜀𝑒𝑥𝑝 = 𝜀𝑚 − 𝑐𝑝 ∙ 𝑃 (6)
or
𝜀𝑚 = 𝜀𝑒𝑥𝑝 + 𝑐𝑝 ∙ 𝑃 = 𝛼 ∙ 𝑉𝐿𝑃
𝑃𝐿+𝑃 (7)
Physicochem. Probl. Miner. Process., 54(2), 2018, 415-427 424
in this case Cp coefficient must be determined experimentally (see Section 3.2).
3.5 Determination of sorption isotherms
The use of the model describing matrix swelling caused by gas sorption requires calculations of the
Langmuir model constants (VL and PL). In order to do this, experimental determination of the
adsorption isotherm for each gas is required.
The basic model of Langmuir isotherm has the following form (Zheng et al., 2009):
𝑉 = 𝑉𝐿∙𝑃
𝑃𝐿+𝑃 (8)
where V - moles of gas adsorbed per mass of sorbent [mmol/g], VL – Langmuir volume (e.g.
maximum sorption capacity) [mmol/g], PL – Langmuir pressure [MPa], P – pressure [MPa].
The isotherm was determined using the manometric setup described in Section 2.2. In order to
calculate the excess sorption in each step, the following formula is used:
𝑚𝐶𝑂2 = ∑ 𝑉𝑟𝑒𝑓 ∙ (𝜌𝑖𝑓,𝐶𝑂2 − 𝜌𝑖
𝑒,𝐶𝑂2)𝑁𝑖=1 (9)
where Vref is the reference cell volume [cm3] while ρ with superscripts f, CO2 and e, CO2 are gas
densities during the stage of reference volume filling (before opening the Valve 1 connecting reference
volume with the sample cell) and sorption equilibrium phase (when the Valve 1 is open). It is
important that the used equation of gas state is sufficiently accurate to properly describe its behavior
in supercritical conditions (e.g. above the pressure of 7.39 MPa and a temperature of 31.1° C for CO2),
since it significantly affects the accuracy of the results. Such conditions occur in unconventional gas
reservoirs such as gas-bearing shales or deep coal seams. Therefore, the accurate Span and Wagner
equation of state for CO2 (Span and Wagner, 1995), McCarthy for helium (McCarthy and Arp, 1990)
and Wagner and Span (Wagner and Span, 1993) for methane is used.
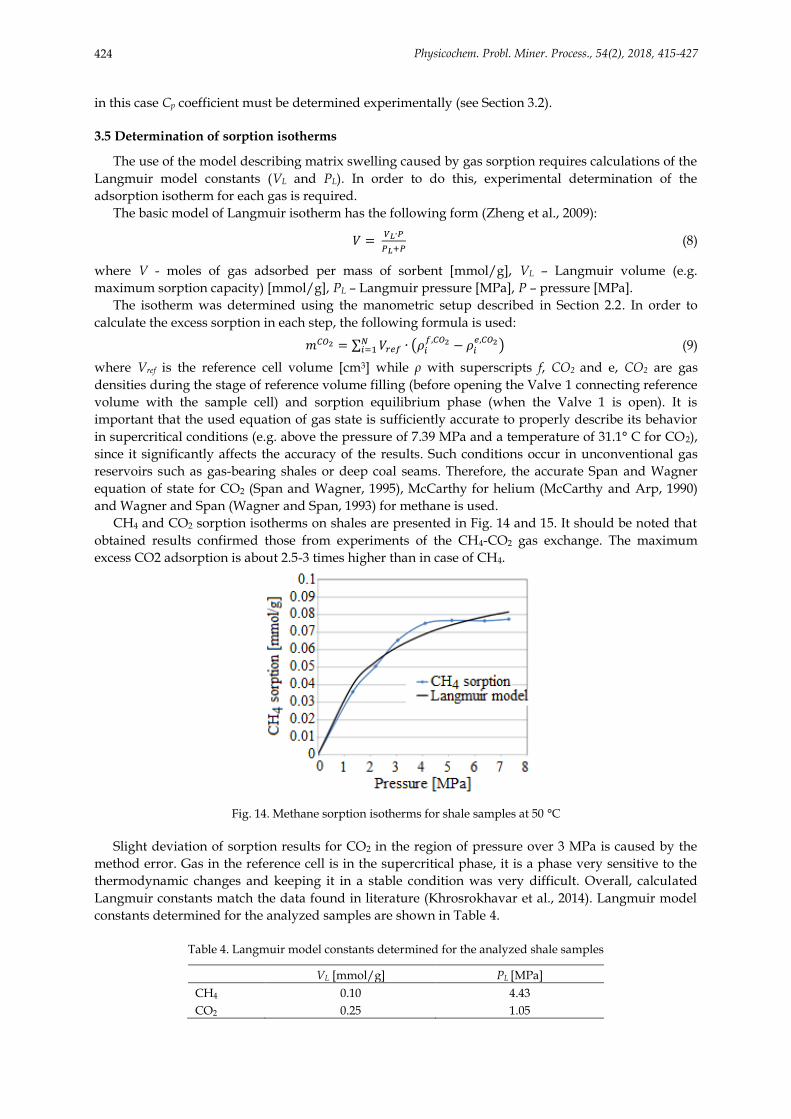
CH4 and CO2 sorption isotherms on shales are presented in Fig. 14 and 15. It should be noted that
obtained results confirmed those from experiments of the CH4-CO2 gas exchange. The maximum
excess CO2 adsorption is about 2.5-3 times higher than in case of CH4.
Fig. 14. Methane sorption isotherms for shale samples at 50 °C
Slight deviation of sorption results for CO2 in the region of pressure over 3 MPa is caused by the
method error. Gas in the reference cell is in the supercritical phase, it is a phase very sensitive to the
thermodynamic changes and keeping it in a stable condition was very difficult. Overall, calculated
Langmuir constants match the data found in literature (Khrosrokhavar et al., 2014). Langmuir model
constants determined for the analyzed samples are shown in Table 4.
Table 4. Langmuir model constants determined for the analyzed shale samples
VL [mmol/g] PL [MPa]
CH4 0.10 4.43
CO2 0.25 1.05

Physicochem. Probl. Miner. Process., 54(2), 2018, 415-427 425
Fig. 15. CO2 sorption isotherm for shale sample at 50 °C
Fig. 16. Test results for linear strain curves of shale sample
On the base of the determined Langmuir model constants, Cp coefficient and the matrix swelling
factor α, linear strain curves for each gas were determined (Fig. 16).
Additionally, linear strain was recalculated to volumetric strain and prediction of volumetric
strains for the pressure of 30-35 MPa (reservoir pressure of gas bearing shale horizons in Poland) was
made. The forecast presented on the background of experimental points is shown in Fig. 17.
Fig. 17. Comparison of volumetric strains of swelling shale sample modeled
with Seidle and Huitt model with experimental data
Calculated shale gas matrix swelling factors were compared with the coefficients of coal swelling
presented in Battistutta (2010) and the Langmuir constant VL in Table 5.
A comparison of obtained results with data for hard coal indicates that the matrix swelling
coefficients presented similar values but the swelling of shale sample is much lower because of the
lower sorption capacity. An interesting observation is that the shale gas matrix swelling coefficient α
for CH4 is greater than that for CO2. This is the opposite phenomenon than that observed for coals.

Physicochem. Probl. Miner. Process., 54(2), 2018, 415-427 426
However, very low values of Langmuir constant VL for CH4 caused that the swelling of the shale
sample was proportionally lower than for CO2 adsorption.
Table 5. Comparison of swelling coefficient α and Langmuir constant VL
for shale and coals (Durucan et al. 2008)
Flame coal Anthracite Silurian shale
Coefficient of matrix swelling (CH4) α, [kg/m3] 0.15-0.4 0.48-0.82 0.52
Coefficient of matrix swelling (CO2) α, [kg/m3] 0.3-0.8 0.5-1.6 0.24
Langmuir constant VL (average value), [dm3/kg] 6-14 16-25 2.4-6.1
4. Summary
The research led to the development of the full methodology of the swelling sorption
measurements of gas bearing shales induced by adsorption process. So far, such studies were
conducted only on hard coals. The processes of rock swelling are particularly important in case of
low-permeable rock formations, where additional processes of physical sorption may increase volume
of the rock matrix and as a consequence reduce permeability by closing the fracture aperture.
Finally, it can be concluded that for tested shale rocks the matrix swelling in case of CO2 adsorption
is greater than in case of CH4 adsorption. Next, the swelling value is directly proportional to the
adsorption and is about 5 to 10 times smaller than in case of coal. The calculated matrix swelling
factors α are approximately 0.2-0.5 kg/m3, where in case of coals those values are in the range of 0.2-
1.6 kg/m3. Sorption of methane and carbon dioxide in the gas-bearing shale is about 10-times lower
than in hard coals.
One of key findings of the study is that the Seidle and Huitt Model is suitable to describe the
processes of shale swelling.
The presented research is a part of a development of the technology of a shale gas recovery with
the use of CO2. Achieved results can have an impact on the gas recovery with the use of CO2 when
comparing to water-based fracturing methods.
Acknowledgements
The paper is supported by grant No BG2/DIOX4SHELL/14 titled “Development of guidelines for design of
innovative technology of shale gas recovery with the use of liquid CO2 on the base of numerical and experimental
research –DIOX4SHELL”, supported by the National Centre for Research and Development (NCBR) in years
2014-2017.
References
TSANG, C.-F., APPS, J.A., 2005, Underground Injection Science and Technology, Elsevier B.V.
BATTISTUTTA, E., VAN HEMERT, P., LUTYNSKI, M., BRUINING, H., WOLF, K.-H., 2010. Swelling and sorption
experiments on methane, nitrogen and carbon dioxide on dry Selar Cornish coal. Int. J. Coal Geol., 84, 39-48.
BRIGGS, D., 2003. Environmental pollution and the global burden of disease. British Medical Bulletin, 68, 1-24.
CIPOLLA, C.L., LOLON, E.P., ERDLE, J.C., RUBIN, B., 2009. Reservoir modeling in shale gas reservoirs. SPE125530,
Charleston, West Virginia.
CROSDALE, P.J., BEAMISH, B.B., VALIX, M., 1998. Coalbed methane sorption related to coal composition. Int. J. Coal
Geol., 35, 147-158.
DAHAGHI, K.A., 2010. Numerical Simulations and Modeling of Enhanced Gas Recovery and CO2 Sequestration in Shale
Gas Reservoirs. SPE, West Virginia University.
DAY, S., DUFFY, G., SAKUROVS, R., WEIR S., 2008. Effect of coal properties on CO2 sorption capacity under
supercritical conditions. Int. J. Greenhouse Gas Control, 2, 342-352.
DURUCAN, S., AHSANB, M., SHIA, J.-Q., 2008. Matrix shrinkage and swelling characteristics of European coals.
Energy Proc., 3055-3062.
DUTTA, P., HARPALANI, S., PRUSTY, B., 2008. Modeling of CO2 sorption on coal. Fuel, 87, 2023-2036.
EPA, 2016. Study of Hydraulic Fracturing and Its Potential Impact on Drinking Water Resources. www.epa.gov.pl.
Physicochem. Probl. Miner. Process., 54(2), 2018, 415-427 427
HILDENBRAND, A., KROOSS, B.M., BUSCH, A., GASCHNITZ, R., 2006. Evolution of methane sorption capacity of
coal seams as a function of burial history — a case study from the Campine Basin, NE Belgium. Int. J. Coal Geol., 66,
179-203.
HOL, S., GENSTERBLUM, Y., MASSAROTTO, P., 2014. Sorption and changes in bulk modulus of coal - experimental
evidence and governing mechanisms for CBM and ECBM applications. Int J. Coal Geol., 128-129, 119-133.
HOLLOWAY, S., KARIMJEE, A., AKAI, M., PIPATTI, R., RYPDAL., K., 2006. Carbon Dioxide Transport, Injection
and Geological Storage. IPCC Guidelines for National Greenhouse Gas Inventories.
JOUBERT, J.I., GREIN, C.T., BIENSTOCK, D., 1973. Sorption of methane in moist coal. Fuel, 52, 181-185.
KHOSROKHAVAR, R., WOLF, K.-H., BRUINING, H., 2014. Sorption of CH4 and CO2 on a carboniferous shale from
Belgium using a manometric setup. Int. J. Coal Geol., 128-129, 153-161.
KUILA, U., MCCARTY, D.K., DERKOWSKI, A., FISCHER, T.B., TOPÓR, T., PRASAD, M., 2014. Nano-scale texture
and porosity of organic matter and clay minerals in organic-rich mudrocks. Fuel, 135, 359-373.
MAJEWSKA, Z., CEGLARSKA-STEFAŃSKA, G., MAJEWSKI, S., ZIETEK, J., 2009. Binary gas sorption/desorption
experiments on a bituminous coal: Simultaneous measurements on sorption kinetics, volumetric strain and acoustic
emission. Int. J. of Coal Geol., 77, 90-102.
MAZUMDER, S., WOLF, K.H., 2008. Differential swelling and permeability change of coal in response to CO2 injection
for ECBM. SPE Asia Pacific Oil and Gas Conference and Exhibition “Gas Now: Delivering on Expectations”,
267-298.
MCCARTY, R.D., ARP, V.D., 1990. A New Wide Range Equation of State for Helium. Adv. Cryogen. Eng., 35, 1465-
1475.
REUCROFT, P.J., SETHURAMAN, A.R., 1987. Effect of pressure on carbon dioxide induced coal swelling. Energy Fuels,
1, 72-75.
ROGALA, A., KRZYSIEK, J., BERNACIAK, M., HUPKA, J., 2013. Non-Aqueous Fracturing Technologies for Shale Gas
Recovery. Physicochem. Probl. Miner. Process., 49, 313-322.
RUTTER, P., KEIRSTEAD, J., 2012. A brief history and the possible future of urban energy systems. Energy Policy, 50,
72-80.
SEIDLE, J.P., HUITT, L.G., 1995. Experimental Measurement of Coal Matrix Shrinkage due to Gas Desorption and
Implications for Cleat Matrix Increases. SPE Paper 30010.
SHOVKUN, I., ESPINOZA, D.N., 2017. Coupled fluid flow-geomechanics simulation in stress-sensitive coal and shale
reservoirs: Impact of desorption-induced stresses, shear failure, and fines migration. Fuel, 195, 260–272.
SPAN, R., WAGNER, W., 1995. A New Equation of State for Carbon Dioxide Covering the Fluid Region from the Triple-
point Temperature to 1100 K at Pressures up to 800 MPa. J. Phys. Chem. Ref. Data, 25, 1509-1596.
STAIB, G., SAKUROVS, R., GRAY, E.M., 2014. Kinetics of coal swelling in gases: Influence of gas pressure, gas type and
coal type. Int. J. Coal Geol., 132, 117-122.
SWAMI, V., SETTARI, A., 2013. A Numerical Model for Multi-mechanism flow in Shale Gas Reservoirs with Application
to Laboratory Scale Testing. SPE Paper 164840.
WAGNER, W., SPAN, R., 1993. Special Equations of State for Methane, Argon, and Nitrogen for the Temperature Range
from 270 to 350 K at Pressures up to 30 MPa. Int. J. Thermophys., 14, 699-725.
WANG, H.F., 2016. Theory of Linear Poroelasticity with Applications to Geomechanics and Hydrogeology. Princeton
University Press.
WANG, K., WANG, G., REN, T., CHENG, Y., 2014. Methane and CO2 sorption hysteresis on coal:
A critical review. Int. J. Coal Geol., 132, 60-80.
YAN, C., DENG, J., CHENG, Y., LI, M., FENG, Y., LI, X., 2017. Mechanical Properties of Gas Shale During Drilling
Operations. Rock Mech. Rock Eng., 50, 1-13.
ZHENG, H., LIUA, D., ZHENGA, Y, LIANG, S., LIUA, Y., 2009. Sorption isotherm and kinetic modeling of aniline on
Cr-bentonite. J. Hazard. Mater., 167, 141-147.


![[3] Compl Probl](https://img.dokumen.tips/doc/110x75/55cf8df5550346703b8d1701/3-compl-probl.jpg)