Embed Size (px)
Citation preview
Page 1 of 71
SRP SOP
November 9, 2012 Rev 1.05
EPA-454/B-13-002
STANDARD OPERATING PROCEDURES
FOR VERIFICATION OF EPA'S OZONE
STANDARD REFERENCE PHOTOMETER
Operations Manual
Page 2 of 71
SRP SOP
November 9, 2012 Rev 1.05
ACKNOWLEDGEMENTS
EPA would like to acknowledge the following for there contributions to the Standard Operating
Procedures for Verification Procedures of EPA's Ozone Standard Reference Photometer:
Scott Moore of USEPA-NRMRL-APPCD-RTP wrote several drafts and provided edits
Mike Crowe of the USEPA Region 4 Lab and the EPA Region 4 SRP operator, and Louie G.
Pounds, ILS/Region 4 ESAT Contractor, incorporated the edits of the various versions and also
proposed some of their own edits
Frank Gunther and Jim Norris, National Institute of Standards and Technology for their review
and insight
Mark Shanis- EPA-OAQPS
and the following SRP operators who provided comments and edits as needed:
EPA Regional SRP Operators
1 Mr. Chris St. Germain (SRP #9)
2 Mr. Avi Teitz (SRP #3)
4 Mr. Mike Crowe (SRP #10)
5 Mr Scott Hamilton (SRP #6)
6 Mr. John Lay (SRP #5)
7 Mr. Thien Bui (SRP #13)
8 Mr. Joshua Rickard (SRP #8)
9 Mr. Andy Lincoff (SRP #36)
California ARB
Mr. Jerry Freeman (SRP #4)
Page 3 of 71
SRP SOP
November 9, 2012 Rev 1.05
Table of Contents
1 INTRODUCTION ….………………………………………………………………Error!
Bookmark not defined.
1.1 Ozone Photometers Classified ……………………………………………...4 1.2 The NAAQS and Health Effects of Ozone .................................................................... 5,6 1.3 NIST Standard Reference Photometer (SRP) History .................................................... 6
2 THEORY OF PHOTOMETRIC MEASUREMENT10 ….……………………….10 2.1 Physical Basis Of The Photometry Equation ......................................................... 101-14 2.2 Sources Of Error In The Photometry Principle ........................................................ 1314 2.3 Photometric Measurements For Ozone ......................................................................... 15
3 SRP INITIAL SET-UP .............................................................................................19 3.1 Equipment and Supplies Needed ................................................................................... 19 3.2 SRP Initial Hardware Set-Up ........................................................................................ 21 3.3 SRP Initial Software Control Program Setup ............................................................... 26
4 OPERATION OF THE SRP ....................................................................................29 4.1 Health and Safety Precautions....................................................................................... 29 4.2 Performing Quality Control Checks .............................................................................. 29 4.3 Diagnostics/Scripts ......................................................................................................... 39
5 GUIDELINES FOR GUEST INSTRUMENT CONFIGURATION ....................41 5.1 Guest Instrument / SRP Software Configuration: ........................................................ 41 5.2 Guest Instrument Pneumatics Configuration ............................................................... 50 5.3 Examples of Common Commercial Instrument Configurations .................................. 52
6 SRP QUALITY ASSURANCE ................................................................................53 6.1 SRP Performance ........................................................................................................... 53 6.2 Routine Quality Control Checks .................................................................................... 53 6.3 Standby Level 2 Transfer Standard ............................................................................... 54 6.4 Verification of the SRP to SRP ...................................................................................... 54
7 SRP SYSTEM ADJUSTMENTS .............................................................................56 7.1 Adjustments of SRP Pressure Measurement ................................................................. 56 7.2 Adjustments of SRP Temperature Measurement .......................................................... 57 7.3 Adjustment of SRP UV Source Lamp Alignment .......................................................... 60 7.4 Adjustment of SRP UV Source Lamp Block Temperature ........................................... 61 7.5 Adjustment of SRP UV Source Lamp Power level ........................................................ 62 7.6 SRP Stability Measurement and Adjustment .................................................................. 62
7.7 Adjustment of SRP Dark Count Scaler Values ………………………………………… . 63
7.8 Adjustment of SRP Ozone Generator Block Temberature……………………............................65
8 TROUBLESHOOTING ……………………………………………………......64
9 MALFUNCTIONS ....................................................................................................68 10 SRP CONTROL SOFTWARE/ UPDATES ...........................................................69 11 REFERENCES ..........................................................................................................70
APPENDIX A …………….. ............................................................................................71 Example #1: Completed OCDS ................................................................................................. 71 Example #2: Excel™ Worksheet Template ................................................................................ 71 Example #3: Example Verification Summary Report ................................................................ 71 Example #4: Calibration Report to Client .................................................................................. 71 Example #5: Annual SRP to SRP Verification........................................................................... 71

Page 4 of 71
SRP SOP
November 9, 2012 Rev 1.05
1 INTRODUCTION
In ambient air monitoring applications, gas concentration standards are required for the calibration and
auditing of various ambient gas monitors. Because of the instability of ozone (O3), the certification of O3
concentrations as Standard Reference Materials (SRMs) is impossible. Therefore a Standard Reference
Photometer (SRP) was developed as a primary standard to validate the linearity of other photometers when
challenged with various concentrations of locally generated O3 gas. This document has been prepared to
assist the EPA (U.S. Environmental Protection Agency) operators of the NIST (National Institute of
Standards and Technology) Standard Reference Photometer (SRP) in terms of operation, repairs, and
verification. Also included is a brief history of the SRP development.
1.1 Ozone Photometers Classified
Ozone photometers (standards) can be classified into two basic groups: stationary and travelling standards.
A stationary O3 standard is an on-site unit that has been dynamically generated and assayed by ultraviolet
(UV) photometry in accordance with the procedures prescribed by the U.S. Environmental Protection
Agency under Title 40 of the Code of Federal Regulations, Part 50, Appendix D (40 CFR Part 50)1. An O3
travelling standard is a transported device or apparatus, which, together with associated operational
procedures, is capable of producing O3 concentrations and accurately analyzing O3 concentrations which are
quantitatively related to another O3 photometer.
In ambient air monitoring applications, precise O3 photometers called transfer standards are required for the
calibration of O3 analyzers. Therefore, an O3 standard must be generated and “verified” on site. When the
monitor to be calibrated is located at a remote monitoring site, it is necessary to use a transfer standard that is
traceable to a more authoritative standard. Traceability is “the property of the result of a measurement or
the value of a standard whereby it can be related to stated references, usually national or international
standards, through an unbroken chain of comparisons all having stated uncertainties” 2
(ISO).
A claim of traceability requires three elements:
1. A declaration of the source of traceability (e.g., NIST),
2. A full description of the traceability chain from the source to the measurement of interest, and
3. An uncertainty claim with supporting data. The responsibility for providing support for an
uncertainty claim rests with the entity making the claim (i.e., the provider), but the responsibility
for assessing the validity of such a claim rests with the consumer.
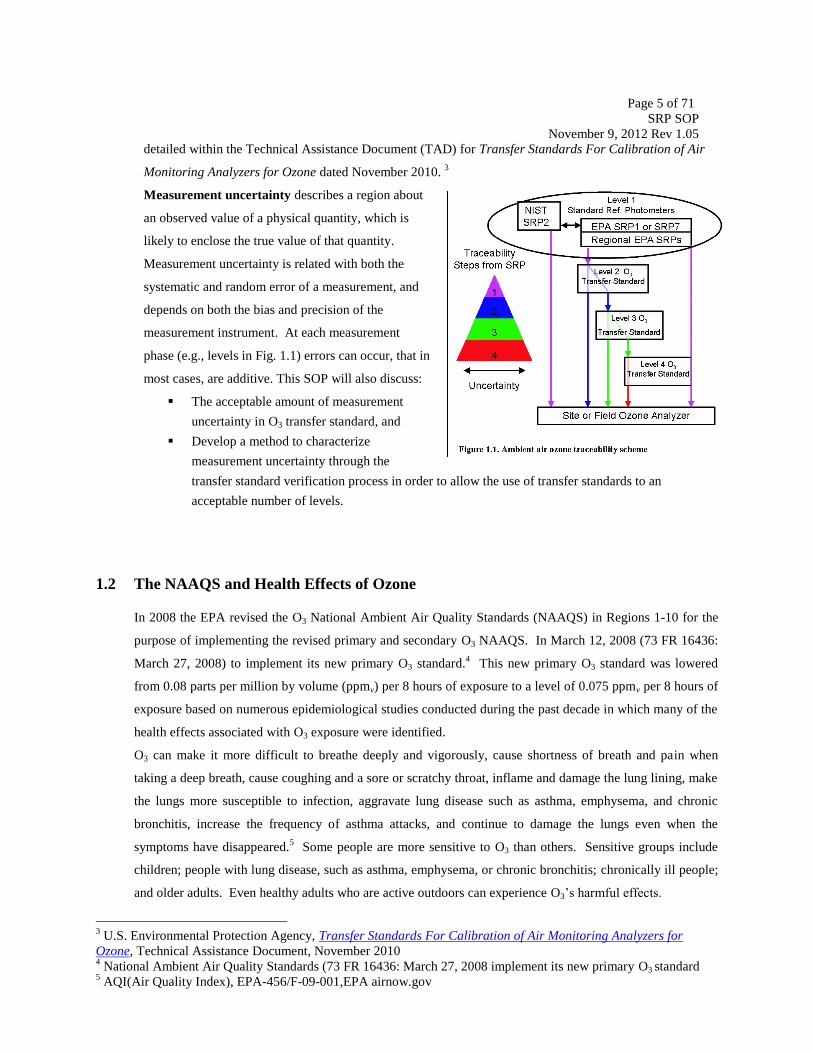
Figure 1.1 represents the scheme that will be employed to ensure that the use of O3 transfer standards is
applied in a manner that will ensure a specified level of measurement uncertainty and traceability. As
1 U.S. Environmental Protection Agency, Code of Federal Regulations, Title 40, Part 50, Appendix D, July 1, 2010
2 International Standards Organization (ISO) – International Vocabulary of Basic Terms in Metrology,
JCGM_200_2008.pdf, October 08, 2008
Page 5 of 71
SRP SOP
November 9, 2012 Rev 1.05
detailed within the Technical Assistance Document (TAD) for Transfer Standards For Calibration of Air
Monitoring Analyzers for Ozone dated November 2010. 3
Measurement uncertainty describes a region about
an observed value of a physical quantity, which is
likely to enclose the true value of that quantity.
Measurement uncertainty is related with both the
systematic and random error of a measurement, and
depends on both the bias and precision of the
measurement instrument. At each measurement
phase (e.g., levels in Fig. 1.1) errors can occur, that in
most cases, are additive. This SOP will also discuss:
The acceptable amount of measurement
uncertainty in O3 transfer standard, and
Develop a method to characterize
measurement uncertainty through the
transfer standard verification process in order to allow the use of transfer standards to an
acceptable number of levels.
1.2 The NAAQS and Health Effects of Ozone
In 2008 the EPA revised the O3 National Ambient Air Quality Standards (NAAQS) in Regions 1-10 for the
purpose of implementing the revised primary and secondary O3 NAAQS. In March 12, 2008 (73 FR 16436:
March 27, 2008) to implement its new primary O3 standard.4 This new primary O3 standard was lowered
from 0.08 parts per million by volume (ppmv) per 8 hours of exposure to a level of 0.075 ppmv per 8 hours of
exposure based on numerous epidemiological studies conducted during the past decade in which many of the
health effects associated with O3 exposure were identified.
O3 can make it more difficult to breathe deeply and vigorously, cause shortness of breath and pain when
taking a deep breath, cause coughing and a sore or scratchy throat, inflame and damage the lung lining, make
the lungs more susceptible to infection, aggravate lung disease such as asthma, emphysema, and chronic
bronchitis, increase the frequency of asthma attacks, and continue to damage the lungs even when the
symptoms have disappeared.5 Some people are more sensitive to O3 than others. Sensitive groups include
children; people with lung disease, such as asthma, emphysema, or chronic bronchitis; chronically ill people;
and older adults. Even healthy adults who are active outdoors can experience O3’s harmful effects.
3 U.S. Environmental Protection Agency, Transfer Standards For Calibration of Air Monitoring Analyzers for
Ozone, Technical Assistance Document, November 2010 4 National Ambient Air Quality Standards (73 FR 16436: March 27, 2008 implement its new primary O3 standard
5 AQI(Air Quality Index), EPA-456/F-09-001,EPA airnow.gov
Page 6 of 71
SRP SOP
November 9, 2012 Rev 1.05
1.3 NIST Standard Reference Photometer (SRP) History
A collaborative effort between NIST and EPA in the development of the original SRPs has become the basis
for O3 measurements globally. The SRP Program began in the early 1980’s as collaborative effort between
NIST and the EPA to design, construct, certify, and deploy a network of identical O3 reference instruments.
The design specifications called for an instrument with a standard uncertainty of ±2 nmol/mol (ppbv) in the
range of 0 nmol/mol to 100 nmol/mol and ±2% in the range of 100 nmol/mol to 1000 nmol/mol. Since the
SRPs have been deployed, beginning in 1983, the performance of all SRP’s has exceeded the design
specifications. In the US, two (2) SRPs are maintained by NIST, one serving as the NIST standard and the
other as a backup/travelling instrument. Eleven (11) additional SRPs are maintained by the EPA at various
EPA Regional laboratories across the United States to facilitate requests for local access to authoritative (ie,
NIST) reference standards. The current international network of SRPs total nearly fifty (50) worldwide that
now includes instruments maintained in at least fifteen (15) countries. The international network is
coordinated by the Bureau International des Poids et Mesures (BIPM) in France, which maintains the
international responsibility for the comparison of national O3 standards as the NIST does here in the United
States.
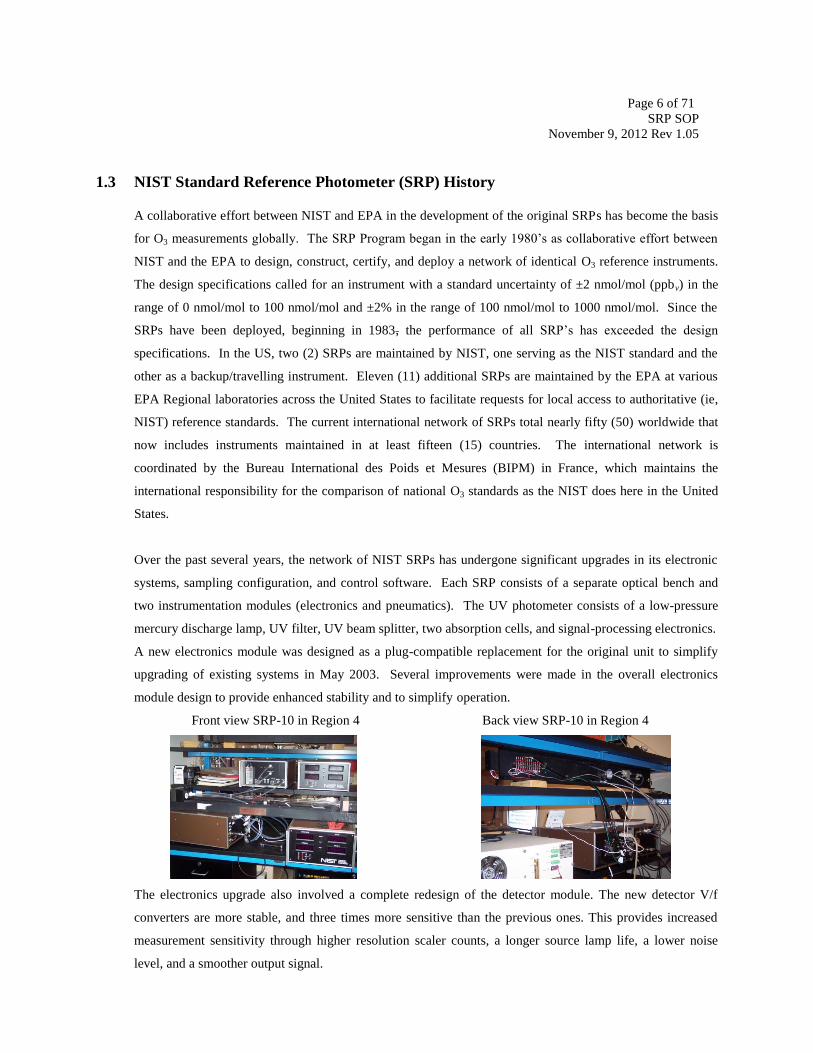
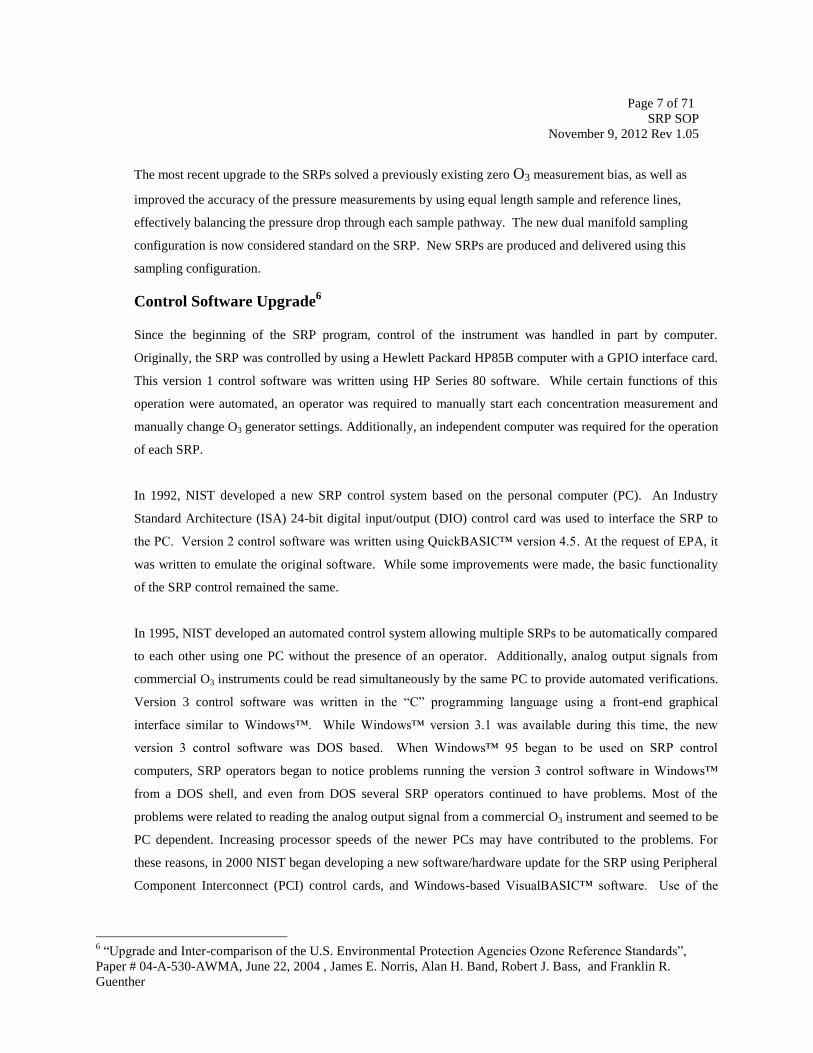
Over the past several years, the network of NIST SRPs has undergone significant upgrades in its electronic
systems, sampling configuration, and control software. Each SRP consists of a separate optical bench and
two instrumentation modules (electronics and pneumatics). The UV photometer consists of a low-pressure
mercury discharge lamp, UV filter, UV beam splitter, two absorption cells, and signal-processing electronics.
A new electronics module was designed as a plug-compatible replacement for the original unit to simplify
upgrading of existing systems in May 2003. Several improvements were made in the overall electronics
module design to provide enhanced stability and to simplify operation.
Front view SRP-10 in Region 4 Back view SRP-10 in Region 4
The electronics upgrade also involved a complete redesign of the detector module. The new detector V/f
converters are more stable, and three times more sensitive than the previous ones. This provides increased
measurement sensitivity through higher resolution scaler counts, a longer source lamp life, a lower noise
level, and a smoother output signal.
Page 7 of 71
SRP SOP
November 9, 2012 Rev 1.05
The most recent upgrade to the SRPs solved a previously existing zero O3 measurement bias, as well as
improved the accuracy of the pressure measurements by using equal length sample and reference lines,
effectively balancing the pressure drop through each sample pathway. The new dual manifold sampling
configuration is now considered standard on the SRP. New SRPs are produced and delivered using this
sampling configuration.
Control Software Upgrade6
Since the beginning of the SRP program, control of the instrument was handled in part by computer.
Originally, the SRP was controlled by using a Hewlett Packard HP85B computer with a GPIO interface card.
This version 1 control software was written using HP Series 80 software. While certain functions of this
operation were automated, an operator was required to manually start each concentration measurement and
manually change O3 generator settings. Additionally, an independent computer was required for the operation
of each SRP.
In 1992, NIST developed a new SRP control system based on the personal computer (PC). An Industry
Standard Architecture (ISA) 24-bit digital input/output (DIO) control card was used to interface the SRP to
the PC. Version 2 control software was written using QuickBASIC™ version 4.5. At the request of EPA, it
was written to emulate the original software. While some improvements were made, the basic functionality
of the SRP control remained the same.
In 1995, NIST developed an automated control system allowing multiple SRPs to be automatically compared
to each other using one PC without the presence of an operator. Additionally, analog output signals from
commercial O3 instruments could be read simultaneously by the same PC to provide automated verifications.
Version 3 control software was written in the “C” programming language using a front-end graphical
interface similar to Windows™. While Windows™ version 3.1 was available during this time, the new
version 3 control software was DOS based. When Windows™ 95 began to be used on SRP control
computers, SRP operators began to notice problems running the version 3 control software in Windows™
from a DOS shell, and even from DOS several SRP operators continued to have problems. Most of the
problems were related to reading the analog output signal from a commercial O3 instrument and seemed to be
PC dependent. Increasing processor speeds of the newer PCs may have contributed to the problems. For
these reasons, in 2000 NIST began developing a new software/hardware update for the SRP using Peripheral
Component Interconnect (PCI) control cards, and Windows-based VisualBASIC™ software. Use of the
6 “Upgrade and Inter-comparison of the U.S. Environmental Protection Agencies Ozone Reference Standards”,
Paper # 04-A-530-AWMA, June 22, 2004 , James E. Norris, Alan H. Band, Robert J. Bass, and Franklin R.
Guenther
Page 8 of 71
SRP SOP
November 9, 2012 Rev 1.05
version 4 SRP control system began at NIST in November 2001, and became available to all other SRP users
in April 2002.
Hardware
Use of the ISA bus in PCs has vanished and it became impossible to purchase a PC with ISA expansion slots
necessary for the operation of the version 3 software. A fourth generation control program for the SRP has
been developed by NIST. New software was required due to the unavailability of new computers with the
ISA bus. New computers are now available with the PCI bus only which means that the SRPs must now use
new PCI control cards. SRP owners who have the older software operating on older computers do not have
to upgrade, however NIST will no longer support the old software. A direct replacement of the ISA multi-
function card previously used was not available in a PCI version. The PCI replacement uses a different
connector so an additional signal distribution module was designed and produced to handle the new
connector used on the PCI card. This allowed continued use of existing SRP control cables. A direct
replacement for the 24-bit DIO card for controlling a guest SRP was available for PCI bus operation.
Software
The new software called “SRP Control” was written in VisualBasic™ version 6.0 and operates under the
Windows™ NT, 2000, or XP environment. The program works in conjunction with Excel™ 2003 (version -
xls) where all data collected from the program are automatically reported to templates, which can be
customized to suit the user’s needs. The templates can have additional macros performing specific
calculations or operations available in Excel™. The control system is operated using scripts, which call
lower-level functions embedded in the program. The user cannot modify the lower-level functions, but the
default scripts can be modified or new scripts written, to obtain customized system operations. This allows
the user to create custom program control without the possibility of corruption to the basic functions of the
SRP. Comparisons to an SRP can be done for up to three guest instruments (Level 2 transfer standards),
including multiple guest SRPs. The guest system data input can be via SRP digital interface, serial
communication, analog signal, or manual input of O3 concentrations from the guest instrument display.
Internal O3 generators available on some guest O3 instrumentation can be operated using serial
communication. Calibration methods created for specific instrumentation can be saved and recalled for
repeated use, or linked together in series to provide consecutive calibrations with different formats on the
same instrument. Network access to the control system providing some control functions is available, but
can be difficult to implement with network security systems.
The current version is 4.41 from NIST web site http://www.nist.gov/mml/analytical/gas/SRPpage.cfm
The next version is likely to be a LabView application. It is possible to connect SRP to SRP via USB
interface, however, additional hardware would need to be purchased and there is a known Ozone Lamp
voltage issue that limits the control of the Ozone Lamp from Zero-100% to Zero-50%.

Page 9 of 71
SRP SOP
November 9, 2012 Rev 1.05
Proposed Future Upgrades: Low voltage temperature STOWLAB cards to minimize a 0.2 deg C observed
temperature bias, four temperature sensors one each on the inlet and outlet of each of the cells, two pressure
transducers to measure the pressure from each cell and the LabView Control Software.
Page 10 of 71
SRP SOP
November 9, 2012 Rev 1.05
2 THEORY OF PHOTOMETRIC MEASUREMENT
This section provides a brief review of the theory of photometric measurements, and then details how the
SRP obtains and processes data in accordance with the photometric theory.
2.1 Physical Basis Of The Photometry Equation
Consider the transmission of light through a plane of area A that contains some number, n, of absorbing
molecules. If radiation of intensity Io is perpendicularly incident on the plane, and light of intensity I
emerges from the plane, the transmittance, T, of the plane is defined as:
T = I/Io
The transmittance is equal to:
1 - (fraction of light not transmitted)
or
1 - (area blocked by absorbing molecules)/(area of the plane, A)
The area blocked by the absorbing molecules is equal to the product of the area blocked by a single molecule
times the number of molecules, and the equation for the transmittance can be written as:
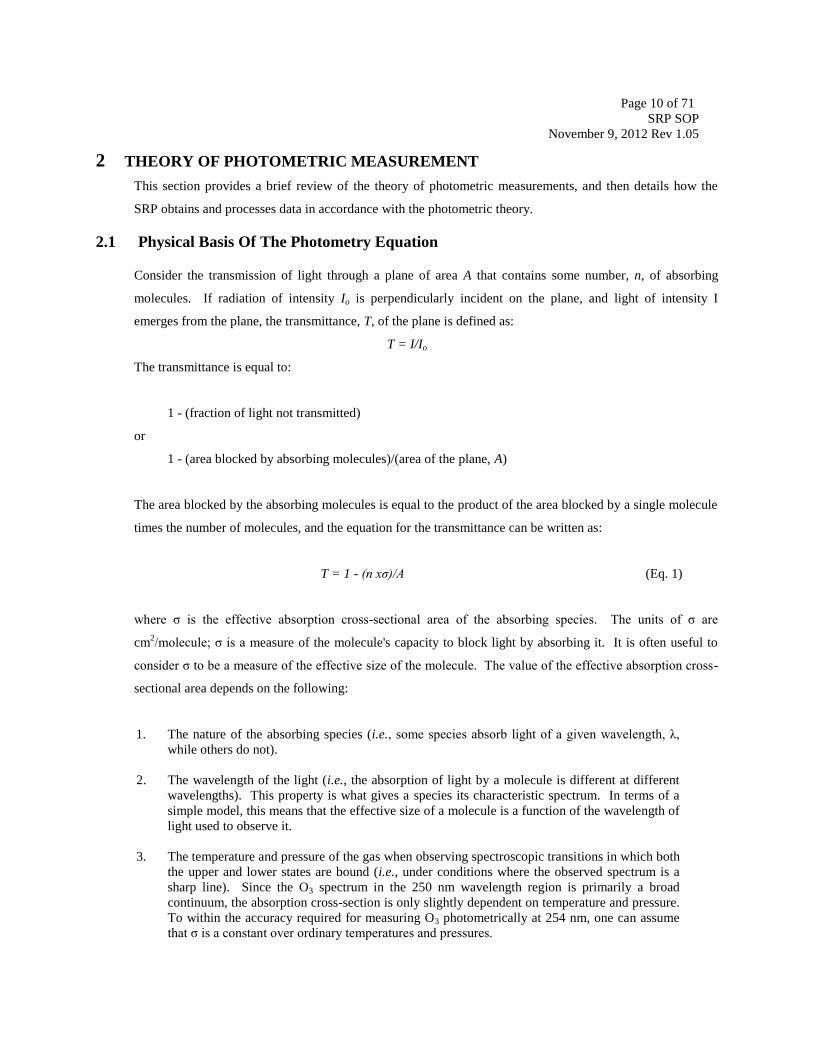
T = 1 - (n xσ)/A (Eq. 1)
where σ is the effective absorption cross-sectional area of the absorbing species. The units of σ are
cm2/molecule; σ is a measure of the molecule's capacity to block light by absorbing it. It is often useful to
consider σ to be a measure of the effective size of the molecule. The value of the effective absorption cross-
sectional area depends on the following:
1. The nature of the absorbing species (i.e., some species absorb light of a given wavelength, λ,
while others do not).
2. The wavelength of the light (i.e., the absorption of light by a molecule is different at different
wavelengths). This property is what gives a species its characteristic spectrum. In terms of a
simple model, this means that the effective size of a molecule is a function of the wavelength of
light used to observe it.
3. The temperature and pressure of the gas when observing spectroscopic transitions in which both
the upper and lower states are bound (i.e., under conditions where the observed spectrum is a
sharp line). Since the O3 spectrum in the 250 nm wavelength region is primarily a broad
continuum, the absorption cross-section is only slightly dependent on temperature and pressure.
To within the accuracy required for measuring O3 photometrically at 254 nm, one can assume
that σ is a constant over ordinary temperatures and pressures.
Page 11 of 71
SRP SOP
November 9, 2012 Rev 1.05
If one considers a sample cell, such as the sample cell in a photometer, as having a finite length in addition to
the area of the plane, Equation 1 can be rewritten as follows:
T = 1 - (n x σ x L)/(A x L) = 1 - (n x σ x L)/V (Eq. 2)
where L is the length of the sample cell and V is the volume of the sample cell. The term n/V is a
concentration in units of number density. The fact that the transmittance of a sample depends on the number
density of the absorbing species is convenient because it allows one to correct photometric measurements for
the temperature and pressure of the sample by simple gas law calculations.
Most chemists, air pollution technicians, and other workers making photometric measurements prefer to
express concentration in units of atmospheres (a concentration of 1 atm equals the concentration of a gas at 1
atmosphere of pressure and standard temperature of 0oC) and absorption coefficients in units of atm
-1 cm
-1
instead of molecules/cm3 and cm
2/molecule, respectively. The ideal gas law can be written as follows:
Therefore, Equation 2 can be changed to atmospheres by multiplying the number density term by RT and
dividing the absorption cross-section by the same factor. Letting:
And
Equation 2 becomes:
(Eq. 3)
Page 12 of 71
SRP SOP
November 9, 2012 Rev 1.05
This useful form of the photometry equation will be used later. First, consider the conditions for which the
equation was derived. A basic assumption in the derivation is that the fraction of the light beam blocked by
the absorbing molecules equals:
(n x σ)/A
Or that the cross-sectional area of the beam that is blocked is n x σ. This assumption is valid only if the
number of absorbing molecules in the sample is so small that one molecule never "shades" another. As soon
as one molecule begins to shade another, the cross-sectional area of the beam that is blocked by these two
molecules is less than 2 x σ.
To extend Equation 3 to the concentration and/or cell length range where significant shading of one molecule
by others occurs (i.e., the concentration range where one normally applies photometry), the length of the
absorption volume is divided into small segments, dL, such that there is no shading within any small
segment. The cumulative result is obtained by "adding" the intermediate result from each segment by
mathematical integration.
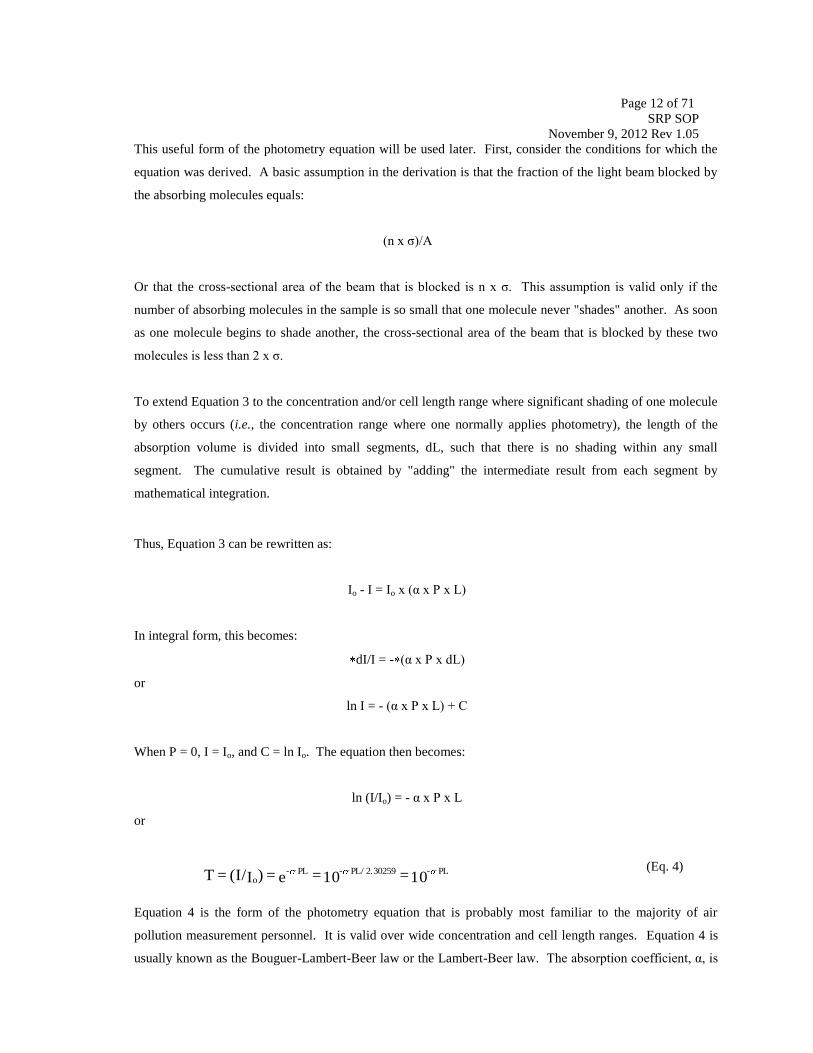
Thus, Equation 3 can be rewritten as:
Io - I = Io x (α x P x L)
In integral form, this becomes:
dI/I = - (α x P x dL)
or
ln I = - (α x P x L) + C
When P = 0, I = Io, and C = ln Io. The equation then becomes:
ln (I/Io) = - α x P x L
or
(Eq. 4)
Equation 4 is the form of the photometry equation that is probably most familiar to the majority of air
pollution measurement personnel. It is valid over wide concentration and cell length ranges. Equation 4 is
usually known as the Bouguer-Lambert-Beer law or the Lambert-Beer law. The absorption coefficient, α, is
10 = 10 = e = )I(I/ = T PL-2.30259PL/-PL-o

Page 13 of 71
SRP SOP
November 9, 2012 Rev 1.05
called the absorptivity and is usually written simply as α when working in base 10. The concentration is
normally designated by the letter c, and in most common usage, Equation 4 is written as follows:
T = (I/Io) = 10-αcL
= e-2.30259αcL
(Eq. 5)
Note that Equation 5 contains five terms (I, Io, α, c, and L), all of which can be measured. Furthermore, it is
the ratio of I to Io that is important rather than the absolute values of those quantities.
Frequently the Lambert-Beer law is written in logarithmic form with the term absorbance, A, often used to
represent - log T:
A = - log T = αcL
When the absorbance (i.e., the difference between I and Io) is very small (as is typically the case when
measuring the absorbance of sub-ppmv levels of O3), the Lambert-Beer law can be approximated in a linear
form:
T = (I/Io) = e-αcL
1 - αcL
since e-x
1 - x for x << 1. Note that this approximation is identical to Equation 3. The error introduced by
this approximation is not significant for O3 concentrations smaller than 2 ppmv (assuming a path length of
less than 1 m), as will be shown below.
2.2 Sources Of Error In The Photometry Principle
The relative error in the concentration measurement is related to the relative error in the determinations of α,
L, and T by the following equations:
(dc/c) = - (dα/α) (assuming no error in L or T)
(dc/c) = - (dL/L) (assuming no error in α or T)
(dc/c) = (dT/TlnT) (assuming no error in α or L)
The total error is the sum of these contributions.
The length of the optical path through the sample can normally be measured in a straightforward manner.
The relative error associated with L should not exceed 1 mm; this corresponds to an error of approximately
0.1%. The absorption coefficient for a given species is measured in separate experiments and is normally
Page 14 of 71
SRP SOP
November 9, 2012 Rev 1.05
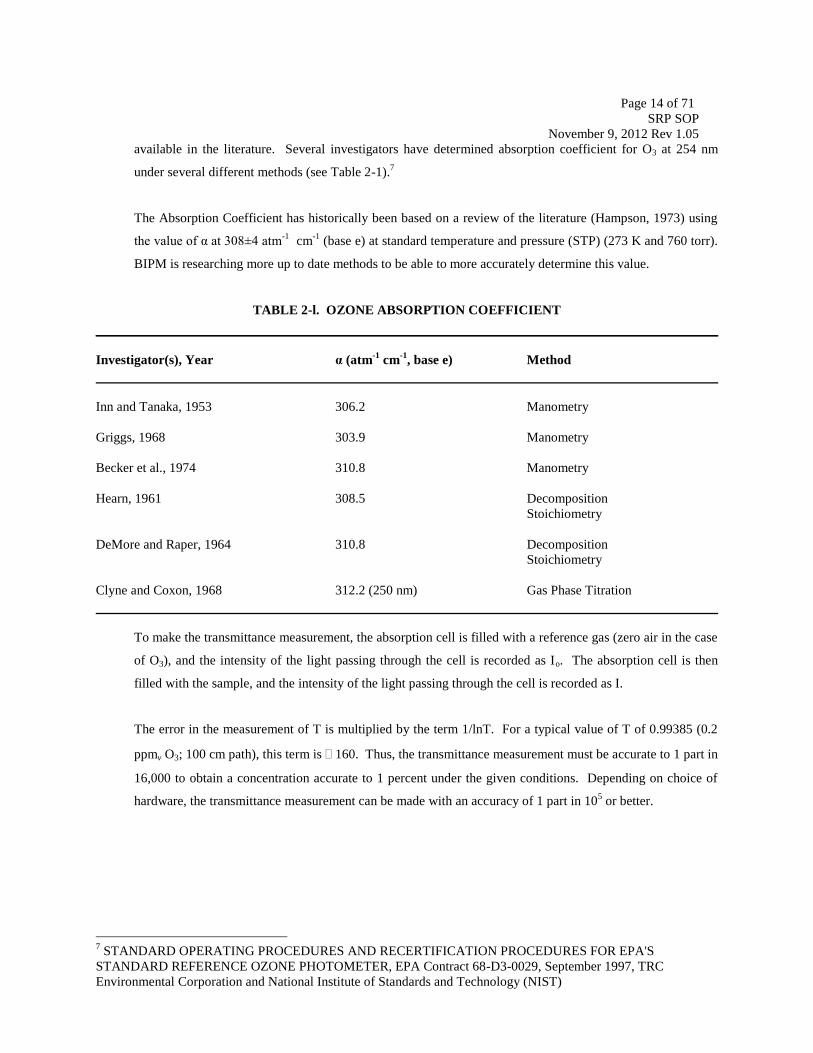
available in the literature. Several investigators have determined absorption coefficient for O3 at 254 nm
under several different methods (see Table 2-1).7
The Absorption Coefficient has historically been based on a review of the literature (Hampson, 1973) using
the value of α at 308±4 atm-1
cm-1
(base e) at standard temperature and pressure (STP) (273 K and 760 torr).
BIPM is researching more up to date methods to be able to more accurately determine this value.
TABLE 2-l. OZONE ABSORPTION COEFFICIENT
Investigator(s), Year α (atm-1
cm-1
, base e) Method
Inn and Tanaka, 1953 306.2 Manometry
Griggs, 1968 303.9 Manometry
Becker et al., 1974 310.8 Manometry
Hearn, 1961 308.5 Decomposition
Stoichiometry
DeMore and Raper, 1964 310.8 Decomposition
Stoichiometry
Clyne and Coxon, 1968 312.2 (250 nm) Gas Phase Titration
To make the transmittance measurement, the absorption cell is filled with a reference gas (zero air in the case
of O3), and the intensity of the light passing through the cell is recorded as Io. The absorption cell is then
filled with the sample, and the intensity of the light passing through the cell is recorded as I.
The error in the measurement of T is multiplied by the term 1/lnT. For a typical value of T of 0.99385 (0.2
ppmv O3; 100 cm path), this term is 160. Thus, the transmittance measurement must be accurate to 1 part in
16,000 to obtain a concentration accurate to 1 percent under the given conditions. Depending on choice of
hardware, the transmittance measurement can be made with an accuracy of 1 part in 105 or better.
7 STANDARD OPERATING PROCEDURES AND RECERTIFICATION PROCEDURES FOR EPA'S
STANDARD REFERENCE OZONE PHOTOMETER, EPA Contract 68-D3-0029, September 1997, TRC
Environmental Corporation and National Institute of Standards and Technology (NIST)
Page 15 of 71
SRP SOP
November 9, 2012 Rev 1.05
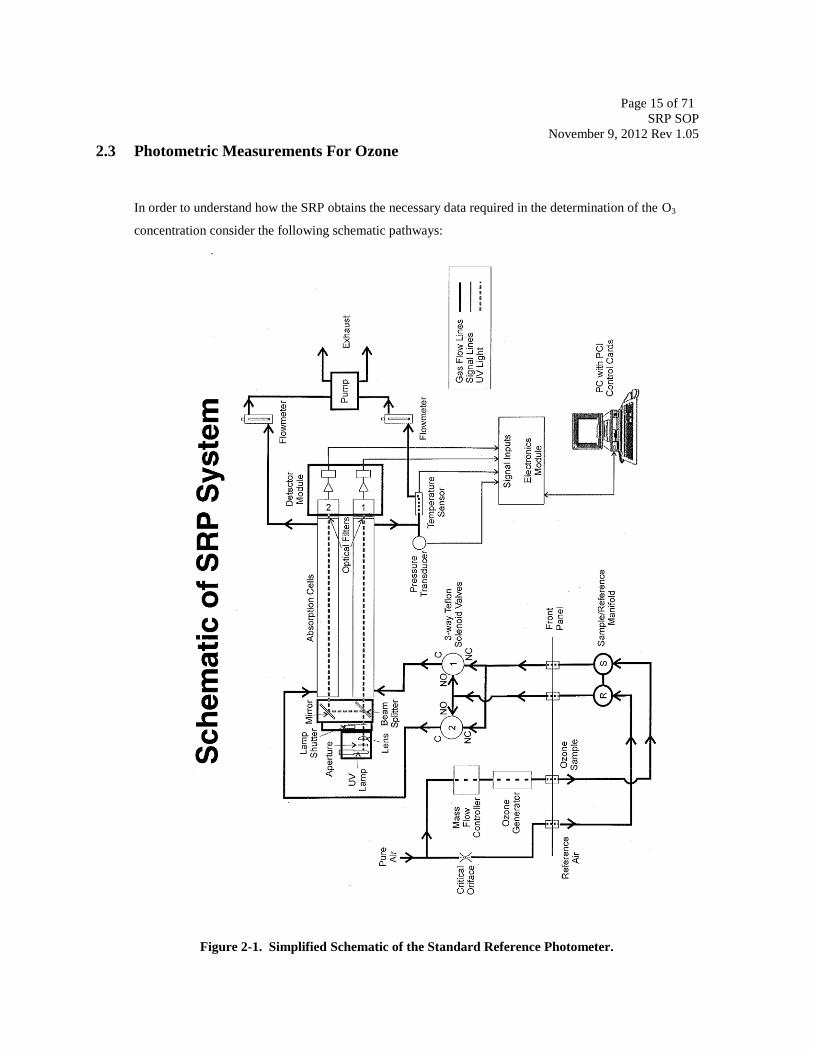
2.3 Photometric Measurements For Ozone
In order to understand how the SRP obtains the necessary data required in the determination of the O3
concentration consider the following schematic pathways:
Figure 2-1. Simplified Schematic of the Standard Reference Photometer.
Page 16 of 71
SRP SOP
November 9, 2012 Rev 1.05
The O3 concentration, c, is calculated from the expression:
T is the transmittance of the sample while the terms α (absorption coefficient) and L (path-length) are fixed
quantities with known uncertainties. The commonly accepted value of α, 1.147 x 10⁻¹⁷
cm2/molecule (or
equivalently 308.32 atm-1
cm-1
, base e) (3), is expressed at STP. The sample temperature and pressure are
measured, and the sample concentration is corrected using the ideal gas law.
A simplified schematic diagram of the SRP is given in Figure 2-1 showing the four frequencies (detector 1,
detector 2, temperature, and pressure) produced during each cycle of the measurement process. These
frequencies are integrated over five second periods by counting the total number of digital pulses with
counter circuitry. To determine the transmittance of the sample with high precision, the SRP is programmed
to alternately flow the sample through one cell and reference air through the second cell, and then flow the
sample through the second cell and reference air through the first cell.
The terms L and α have been measured and are known to sufficient accuracy. Since the value of α has been
reduced to STP, we need to measure the temperature and pressure so that the sample concentration can be
corrected to actual measurement conditions. The SRP converts all four quantities to be measured (I, Io,
temperature, and pressure) to frequencies that are integrated for five-second periods by counting the total
numbers of digital pulses with counter circuitry. In order to determine the transmittance of the sample with
high precision, the instrument alternately (1) flows the sample through one cell and zero air through the
second cell, and (2) flows the sample through the second cell and zero air through the first cell.
The frequencies obtained during the first half-cycle of the instrument are:
where f '1 and f '2 are average (nominal) frequencies, K is a factor which represents fluctuations in lamp
intensity, and Tcell(1) is the transmittance of cell 1. Similarly, during the second half-cycle, the frequencies
are:
T x fK = f cell(1)nom11
fK = f nom22
Page 17 of 71
SRP SOP
November 9, 2012 Rev 1.05
If one defines ratios R1 = f '1 /f '2 and R2 = f "1 /f "2 and then takes the ratio of the data from the two half-cycles, one
gets:
=
Upon cancelling like terms:
R = Tcell(1) x Tcell(2)
which is the transmittance of a sample cell of length equal to that of cell 1 plus cell 2.
The SRP calculates the ratio R from the frequencies f '1 , f "1 , f '2 , and f "2 . It then computes the concentration
from the equation:
c = LRln
Where c is the concentration in atmospheres, α is the O3 absorption coefficient at 254 nm (308.32 atm-1
cm-1
,
base e), and L is the cell path-length (89.65 cm). The SRP then applies a temperature/pressure correction
factor:
essureX
TempF
Pr25.1013
15.273
This adjusts the concentration to take into account that α was specified for STP conditions. Finally, the SRP
converts the concentration units from atmospheres to ppbV by multiplying by 109.
In order to speed up replicate measurements, the SRP retains the value of the last computed minor ratio (i.e.,
R1 or R2) and uses this information plus the minor ratio from the next half-cycle of the instrument to compute
a new concentration value. In this way, it is possible to obtain N values for the concentrations from (N + 1)
instrument half-cycles. For a more detailed decription on how the SRP calculates the Ozone concentration
see NIST 6963 “STANDARD REFERENCE PHOTOMETER FOR THE ASSAY OF OZONE IN
CALIBRATION ATMOSPHERS”.
fK = f nom11
T x fK = f cell(2)nom22

Page 18 of 71
SRP SOP
November 9, 2012 Rev 1.05

Page 19 of 71
SRP SOP
November 9, 2012 Rev 1.05
3 SRP INITIAL SET-UP
Each SRP consists of a separate optical bench and two instrumentation modules (electronics and
pneumatics). Modules are interfaced through the Peripheral Component Interconnect (PCI) control cards
interface cable, to the PC, and SRP Control Program for Windows NT/2000/XP Version 4.4.1, Windows-
based VisualBASIC™ software and allow for unattended tests runs. The new dual manifold sampling
configuration allows the SRP and up to three guest instruments to be connected at any one time using the
same sample and reference gas streams side-by-side.
SRP-10 with 3 guest instruments
3.1 Equipment and Supplies Needed
STOLabs PL-30oC or 100
oC temperature source (Calibration suggested once every two years.)
STOLab calibrators have been in use from the very beginning of the O3 program. Some operators have
reported that their calibrator has been unchecked for several years. Because of the cost of recertification of
a single calibrator, a comparison can be made to a recently certified calibrator. If the differences between
the two calibrators are less than the established limits for the SRP then the calibrator can be used for
another year. If it fails, it should be returned promptly to StowLab for repairs. Voltmeter (Accurate to ±0.1 mV, NIST traceable annually) Pressure standard (Druck DPI-705 or equivalent, Accurate to ±0.1 millibar (mb) NIST traceable annually)
Temperature standard (Accurate to ±0.1 °C, NIST traceable annually) NOTE: The StowLab is the
calibration for the RTD that reads the temperature of the sample and is the most critical temperature
measurement. The temperature of the heated blocks should be checked but stability of this temperature is
more critical than accuracy, as well as the room temperature.
OPTIONAL Commercial O3 calibrator (TEI 49C Calibrator) or SRP can generate O3 to supplies each
guest Zero Air System (Teledyne Model 701) or equivalent (0 - 20 SLPM @ 0 - 30 p.s.i., Dewpoint <20oC
Page 20 of 71
SRP SOP
November 9, 2012 Rev 1.05
@ 10 LPM, <10oC @ 20 LPM, <-20
oC up to 15 SLPM, <-10
oC up to 20 SLPM, OUTPUT
CONCENTRATIONS (MAX.): SO2 NO NO2 H2S TRS O3 < 0.5 ppb CO < 0.025 ppm, Hydrocarbons <
0.02 ppm. NOTE: There are, surprisingly, no NIST Standards for Zero Air and unless you have the trace
ability to measure CO, CO2, NOX and HC it will be difficult to know if your system is working well.
There are, however a couple of tests you can perform to see how your SRP is working with your Zero Air
source. The first is to set your Ozone concentration to 1000 ppb and see how well it will stabilize,
assuming all is well with your SRP. If it can hold that high concentration with a Standard Deviation of less
than 0.7 for an indefinite period of time, then it is acceptable. Ozone instability of the high level Ozone can
be an indication of minute pressure fluctuations in the Zero Air source. An additional pressure regulator
between the Zero Air Source and the SRP may be needed. In addition, you can use a tank of Certified Zero
Air for your SRP and then sample your Zero Air with the Sample Line. The Ozone concentration should
be Zero.
NIST Specification for Zero Air http://www.nist.gov/calibrations/ozone-measurements.cfm
Air Supply: Minimum input pressure of 15 psig (34.7 psia, 239.2 kPa) of clean, dry air.
Preferably, zero air containing no significant impurities, having less than 1 ppm (parts per
million) total hydrocarbons by volume, and containing 20 - 21% oxygen. The NIST SRP has
internal devices to control the amount of air required for operation. No external control is
necessary. A zero air supply of 20 standard liters/min. (SLPM) will be adequate for most
calibration work. These units are available through commercial suppliers of air monitoring
equipment.
An SRP draws 2 SLPM into each cell (4 SLPM total), plus some excess is required in the sample
and reference manifolds, and additional flow requirements for instruments under calibration.
Page 21 of 71
SRP SOP
November 9, 2012 Rev 1.05
3.2 SRP Initial Hardware Set-Up
3.2.1 Unpacking SRP-07 for Verification
Carefully remove electronics module from the Starligh shipping container and place it on the
bench top to be used for the SRP. Please note which container the electronics module is in
because the foam is cut specifically for this module. If the case had been shipped from a low
pressure region to a higher pressure region, it will be necessary to equlize the pressure from
the case by opening the pressure relief valce on the front of the Starlight case.
Carefully remove the pneumatics module from the Starlight shipping container and place it to
the right of the electronics module leaving about 14 to15 inches between them. Please note
which container the pneumatics module is in because the foam is cut specifically for this
module. If the case had been shipped from a low pressure region to a higher pressure region,
it will be necessary to equlize the pressure from the case by opening the pressure relief valce
on the front of the Starlight case.
Remove all miscellaneous items from the shipping container’s center storage area and lay out
on a table so specific items can be easily found.
Carefully remove the optical bench from the optical bench shipping container and place
upside down across the electronics and pneumatics modules resting on the optical bench pads,
or a suitable table surface. SRP-07 has a Plexiglass plate attached to the bottom of the cell to
keep all the fitting safely tucked away during shipping. Remove the screws and Plexiglass
plate and set them to the side during operation.
Carefully flip the optical bench over to the right side up position allowing the cables and lines
to fall between the electronics and pneumatics modules. It is possible, but not recommended,
to run the cell laying down on its side. Care needs to be taken not to bend the tubing too
much and to place some for of vibration dampening under the cell.
Find the 2 optical bench pads and place one on the back outside edge of both the electronics
module and the pneumatics module to support the optical bench stand. This was the standard
setup for earlier versions of the SRPs, however, many of the operators have acquired stands
for their SRP and the visiting SRP-07. EPA RTP has also supplied an SRP stand that is
different from the NIST Stand to many of the operators. An optional Optical Bench Stand can
be purchased from NIST or you can make your own, just be sure to insulate the Optical Bench
from any vibrations to the SRP modules.
3.2.2 Connecting Electronics Signal Cables
Remove the cable ties holding the cables and Teflon lines and allow them to hang freely off
the back.
Connect the “J2", “J3", “pressure”, and “temperature” cables to the rear of the electronics
module. If the marking on the cable is unclear then look at the plug and count the number of
pins in the socket and then look at J2 and J3 and find the corresponding number of pins and it
should be a match. Never try to force a connector into place. Also, plug the ground wire into
the Banana Socket on the back of this module.
From the table where the other parts are, find the cables marked detector and “J1".
Page 22 of 71
SRP SOP
November 9, 2012 Rev 1.05
Connect the “J1" cable from the rear of the electronics module to the rear of the pneumatics
module.
Connect the Detector cable, and the Scaler 1 and 2 cables from the rear of the electronics
module to the SRP Detector module mounted on the right hand side of the optical bench.
NOTE: This is for a new setup-Locate the Signal Distribution Module and Signal
Distribution Ribbon Cable from the miscellaneous items.
NOTE: This is for a new setup-Connect either end of the Signal Distribution Ribbon Cable to
the 100 pin connector on the Signal Distribution Module labelled “COMPUTER”. Make
sure the white arrows on both connectors line up to each other. WARNING: Plugging
this cable in backward will create a shock hazard and potentially start a fire. All of the
equipment should be powered down at this point.
NOTE: The following stems are is for a new setup-Connect the other end of the Signal
Distribution Ribbon Cable to the 100 pin connector on the PCI-DAS 1001 circuit board
installed in the PC. Make sure the white arrows on both connectors line up to each other.
If there is any doubt, contact the O3 SRP Laboratory Support for additional help.
Locate the 1.5 meter cable with the female 37 pin connector to a female 37 pin connector
from among the miscellaneous items on the table supplied with SRP. NOTE: If not using the
cable supplied with your instrument, make sure that the pin-out is straight through (ie pin 1 to
pin1, pin 2 to pin 2, & so on.)
Locate the “J4" cable assembly from the miscellaneous items on the table. NOTE: It is a
common mistake to forget this cable. The symptoms of not having this cable in place will be
loss of automatic control of the O3 Mass flow Controller and Automatic Control of the Lamp
% Power. If this has happened, you may need to shut down the software and reboot the
computer and the SRP in order to regain full functionality.
Locate the small blue junction box with the six sets of red and black banana jacks on top from
the miscellaneous items on the table.
Locate the cream colored connector box with three ports labeled “ANALOG”, for the guest
SRP; this is the Analog/Computer/Digital Connector Box (ACD Box).
Connect the female 37 pin cable to the male 37 pin port labeled “Analog” on the junction box.
Connect the other end of this 1.5 meter cable to the blue junction box, where it is labeled
“Digital”. . NOTE: If not using the cable supplied with your instrument, make sure that the
pin-out is straight through (ie pin 1 to pin1, pin 2 to pin 2, & so on.)
Connect the “J4" connector cable and “clip” it into the “Computer” port on the junction box.
Connect the other end to the back of the computer in the slot configured with its port.
Connect the female 37 pin “D” connector end to the Signal Distribution Module 37 pin “D”
connector labelled “DIGITAL”.
Connect the male 37 pin “D” connector end to the rear of the SRP Electronics Module
labelled “Interface”.
Connect Power Cable to rear of Electronics Module (100-120 VAC required).
Page 23 of 71
SRP SOP
November 9, 2012 Rev 1.05
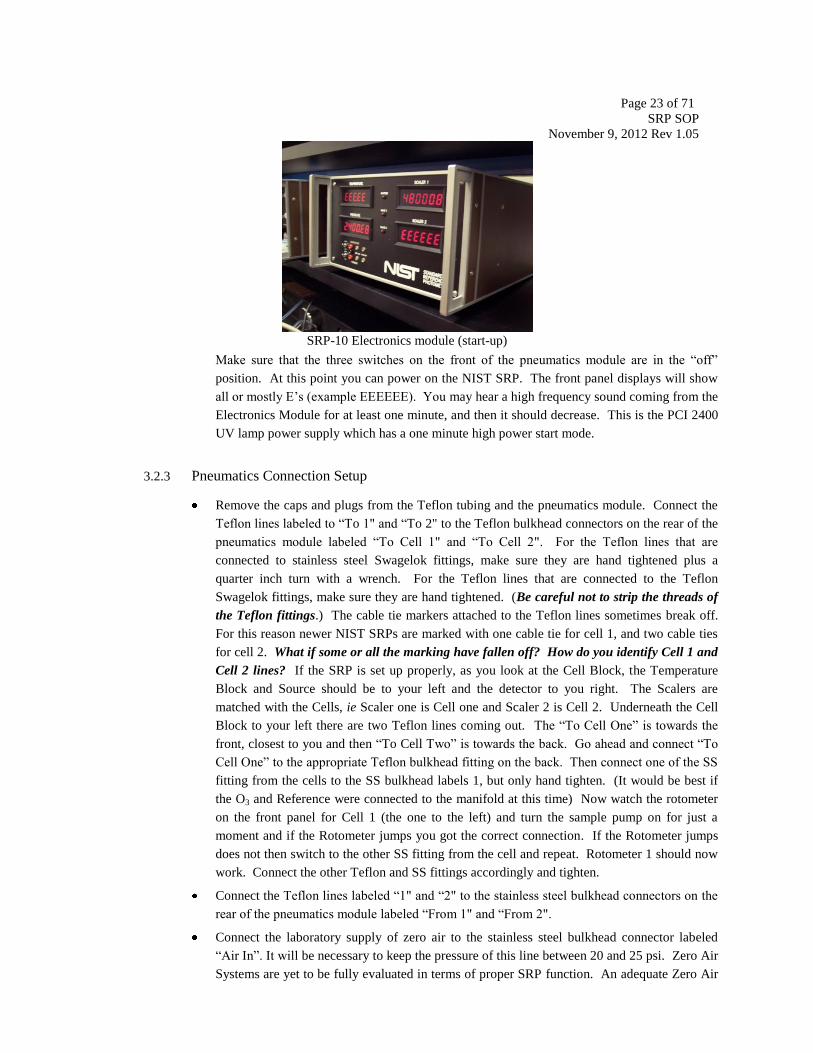
SRP-10 Electronics module (start-up)
Make sure that the three switches on the front of the pneumatics module are in the “off”
position. At this point you can power on the NIST SRP. The front panel displays will show
all or mostly E’s (example EEEEEE). You may hear a high frequency sound coming from the
Electronics Module for at least one minute, and then it should decrease. This is the PCI 2400
UV lamp power supply which has a one minute high power start mode.
3.2.3 Pneumatics Connection Setup
Remove the caps and plugs from the Teflon tubing and the pneumatics module. Connect the
Teflon lines labeled to “To 1" and “To 2" to the Teflon bulkhead connectors on the rear of the
pneumatics module labeled “To Cell 1" and “To Cell 2". For the Teflon lines that are
connected to stainless steel Swagelok fittings, make sure they are hand tightened plus a
quarter inch turn with a wrench. For the Teflon lines that are connected to the Teflon
Swagelok fittings, make sure they are hand tightened. (Be careful not to strip the threads of
the Teflon fittings.) The cable tie markers attached to the Teflon lines sometimes break off.
For this reason newer NIST SRPs are marked with one cable tie for cell 1, and two cable ties
for cell 2. What if some or all the marking have fallen off? How do you identify Cell 1 and
Cell 2 lines? If the SRP is set up properly, as you look at the Cell Block, the Temperature
Block and Source should be to your left and the detector to you right. The Scalers are
matched with the Cells, ie Scaler one is Cell one and Scaler 2 is Cell 2. Underneath the Cell
Block to your left there are two Teflon lines coming out. The “To Cell One” is towards the
front, closest to you and then “To Cell Two” is towards the back. Go ahead and connect “To
Cell One” to the appropriate Teflon bulkhead fitting on the back. Then connect one of the SS
fitting from the cells to the SS bulkhead labels 1, but only hand tighten. (It would be best if
the O3 and Reference were connected to the manifold at this time) Now watch the rotometer
on the front panel for Cell 1 (the one to the left) and turn the sample pump on for just a
moment and if the Rotometer jumps you got the correct connection. If the Rotometer jumps
does not then switch to the other SS fitting from the cell and repeat. Rotometer 1 should now
work. Connect the other Teflon and SS fittings accordingly and tighten.
Connect the Teflon lines labeled “1" and “2" to the stainless steel bulkhead connectors on the
rear of the pneumatics module labeled “From 1" and “From 2".
Connect the laboratory supply of zero air to the stainless steel bulkhead connector labeled
“Air In”. It will be necessary to keep the pressure of this line between 20 and 25 psi. Zero Air
Systems are yet to be fully evaluated in terms of proper SRP function. An adequate Zero Air
Page 24 of 71
SRP SOP
November 9, 2012 Rev 1.05
Generator should be able to supply up to 30 liters per minute at 35 PSI. Most any brand-
named Zero Air generator should work well. A note should be mentioned here about the
commonly used AADCO 737 Zero Air Generator. During the scrubbing process it alternately
will scrub out the O2 and N2 and then re-mix them alternately. This process causes the O3
concentration to alternate high and then low. Therefore when generating high O3
concentration you could end up with undesired stability issues. The solution to this is an
optional part from AADCO called a Mixer/Receiver that will remix the O2 and N2 at stable
concentrations. A check that can be done to verify your Zero air supply would be to buy a
tank of zero air and set up a purge line directly to the manifold and replace either the
“reference in” or the “O3 in” and then run some zero readings from the two different sources.
If you get an unusually high or low Zero then there is an issue. If the Zero looks good, then it
is good. NIST is looking into a test method for qualifying Zero Air Systems but it is not yet
available.
Locate the glass Dual External Manifold and remove it from plastic bag.
Using a 3-finger laboratory clamp and mounting pole with stand, mount the Dual External
Manifold and place near SRP Pneumatics Module.
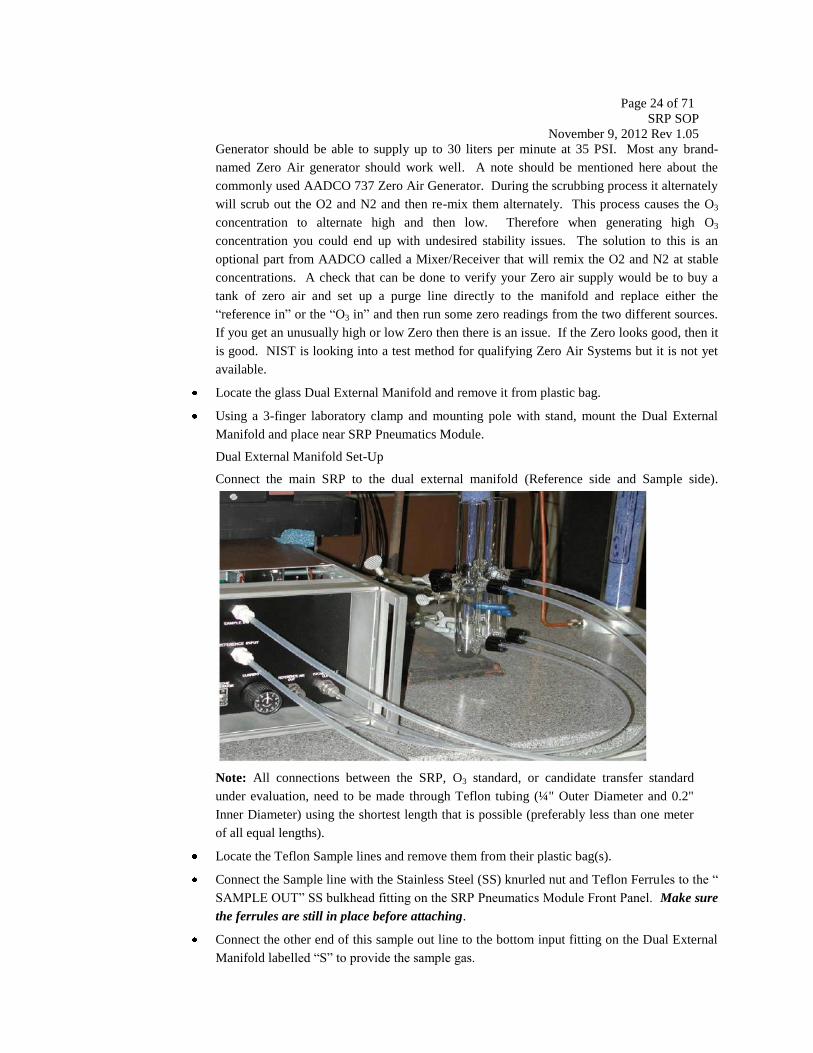
Dual External Manifold Set-Up
Connect the main SRP to the dual external manifold (Reference side and Sample side).
Note: All connections between the SRP, O3 standard, or candidate transfer standard
under evaluation, need to be made through Teflon tubing (¼" Outer Diameter and 0.2"
Inner Diameter) using the shortest length that is possible (preferably less than one meter
of all equal lengths).
Locate the Teflon Sample lines and remove them from their plastic bag(s).
Connect the Sample line with the Stainless Steel (SS) knurled nut and Teflon Ferrules to the “
SAMPLE OUT” SS bulkhead fitting on the SRP Pneumatics Module Front Panel. Make sure
the ferrules are still in place before attaching.
Connect the other end of this sample out line to the bottom input fitting on the Dual External
Manifold labelled “S” to provide the sample gas.

Page 25 of 71
SRP SOP
November 9, 2012 Rev 1.05
Connect the Sample line with the Teflon nut and ferrules to the “SAMPLE INPUT” Teflon
bulkhead fitting on the SRP Pneumatics Module Front Panel. Make sure the ferrules are still
in place before attaching. Be careful not to strip the threads of the Teflon fittings.
Connect the other end of this sample input line to any of the four fittings on the Dual External
Manifold labelled “S”.
Locate the Teflon Reference lines and remove them from their plastic bag(s).
Connect the Reference line with the Stainless Steel (SS) knurled nut and Teflon Ferrules to
the “REFERENCE AIR OUT” SS bulkhead fitting on the SRP Pneumatics Module Front
Panel. Make sure the ferrules are still in place before attaching.
Connect the other end of this reference out line to the bottom input fitting on the Dual
External Manifold labelled “R” to provide the reference gas.
Connect the Reference line with the Teflon nut and ferrules to the “REFERENCE INPUT”
Teflon bulkhead fitting on the SRP Pneumatics Module Front Panel. Make sure the ferrules
are still in place before attaching. Be careful not to strip the threads of the Teflon fittings.
Connect the other end of this reference input line to any of the four fittings on the Dual
External Manifold labelled “R”.
Clean, dry air at 20 to 25 pounds per square inch gas (psig) needs to be supplied to the rear of
the SRP pneumatics module. The critical (flow limiting) orifice inside the SRP pneumatic
module has been designed to provide approximately 7 to 9 Liters per minute (LPM) of zero
air to the zero air dual external manifold reference “R” inlet. The “inlet” on the reference side
of the dual manifold is the lower outlet.
Remember that when the solenoid valves (A and B) are off and the pump is on, each line
(sample and reference) draws 2 LPM from the zero air source, for a total of 4 LPM per SRP.
When conducting Level 2 verifications, approximately 2 LPM of zero air will be needed for
each guest instrument, along with 1 LPM of excess. Verify that the SRP supply air is greater
than the sum of all the guest instruments to prevent room air from being drawn into the
manifold. Check with a stopcock attached to a flow meter to make sure there is adequate
venting at the top of the glass dual external manifold. Note: At end of run, or when the valves
are off, more air is needed in the reference manifold.
Check to see if power supply for mass flow controller of about 15 V is met. The actual flow
from the MFC can be read from the black and red jacks on the back of the Pneumonic
Module. This is a 0 to 10 LPM MFC and the voltage output is 0 to 5 Volts. Therefore a flow
of about 6 LPM would be about 3.0 Volts. This MFC has been observed to work as low as
5.0 psig but it is not advised to run that low as this may severely limit the Reference Air in.
3.2.4 SRP Warm-Up Time
If not previously completed, plug in the power cable and place the power switch on the electronics
module in the “on” position. Allow the SRP an initial warm-up time period of at least four hours
for the system to become fully stable. Normally the SRP would be left on after the initial setup
with the modules kept in idle mode (all pump module switches in “off” position) until needed for a
Level 2 verification or any routine system characteristics data checks.

Page 26 of 71
SRP SOP
November 9, 2012 Rev 1.05
3.3 SRP Initial Software Control Program Setup
NIST software Version 4.4.1 of the SRP Control Program should already be loaded on PC within program
files directory under Windows as SRP2002 directory which includes the following sub-directories Data,
Docs, drivers, Guest, Methods, scripts, and Templates.
3.3.1 Save Shortcut to SRPControl.exe Program
Save shortcut to program either to the desktop or start menu line to allow easy start-up of the
operating system.
Select: SRPControl.exc (green icon) found on the PC screen either located on the
desktop or placed in the menu bar. Double clicking on icon will load the software program that
controls the NIST SRP and up to three guest instruments. The guest instruments may be another
SRP, have analog signal output, serial port communications, or require manual entry of the O3
data. The program is capable of verifying the guest instruments with the primary SRP using the
SRP internal O3 generator, or a guest instrument’s O3 generator (not recommended). It is also
Page 27 of 71
SRP SOP
November 9, 2012 Rev 1.05
possible to setup the program to run verifications unattended, even linking different verification
methods such that lengthy verifications may be performed overnight. Verification results are
reported through a Microsoft Excel™ spreadsheet, and printed on a windows compatible printer.
Currently all of the operators are using Excel™ 2003. The Agency standard is Excel™ 2007.
This has created some issues with some of the operators. The solution may be to go into the
template and then select File Save As and Create a new name for the template and to tell it to save
as Excel™ 2003 and then to use this as your template, however this has not yet been tested or
verified. In addition, the program is capable of being controlled by a remote computer connected
to a network, or reporting results over the network to another computer (see Appendix B).
During routine operation of the SRP, various types of O3 transfer standards will be interfaced with
the SRP. Regardless of the configurations that will be used, there needs to be sufficient flows of
both zero air and sample supplied to each photometer. Consult Section 3.2.3 in this document for
further guidance regarding these interface and flow requirements.
3.3.2 Using the “Standard Reference Photometer”, software will allow for manual or automatic O3
generator settings. For computer-controlled settings, make sure that the pneumatics module has
been adjusted so that the switches are set appropriately. For example, for automatic settings,
“Automatic” should be switched to “ON” for the O3 generator settings to be selected by the
computer automatically or “Automatic” should be switched to “ON” for the O3 flow settings to be
selected by the computer automatically. For manual settings, the switch should be placed in the
“OFF” setting then pneumatic front panel Current Level knob dial in manual setting (normally not
used).
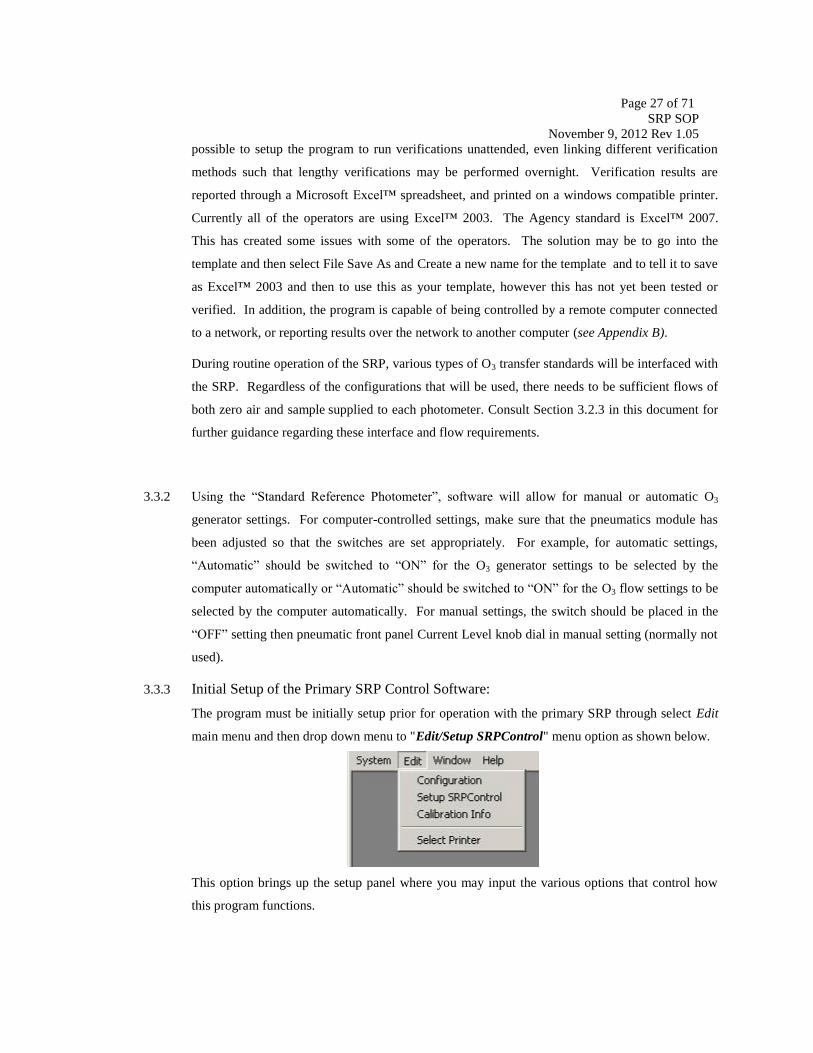
3.3.3 Initial Setup of the Primary SRP Control Software:
The program must be initially setup prior for operation with the primary SRP through select Edit
main menu and then drop down menu to "Edit/Setup SRPControl" menu option as shown below.
This option brings up the setup panel where you may input the various options that control how
this program functions.
Page 28 of 71
SRP SOP
November 9, 2012 Rev 1.05
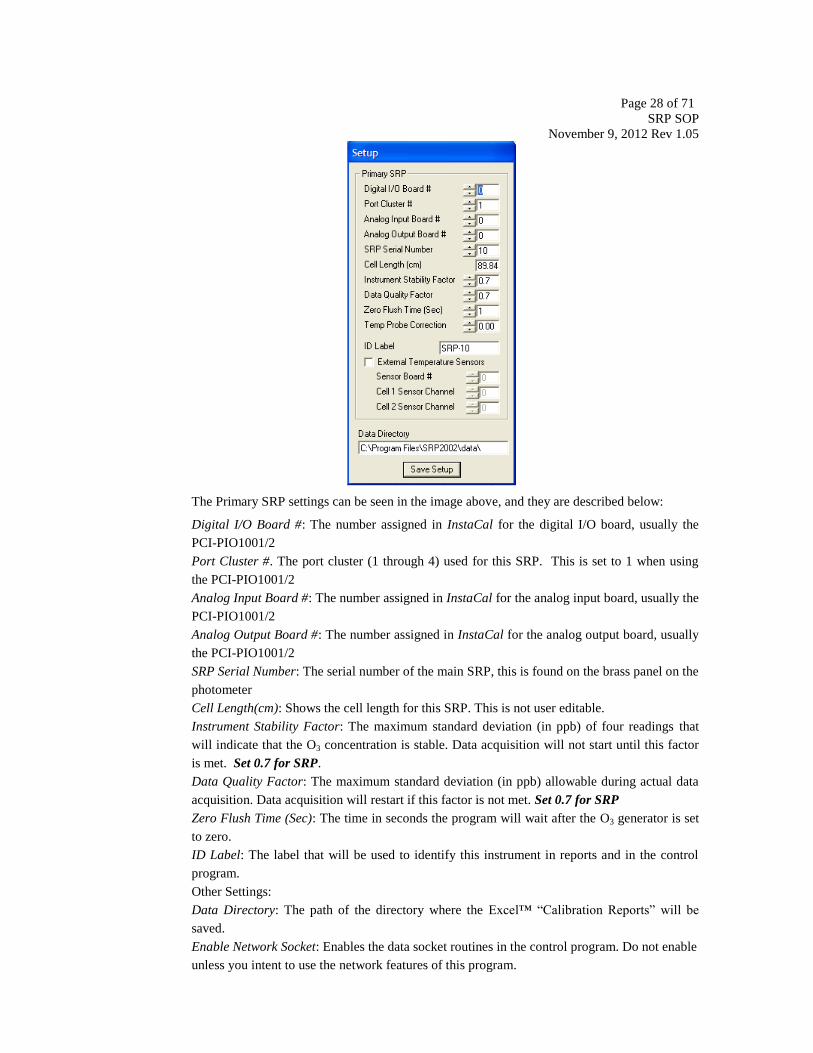
The Primary SRP settings can be seen in the image above, and they are described below:
Digital I/O Board #: The number assigned in InstaCal for the digital I/O board, usually the
PCI-PIO1001/2
Port Cluster #. The port cluster (1 through 4) used for this SRP. This is set to 1 when using
the PCI-PIO1001/2
Analog Input Board #: The number assigned in InstaCal for the analog input board, usually the
PCI-PIO1001/2
Analog Output Board #: The number assigned in InstaCal for the analog output board, usually
the PCI-PIO1001/2
SRP Serial Number: The serial number of the main SRP, this is found on the brass panel on the
photometer
Cell Length(cm): Shows the cell length for this SRP. This is not user editable.
Instrument Stability Factor: The maximum standard deviation (in ppb) of four readings that
will indicate that the O3 concentration is stable. Data acquisition will not start until this factor
is met. Set 0.7 for SRP.
Data Quality Factor: The maximum standard deviation (in ppb) allowable during actual data
acquisition. Data acquisition will restart if this factor is not met. Set 0.7 for SRP
Zero Flush Time (Sec): The time in seconds the program will wait after the O3 generator is set
to zero.
ID Label: The label that will be used to identify this instrument in reports and in the control
program.
Other Settings:
Data Directory: The path of the directory where the Excel™ “Calibration Reports” will be
saved.
Enable Network Socket: Enables the data socket routines in the control program. Do not enable
unless you intent to use the network features of this program.

Page 29 of 71
SRP SOP
November 9, 2012 Rev 1.05
4 OPERATION OF THE SRP
4.1 Health and Safety Precautions
WARNING
THERE IS 110 VAC ELECTRICAL POWER IN VARIOUS ELEMENTS OF THE
SRP SYSTEM EVEN WHEN THE POWER SWITCH IS IN THE OFF POSITION.
This does not present any hazard during normal operation, but must be taken into account if
repairs/maintenance is being performed.
Assure that the temperature in the space used to house the SRP is well controlled or the instrument’s
electronics will fluctuate and not stabilize. Also avoid pinching the gas delivery lines when assembling the
SRP, as pressure build-up may damage the instrument, and it will not operate properly. Make sure there is
adequate ventilation (connected to exhaust manifold or hood), when generating O3 to avoid exposure to the
O3 being generated.
Exposure to O3 should be As Low As Reasonably Achievable (ALARA); <10ppb.
Exposure Limits as listed in NIOSH/OSHA guide:
OSHA Permissible Exposure Limit (PEL) for General Industry: 29 CFR 1910.1000 Z-1 Table -- 0.1
ppm, 0.2 mg/m3 TWA
OSHA Permissible Exposure Limit (PEL) for Construction Industry: 29 CFR 1926.55 Appendix A --
0.1 ppm, 0.2 mg/m3 TWA
OSHA Permissible Exposure Limit (PEL) for Maritime: 29 CFR 1915.1000 Table Z-Shipyards -- 0.1
ppm, 0.2 mg/m3 TWA
4.2 Performing Quality Control Checks
4.2.1 Prior to using the SRP for an official verification, the operator must document operational
conditions by recording a number of quality control checks as outlined below and documented on
the “SRP Operating Characteristics Data Sheet” (OCDS) following this section. The OCDS
contains instructions and acceptance criteria that must be met prior to performing verifications.
4.2.2 Maintenance/repair work that is performed on the SRP should be recorded on the OCDS.
Maintenance that is not measurement critical (items that would not affect SRP cell length,
temperature measurements, or pressure measurements) is not typically recorded in the OCDS but
in an operator general logbook to document any changes made to the SRP.
Page 30 of 71
SRP SOP
November 9, 2012 Rev 1.05
4.2.3 It is recommended that the OCDS be completed prior to an official verification in order to
maintain a continuous record of how often adjustments are being made and why. An OCDS must
have been completed within the previous 7 days prior to performing a verification. The OCDS
serves to demonstrate that the SRP is stable and accurate before starting an official verification.
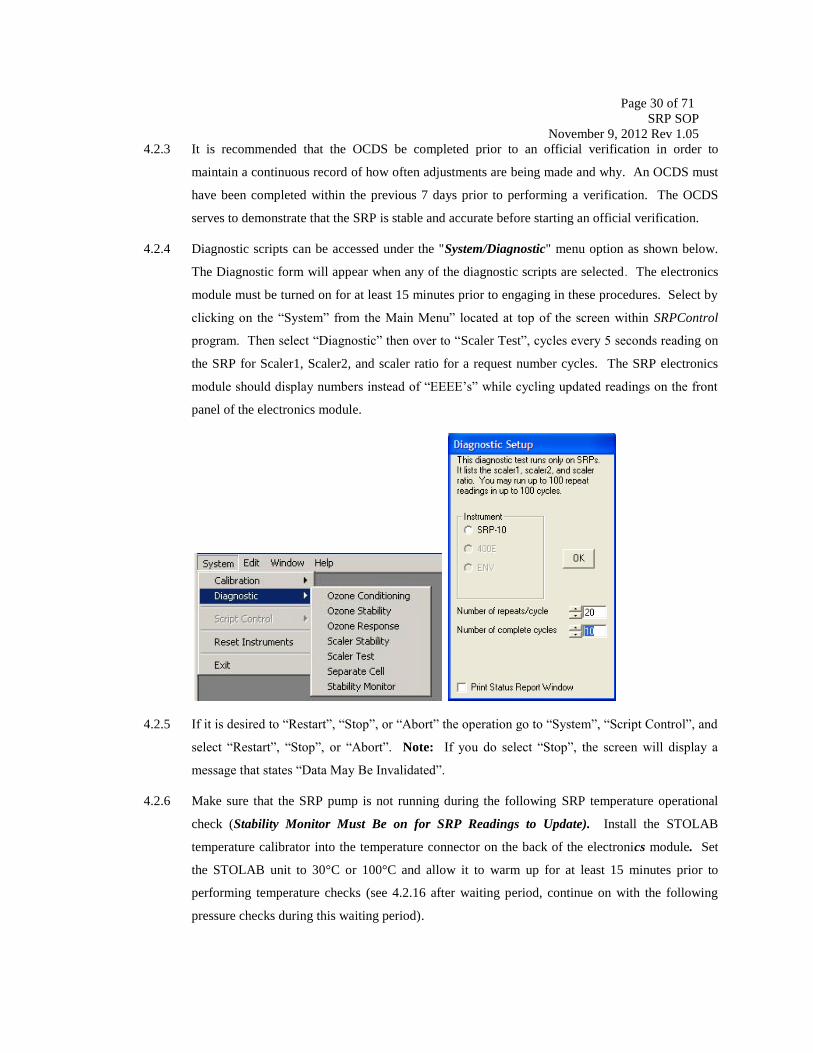
4.2.4 Diagnostic scripts can be accessed under the "System/Diagnostic" menu option as shown below.
The Diagnostic form will appear when any of the diagnostic scripts are selected. The electronics
module must be turned on for at least 15 minutes prior to engaging in these procedures. Select by
clicking on the “System” from the Main Menu” located at top of the screen within SRPControl
program. Then select “Diagnostic” then over to “Scaler Test”, cycles every 5 seconds reading on
the SRP for Scaler1, Scaler2, and scaler ratio for a request number cycles. The SRP electronics
module should display numbers instead of “EEEE’s” while cycling updated readings on the front
panel of the electronics module.
4.2.5 If it is desired to “Restart”, “Stop”, or “Abort” the operation go to “System”, “Script Control”, and
select “Restart”, “Stop”, or “Abort”. Note: If you do select “Stop”, the screen will display a
message that states “Data May Be Invalidated”.
4.2.6 Make sure that the SRP pump is not running during the following SRP temperature operational
check (Stability Monitor Must Be on for SRP Readings to Update). Install the STOLAB
temperature calibrator into the temperature connector on the back of the electronics module. Set
the STOLAB unit to 30°C or 100°C and allow it to warm up for at least 15 minutes prior to
performing temperature checks (see 4.2.16 after waiting period, continue on with the following
pressure checks during this waiting period).
Page 31 of 71
SRP SOP
November 9, 2012 Rev 1.05
4.2.7 Proceed with pressure checks. Obtain a Druck DPI 705 Digital Pressure meter or its equivalent
ambient pressure meter accurately with ± 0.1 mb. Again, make sure the SRP pump is not running
during these procedures.
4.2.8 Make sure that the pressure switch on the front panel of the SRP is in the “cal” position. Observe
the pressure reading (making sure it is stable) and record it on the OCDS.
4.2.9 Place the switch to the “run” position and record the pressure reading.
4.2.10 Record the identity of the lab pressure standard being used.
4.2.11 If either reading is not within specifications, then adjust both the zero and span adjustment screws
to adjust readings.
4.2.12 To adjust the zero pressure setting, flip the switch to “cal” and adjust the number until it goes to
700 mb.
4.2.13 Flip the switch to “run” and adjust the number to match the laboratory standard.
4.2.14 Again, switch to the “cal” and readjust the zero position to the 700 mb, and then switch to “run”
and readjust to the laboratory standard.
4.2.15 After each cycle, the measurement should be closer to the target numbers. Once the passing
criteria are met, record these measurements on the OCDS. Note that when the numbers are out of
control limit, increase or decrease the “run” or “cal” value to above or below the desired value.
This may take more time, but it will allow for the desired adjustment to take place.
4.2.16 For temperature verification (should have STOWLab connected for at least 30 minutes prior), a
NIST traceable voltmeter must be attached to the TP 2 (+) and the TP 14 (-) inside the electronics
module (run mode).
4.2.17 Set the STOLabs calibrator to the 30°C or 100°C setting, set the voltmeter to the millivolt (mV)
DC and record the reading on the OCDS. This quantity is not typically changed; however, if it
needs to be adjusted, refer to the Section 7.2 of this document for details on how to perform this
adjustment.
4.2.18 Set the STOLabs calibrator to the 0°C, set the voltmeter to the millivolt DC and record the reading
on the OCDS. This quantity is not typically changed; however, if it needs to be adjusted, refer to
the Section 7.2 of this document for details on how to perform this adjustment.
4.2.19 On the front panel of the electronics module, record the panel reading while the STOLAB is set to
30°C or 100°C. Use the front panel adjustment pot labeled “span” to adjust the observed
temperature reading to within ±0.1°C of the standard (remember to close cover when done).
Page 32 of 71
SRP SOP
November 9, 2012 Rev 1.05
4.2.20 Set the front panel temperature switch to the “Cal” position (STOLAB calibrator should be set at
100°C), place two voltmeter probes into the front panel openings for temperature, and record the
reading observed on the voltmeter (the voltmeter should be set at the millivolts DC range). Use
the front panel “zero” adjustment pot to adjust the reading to between 0.1 to 1.0 mV.
4.2.21 Record the total counts observed from Cell #1 and Cell #2. These should be 90,000 – 250,000.
This quantity is not typically changed; however, if it needs to be adjusted, refer to the Section 7.5
of this document for details on how to perform this adjustment. Note: further QC checks are not
possible until stabilization is obtained after this adjustment until 4 or more hours for proper
stabilization between any adjustments made.
4.2.22 On the computer screen, select “System”, “Script Control” and “Abort” to stop operation running.
4.2.23 Now, go to the SRP display menu and “click” on the button within SRP controls that reads shutter
“Open”. It will display “closed” on that same button. This will close the shutter for the “Dark
Count” readings. Quickly go back to “System”, “Diagnostics”, and select “Scaler”. This will now
display the “dark count” readings.
4.2.24 Record the counts observed on the electronics module. Allow it to run a couple of duty cycles to
stabilize. If the counts are not between 5 and 20, adjust the scalers as described below, refer to the
Section 7.7 of this document for details on how to perform this adjustment.
4.2.25 Go to “System”, “Script Control” and select “Abort” to stop operation running.
4.2.26 Make sure the switches for temperature and pressure on the SRP electronic modules are both on
“run”. Once at the main menu, select “diagnostics” and select “stability monitor”. Be sure to
remove the STOLAB calibrator and reconnect the temperature cable. .
Page 33 of 71
SRP SOP
November 9, 2012 Rev 1.05
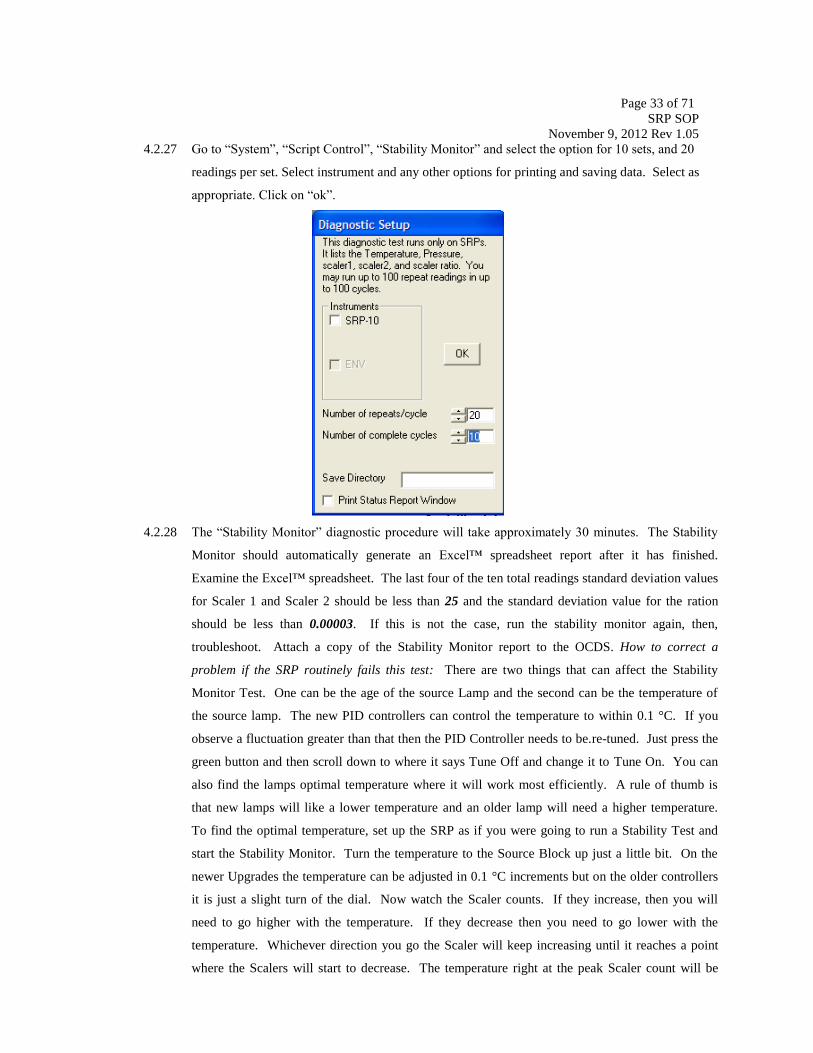
4.2.27 Go to “System”, “Script Control”, “Stability Monitor” and select the option for 10 sets, and 20
readings per set. Select instrument and any other options for printing and saving data. Select as
appropriate. Click on “ok”.
4.2.28 The “Stability Monitor” diagnostic procedure will take approximately 30 minutes. The Stability
Monitor should automatically generate an Excel™ spreadsheet report after it has finished.
Examine the Excel™ spreadsheet. The last four of the ten total readings standard deviation values
for Scaler 1 and Scaler 2 should be less than 25 and the standard deviation value for the ration
should be less than 0.00003. If this is not the case, run the stability monitor again, then,
troubleshoot. Attach a copy of the Stability Monitor report to the OCDS. How to correct a
problem if the SRP routinely fails this test: There are two things that can affect the Stability
Monitor Test. One can be the age of the source Lamp and the second can be the temperature of
the source lamp. The new PID controllers can control the temperature to within 0.1 °C. If you
observe a fluctuation greater than that then the PID Controller needs to be.re-tuned. Just press the
green button and then scroll down to where it says Tune Off and change it to Tune On. You can
also find the lamps optimal temperature where it will work most efficiently. A rule of thumb is
that new lamps will like a lower temperature and an older lamp will need a higher temperature.
To find the optimal temperature, set up the SRP as if you were going to run a Stability Test and
start the Stability Monitor. Turn the temperature to the Source Block up just a little bit. On the
newer Upgrades the temperature can be adjusted in 0.1 °C increments but on the older controllers
it is just a slight turn of the dial. Now watch the Scaler counts. If they increase, then you will
need to go higher with the temperature. If they decrease then you need to go lower with the
temperature. Whichever direction you go the Scaler will keep increasing until it reaches a point
where the Scalers will start to decrease. The temperature right at the peak Scaler count will be

Page 34 of 71
SRP SOP
November 9, 2012 Rev 1.05
your desired temperature for the block. Also, before you start this check the position of the lamp.
Move it in and out and turn it forwards and back to find the maximum power. If you end up with
high Scaler counts then you can turn the power down to the lamp using the blue pot on the board.
Once you optimize the lamp position and temperature it should pass with flying colors, but if it
does not then put in a new lamp.
4.2.29 The following four pages are examples of the OCDS “SRP OPERATING CHARACTERISTICS
DATA SHEET”. A completed copy should be included with all verification data. A copy of a
completed OCDS is included in Appendix B.
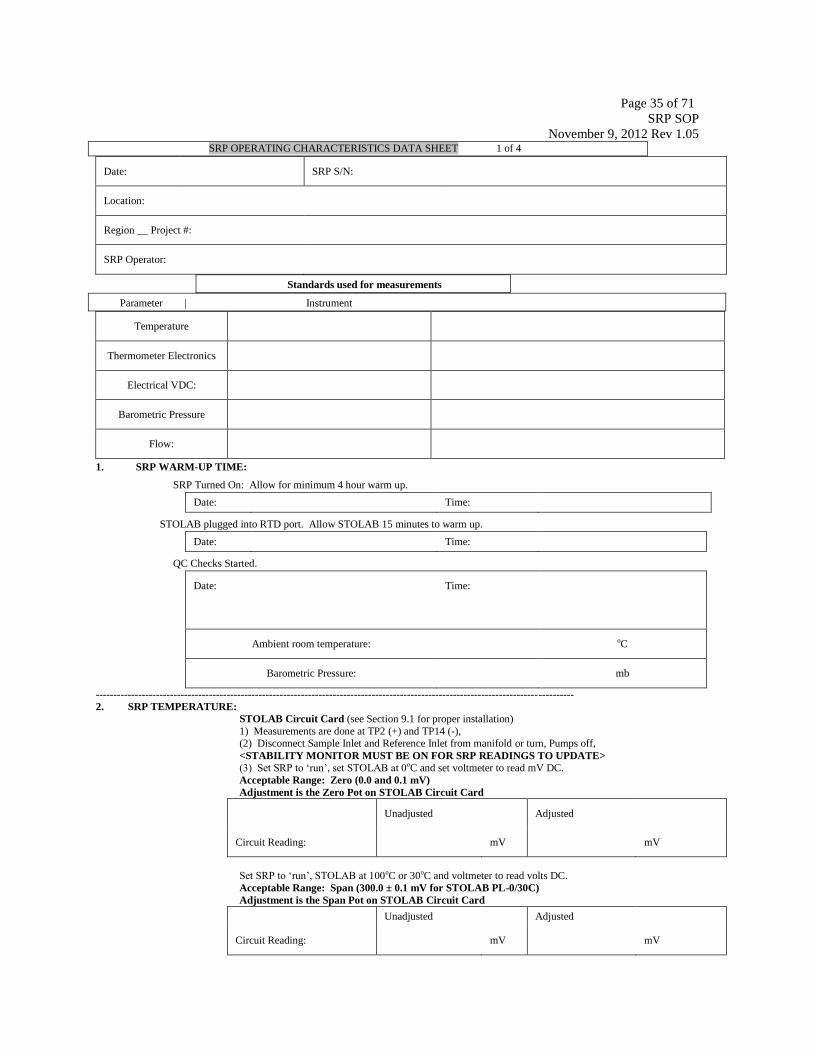
Page 35 of 71
SRP SOP
November 9, 2012 Rev 1.05 SRP OPERATING CHARACTERISTICS DATA SHEET 1 of 4
Date: SRP S/N:
Location:
Region __ Project #:
SRP Operator:
Standards used for measurements
Parameter | Instrument
Temperature
Thermometer Electronics
Electrical VDC:
Barometric Pressure
Flow:
1. SRP WARM-UP TIME:
SRP Turned On: Allow for minimum 4 hour warm up.
Date: Time:
STOLAB plugged into RTD port. Allow STOLAB 15 minutes to warm up.
Date: Time:
QC Checks Started.
Date: Time:
Ambient room temperature: oC
Barometric Pressure: mb
---------------------------------------------------------------------------------------------------------------------------------------
2. SRP TEMPERATURE:
STOLAB Circuit Card (see Section 9.1 for proper installation)
1) Measurements are done at TP2 (+) and TP14 (-), (2) Disconnect Sample Inlet and Reference Inlet from manifold or turn, Pumps off,
<STABILITY MONITOR MUST BE ON FOR SRP READINGS TO UPDATE> (3) Set SRP to ‘run’, set STOLAB at 0oC and set voltmeter to read mV DC.
Acceptable Range: Zero (0.0 and 0.1 mV)
Adjustment is the Zero Pot on STOLAB Circuit Card
Unadjusted Adjusted
Circuit Reading: mV mV
Set SRP to ‘run’, STOLAB at 100oC or 30oC and voltmeter to read volts DC.
Acceptable Range: Span (300.0 ± 0.1 mV for STOLAB PL-0/30C)
Adjustment is the Span Pot on STOLAB Circuit Card
Unadjusted Adjusted
Circuit Reading: mV mV
Page 36 of 71
SRP SOP
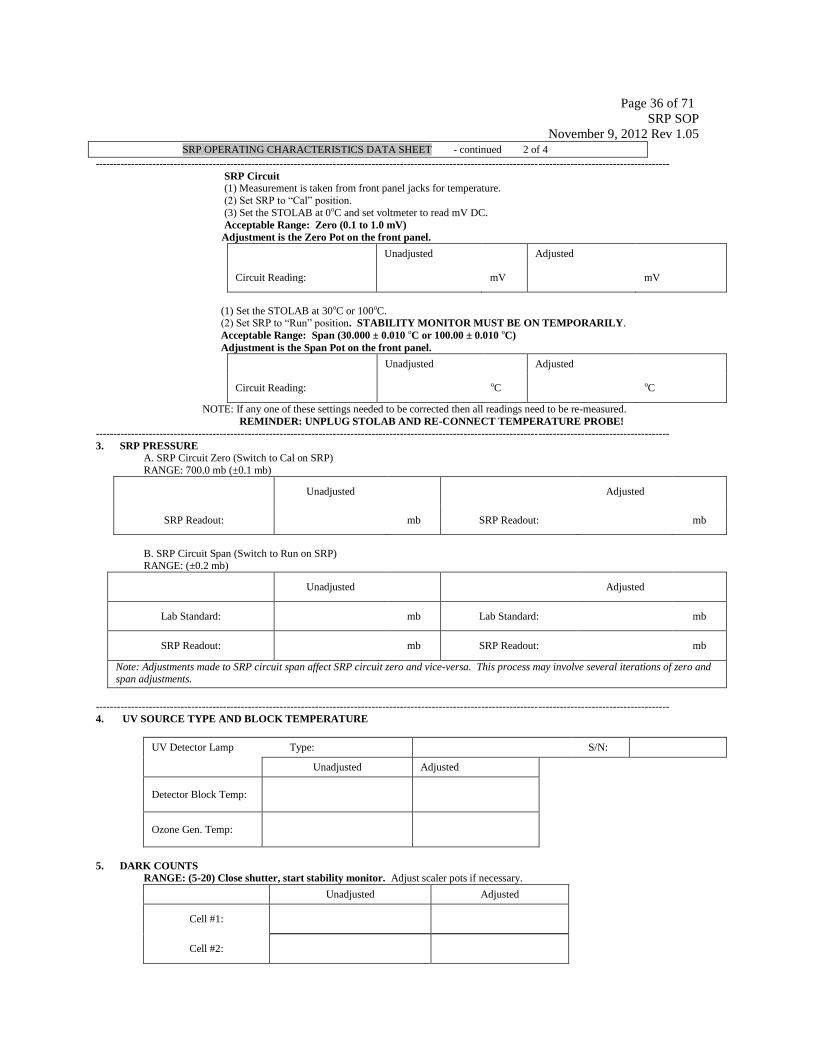
November 9, 2012 Rev 1.05 SRP OPERATING CHARACTERISTICS DATA SHEET - continued 2 of 4
------------------------------------------------------------------------------------------------------------------------------------------------------------------
SRP Circuit
(1) Measurement is taken from front panel jacks for temperature.
(2) Set SRP to “Cal” position.
(3) Set the STOLAB at 0oC and set voltmeter to read mV DC.
Acceptable Range: Zero (0.1 to 1.0 mV)
Adjustment is the Zero Pot on the front panel.
Unadjusted Adjusted
Circuit Reading: mV mV
(1) Set the STOLAB at 30oC or 100oC. (2) Set SRP to “Run” position. STABILITY MONITOR MUST BE ON TEMPORARILY.
Acceptable Range: Span (30.000 ± 0.010 oC or 100.00 ± 0.010 oC)
Adjustment is the Span Pot on the front panel.
Unadjusted Adjusted
Circuit Reading: oC oC
NOTE: If any one of these settings needed to be corrected then all readings need to be re-measured.
REMINDER: UNPLUG STOLAB AND RE-CONNECT TEMPERATURE PROBE!
------------------------------------------------------------------------------------------------------------------------------------------------------------------
3. SRP PRESSURE A. SRP Circuit Zero (Switch to Cal on SRP)
RANGE: 700.0 mb (±0.1 mb)
Unadjusted Adjusted
SRP Readout: mb SRP Readout: mb
B. SRP Circuit Span (Switch to Run on SRP) RANGE: (±0.2 mb)
Unadjusted Adjusted
Lab Standard: mb Lab Standard: mb
SRP Readout: mb SRP Readout: mb
Note: Adjustments made to SRP circuit span affect SRP circuit zero and vice-versa. This process may involve several iterations of zero and span adjustments.
------------------------------------------------------------------------------------------------------------------------------------------------------------------
4. UV SOURCE TYPE AND BLOCK TEMPERATURE
UV Detector Lamp Type: S/N:
Unadjusted Adjusted
Detector Block Temp:
Ozone Gen. Temp:
5. DARK COUNTS RANGE: (5-20) Close shutter, start stability monitor. Adjust scaler pots if necessary.
Unadjusted Adjusted
Cell #1:
Cell #2:
Page 37 of 71
SRP SOP
November 9, 2012 Rev 1.05 SRP OPERATING CHARACTERISTICS DATA SHEET - continued 3 of 4
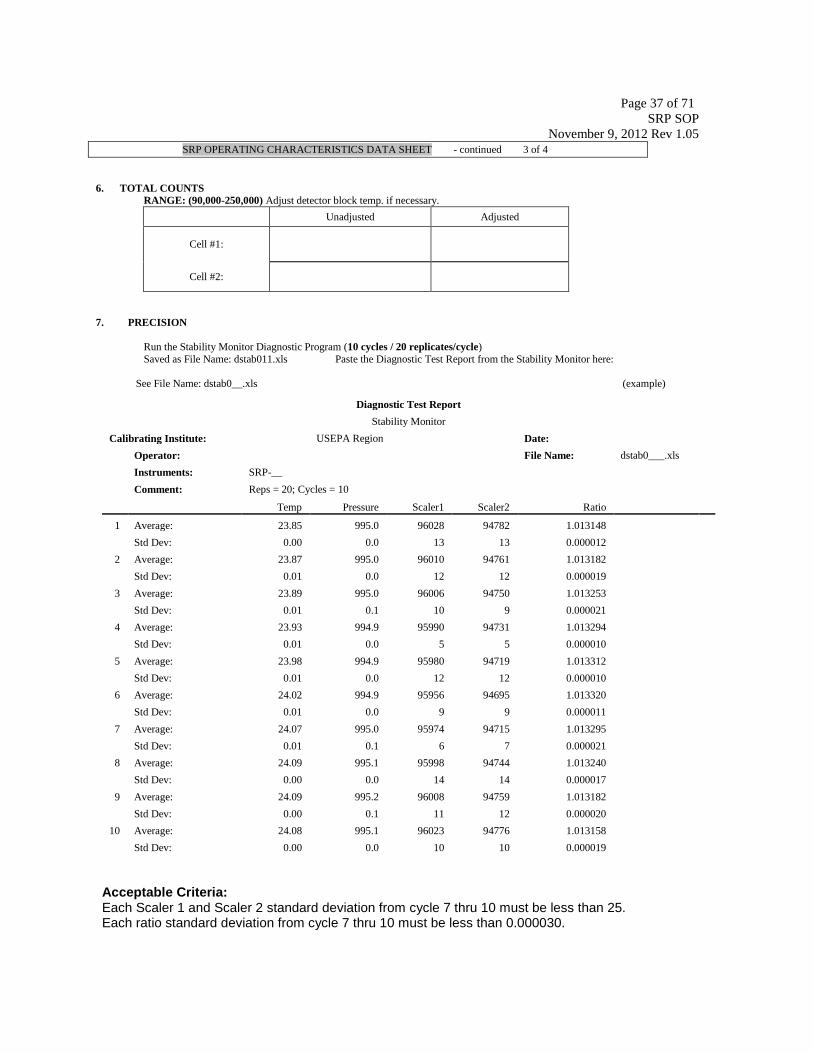
6. TOTAL COUNTS RANGE: (90,000-250,000) Adjust detector block temp. if necessary.
Unadjusted Adjusted
Cell #1:
Cell #2:
7. PRECISION
Run the Stability Monitor Diagnostic Program (10 cycles / 20 replicates/cycle)
Saved as File Name: dstab011.xls Paste the Diagnostic Test Report from the Stability Monitor here:
See File Name: dstab0__.xls (example)
Diagnostic Test Report
Stability Monitor
Calibrating Institute: USEPA Region Date:
Operator: File Name: dstab0___.xls
Instruments: SRP-__
Comment: Reps = 20; Cycles = 10
Temp Pressure Scaler1 Scaler2 Ratio
1 Average: 23.85 995.0 96028 94782 1.013148
Std Dev: 0.00 0.0 13 13 0.000012
2 Average: 23.87 995.0 96010 94761 1.013182
Std Dev: 0.01 0.0 12 12 0.000019
3 Average: 23.89 995.0 96006 94750 1.013253
Std Dev: 0.01 0.1 10 9 0.000021
4 Average: 23.93 994.9 95990 94731 1.013294
Std Dev: 0.01 0.0 5 5 0.000010
5 Average: 23.98 994.9 95980 94719 1.013312
Std Dev: 0.01 0.0 12 12 0.000010
6 Average: 24.02 994.9 95956 94695 1.013320
Std Dev: 0.01 0.0 9 9 0.000011
7 Average: 24.07 995.0 95974 94715 1.013295
Std Dev: 0.01 0.1 6 7 0.000021
8 Average: 24.09 995.1 95998 94744 1.013240
Std Dev: 0.00 0.0 14 14 0.000017
9 Average: 24.09 995.2 96008 94759 1.013182
Std Dev: 0.00 0.1 11 12 0.000020
10 Average: 24.08 995.1 96023 94776 1.013158
Std Dev: 0.00 0.0 10 10 0.000019
Acceptable Criteria: Each Scaler 1 and Scaler 2 standard deviation from cycle 7 thru 10 must be less than 25. Each ratio standard deviation from cycle 7 thru 10 must be less than 0.000030.
Page 38 of 71
SRP SOP
November 9, 2012 Rev 1.05 SRP OPERATING CHARACTERISTICS DATA SHEET - continued 4 of 4
8. COMMENTS
9. FLOW RATES (optional)
NOTE: All flow measurements are not corrected for Barometric Pressure and Temperature
Gillian Gilabrator-
SRP-1:Zero Air Pressure set at XX PSIG
Sample Input -- Cell 1 (Valve1 - Ozone, Valve2 - Air): Black Ball ; oC; mb , , , , , cc/min Average cc/min
Sample Input -- Cell 2 (Valve 1 - Air, Valve 2 - Ozone): Black Ball ; oC; mb , , , , , cc/min Average cc/min
Reference Input -- Cell 1 (Valve 1 - Air, Valve 2 - Ozone): Black Ball ; oC; mb , , , , , cc/min Average cc/min
Reference Input -- Cell 2 (Valve1 - Ozone, Valve2 - Air): Black Ball ; oC; mb , , , , , cc/min Average cc/min
Reference Air Out: -- oC, mb, , , , , cc/min Average cc/min
Ozone Sample Out: -- Mass Flow Controller Set at LPM , oC, mb, , , , , cc/min Average cc/min
Cell 1 Exhaust: -- oC, mb, , , , , cc/min Average cc/min
Cell 2 Exhaust: -- oC, mb, , , , , cc/min Average cc/min

Page 39 of 71
SRP SOP
November 9, 2012 Rev 1.05
4.3 Diagnostics/Scripts
In addition to the previously mentioned Stability Monitor there are several other diagnostic scripts that can
be accessed under the "System/Diagnostic" menu option as shown below. The Diagnostic form will appear
when any of the diagnostic scripts are chosen.
Diagnostic Form:
The diagnostic form will show a description of the diagnostic script in the upper portion of the form. You
choose the instruments that you want to run the diagnostic on in the "Instrument" section. If there are round
option buttons here, then only one instrument can be chosen. If there are square checkboxes here, then
multiple instruments can be chosen.
Various other options are shown depending on the diagnostic. When the "Print Status Report Window”
option is checked the status window will be automatically printed to the default windows printer before each
clear.
The available scripts are:
1. Ozone Conditioning: This diagnostic can test all instruments. It lists the O3 concentration from all
instruments at a set lamp percent. It runs until you click stop or abort. This is useful for
determining what lamp percentage at a given flow rate produces the desire concentration of O3.
The data can be exported to an Excel™ spreadsheet, but seems to be limited to about 500 rows.
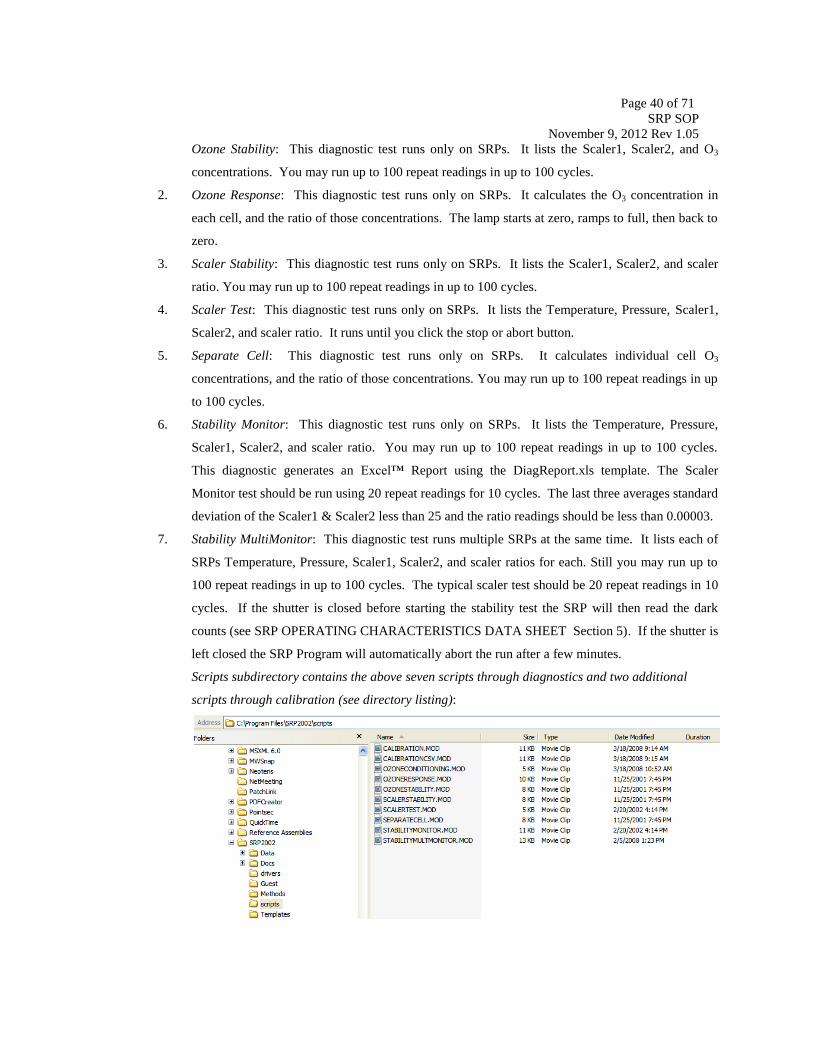
Page 40 of 71
SRP SOP
November 9, 2012 Rev 1.05
Ozone Stability: This diagnostic test runs only on SRPs. It lists the Scaler1, Scaler2, and O3
concentrations. You may run up to 100 repeat readings in up to 100 cycles.
2. Ozone Response: This diagnostic test runs only on SRPs. It calculates the O3 concentration in
each cell, and the ratio of those concentrations. The lamp starts at zero, ramps to full, then back to
zero.
3. Scaler Stability: This diagnostic test runs only on SRPs. It lists the Scaler1, Scaler2, and scaler
ratio. You may run up to 100 repeat readings in up to 100 cycles.
4. Scaler Test: This diagnostic test runs only on SRPs. It lists the Temperature, Pressure, Scaler1,
Scaler2, and scaler ratio. It runs until you click the stop or abort button.
5. Separate Cell: This diagnostic test runs only on SRPs. It calculates individual cell O3
concentrations, and the ratio of those concentrations. You may run up to 100 repeat readings in up
to 100 cycles.
6. Stability Monitor: This diagnostic test runs only on SRPs. It lists the Temperature, Pressure,
Scaler1, Scaler2, and scaler ratio. You may run up to 100 repeat readings in up to 100 cycles.
This diagnostic generates an Excel™ Report using the DiagReport.xls template. The Scaler
Monitor test should be run using 20 repeat readings for 10 cycles. The last three averages standard
deviation of the Scaler1 & Scaler2 less than 25 and the ratio readings should be less than 0.00003.
7. Stability MultiMonitor: This diagnostic test runs multiple SRPs at the same time. It lists each of
SRPs Temperature, Pressure, Scaler1, Scaler2, and scaler ratios for each. Still you may run up to
100 repeat readings in up to 100 cycles. The typical scaler test should be 20 repeat readings in 10
cycles. If the shutter is closed before starting the stability test the SRP will then read the dark
counts (see SRP OPERATING CHARACTERISTICS DATA SHEET Section 5). If the shutter is
left closed the SRP Program will automatically abort the run after a few minutes.
Scripts subdirectory contains the above seven scripts through diagnostics and two additional
scripts through calibration (see directory listing):
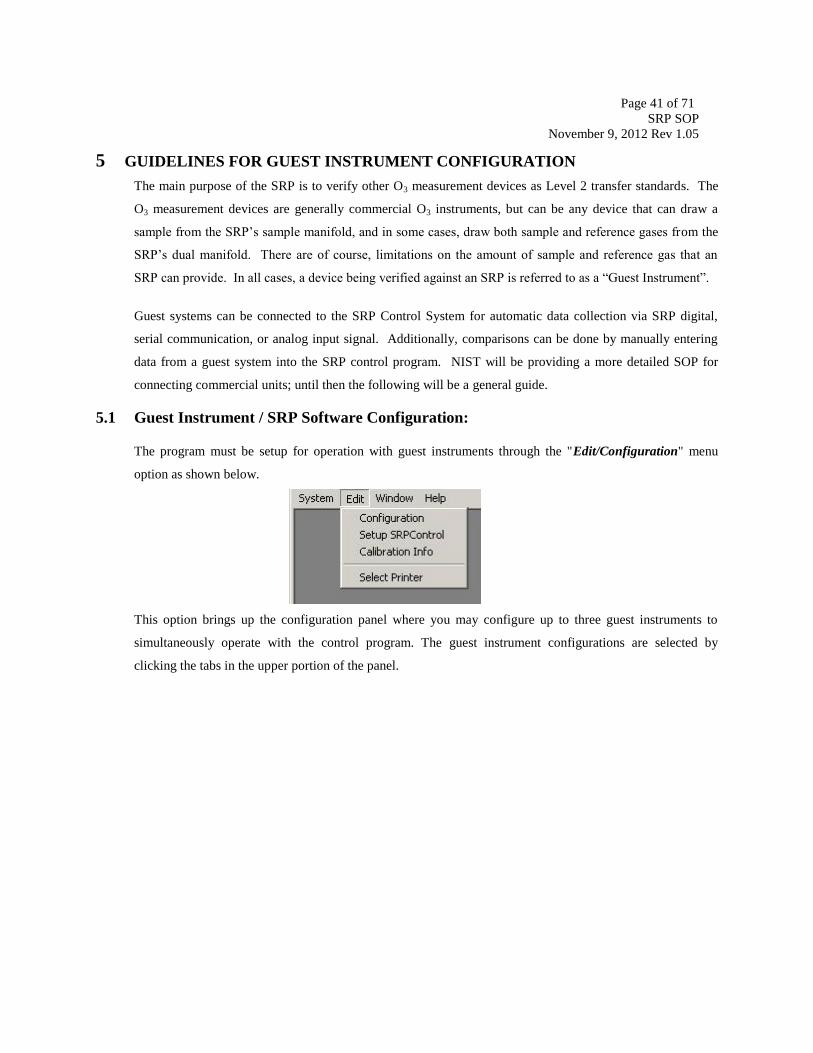
Page 41 of 71
SRP SOP
November 9, 2012 Rev 1.05
5 GUIDELINES FOR GUEST INSTRUMENT CONFIGURATION
The main purpose of the SRP is to verify other O3 measurement devices as Level 2 transfer standards. The
O3 measurement devices are generally commercial O3 instruments, but can be any device that can draw a
sample from the SRP’s sample manifold, and in some cases, draw both sample and reference gases from the
SRP’s dual manifold. There are of course, limitations on the amount of sample and reference gas that an
SRP can provide. In all cases, a device being verified against an SRP is referred to as a “Guest Instrument”.
Guest systems can be connected to the SRP Control System for automatic data collection via SRP digital,
serial communication, or analog input signal. Additionally, comparisons can be done by manually entering
data from a guest system into the SRP control program. NIST will be providing a more detailed SOP for
connecting commercial units; until then the following will be a general guide.
5.1 Guest Instrument / SRP Software Configuration:
The program must be setup for operation with guest instruments through the "Edit/Configuration" menu
option as shown below.
This option brings up the configuration panel where you may configure up to three guest instruments to
simultaneously operate with the control program. The guest instrument configurations are selected by
clicking the tabs in the upper portion of the panel.
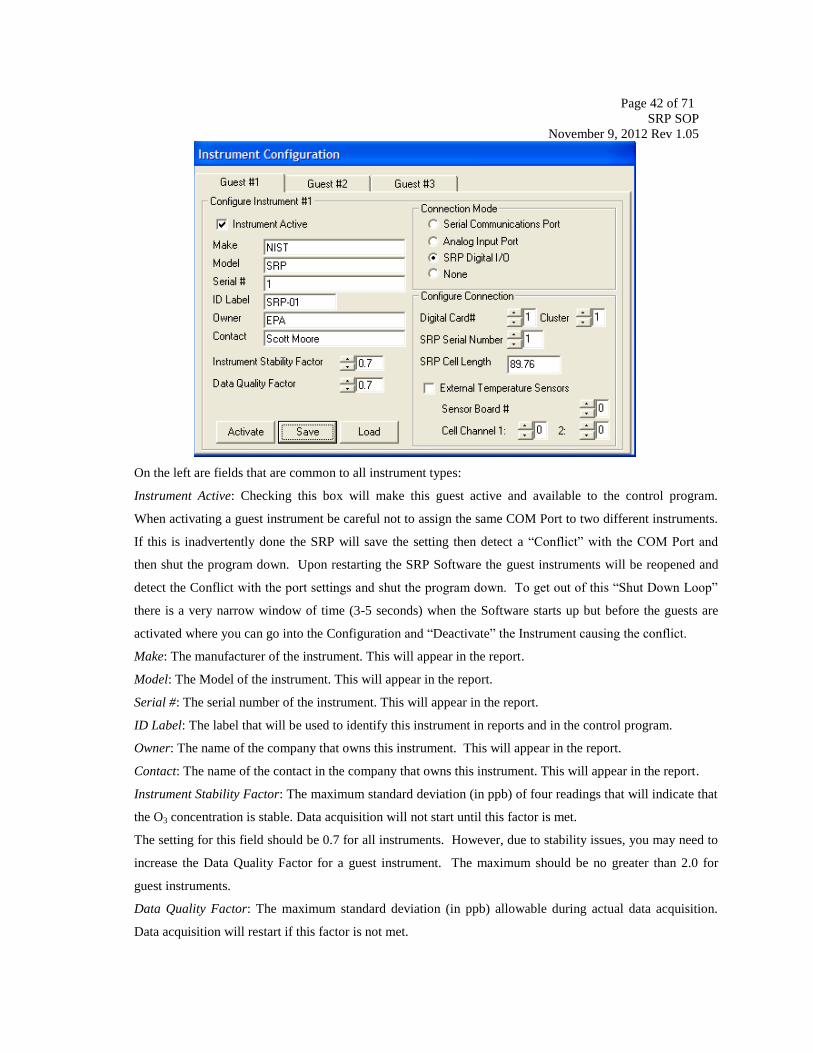
Page 42 of 71
SRP SOP
November 9, 2012 Rev 1.05
On the left are fields that are common to all instrument types:
Instrument Active: Checking this box will make this guest active and available to the control program.
When activating a guest instrument be careful not to assign the same COM Port to two different instruments.
If this is inadvertently done the SRP will save the setting then detect a “Conflict” with the COM Port and
then shut the program down. Upon restarting the SRP Software the guest instruments will be reopened and
detect the Conflict with the port settings and shut the program down. To get out of this “Shut Down Loop”
there is a very narrow window of time (3-5 seconds) when the Software starts up but before the guests are
activated where you can go into the Configuration and “Deactivate” the Instrument causing the conflict.
Make: The manufacturer of the instrument. This will appear in the report.
Model: The Model of the instrument. This will appear in the report.
Serial #: The serial number of the instrument. This will appear in the report.
ID Label: The label that will be used to identify this instrument in reports and in the control program.
Owner: The name of the company that owns this instrument. This will appear in the report.
Contact: The name of the contact in the company that owns this instrument. This will appear in the report.
Instrument Stability Factor: The maximum standard deviation (in ppb) of four readings that will indicate that
the O3 concentration is stable. Data acquisition will not start until this factor is met.
The setting for this field should be 0.7 for all instruments. However, due to stability issues, you may need to
increase the Data Quality Factor for a guest instrument. The maximum should be no greater than 2.0 for
guest instruments.
Data Quality Factor: The maximum standard deviation (in ppb) allowable during actual data acquisition.
Data acquisition will restart if this factor is not met.

Page 43 of 71
SRP SOP
November 9, 2012 Rev 1.05
The setting for this field should be: 0.7 for all instruments. However, due to stability issues, you may need to
increase the Data Quality Factor for a guest instrument. The maximum should be no greater than 2.0 for
guest instruments.
NOTE: When running multiple instruments, one noisy instrument can cause a calibration to abort. For
example, if you are running an instrument with a Zero to one Volt output and then multiply the voltage by
1000 (O3 (ppb) = Slope x Voltage + Intercept) then your noise ratio is also amplified by 1000. There would
be two acceptable options. First run an “O3 Conditioning” at the flow rate you are going to use and at the
highest Lamp % that you are going to use and let it run until all other instruments are stable. Check to see
what the Stability Factor is for that instrument and then use a value that is slightly greater than that. Or
second, just record the raw voltage with no multiplier and correct the data after the calibration is completed.
Any time a factor > 0.7 is used there should be a statement in the QA Report or the Calibration File with an
explanation of the reason why a different value is used and how you came up with the alternate value. An
“Analog Calibration” can also be run to determine the Slope and Intercept to be used for a specific
instrument by setting the Slope to one and the intercept to Zero. Run a calibration of three points of Zero
Maximum range to be used and a half way point. Then a slope and intercept can be calculated and used.
Some users already have a slope and intercept that they use to correct their data. This can also be used,
however if the user is calculating their O3 concentration to ppm, you would need to recalculate the slope and
intercept for ppb. Be sure to include any of this in the final report.
Select the connection mode by choosing; 1) Serial Communications Port; 2) Analog Input Port; 3) SRP
Digital I/O; or 4) None. These options will be discussed individually below;
1) Serial Communications Port

Page 44 of 71
SRP SOP
November 9, 2012 Rev 1.05
The guest settings for serial communications can be seen in the image above, and they are described below
Comm Port#: The port number of the computer’s serial port and that the instrument is connected to. A DB 9
pin com port is usually used, but you will need to know the difference between a Null Modem cable and a
straight through cable. Most venders will have a cable for their instrument and it would be best to use it.
Also, some of the instruments will have a switch that can reverse the Text Out (TX) and Receive (RX). Once
you find a combination that works, save it. USB to Serial adapters can also be used. Some instruments (API
is an example) have an internal buffer and when it is full it can inhibit serial communication. It is extremely
helpful to have an individual who is very familiar with the guest instrument that you are setting up to assist
with communication issues.
Baud Rate: The baud rate of the guest instrument. This can be found in the instruments manual, or on the
instrument front panel display.
Bits,Parity,Stop: The settings for your instrument should be found in the instrument manual. They should
usually be set to 8,n,1.
Inst Driver File: Select the driver file for your instrument model from the pull down menu. It is possible to
write your own instrument ID if you understand the communication language to the guest instrument and the
SRP. NIST may have some ID files for new instrument models. NIST is also willing to write an ID file for
us, however, we would need to send the guest instrument to NIST for them to evaluate and write the ID file.
Currently NIST and EPA are working on other options for converting an analog input into a serial input and
at this time it is not available.
Instrument ID: Please note that the Instrument ID is typically used only for the TECO 49 Series. These
instruments have an ID code that must be used in serial communications. Check your instrument manual or
cycle thru the guest instrument front panel options in order to obtain instrument ID. This code is typically an
ASCII number that requires you to add 128 to the ID, then input \ and the number. Example: Instrument ID
= 59. 59 + 128 = 187. Enter “\187 “into the field. For any other instrument you may need to leave this
blank.
Password: Some instruments require a password in order to communicate over a serial line. Check your
instrument manual for the password.
O3 Generator: Check this option if the instrument has an internal O3 generator that is controllable over the
serial link, and you intend to use the internal generator instead of the SRP generator. Please note that it is
discouraged not to use anything other than an SRP to generate O3. There are two reasons for this. One:
using an unknown source for O3 can introduce contamination into your SRP and Two: many other generators
may have a feedback loop for controlling the O3 concentration. The end result will be that the generator is
constantly “tweaking” the O3 Lamp up and down to control the concentration selected and this can cause
stability issues with the SRP. It should also be noted that in the new TAD (Link reference in Section 1.1)
that the concentration should be evenly spaced rather than specific concentrations.
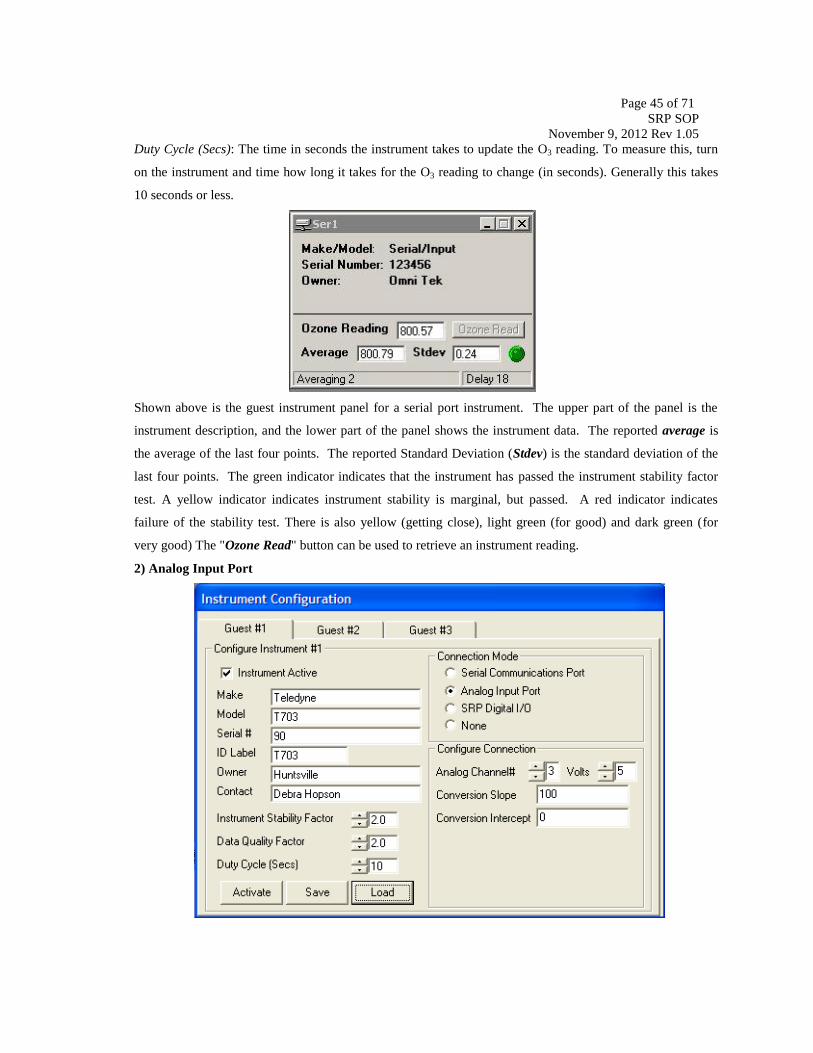
Page 45 of 71
SRP SOP
November 9, 2012 Rev 1.05
Duty Cycle (Secs): The time in seconds the instrument takes to update the O3 reading. To measure this, turn
on the instrument and time how long it takes for the O3 reading to change (in seconds). Generally this takes
10 seconds or less.
Shown above is the guest instrument panel for a serial port instrument. The upper part of the panel is the
instrument description, and the lower part of the panel shows the instrument data. The reported average is
the average of the last four points. The reported Standard Deviation (Stdev) is the standard deviation of the
last four points. The green indicator indicates that the instrument has passed the instrument stability factor
test. A yellow indicator indicates instrument stability is marginal, but passed. A red indicator indicates
failure of the stability test. There is also yellow (getting close), light green (for good) and dark green (for
very good) The "Ozone Read" button can be used to retrieve an instrument reading.
2) Analog Input Port
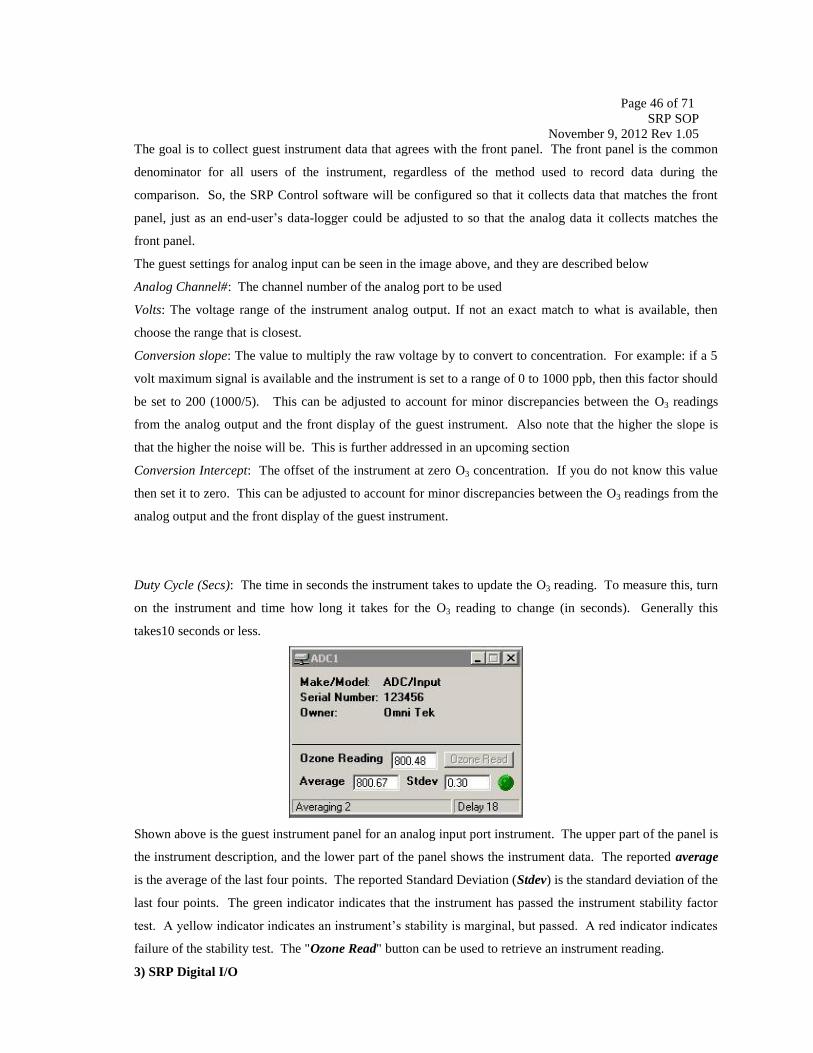
Page 46 of 71
SRP SOP
November 9, 2012 Rev 1.05
The goal is to collect guest instrument data that agrees with the front panel. The front panel is the common
denominator for all users of the instrument, regardless of the method used to record data during the
comparison. So, the SRP Control software will be configured so that it collects data that matches the front
panel, just as an end-user’s data-logger could be adjusted to so that the analog data it collects matches the
front panel.
The guest settings for analog input can be seen in the image above, and they are described below
Analog Channel#: The channel number of the analog port to be used
Volts: The voltage range of the instrument analog output. If not an exact match to what is available, then
choose the range that is closest.
Conversion slope: The value to multiply the raw voltage by to convert to concentration. For example: if a 5
volt maximum signal is available and the instrument is set to a range of 0 to 1000 ppb, then this factor should
be set to 200 (1000/5). This can be adjusted to account for minor discrepancies between the O3 readings
from the analog output and the front display of the guest instrument. Also note that the higher the slope is
that the higher the noise will be. This is further addressed in an upcoming section
Conversion Intercept: The offset of the instrument at zero O3 concentration. If you do not know this value
then set it to zero. This can be adjusted to account for minor discrepancies between the O3 readings from the
analog output and the front display of the guest instrument.
Duty Cycle (Secs): The time in seconds the instrument takes to update the O3 reading. To measure this, turn
on the instrument and time how long it takes for the O3 reading to change (in seconds). Generally this
takes10 seconds or less.
Shown above is the guest instrument panel for an analog input port instrument. The upper part of the panel is
the instrument description, and the lower part of the panel shows the instrument data. The reported average
is the average of the last four points. The reported Standard Deviation (Stdev) is the standard deviation of the
last four points. The green indicator indicates that the instrument has passed the instrument stability factor
test. A yellow indicator indicates an instrument’s stability is marginal, but passed. A red indicator indicates
failure of the stability test. The "Ozone Read" button can be used to retrieve an instrument reading.
3) SRP Digital I/O

Page 47 of 71
SRP SOP
November 9, 2012 Rev 1.05
The guest settings for a SRP can be seen in the image above, and they are described below
Digital Card#: The number assigned in InstaCal for the digital input card used with this SRP. This is set to 1
for the PCI-DIO24 card.
Cluster. The port cluster to use for this instrument (1 through 4). This is usually set to 1 for the PCI-DIO24
card.
SRP Serial Number: The serial number of the main SRP, this is found on the brass panel on the photometer
SRP Cell Length: The length in cm of the SRP gas cell. This value is for information only, and should be
approximately 89.3 cm. If no value, or a zero value, appears here contact NIST.
Duty Cycle (Secs): The time, in seconds that it takes an instrument to complete a “cycle. In many
instruments with dual cells a “measurement is taken with the O3 in path “A” and then the solenoids will
switch and O3 will be read in path “B” and the opposite with Reference. You will need to listen for the
solenoid valve to switch, or if there is a light to indicate when the solenoid switches to O3 Read Path “A”.
This is your start time, the solenoids will then switch to read O3 in Path “B”, keep counting the time and then
stop the timer when the solenoid switches back to read Path “A”. This usually takes 20 seconds and it will
help prevent the SRP from recording data from just one cell and skew the test results. Also if there is a
noticeable discrepancy between Cell A and Cell B the owner should be informed to determine if they would
like the cells to be cleaned. .
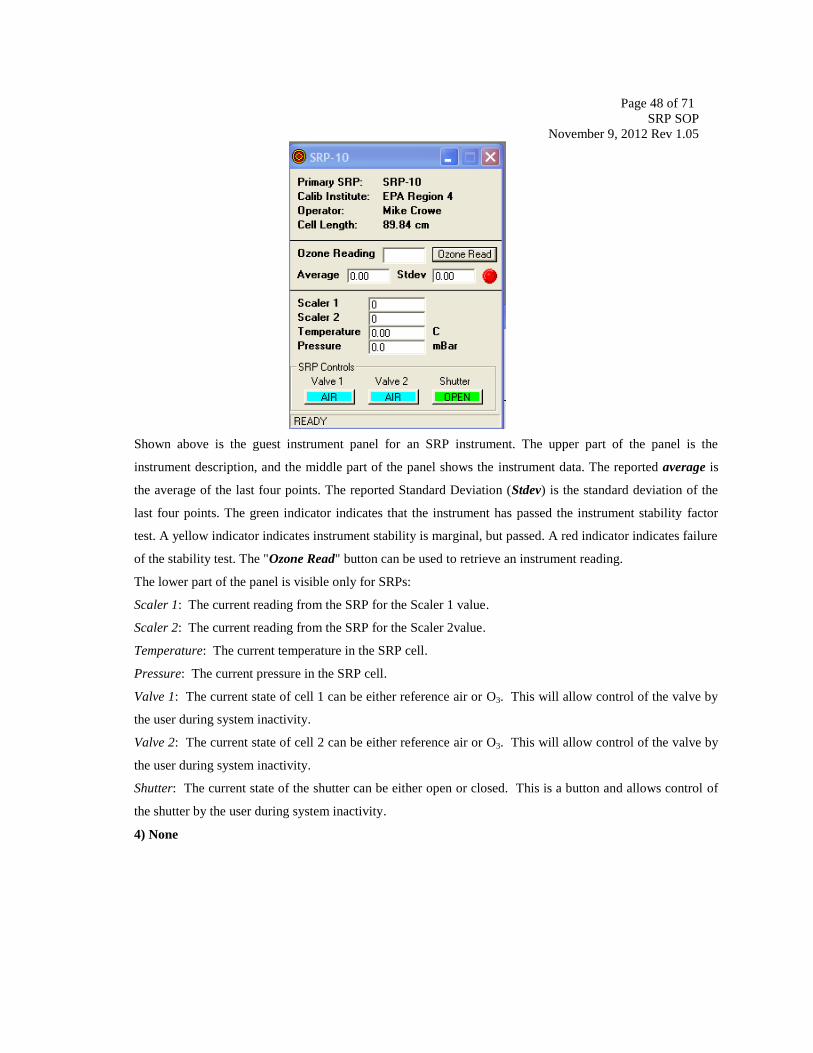
Page 48 of 71
SRP SOP
November 9, 2012 Rev 1.05
Shown above is the guest instrument panel for an SRP instrument. The upper part of the panel is the
instrument description, and the middle part of the panel shows the instrument data. The reported average is
the average of the last four points. The reported Standard Deviation (Stdev) is the standard deviation of the
last four points. The green indicator indicates that the instrument has passed the instrument stability factor
test. A yellow indicator indicates instrument stability is marginal, but passed. A red indicator indicates failure
of the stability test. The "Ozone Read" button can be used to retrieve an instrument reading.
The lower part of the panel is visible only for SRPs:
Scaler 1: The current reading from the SRP for the Scaler 1 value.
Scaler 2: The current reading from the SRP for the Scaler 2value.
Temperature: The current temperature in the SRP cell.
Pressure: The current pressure in the SRP cell.
Valve 1: The current state of cell 1 can be either reference air or O3. This will allow control of the valve by
the user during system inactivity.
Valve 2: The current state of cell 2 can be either reference air or O3. This will allow control of the valve by
the user during system inactivity.
Shutter: The current state of the shutter can be either open or closed. This is a button and allows control of
the shutter by the user during system inactivity.
4) None
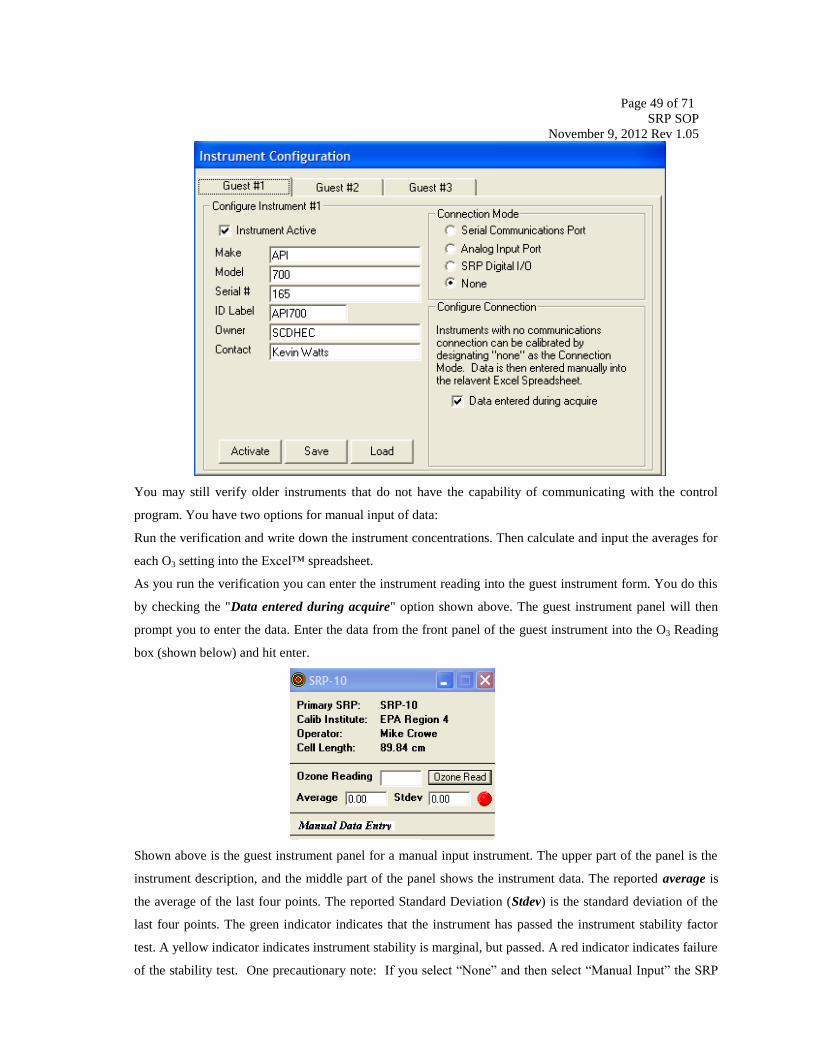
Page 49 of 71
SRP SOP
November 9, 2012 Rev 1.05
You may still verify older instruments that do not have the capability of communicating with the control
program. You have two options for manual input of data:
Run the verification and write down the instrument concentrations. Then calculate and input the averages for
each O3 setting into the Excel™ spreadsheet.
As you run the verification you can enter the instrument reading into the guest instrument form. You do this
by checking the "Data entered during acquire" option shown above. The guest instrument panel will then
prompt you to enter the data. Enter the data from the front panel of the guest instrument into the O3 Reading
box (shown below) and hit enter.
Shown above is the guest instrument panel for a manual input instrument. The upper part of the panel is the
instrument description, and the middle part of the panel shows the instrument data. The reported average is
the average of the last four points. The reported Standard Deviation (Stdev) is the standard deviation of the
last four points. The green indicator indicates that the instrument has passed the instrument stability factor
test. A yellow indicator indicates instrument stability is marginal, but passed. A red indicator indicates failure
of the stability test. One precautionary note: If you select “None” and then select “Manual Input” the SRP
Page 50 of 71
SRP SOP
November 9, 2012 Rev 1.05
will still remember the COM Port used last time in Serial Mode. So if you used COM 1 on your last run and
you are now using “Manual Input” with a different guest assigned to COM 1 you may get a “COM Conflict
Error”. You will need to go back into the configuration and change the “None” back to “Serial” and select a
Com Port not being used and then go back to “None” and try again.
5.2 Guest Instrument Pneumatics Configuration
Guest instrument follows the sample pneumatics set-up as with the SRP initially outlined in section 3.2.3
interface through the dual external manifold. Key questions should be asked of the state operator about their
guest instrument normal configuration on how they perform verification of their transfer standard. Ask about
any special procedures or conditions they followed. Question on minimum pressure, flow requirements,
communications, password, etc… That way verification between the SRP will be done in a similar manner as
the guest instrument operates.
5.2.1 Reference supply for guest instruments
The reference air supply used in both the SRP and guest instrument should be in 1 LPM excess. Verify that
the SRP supply air is greater than the sum of all the guest instruments to prevent room air from drawing into
the manifold, check with a stopcock attached to a flow meter to make sure set-up is venting at the top of the
glass dual external manifold. Note: At end of run, or when the valves are off, more air is needed in the
reference manifold. Some guest instruments may require positive pressure for the reference and it should be
delivered at the same pressure used during guest instrument verification.
5.2.2 Sample supply for guest instruments.
The sample supply for guest instrument should be taken from one of the four fittings on the dual external
manifold “S”. Prior to initiating a run, ensure that there is at least one liter per minute of excess by using a
stopcock and a rotameter to check sample flow at the top of the glass sample manifold. Ensure that the guest
instrument is being operated under normal conditions. Guest Instrument Calibration Information
The SRP comparison is accomplished by comparing a minimum of 7 replicate values of a zero point and a
minimum of 6 upscale audit concentrations points. This 7 replicate 6 upscale concentration test is considered
a cycle. At a minimum, the comparison will consist of three cycles (approximately 1 hour per cycle). For an
acceptable comparison, the average slopes of the 7 replicates for each audit point must be within ± 3% for all
three cycles and ± 3 ppb at the 0 intercept. The SPRControl program allows for unattended runs, making it is
easy to run additional replicates and cycles overnight during these verification tests.
NOTE on running a 6x6; This is basically the same as mentioned above but it would be 3 cycles (or more)
per day and the range is 4% and the guest instruments should be powered down for a minimum of one hour
before starting the next day’s challenges.
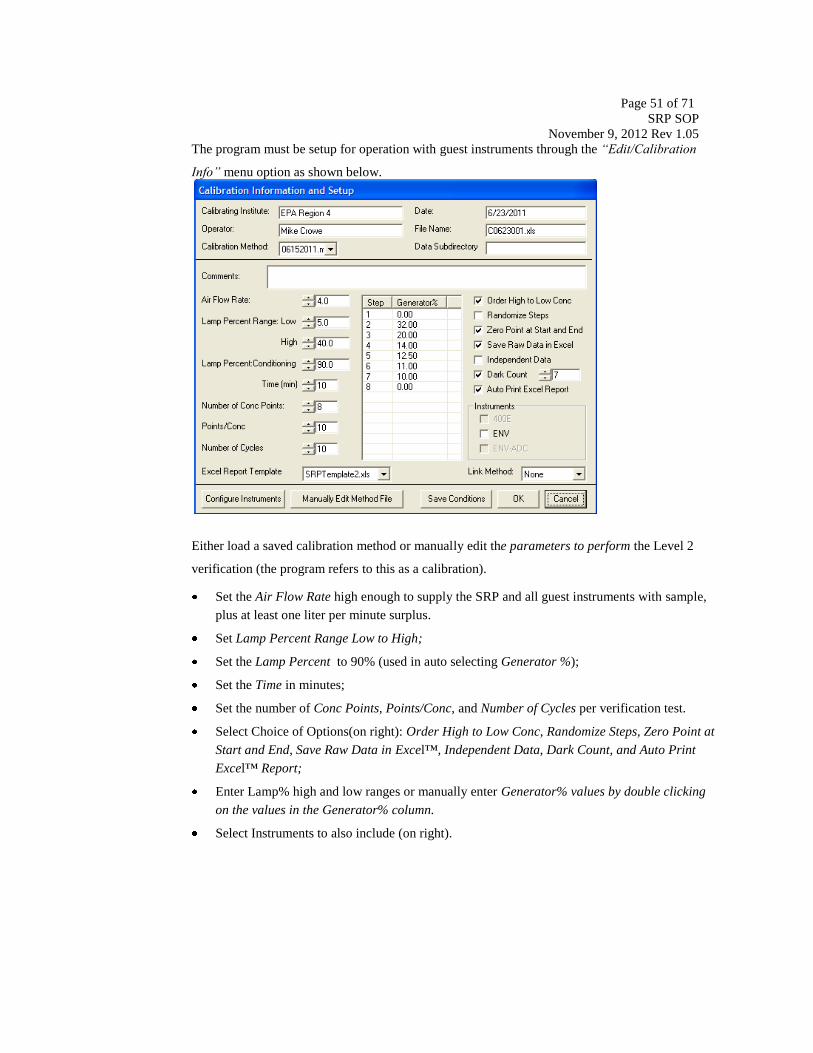
Page 51 of 71
SRP SOP
November 9, 2012 Rev 1.05
The program must be setup for operation with guest instruments through the “Edit/Calibration
Info” menu option as shown below.
Either load a saved calibration method or manually edit the parameters to perform the Level 2
verification (the program refers to this as a calibration).
Set the Air Flow Rate high enough to supply the SRP and all guest instruments with sample,
plus at least one liter per minute surplus.
Set Lamp Percent Range Low to High;
Set the Lamp Percent to 90% (used in auto selecting Generator %);
Set the Time in minutes;
Set the number of Conc Points, Points/Conc, and Number of Cycles per verification test.
Select Choice of Options(on right): Order High to Low Conc, Randomize Steps, Zero Point at
Start and End, Save Raw Data in Excel™, Independent Data, Dark Count, and Auto Print
Excel™ Report;
Enter Lamp% high and low ranges or manually enter Generator% values by double clicking
on the values in the Generator% column.
Select Instruments to also include (on right).
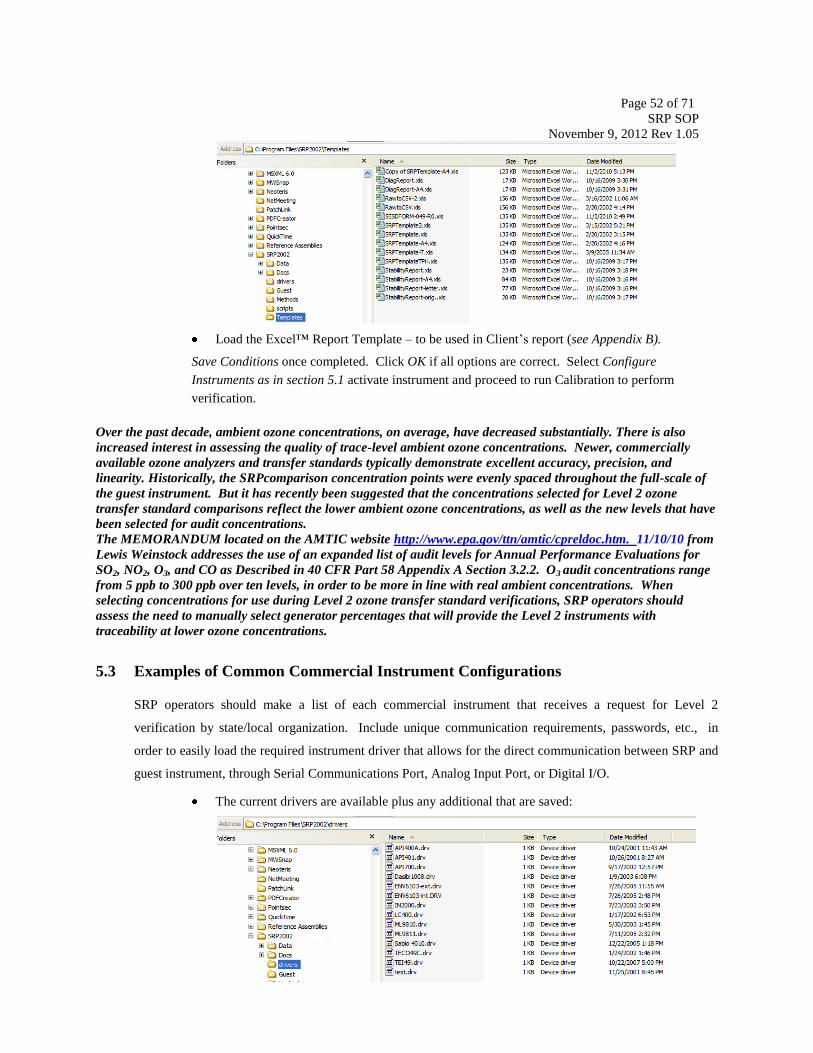
Page 52 of 71
SRP SOP
November 9, 2012 Rev 1.05
Load the Excel™ Report Template – to be used in Client’s report (see Appendix B).
Save Conditions once completed. Click OK if all options are correct. Select Configure
Instruments as in section 5.1 activate instrument and proceed to run Calibration to perform
verification.
Over the past decade, ambient ozone concentrations, on average, have decreased substantially. There is also
increased interest in assessing the quality of trace-level ambient ozone concentrations. Newer, commercially
available ozone analyzers and transfer standards typically demonstrate excellent accuracy, precision, and
linearity. Historically, the SRPcomparison concentration points were evenly spaced throughout the full-scale of
the guest instrument. But it has recently been suggested that the concentrations selected for Level 2 ozone
transfer standard comparisons reflect the lower ambient ozone concentrations, as well as the new levels that have
been selected for audit concentrations.
The MEMORANDUM located on the AMTIC website http://www.epa.gov/ttn/amtic/cpreldoc.htm. 11/10/10 from
Lewis Weinstock addresses the use of an expanded list of audit levels for Annual Performance Evaluations for
SO2, NO2, O3, and CO as Described in 40 CFR Part 58 Appendix A Section 3.2.2. O3 audit concentrations range
from 5 ppb to 300 ppb over ten levels, in order to be more in line with real ambient concentrations. When
selecting concentrations for use during Level 2 ozone transfer standard verifications, SRP operators should
assess the need to manually select generator percentages that will provide the Level 2 instruments with
traceability at lower ozone concentrations.
5.3 Examples of Common Commercial Instrument Configurations
SRP operators should make a list of each commercial instrument that receives a request for Level 2
verification by state/local organization. Include unique communication requirements, passwords, etc., in
order to easily load the required instrument driver that allows for the direct communication between SRP and
guest instrument, through Serial Communications Port, Analog Input Port, or Digital I/O.
The current drivers are available plus any additional that are saved:
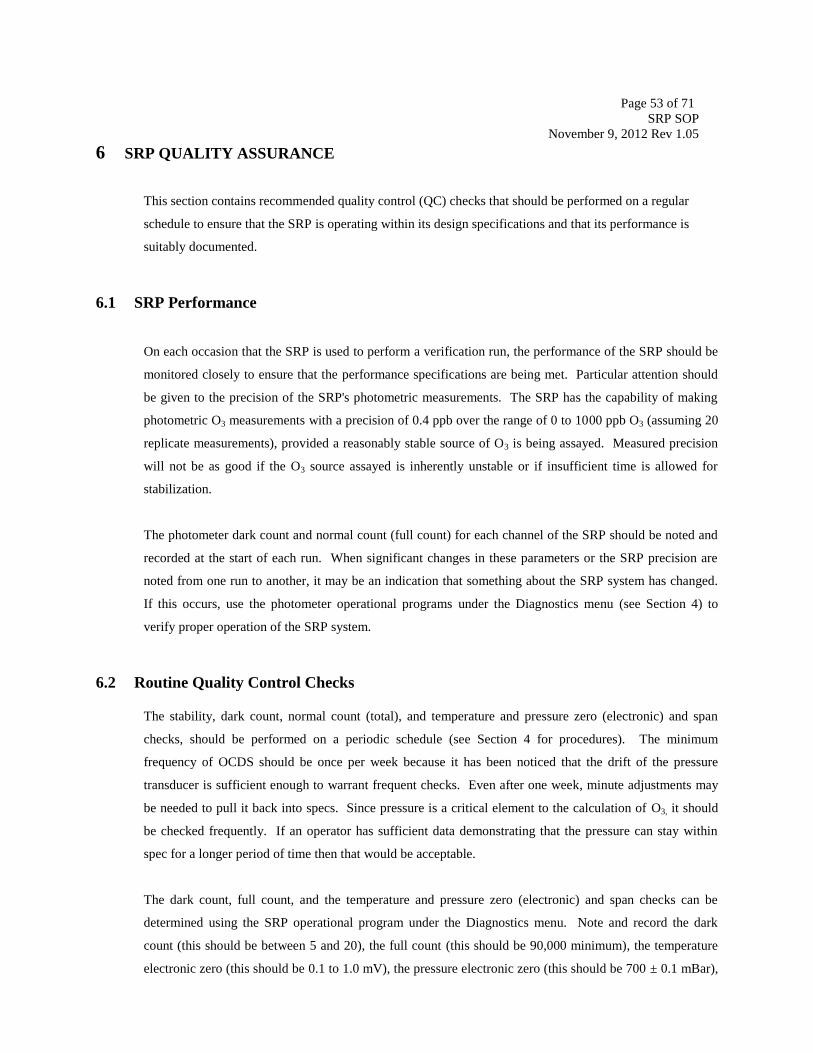
Page 53 of 71
SRP SOP
November 9, 2012 Rev 1.05
6 SRP QUALITY ASSURANCE
This section contains recommended quality control (QC) checks that should be performed on a regular
schedule to ensure that the SRP is operating within its design specifications and that its performance is
suitably documented.
6.1 SRP Performance
On each occasion that the SRP is used to perform a verification run, the performance of the SRP should be
monitored closely to ensure that the performance specifications are being met. Particular attention should
be given to the precision of the SRP's photometric measurements. The SRP has the capability of making
photometric O3 measurements with a precision of 0.4 ppb over the range of 0 to 1000 ppb O3 (assuming 20
replicate measurements), provided a reasonably stable source of O3 is being assayed. Measured precision
will not be as good if the O3 source assayed is inherently unstable or if insufficient time is allowed for
stabilization.
The photometer dark count and normal count (full count) for each channel of the SRP should be noted and
recorded at the start of each run. When significant changes in these parameters or the SRP precision are
noted from one run to another, it may be an indication that something about the SRP system has changed.
If this occurs, use the photometer operational programs under the Diagnostics menu (see Section 4) to
verify proper operation of the SRP system.
6.2 Routine Quality Control Checks
The stability, dark count, normal count (total), and temperature and pressure zero (electronic) and span
checks, should be performed on a periodic schedule (see Section 4 for procedures). The minimum
frequency of OCDS should be once per week because it has been noticed that the drift of the pressure
transducer is sufficient enough to warrant frequent checks. Even after one week, minute adjustments may
be needed to pull it back into specs. Since pressure is a critical element to the calculation of O3, it should
be checked frequently. If an operator has sufficient data demonstrating that the pressure can stay within
spec for a longer period of time then that would be acceptable.
The dark count, full count, and the temperature and pressure zero (electronic) and span checks can be
determined using the SRP operational program under the Diagnostics menu. Note and record the dark
count (this should be between 5 and 20), the full count (this should be 90,000 minimum), the temperature
electronic zero (this should be 0.1 to 1.0 mV), the pressure electronic zero (this should be 700 ± 0.1 mBar),

Page 54 of 71
SRP SOP
November 9, 2012 Rev 1.05
the temperature span (this should agree within ±0.2oC), and the pressure span (this should agree within
±0.10 mbar).. Use a local barometer to determine the pressure span check comparability. The SRP pump
must be off during this comparison. The results of the photometer checks should be compared with the
results of previous checks and recorded..
6.3 Standby Level 2 Transfer Standard
It is highly recommended that all regional SRP operators maintain, in ready reserve status, a fully verified
Level 2 O3 transfer standard (see reference 10 for guidance). These certified transfer standards can be used
as backup for the SRPs in case of a malfunction, or as referee standards if disputes arise during verification
of guest standards. They can also be used as active field Level 2 transfer standards.
6.4 Verification of the SRP to SRP
Verification of the network SRPs is required on a regular basis and is conducted by EPA using a protocol
developed jointly by EPA and NIST. The verification process is a check to see if the original verification,
conducted by NIST, is still applicable. It is not used to change or adjust the original empirical relationship of
the two SRPs. Linear regression slopes of 1.00 ± 0.01, with intercepts of zero ± 1 ppb, should be considered
acceptable. The verification procedure should only be conducted by a person who is intimately familiar and
experienced with the operation of the SRP and pertinent related documents. This section describes the
verification process and gives all procedures, specifications, and other requirements for the verification of the
network SRPs.
6.4.1 Verification Protocol
The SRP verification protocol is based on the requirement that the EPA and NIST Primary SRPs
be directly intercompared once a year and consists of the following steps:
1) Set up traveling SRP as a guest.
2) Do not use the traveling SRP to generate Ozone.
3) Perform and Pass all QA checks first..
4) The verification is set up to be similar to the NIST verification as follows.
5) The software calls it a calibration, but for our purposes it is verification. Although we
may use the two terms interchangeably, it needs to be noted that this is verification.
6) Set up the calibration for a minimum of 3 cycles.
7) The maximum concentration point should be 1000 ppb ± 20 ppb.
8) The minimum concentration point should be < 25 ppb.
9) The average number of readings per concentration point should be a minimum of 7.
10) The MFC Flow should be sufficient to provide flow to all the instruments plus an over
flow of about ≥1 liter per minute. The Lamp % will be whatever setting is needed to
achieve steps 7 and 8 above.
11) The minimum number of concentration points is 10 (not including the Zero points).
The SRP will evenly space the concentration points between the high to the low based
on the % Lamp Power.
12) There should be a Zero at the end and at the start.
13) Passing criteria is Slope = 1.00 ± 0.01 and Intercept = 0.0 ± 1.00 ppb.
Page 55 of 71
SRP SOP
November 9, 2012 Rev 1.05
Before each intercomparison is initiated, the operation of each SRP must be checked and appropriately
documented on the SRP Operating Characteristics Data Sheet example included in Appendix B. Adjustment
of critical SRP components (i.e., temperature and pressure circuitry) and operating parameters (i.e., dark
counts and full-scale counts) must be performed as specified in the pre-verification checkout procedure in
Section: 4.2.
If an intercomparison of the EPA Primary SRP and a Network SRP indicates a disagreement [i.e., the
network SRP's linear regression slope and intercept are outside the acceptable criteria (linear regression slope
of 1.00 ± 0.01 with an intercept of zero ± 1 ppb)], and the disagreement cannot be resolved, the EPA and
NIST Primary SRPs must be directly intercompared to resolve the difference.
If there is no difference between the EPA and NIST Primary SRPs, the problem resides with the Network
SRP. Normally, problems with the Network SRP that could result in such a disagreement would be
identified during the pre-verification checkout and resolved at that point. The technical guidance provided in
Section 8 identifies symptoms of typical SRP problems, causes of the symptoms, and presents solutions and
corrective actions.
All Verification intercomparisons shall consist of nine (9) replicate analyses per O3 concentration, with 12
concentrations over a range of 0 to 1000 parts per billion (ppb) (preferably evenly spaced), starting and
ending with an O3 concentration of zero. The precision of the replicates at each concentration should be such
that the standard deviation is less than or equal to 1.0 ppb or 0.2 percent of the indicated photometer
concentration (whichever is greater). The order of the comparison concentrations may be ascending,
descending, or random (see the step-by-step procedure in Section 3.0).
Page 56 of 71
SRP SOP
November 9, 2012 Rev 1.05
7 SRP SYSTEM ADJUSTMENTS
7.1 Adjustments of SRP Pressure Measurement
SRP Program: Scaler Test
Equipment: Small (Jeweler’s) Screwdriver
Specification: Zero (700.0 0.1 mbar),
Span (Atm. Lab Pressure Standard Value 0.2 mbar)
See Figure(s):
The measurement of pressure is done using a Setra Model 270 pressure transducer which has a pressure
measurement range of 700 to 1100 millibar (mbar) and an output signal of 0 to 5 V. This voltage signal then
enters the SRP electronics where it is proportionally scaled then converted to a frequency. The
corresponding frequency is counted in the SRPs 5 second counting cycle producing a final pressure value.
Adjustments to the Setra pressure transducer are only to be done by Setra. Therefore, the only pressure
measurement adjustments that need to be made are the SRP Circuits Pressure ZERO and SPAN. The
difficulty with this procedure is that adjustments made to the SRP Circuits Pressure Zero affect the SRP
Circuits Pressure Span and likewise, adjustments made to the SRP Circuits Pressure Span affect the SRP
Circuits Pressure Zero. For this reason it is often necessary to go back and forth from each
measurement/adjustment for several iterations until both are set to the correct value.
7.1.1 SRP Pressure Zero (700.0 0.1 mbar)
The SRP electronics module has two sets of ZERO and SPAN adjustment potentiometers mounted on the
front panel. The upper set for Temperature, and the lower set for Pressure. Clockwise rotation will
increase the values, and counter clockwise will decrease the values. Additionally, there are two sets of
RUN/CAL switches, and red (POSITIVE) test points. A common black (NEGITIVE) test point is used for
both temperature and pressure. The RUN/CAL switch can be changed at any time regardless of the
operation mode of the SRP. Also, voltage measurements can be made at the test points at any time.
To check/adjust the SRP Pressure Zero:
Run the “Scaler Test” program (See Program Control Section) which will update the SRP
scalers every 5 seconds continuously.
Place the RUN/CAL switch to CAL and observe the pressure value readings on the front
panel of the SRP electronics module.
Adjust the pressure zero potentiometer until the pressure value reads 700.0 0.1 mbar.
7.1.2 SRP Pressure Span (Atm. Lab Pressure Standard Reading 0.2 mbar)

Page 57 of 71
SRP SOP
November 9, 2012 Rev 1.05
To check/adjust the SRP Pressure Span:
Make sure the SRP sample pump is off, and no pressure build up is occurring due to airflow from
any air source. The SRP should be measuring atmospheric pressure to be compared with your
atmospheric lab pressure standard.
Run the “scaler test” program (See Program Control Section) which will update the SRP
scalers every 5 seconds continuously.
Place the RUN/CAL switch to RUN and observe the pressure value readings on the front
panel of the SRP electronics module front panel.
Adjust the pressure zero potentiometer until the pressure value reads (Atmospheric Lab
Pressure Standard reading) 0.1 mbar.
If an adjustment was made it will now be necessary to go back and check the SRP Pressure Zero again.
Continue back and forth from the SRP Pressure Zero and Span until both values are set within their limits.
This procedure can initially be lengthy and troublesome, but with practice will be improved.
7.2 Adjustments of SRP Temperature Measurement
SRP Program: Scaler Test
Equipment: Small (Jeweler’s) Screwdriver, Digital Voltmeter,
STOLAB Temperature Calibrator
Specification: STOLAB Circuit Card Zero (0.20 mV 0.10 mV)
STOLAB Circuit Card Span (300.0 0.1 mV, or 1000.0 0.1 mV)
SRP Circuits Zero (0.20 mV 0.10 mV)
SRP Circuits Span (30.000 0.010 C or 100.000 0.010 C)
See Figure(s):
The measurement of temperature is done using a Stow Laboratories (STOLAB) Model PL-103 temperature
sensor and a STOLAB Model 954 PL-C circuit card, which produces a voltage signal corresponding to a
specific temperature. The voltage range of 0.0 mV to 1000.0 mV is equal to a temperature range of 0.0 C to
100.0 C (10 mV/ C). This voltage signal then enters the SRP electronics where it is proportionally scaled
then converted to a frequency. The corresponding frequency is counted in the SRPs 5 second counting cycle
producing a final temperature value. Therefore, the temperature measurement adjustment procedures are
done in two separate steps (A) STOLAB Circuit Card, and (B) SRP Circuits.
Calibration of both circuits can be done using a STOLAB temperature calibrator that provides two fixed
temperature points. The standard STOLAB PL-100 C calibrator covers the full range of the STOLAB circuit
card with a 0.0 C, and a 100.0 C calibration point. A special order STOLAB PL-0/30 C calibrator can also
be used with 0.0 C, and 30.0 C calibration points. Since the SRP is normally not operated above 30.0 C,
the special order calibrator was provided for use with the SRP, but it has been demonstrated that there is no
advantage to using it. Either type of STOLAB calibrator can be sent back to STOLAB for a calibration
check on some regular interval.

Page 58 of 71
SRP SOP
November 9, 2012 Rev 1.05
Additionally, calibration of the STOLAB circuit card and the SRP circuits can be performed by immersing
the SRP’s STOLAB Model PL-103 temperature sensor into a temperature bath of known temperatures
measured by a certified temperature measurement device.
7.2.1 STOLAB Circuit Card Zero (0.0 0.1 mV)
The STOLAB Circuit Card plugs into the SRP main interface and timing generation board (SRP
main board) inside the SRP electronics module. It has ZERO and SPAN adjustment
potentiometers mounted on it facing upward inside the SRP electronics module. These
potentiometers are easily accessible once the top lid of the SRP electronics module is slid back.
Clockwise rotation will increase the values, and counter clockwise will decrease the values. The
measurement of the STOLAB voltage signal is done on the SRP main board at test points (TP 2)
(positive), and TP 14 (analog ground). There are additional analog ground test points on the SRP
main board that can also be used for the ground connection.
To check/adjust the STOLAB Circuit Card Zero using the STOLAB calibrator:
Locate STOLAB temperature sensor socket on the rear panel of the SRP electronics module.
Remove STOLAB temperature sensor and replace with STOLAB calibrator. Allow 15
minutes for STOLAB calibrator to stabilize. Place STOLAB calibrator switch on 0.0 C.
Slide SRP electronics module top lid back until STOLAB circuit card is accessible.
Remember that once the SRP electronics module lid is opened the temperature inside may be
affected which can affect the operation of the electronics inside. For this reason it is suggested to
make measurements and adjustments as quickly as possible to minimize temperature drift effects
of electronic components inside the SRP electronics module.
Using a suitable voltage measurement device (DVM) on a mV range, measure the voltage
across TP2 and TP14 then adjust the STOLAB Circuit Card Zero potentiometer until the
voltage reading is 0.0 and 0.1 mV. This is typically easily done to a tenth of a millivolt or
better.
7.2.2 STOLAB Circuit Card Span (300.0 0.1 mV, or 1000.0 0.1 mV)
To check/adjust the STOLAB Circuit Card Span using the STOLAB calibrator:
Place the STOLAB calibrator switch to either the 30 C, for the 100 C position depending on
which calibrator you are using.
Now measure the voltage across TP2 and TP14 and adjust the STOLAB Circuit Card Span
potentiometer to obtain desired value. For the 30 C calibrator the voltage reading should be
300.0 0.1 mV, and for the 100 C calibrator the reading should be 1000.0 0.1 mV.
Remember that the DVM must be set on an appropriate range for the measured value.
Page 59 of 71
SRP SOP
November 9, 2012 Rev 1.05
If an adjustment was made to the STOLAB Circuit Card span, it may be desirable to go back
to the 0 C calibrator switch setting and check that the STOLAB Circuit Card Zero has not
changed.
Once this has been completed remove the DVM connections and slide SRP electronics
module lid completely back on. The STOLAB circuit card is now calibrated.
7.2.3 SRP Circuit Zero (between 0.1 to 1.0 mV)
As mentioned previously, the SRP electronics module has two sets of Zero and Span adjustment
potentiometers mounted on the front panel. Clockwise rotation will increase the values, and
counter clockwise will decrease the values. The upper set for Temperature, and the lower set for
Pressure. Additionally, there are two sets of RUN/CAL switches, and red (POSITIVE) test points.
A common black (NEGITIVE) test point is used for both temperature and pressure. The
RUN/CAL switch can be changed at any time regardless of the operation mode of the SRP. Also,
voltage measurements can be made at the test points at any time.
To check/adjust the SRP Circuits Zero:
Place the temperature RUN/CAL switch to CAL and measure the voltage across the red
temperature (+), and the common black (-) test points using a millivolt range.
The voltage should be set to a value between 0.1 – 1.0 mV. Under most conditions, this value
should not change once set properly.
The SRP electronic zero is a voltage setting and should not be confused with a value read from the
SRP electronics module front panel temperature display. A common mistake is to set the
STOLAB calibrator to the 0 C position and adjust the SRP circuit zero until the front panel
display reads 00.000
7.2.4 SRP Circuits Span (30.000 0.010 C or 100.000 0.010 C)
To check/adjust the SRP Circuits Span:
Place the STOLAB calibrator switch to the 30 C, or 100 C depending on which is being
used. Remember to make sure the STOLAB calibrator is warmed up.
Run the “Scaler Test” program (See SRP Program Control Section) so the SRP continuously
updates the scalers every 5 seconds.
Adjust the SRP temperature span potentiometer until the SRP electronics module front panel
display reads 30.0 0.1, or 100.0 0.1 depending on which STOLAB calibrator you are
using.
The front panel display provides 3 decimal places, but the real temperature is only known to 1
decimal place.
Page 60 of 71
SRP SOP
November 9, 2012 Rev 1.05
7.3 Adjustment of SRP UV Source Lamp Alignment
SRP Control Program: Scaler Test
Equipment and/or Tools: Small Screwdriver, or Allen (Hex) Wrench
Frequency Counter
Specification: Source Lamp (adjust to maximum intensity)
See Figure(s):
There are several manufacturers of UV source lamps that are adequate to be used in the SRP. There are also
two known types of lamps that can be used in the SRP. The first is the Vycor shielded lamp, and the second
is the O3 free quartz lamp. Both lamps block out lower wavelength UV radiation that produces O3. It is
suggested to note which type and manufacturer’s lamp is installed in the SRP. Either type of lamp will be
manufactured with a U tube shape with electrode on either end. This design produces light of higher
intensities on two opposite sides, and lower intensities on the two other opposite sides. Adjustment of the
SRP UV source lamp is done to allow light of the highest intensity to enter the optical systems of the SRP.
Whether a new UV source lamp has been installed, or a currently installed UV source lamp is being re-
adjusted, the procedure is the same.
The SRP UV source lamp is mounted inside the UV source lamp block and is held in place with a setscrew.
The setscrew is normally made of nylon and can be either a straight screwdriver slotted, or Allen (hex) socket
type. The lamp alignment is adjusted by rotating the lamp and/or by positioning the lamp further in or out of
its socket to obtain the maximum signal output. The measurement of the signal output can be done by simply
running the “Scaler Test” program and monitoring the scaler counts, or by use of a frequency counter to
measure the frequency of the detector signal from either channel.
7.3.1 Alignment procedure using the Scaler Test program:
Run the “scaler test” program (See SRP Program Control Section) so the SRP scaler count values
are updating every 5 seconds. While watching the scaler count values, carefully loosen the
setscrew while holding the end of the UV lamp body. Note: the UV lamp body will be hot. Rotate
the UV lamp and/or pull out or push in as necessary to obtain the highest scaler count value in the
scaler 2 channel. Once the highest available count value is obtained, lock the lamp back in place
tightly with the setscrew. While the scaler 1 channel can be used, the scaler 2 channel is
recommended because it is always a lower value and should be maximized. Because the program
only updates the scaler channel count values every 5 seconds, this process may be slow.
7.3.2 Alignment procedure using a frequency counter:
Remove the scaler 2 output cable from the Lemo connector. This can be done at any time
without damaging the system, but when a scaler cable is removed there is no signal provided
to the counter circuits, so the scaler value will go to zero.

Page 61 of 71
SRP SOP
November 9, 2012 Rev 1.05
Using the appropriate connector, connect the scaler 2 output channel to the frequency counter.
The appropriate connector will depend on the input connection of the frequency counter. A
Lemo to BNC connector should have been provided with the SRP. The BNC connection then
can be used directly to a BNC input, or converted to another connection device. Once the
frequency counter is connected properly it will provide instantaneous measurement of the
output signal frequency.
While watching the scaler frequency values, carefully loosen the set screw while holding the
end of the UV lamp body. Note: the UV lamp body will be hot.
Rotate the UV lamp and/or pull out or push in as necessary to obtain the highest scaler
frequency value from the scaler 2 channel.
Once the highest available frequency is obtained, lock the lamp back in place tightly with the
set screw. In most cases, once the lamp has been locked in place, the value will change some.
7.4 Adjustment of SRP UV Source Lamp Block Temperature
SRP Control Program: None
Equipment and/or Tools: Temperature Measurement Device
Specification: Range of 45-65 C 0.1 C of Setting
See Figure(s):
The desired UV source lamp block temperature will vary depending on which type of lamp used, and can
also depend on the stability of the lamp. The Vycor shielded lamp is typically operated between 40-55 C,
where as the O3 free quartz lamp is typically operated between 50-65 C. Each lamp has its own
characteristics and may perform better at a specific operating temperature and power level. It may be
desirable to test the lamp's characteristics at various temperatures and power level settings to determine the
most stable operating conditions (See SRP Stability Measurement and Adjustment).
7.4.1 To adjust the UV source lamp block temperature:
NOTE: Please update with the PID controller
All of the EPA SRPs have been upgraded with two Watlow SD Series PID Temperature
controllers. Before adjusting the block temperature, check to make sure that the lamp alignment is
set properly and you are receiving the maximum intensity. You will need to run the stability
monitor to be able to watch the changes to the Scaler Counts. To adjust the temperature simple
press the up arrow button on the face of the controller to the desired setting. Watch the scaler
counts, if they start to increase then keep bumping up the temperature until the scaler counts stop
rising and start decreasing. Once you have found that ideal setting that will give you the
maximum scaler count you will then need to Auto Tune the controller. The Auto Tune can be
initiated by pressing the green key three times and the controller will read “Auto no”, Press the
Up or Down key once and the display will change to “Auto on”. Press the “Infinty” key and the
Auto Tune will run. The “Auto Tune’ will ramp the temperature up and down a few times during
it’s cycle, so it is important to let it complete before collecting any data with the SRP. Allow
about 1 hour for the cycle to complete and it may be necessary to run the :Auto Tune” more than
once. Once it has successfully completed an “Auto Tune” the PID Controller will hold the
Page 62 of 71
SRP SOP
November 9, 2012 Rev 1.05
temperature set point plus or minus 0.1 degree Celsius. Details on how to program the PID
Controller is set out in SRP PID Programming and Tuning.pdf attachment. For a detailed version
that includes all the programming variables see the attached manual Series SD Rev F User
Manual.pdf.
7.5 Adjustment of SRP UV Source Lamp Power level
SRP Control Program: Scaler Test
Equipment and/or Tools: Small (Jeweler’s) Screwdriver
Specification: Scaler 2 Counts > 100,000 Counts
Scaler 1 Counts > 100,000 <250,000Counts, but will always be higher
than Scaler 1 values
See Figure(s): 1
7.5.1 Adjustment of the SRP UV Source Lamp Power Level
Source Lamp Level adjustment is done by a simple adjustment to the PCI 2400 UV lamp power
supply board (PCI 2400) lamp current level potentiometer. The PCI 2400 is mounted just inside
the electronics module on the right side. The small potentiometer is located toward the back of the
circuit card as it is mounted in the SRP electronics module. Clockwise rotation will increase the
lamp current level, and counter clockwise will decrease the lamp current level.
7.6 SRP Stability Measurement and Adjustment
SRP Program: Stability Monitor
Equipment: none
Specification: Standard Deviation of Scaler 1 and 2 Counts 25.0
Standard Deviation of Ratio of S1/S2 0.00003
See Figure(s):
Once the SRP UV Source Lamp Alignment, Block Temperature, and Power level settings have been
completed it is necessary to test the stability of the lamp signal. This is done while also measuring the
stability of the SRP’s detector’s, and counter circuitry for scaler 1, scaler 2, temperature, and pressure. The
measurement of these signals is done using the “Stability Monitor” program (See SRP Control Program
Section). The Stability Monitor program takes a specific number (Default=20) of 5 second count cycles,
computes the average and standard deviation of the set, and repeats for a specific number of cycles
(Default=10). While the average scaler count 1 and 2 values are not critical as long as they are above the
minimum requirements, the standard deviation of a set of 20 scaler counts gives an indication of the stability
of the UV lamp signal. Because the SRP is always making measurements based on the ratio of the counts of
one scaler to the other, the most important stability measurement is the standard deviation of the ratio of the
scaler 1 to scaler 2 (S1/S2). This value provides a measurement of the stability of the detectors and the
counting process used in obtaining the transmittance measurement used in determining the amount of O3
present in the absorption cells.

Page 63 of 71
SRP SOP
November 9, 2012 Rev 1.05
Commercial UV lamps used in the SRP can significantly vary in stability, but there are steps that can be
taken to improve the stability of an SRP lamp. One specific thing is time. Most UV lamps are noisier when
new, than after they have been “burned in” for awhile. UV lamp manufacturers do some “burn in”, but it is
not always enough. Therefore, it is not uncommon for a newly installed SRP source lamp to be somewhat
noisy when first installed, and improve over time. The problem with “burning in” UV lamps is that it
decreases the useable life of the lamp. The next two factors that can improve the SRP lamp stability are
temperature and power setting. These two factors can be adjusted independently, or simultaneously to
achieve a more stable SRP lamp signal. It may be desirable to test the SRP lamp stability at various
temperature and power level settings to obtain the most stable operating conditions. A typical default setting
for an O3 free quartz lamp would be block temperature: 60.0 2 C, and power level setting such that the
scaler 2 counts are: 100,000 2000 counts. After making these adjustments allow the system to settle down
overnight, and then run the stability monitor program (See SRP Control Program Section). If the results are
not acceptable then proceed with a different block temperature setting, and/or power level setting trying to
obtain desirable stability results. It may be necessary to allow the system to stabilize for a few hours, or
overnight before expecting noticeable results. See also Section 7.4.1
7.7 Adjustment of SRP Dark Count Scaler Values
SRP Control Program: Scaler Test
Equipment and/or Tools: Small (Jeweler’s) Screwdriver
Specification: Between 5 and 25 counts
See Figure(s):
The adjustment of the SRP dark count scaler values (dark counts) are done to set the two detector scaler
channels to baseline values. The dark counts are subtracted from the full scaler count values during an O3
measurement. Each detector channel is independent of the other and must be adjusted separately. The dark
counts are adjusted by the offset adjustment of the detector amplifiers. The signal also is converted to a
frequency by a voltage to frequency (V/f) converter. These electronic components are known to be affected
by temperature and humidity. Maintaining a constant ambient temperature and humidity will greatly
minimize drifting of the dark counts. It is recommended to maintain the ambient temperature to 0.2 C/hour
drift, and keep the ambient relative humidity below 50%.
To check/adjust the SRP dark count scaler values:
Close the shutter on the SRP to be adjusted and run the “Scaler Test” program (See SRP
Program Control Section). This will allow the scalers to be updated every five seconds, but
with the source lamp signal blocked from entering the absorption cells and so the detectors do
not see any light.
Page 64 of 71
SRP SOP
November 9, 2012 Rev 1.05
Adjust the two independent potentiometers mounted on the main detector circuit board
accessible through small holes on top of the detector housing. The channels are labeled 1 and
2 on the back side of the detector housing. Clockwise rotation will increase the dark count
values, and counter clockwise will decrease the dark count values. Be careful not to turn the
screwdriver when it is not properly in the potentiometer adjustment screw slot to avoid
breaking the potentiometer off of the main detector circuit board.
7.8 Adjustment of SRP Ozone Generator Block Temberature
SRP Control Program: Scaler Test or Diagnostics
Equipment and/or Tools: None
Specification: 30-45 C 0.1 C
The adjustment of the Temberature Block for the Ozone Generator is critical in maintaining level Ozone readings at
higher concentrations. If the temperature is too low then the Ozone lamp will actually heat up the Block causing the
temperature to fluctuate and adversely affection the higher level Ozone Concentrations. However, setting it too high
can over –heat the MFC affecting its overall lifespan. Carefully observe the temperature of the block while
generating high concentrations of Ozone. If you notice the temperature creeping up during that time you may want
to restet the temperature to slightly above the highest observed temperature. Some have also found that by leaving
the top open an inch or two has also been benificual in maintaining a lower steady state temperature.

Page 65 of 71
SRP SOP
November 9, 2012 Rev 1.05
8 TROUBLESHOOTING
A troubleshooting guide is given in Table 8-1. Possible causes are given and fault isolation techniques or solutions are provided for a variety of potential symptoms.
TABLE 8-1. TROUBLESHOOTING GUIDE
SYMPTOM
POSSIBLE CAUSE
FAULT ISOLATION/SOLUTION
Both PC and SRP dead
AC power
1. House AC supply source off (check fuse or breaker).
2. AC lines not connected to power source.
PC OK but SRP dead
AC power
1. AC line not connected to power source.
2. Switch on back of electronics module not on.
3. Check main fuse on back of Electronics Module.
PC display dead
AC power
1. AC power switch on display in off position; check switch.
2. AC line not connected to power source.
No output from O3 generator
UV lamp not on
1. Disconnect O3 line from front of pneumatic module look in fitting to confirm that lamp
is off.
2. If off, open top of pneumatic module. Confirm if red or green LED illuminated on PCI
2400 power supply card.
3. If illuminated, replace generator lamp.
4. If not illuminated, check pins 10 and J on input connector to power supply for 24 VDC.
5. Check J1 connector on both ends.
6. Check 24 volt power supply in Electronics Module.
7. If all above OK, replace PCI 2400 power supply. Output from O3 generator not
steady
1. Temperature controller
2. Bad UV lamp
3. Bad PCI 2400 power supply
4. 24 volt DC power supply
1. This temperature controller is same as source block controller. See procedure in
Section 7.4, Source Block Temperature Check and Adjustment Procedure.
2. Try new lamp.
3. If still bad, check pins 10 and J on input connector to power supply for steady 24 VDC.
If not steady replace 24 volt power supply.
SRP pump dead
24 volt DC to pump
1. Check orange and yellow leads on terminal strip in Pneumatic Module for 24 VDC.
2. If 24 VDC present, check switch.
3. If OK, replace pump.
4. If 24 VDC not present in 1 above, check J1 connector on both ends.
5. Check 24 volt power supply in Electronics Module.
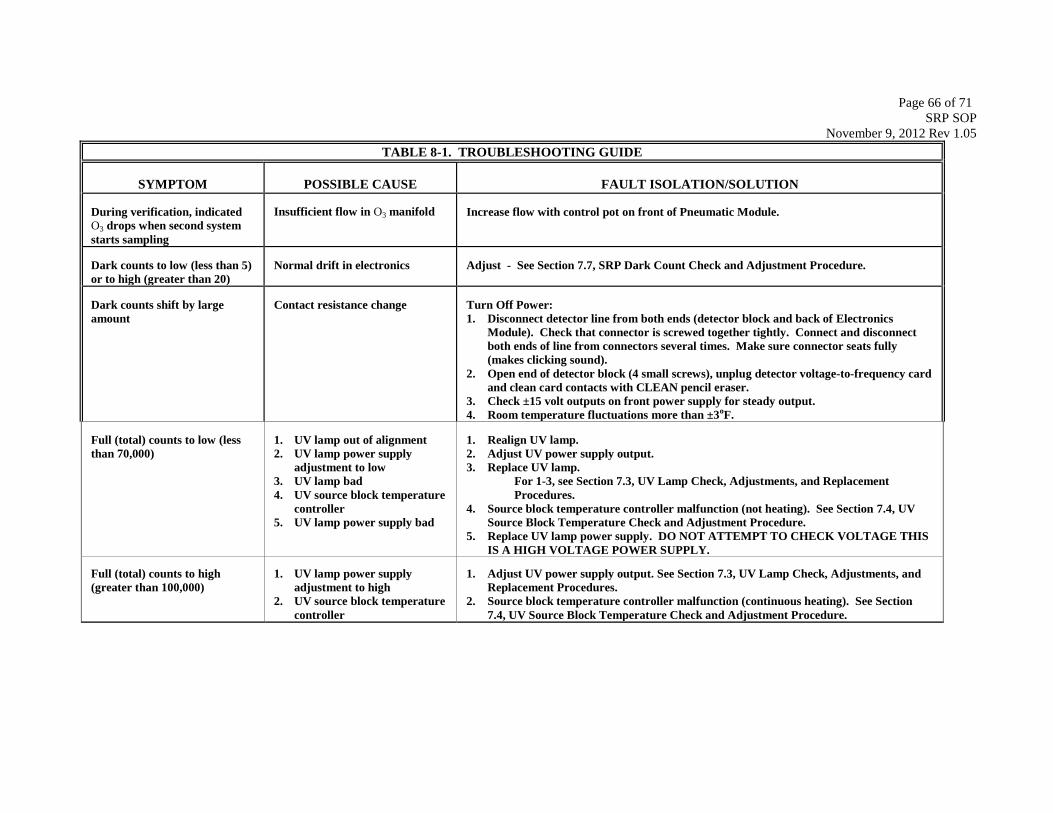
Page 66 of 71
SRP SOP
November 9, 2012 Rev 1.05
TABLE 8-1. TROUBLESHOOTING GUIDE
SYMPTOM
POSSIBLE CAUSE
FAULT ISOLATION/SOLUTION
During verification, indicated
O3 drops when second system
starts sampling
Insufficient flow in O3 manifold
Increase flow with control pot on front of Pneumatic Module.
Dark counts to low (less than 5)
or to high (greater than 20)
Normal drift in electronics
Adjust - See Section 7.7, SRP Dark Count Check and Adjustment Procedure.
Dark counts shift by large
amount
Contact resistance change
Turn Off Power:
1. Disconnect detector line from both ends (detector block and back of Electronics
Module). Check that connector is screwed together tightly. Connect and disconnect
both ends of line from connectors several times. Make sure connector seats fully
(makes clicking sound).
2. Open end of detector block (4 small screws), unplug detector voltage-to-frequency card
and clean card contacts with CLEAN pencil eraser.
3. Check ±15 volt outputs on front power supply for steady output.
4. Room temperature fluctuations more than ±3oF.
Full (total) counts to low (less
than 70,000)
1. UV lamp out of alignment
2. UV lamp power supply
adjustment to low
3. UV lamp bad
4. UV source block temperature
controller
5. UV lamp power supply bad
1. Realign UV lamp.
2. Adjust UV power supply output.
3. Replace UV lamp.
For 1-3, see Section 7.3, UV Lamp Check, Adjustments, and Replacement
Procedures.
4. Source block temperature controller malfunction (not heating). See Section 7.4, UV
Source Block Temperature Check and Adjustment Procedure.
5. Replace UV lamp power supply. DO NOT ATTEMPT TO CHECK VOLTAGE THIS
IS A HIGH VOLTAGE POWER SUPPLY. Full (total) counts to high
(greater than 100,000)
1. UV lamp power supply
adjustment to high
2. UV source block temperature
controller
1. Adjust UV power supply output. See Section 7.3, UV Lamp Check, Adjustments, and
Replacement Procedures.
2. Source block temperature controller malfunction (continuous heating). See Section
7.4, UV Source Block Temperature Check and Adjustment Procedure.
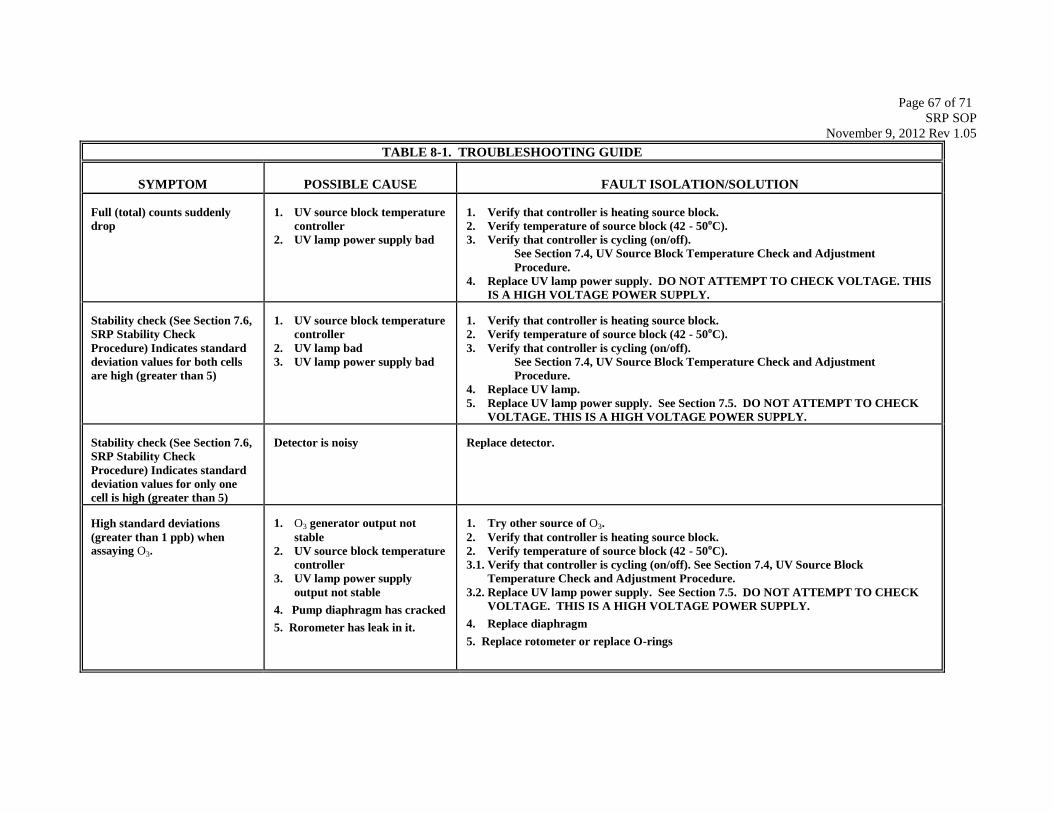
Page 67 of 71
SRP SOP
November 9, 2012 Rev 1.05
TABLE 8-1. TROUBLESHOOTING GUIDE
SYMPTOM
POSSIBLE CAUSE
FAULT ISOLATION/SOLUTION
Full (total) counts suddenly
drop
1. UV source block temperature
controller
2. UV lamp power supply bad
1. Verify that controller is heating source block.
2. Verify temperature of source block (42 - 50oC).
3. Verify that controller is cycling (on/off).
See Section 7.4, UV Source Block Temperature Check and Adjustment
Procedure.
4. Replace UV lamp power supply. DO NOT ATTEMPT TO CHECK VOLTAGE. THIS
IS A HIGH VOLTAGE POWER SUPPLY.
Stability check (See Section 7.6,
SRP Stability Check
Procedure) Indicates standard
deviation values for both cells
are high (greater than 5)
1. UV source block temperature
controller
2. UV lamp bad
3. UV lamp power supply bad
1. Verify that controller is heating source block.
2. Verify temperature of source block (42 - 50oC).
3. Verify that controller is cycling (on/off).
See Section 7.4, UV Source Block Temperature Check and Adjustment
Procedure.
4. Replace UV lamp.
5. Replace UV lamp power supply. See Section 7.5. DO NOT ATTEMPT TO CHECK
VOLTAGE. THIS IS A HIGH VOLTAGE POWER SUPPLY.
Stability check (See Section 7.6,
SRP Stability Check
Procedure) Indicates standard
deviation values for only one
cell is high (greater than 5)
Detector is noisy
Replace detector.
High standard deviations
(greater than 1 ppb) when
assaying O3.
1. O3 generator output not
stable
2. UV source block temperature
controller
3. UV lamp power supply
output not stable
4. Pump diaphragm has cracked
5. Rorometer has leak in it.
1. Try other source of O3.
2. Verify that controller is heating source block.
2. Verify temperature of source block (42 - 50oC).
3.1. Verify that controller is cycling (on/off). See Section 7.4, UV Source Block
Temperature Check and Adjustment Procedure.
3.2. Replace UV lamp power supply. See Section 7.5. DO NOT ATTEMPT TO CHECK
VOLTAGE. THIS IS A HIGH VOLTAGE POWER SUPPLY.
4. Replace diaphragm
5. Replace rotometer or replace O-rings
Page 68 of 71
DRAFT COPY – SRP SOP
June 29, 2012 draft Rev 1.04 lgp
9 MALFUNCTIONS
Anytime the SRP malfunctions or there are indications that the SRP's performance is unsatisfactory,
contact the OAQPS SRP coordinator at the following address:
Scott Moore
Office of Research and Devlopment (ORD)
National Risk Management Research Laboratory *NRMRL)
Air Pollution Prevention and Control Division (APPCD)
U.S. Environmental Protection Agency
109 TW Alexander Drive
Durham, North Carolina 27711
(919) 541-5104 Office
(919) 601-9163 Mobile
Note that any repairs should only be performed by a qualified person(s) having knowledge of electrical
and mechanical systems (done by NIST preferred). Prior consultation with the OAQPS SRP contact is
recommended before performing any repairs.
Page 69 of 71
DRAFT COPY – SRP SOP
June 29, 2012 draft Rev 1.04 lgp
10 SRP CONTROL SOFTWARE/ UPDATES
A fourth-generation control program for the SRP has been developed by NIST and is now available for
purchase. New software was required due to the unavailability of new computers with the ISA bus.
New computers are now available with the PCI bus only, which means that the SRPs must now use
new PCI control cards. SRP owners who now have the older software operating on older computers do
not have to upgrade, however NIST will no longer support the old software. Features of the new
software include:
Operates under Windows XP and Vista Uses Excel™ for report output Reports are customizable
Calibration is done using scripts, which are customizable
Up to three instruments can be compared to the SRP, including multiple SRPs
Guest instruments may be an SRP, Analog input, or Serial input
Guest O3 generator may be used in calibration (RS232 only)
Calibration methods can be saved
Methods can be linked for totally automated runs
The requirements for this new control program are:
1 Ghz or better processor (2.5 Ghz dual core recommended)
2 GB or more memory (4 GB recommended)
Microsoft Excel™ (2003 or 2007)
Windows Vista or 7.0
100 GB Hard Drive recommended
20" flat screen monitor
Two free PCI slots
CDRom drive
New Version Download (4.41)
The latest version of the control software is here: SRPControl.msi
Please save the SRPControl.msi file in the temporary directory. If you have a version prior to 4.4,
please first uninstall the software by going to the Control Panel, clicking on Add/Remove Programs,
and selecting SRP2002 to remove.
You may want to backup the SRP Directory first to save any custom instrument drivers, templates, or
guest files you may have.
After uninstalling the older version, double click the SRPControl.msi program you downloaded to start
the installation and follow the direction to install the new SRP version.
Date created: August 10, 2009 | Last updated: April 27, 2012 Contact: Webmaster
http://www.nist.gov/mml/analytical/gas/SRPpage.cfm
Page 70 of 71
DRAFT COPY – SRP SOP
June 29, 2012 draft Rev 1.04 lgp
11 REFERENCES
1. U.S. Environmental Protection Agency, Code of Federal Regulations, Title 40, Part 50,
Appendix D, July 1, 2010
2. International Standards Organization (ISO) – International Vocabulary of Basic Terms in
Metrology,JCGM_200_2008.pdf , October 08, 2008
3. U.S. Environmental Protection Agency, Transfer Standards For Calibration of Air
Monitoring Analyzers for Ozone, Technical Assistance Document, November 2010
4. National Ambient Air Quality Standards (73 FR 16436: March 27, 2008 implement its new
primary ozone standard)
5. Air Quality Index (AQI), EPA-456/F-09-001, EPA airnow.gov, February 02, 2009
6. “Upgrade and Inter-comparison of the U.S. Environmental Protection Agencies Ozone
Reference Standards”, Paper # 04-A-530-AWMA, June 22, 2004 , James E. Norris, Alan H.
Band, Robert J. Bass, and Franklin R. Guenther
7. Standard Operating Procedures And Recertification Procedures For EPA's Standard Reference
Ozone Photometer, EPA Contract 68-D3-0029, September 1997, TRC Environmental
Corporation and National Institute of Standards and Technology (NIST)
8. Hampson, R.F. (ed.). "Survey of Photochemical Rate Data for Twenty-Eight Reactions of
Interest in Atmospheric Chemistry." J. Phys. Chem Ref. Data, 2:267, 1973

Page 71 of 71
DRAFT COPY – SRP SOP
June 29, 2012 draft Rev 1.04 lgp
APPENDIX A
Example #1: Completed OCDS
(Total 4 sheets – Region 4 OCDS example)
Example #2: Excel™ Worksheet Template
(Total 4 sheets – Calibration Template)
Example #3: Example Verification Summary Report
(Single page – Compiled Calibration Template Results into Summary Report)
Example #4: Calibration Report to Client
(Total 4 sheets – Cover Page, Summary, Calibration 2 pages)
Example #5: Annual SRP to SRP Verification
(Total 4 sheets – SRP-10 and SRP-1 Reports)