Embed Size (px)
Citation preview

SonicWall® Analytics REPORTSAdministrationFor an IPFIX-Based Solution

Contents
Overview . . . . . . . . . . . . . . . . . . . . . . . . . . . . . . . . . . . . . . . . . . . . . . . . . . . . . . . . . . . . . . . . . . . . . . . . . . 4
Accessing REPORTS . . . . . . . . . . . . . . . . . . . . . . . . . . . . . . . . . . . . . . . . . . . . . . . . . . . . . . . . . . . . . . . . . . . . 4
Status . . . . . . . . . . . . . . . . . . . . . . . . . . . . . . . . . . . . . . . . . . . . . . . . . . . . . . . . . . . . . . . . . . . . . . . . . . . . . . . 5
Acquisition History . . . . . . . . . . . . . . . . . . . . . . . . . . . . . . . . . . . . . . . . . . . . . . . . . . . . . . . . . . . . . . . . . 5
Firmware Details . . . . . . . . . . . . . . . . . . . . . . . . . . . . . . . . . . . . . . . . . . . . . . . . . . . . . . . . . . . . . . . . . . 6
Firewall . . . . . . . . . . . . . . . . . . . . . . . . . . . . . . . . . . . . . . . . . . . . . . . . . . . . . . . . . . . . . . . . . . . . . . . . . . 6
Flow Reporting License Status . . . . . . . . . . . . . . . . . . . . . . . . . . . . . . . . . . . . . . . . . . . . . . . . . . . . . . . 7
System . . . . . . . . . . . . . . . . . . . . . . . . . . . . . . . . . . . . . . . . . . . . . . . . . . . . . . . . . . . . . . . . . . . . . . . . . . . 7
Flow Management . . . . . . . . . . . . . . . . . . . . . . . . . . . . . . . . . . . . . . . . . . . . . . . . . . . . . . . . . . . . . . . . . 7
Live Reports . . . . . . . . . . . . . . . . . . . . . . . . . . . . . . . . . . . . . . . . . . . . . . . . . . . . . . . . . . . . . . . . . . . . . . . . . . 8
Devices . . . . . . . . . . . . . . . . . . . . . . . . . . . . . . . . . . . . . . . . . . . . . . . . . . . . . . . . . . . . . . . . . . . . . . . . . . . . . . 9
Devices . . . . . . . . . . . . . . . . . . . . . . . . . . . . . . . . . . . . . . . . . . . . . . . . . . . . . . . . . . . . . . . . . . . . . . . . . . 9
Device List . . . . . . . . . . . . . . . . . . . . . . . . . . . . . . . . . . . . . . . . . . . . . . . . . . . . . . . . . . . . . . . . . . . . . . . 10
Related Documents . . . . . . . . . . . . . . . . . . . . . . . . . . . . . . . . . . . . . . . . . . . . . . . . . . . . . . . . . . . . . . . . . . . 11
Details . . . . . . . . . . . . . . . . . . . . . . . . . . . . . . . . . . . . . . . . . . . . . . . . . . . . . . . . . . . . . . . . . . . . . . . . . . . 12
Detailed Reports Navigation . . . . . . . . . . . . . . . . . . . . . . . . . . . . . . . . . . . . . . . . . . . . . . . . . . . . . . . . . . . . 12
Customizing Details Reports . . . . . . . . . . . . . . . . . . . . . . . . . . . . . . . . . . . . . . . . . . . . . . . . . . . . . . . . 12
Traffic Snapshots . . . . . . . . . . . . . . . . . . . . . . . . . . . . . . . . . . . . . . . . . . . . . . . . . . . . . . . . . . . . . . . . . 14
Filtering the Data . . . . . . . . . . . . . . . . . . . . . . . . . . . . . . . . . . . . . . . . . . . . . . . . . . . . . . . . . . . . . . . . . 15
Reports . . . . . . . . . . . . . . . . . . . . . . . . . . . . . . . . . . . . . . . . . . . . . . . . . . . . . . . . . . . . . . . . . . . . . . . . . . . . . 15
Applications . . . . . . . . . . . . . . . . . . . . . . . . . . . . . . . . . . . . . . . . . . . . . . . . . . . . . . . . . . . . . . . . . . . . . 16
Users . . . . . . . . . . . . . . . . . . . . . . . . . . . . . . . . . . . . . . . . . . . . . . . . . . . . . . . . . . . . . . . . . . . . . . . . . . . 17
Viruses . . . . . . . . . . . . . . . . . . . . . . . . . . . . . . . . . . . . . . . . . . . . . . . . . . . . . . . . . . . . . . . . . . . . . . . . . 17
Intrusions . . . . . . . . . . . . . . . . . . . . . . . . . . . . . . . . . . . . . . . . . . . . . . . . . . . . . . . . . . . . . . . . . . . . . . . 17
Spyware . . . . . . . . . . . . . . . . . . . . . . . . . . . . . . . . . . . . . . . . . . . . . . . . . . . . . . . . . . . . . . . . . . . . . . . . 18
Botnet . . . . . . . . . . . . . . . . . . . . . . . . . . . . . . . . . . . . . . . . . . . . . . . . . . . . . . . . . . . . . . . . . . . . . . . . . . 18
Web Categories . . . . . . . . . . . . . . . . . . . . . . . . . . . . . . . . . . . . . . . . . . . . . . . . . . . . . . . . . . . . . . . . . . 18
Sources . . . . . . . . . . . . . . . . . . . . . . . . . . . . . . . . . . . . . . . . . . . . . . . . . . . . . . . . . . . . . . . . . . . . . . . . . 18
Destinations . . . . . . . . . . . . . . . . . . . . . . . . . . . . . . . . . . . . . . . . . . . . . . . . . . . . . . . . . . . . . . . . . . . . . 18
Source Locations . . . . . . . . . . . . . . . . . . . . . . . . . . . . . . . . . . . . . . . . . . . . . . . . . . . . . . . . . . . . . . . . . 18
Destination Locations . . . . . . . . . . . . . . . . . . . . . . . . . . . . . . . . . . . . . . . . . . . . . . . . . . . . . . . . . . . . . 18
BW Queues . . . . . . . . . . . . . . . . . . . . . . . . . . . . . . . . . . . . . . . . . . . . . . . . . . . . . . . . . . . . . . . . . . . . . . 18
Blocked . . . . . . . . . . . . . . . . . . . . . . . . . . . . . . . . . . . . . . . . . . . . . . . . . . . . . . . . . . . . . . . . . . . . . . . . . 19
Threats . . . . . . . . . . . . . . . . . . . . . . . . . . . . . . . . . . . . . . . . . . . . . . . . . . . . . . . . . . . . . . . . . . . . . . . . . 19
Group Level Reports . . . . . . . . . . . . . . . . . . . . . . . . . . . . . . . . . . . . . . . . . . . . . . . . . . . . . . . . . . . . . . 19
Viewing Global and Unit Level Reports . . . . . . . . . . . . . . . . . . . . . . . . . . . . . . . . . . . . . . . . . . . . . . . 19
Scheduled Reports . . . . . . . . . . . . . . . . . . . . . . . . . . . . . . . . . . . . . . . . . . . . . . . . . . . . . . . . . . . . . . . . . 20
Schedules . . . . . . . . . . . . . . . . . . . . . . . . . . . . . . . . . . . . . . . . . . . . . . . . . . . . . . . . . . . . . . . . . . . . . . . . . . . 20
Managing the Reports . . . . . . . . . . . . . . . . . . . . . . . . . . . . . . . . . . . . . . . . . . . . . . . . . . . . . . . . . . . . . 21
Navigating the Schedules Page . . . . . . . . . . . . . . . . . . . . . . . . . . . . . . . . . . . . . . . . . . . . . . . . . . . . . . 21
Archive . . . . . . . . . . . . . . . . . . . . . . . . . . . . . . . . . . . . . . . . . . . . . . . . . . . . . . . . . . . . . . . . . . . . . . . . . . . . . 28
Personalizing Scheduled PDF Reports . . . . . . . . . . . . . . . . . . . . . . . . . . . . . . . . . . . . . . . . . . . . . . . . . . . . 28
Analytics REPORTS Administration
Contents2

Capture Client Integration with CSC-MA . . . . . . . . . . . . . . . . . . . . . . . . . . . . . . . . . . . . . . . . . . . . . . . . . . 31
SonicWall Support . . . . . . . . . . . . . . . . . . . . . . . . . . . . . . . . . . . . . . . . . . . . . . . . . . . . . . . . . . . . . . . . . . 33
About This Document . . . . . . . . . . . . . . . . . . . . . . . . . . . . . . . . . . . . . . . . . . . . . . . . . . . . . . . . . . . . . . . . . 34
Analytics REPORTS Administration
Contents3

1
Overview
This document introduces the REPORTS view for the IPFIX-based Analytics solution. This solution can be used as a stand-alone solution or it can be used as a SonicWall firewall management system. This chapter describes the Overview command options.
Topics:
• Accessing REPORTS
• Status
• Live Reports
• Devices
• Related Documents
Accessing REPORTSWhen you select the REPORTS view, the default view is REPORTS > Overview > Status. The Status page is the starting point to receive all the alerts and notifications triggered using data flow and incorporating the analytics framework.
When you first open the REPORTS view, the interface shows three work areas:
The following figure illustrates a typical view of REPORTS > Overview > Status. In this instance the Device Manager is hidden, but it can be showing by clicking on the Expand icon.
NOTE: The interface for Analytics varies because of the different configurations and types of reporting that can be set up. The images provided do not match every implementation, but should be viewed as an example that you can use as a guide while moving through the interface. Major differences are noted when needed to avoid confusion. The information for the REPORTS view in a Syslog-based Analytics solution is documented in Analytics REPORTS Administration for a Syslog-Based Solution.
NOTE: The same Status page can be seen by navigating to HOME > Overview > Status.
Device Manager In the DEVICE MANAGER, you can group the devices in your security infrastructure using the pre-defined views.
Command menu The command menu is located directly under the SonicWall logo. You can manage or monitor your devices using the commands shown here.
Work space The work space is where all the data is displayed. This is where you monitor status, see reports, set schedules, drill down for data and so forth. Similar tasks are grouped under the views identified by the icons across the top navigation of the work space. The options may vary according to your configuration.
Analytics REPORTS Administration
Overview4

For more information about using the Analytics interface, refer to “Navigation” in Analytics HOME Administration.
StatusThe system goes through a series of steps when acquiring a firewall, and these steps can be monitored on the Overview > Status page. The Status page shows different things depending upon whether you have firewall management with Analytics or on-premises Analytics, the Syslog-based option or IPFIX-based option. The interface shows which options are applicable to your implementation. This IPFIX-based option is described in this document.
Topics:
• Acquisition History
• Firmware Details
• Firewall
• Flow Reporting License Status
• System
• Flow Management
Acquisition HistoryThe Acquisition History section of the Status page tracks the steps taken to acquire a unit. As each stage of the acquisition is completed, success is indicated by a green check mark along with a message indicating status. If you want more information about each stage, you can expand it by clicking on the right arrow. More messages and status are displayed.
Analytics REPORTS Administration
Overview5

If an error occurs, or if a process seems to be taking too long, you can use the information from the expanded options to determine where to begin your troubleshooting. When the acquisition completes successfully, green check marks are shown for every stage.
Firmware DetailsThe Firmware Details section of the Status page appears if you selected GlobalView in the Device Manager. It shows the number of available firewalls. After you click on the specific appliance, however, the Firmware Details section is no longer shown.
FirewallThe Firewall section of the Status page shows the data for the selected firewall.
A green up arrow indicates that ipfix packets are being received from the firewall. If the acquisition has not completed successfully, the status shows a red down arrow, indicating that the firewall is not online or that there is some kind of error. You can use the messages from the page to help diagnose what the issue might be.
Analytics REPORTS Administration
Overview6

Flow Reporting License StatusThe Flow Reporting License Status section of the Status shows when the GlobalView is selected. It shows the appliance name, for example: SM 9400, and indicates that it is licensed.
SystemThe System section of the Status page shows the system and interface data for the selected firewall. The following shows a sample:
The symbols indicate the status of the interfaces. In the example, X0, X1, and X2 are available, but U0 is unassigned. This section also shows the status of virtual interfaces, when present. A red symbol means the interface is down.
Flow ManagementThe Flow Management section shows statistics about the flow agent you set up on the device.
NOTE: The System section of the Status page is displayed when Analytics is used with a SonicWall firewall management system and only when a unit is successfully acquired.
NOTE: If the VPN Tunnel is down, the Status field appears and provides a message describing what the issue might be. You can use this information to begin your troubleshooting.
Analytics REPORTS Administration
Overview7
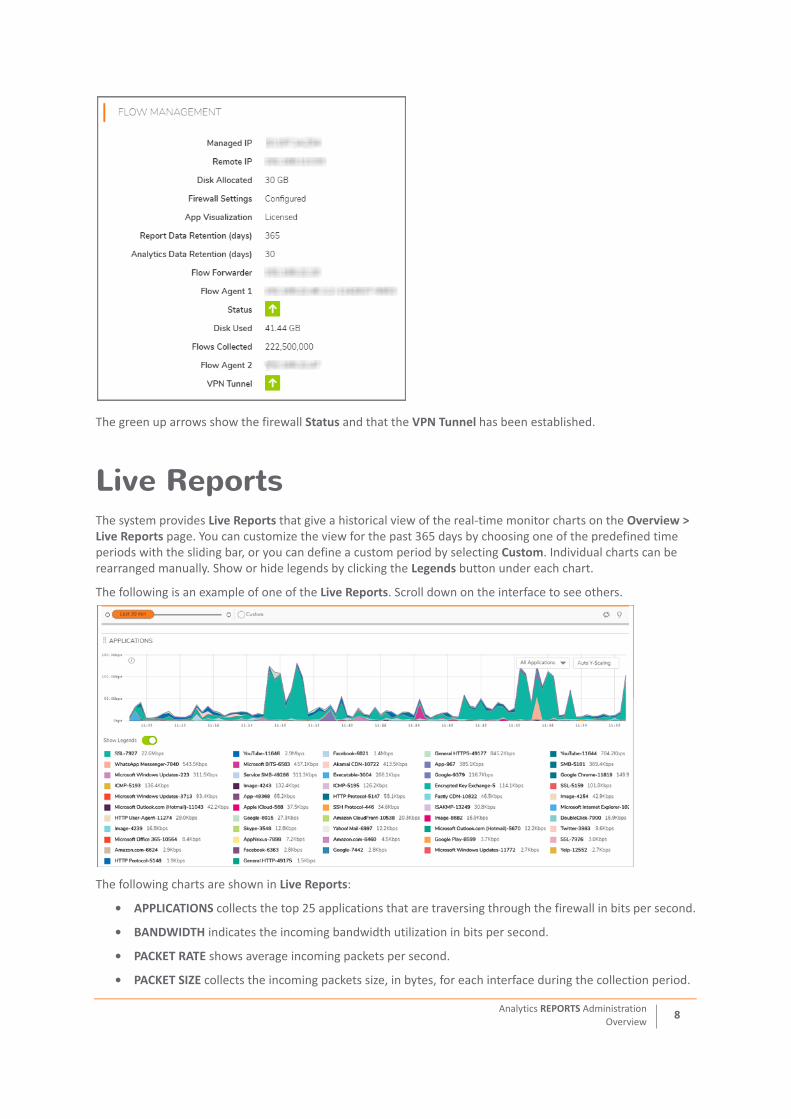
The green up arrows show the firewall Status and that the VPN Tunnel has been established.
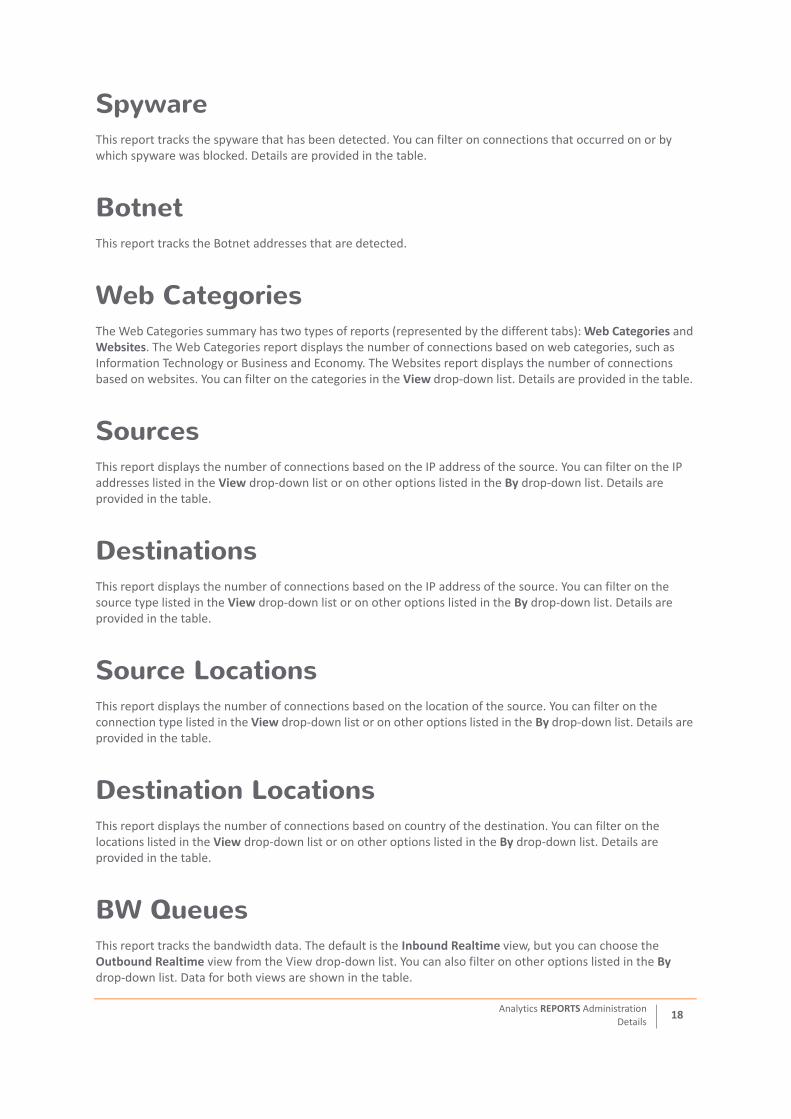
Live ReportsThe system provides Live Reports that give a historical view of the real-time monitor charts on the Overview > Live Reports page. You can customize the view for the past 365 days by choosing one of the predefined time periods with the sliding bar, or you can define a custom period by selecting Custom. Individual charts can be rearranged manually. Show or hide legends by clicking the Legends button under each chart.
The following is an example of one of the Live Reports. Scroll down on the interface to see others.
The following charts are shown in Live Reports:
• APPLICATIONS collects the top 25 applications that are traversing through the firewall in bits per second.
• BANDWIDTH indicates the incoming bandwidth utilization in bits per second.
• PACKET RATE shows average incoming packets per second.
• PACKET SIZE collects the incoming packets size, in bytes, for each interface during the collection period.
Analytics REPORTS Administration
Overview8

• CONNECTION RATE is plotted by collecting outgoing + incoming connection rate for each interface.
• CONNECTION COUNT shows the current number of active connections during each refresh period.
• MULTI-CORE MONITOR shows the CPU utilization for each core during each refresh period.
All the charts, except Connection Count, can be filtered to show a subset of the data. Click on the drop-down list in the chart and select the option you want. The chart clears and begins collecting data based on the new parameters.
To get details about the data being shown, mouse over the data in the graphs to see the value at that instant. Details are shown in the popup window similar to the one shown here:
The popup also shows icons to the left and at the top of the data to drill down to get more information. The icons at the top allow you to drill down on all the data displayed. The icons at the left allow you to drill down on each item individually. The icons take you to the following reports:
• Analytics (ANALYTICS | All Traffic > Groups)
• Graphs (ANALYTICS | All Traffic > Graphs)
• Report view (REPORTS | Details > report_type, where report_type is the specific report found in the Details section)
• Sessions (ANALYTICS | All Traffic > Session logs)
DevicesWhen you select GroupView or GlobalView in the Device Manager, the Live Monitor option is not shown. Depending upon your implementation you have the option to view Devices or Device List instead.
DevicesThe Devices option provides two views that you switch between by using the tabs at the top of the table: Devices and Device Groups. The Devices tab is the default view and shows information about the firewalls associated with your solution. You can also search for a specific device to display, refresh the display or customize the table by using the search field and icons above the table.
NOTE: When looking at the combined connection rate of more than one interface at the same time, it may appear double the actual connection rate since a single connection between a pair of interfaces are counted for both interfaces.
Analytics REPORTS Administration
Overview9

The Device Groups tab shows the device groups that you defined for your implementation.
Device ListIn the Device List for the group or global view you selected shows the firewalls or virtual units that make up that view in the table on the default view, which is the Devices tab. A summary showing the status of the devices in the group is shown at the top of the table. You can also search for a specific device to display, refresh the display or customize the table by using the search field and icons above the table.
By selecting the Map Locations tab, you can see how the devices are distributed over a world map.
Analytics REPORTS Administration
Overview10

Related DocumentsThe following documents provide additional information about Analytics or related firewall management applications:
• Analytics HOME Administration
• ANALYTICS Administration
• Analytics NOTIFICATIONS Administration
• Analytics CONSOLE Administration Guide
Analytics REPORTS Administration
Overview11

2
Details
The REPORTS > Details command offers a number of different reports to view depending on which applications you are licensed for. These reports show various types of data being tracked for your security infrastructure. Think of these as executive detail reports that you can start with to check the general health for the topics listed. If an issue is reported, you can drill down from these detail reports.
Topics:
• Detailed Reports Navigation
• Reports
Detailed Reports NavigationYou can customize and manage the data displayed in the Details reports.
Topics:
• Customizing Details Reports
• Traffic Snapshots
• Filtering the Data
Customizing Details ReportsAt the top of the Details reports—no matter what topic you pick, you can customize and manage the reports displayed.
Option Description
Sliding bar Slide left or right to select a predefined period for the reports to cover.
Custom option Define a custom period for the reports to cover. Select starting and ending dates and times for the custom period.
View Click on the down arrow next to View to Find a report, Show Default, Total count, General HTTPS, and General DNS.
Analytics REPORTS Administration
Details12

By: Connections Click on the down arrow next to Connections to sort data grid and charts by the selected options. The drop-down available list dynamically changes with the Reports Details page:
• Connections• Threats Blocked• Total Bytes• Total Blocked• Virus• Intrusions• Spyware• Botnet Blocked• AcR Blocked• Geo-IP Blocked• CFS Blocked• Data Sent• Data Received• App Rule blocked
Limit Click on the down arrow next to Limit to choose between 10, 25, 50, 100, 250, 500, 1000, 5000, and 8000 (Max) connections.
These icons allow you to customize the view of the charts and grids. From left to right, the icons represent:
• Enable Chart & Grid Multi-View• Enable Grid Only View• Enable Data Grid• Enable Time Line Grid
Export/Downloads Options icon
Provides two options:
• Generate Flow Report PDFGenerates a PDF document of the flow reports being displayed. The file is stored at REPORTS | Scheduled Reports > Archive to download the report. The report may take several minutes to generate.
• Download Capture Threat Assessment
You must first download the Visualization database for offline report generation of your network traffic. The report is downloaded to your file system.
Refresh icon Click on the Refresh icon at any time to refresh the data in the reports.
Show/Hide Grid Columns Select this icon to customize the columns that appear in the data table. You can show all columns, select the predefined (default) view, or chose to enable/disable individual columns.
Option Description
Analytics REPORTS Administration
Details13

More icons appear when you hide DEVICE MANAGER. Click on the orange icon displayed in the images below to hide Device Manager. Refer to the images for the page default layout and alternate layout.
Traffic SnapshotsAt the top right of your charts, the traffic snapshot bar graphs are displayed. Three snapshots are provided:
• Traffic snapshot of Total data transferred
• Traffic snapshot of Total connections blocked
• Traffic snapshot of Connections blocked by Threats
More/Options icon
When Device Manager is hidden the set of icons below are displayed.
Click on the More vertical ellipsis icon to get more information about:
• Page Tips• Go to Schedules• Go to Archives• Generate Flow Report PDF• Download Capture Threat Assessment• Export Grid Data as CSV• Enable Sort from SideChart• Exponential View (checked off by default)• Live Data (checked off by default)
The list of options is expanded when Device Manager is visible. However, when Device Manager is hidden you do not see:
• Enable Sort From SideChart• Exponential View• Live Data
Chart configuration icon Allows further customization of the charts. You can select rows to control and configure policy.
Zooming Zoom in on a segment of the graph by drawing a rectangle around the part you want to enlarge. This sets a Custom interval filter. To revert to the prior view, you have to reset to the prior time interval using the sliding bar or the Custom option.
Option Description
Analytics REPORTS Administration
Details14

Filtering the DataOn each of the report panels, you customize the view, filter the data on predefined types, and set the number items shown in the display.
Use the View drop-down list to set what data is shown in the detailed reports. For example, in the Application report, you can select five applications to display or you can select the predefined default view. The View list also has a search field so you more easily find a specific feature for that report.
Use the By drop-down list to further refine the kind of data shown in the detailed reports. For example, you can sort Intrusions by Connections and Blocked. Other reports have different options that are applicable to them.
Use the Limit drop-down list to set the number of records displayed. Several options are provided. Note that 8000 is the maximum number allowed.
ReportsFourteen different Details reports are predefined for you. Navigate to REPORTS > Details and then select the report option under Details. For all reports, a graphical representation of the data is shown along with a table showing the details. You can click on the Drill-Down icon for more specific information. Some data values are also links that lead to detailed reports on the ANALYTICS view. Additional navigation tips can be found when you click on the Options icon and select Page Tips.
For CSC-MA, the Applications, Intrusions, and Web Categories reports allow you to switch tabs at the top for more information:
• The Applications report lets you choose between the Applications, App Categories, and App Risk tabs.
• The Intrusions report lets you choose between the Intrusions and Priority tabs.
• The Web Categories report lets you choose between Web Categories and Websites tab.
NOTE: Not all reports list all three filters.
Analytics REPORTS Administration
Details15

Topics:
• Applications
• Users
• Viruses
• Intrusions
• Spyware
• Botnet
• Web Categories
• Sources
• Destinations
• Source Locations
• Destination Locations
• BW Queues
• Blocked
• Threats
• Group Level Reports
ApplicationsOn the CSC-MA system, the Applications details have three type of reports (represented by the different tabs): Applications, App Categories, and App Risk.
These reports provide information about the data traversing the firewall. Click on REPORTS > Details > Applications to see the application reports.
Analytics REPORTS Administration
Details16

UsersThis report provides data at it relates to the users connected to the system. You can track user level transactions and activities by filtering on several different options.
VirusesThis report tracks the viruses that have been detected. You can filter on connections they occurred on or by which viruses were blocked. Details are provided in the table.
IntrusionsThe Intrusions summary has two types of reports (represented by the different tabs): Intrusions and Priority. The Intrusions report tracks the disturbances that have been detected. You can filter on connections that occurred on or by which intrusions were blocked. Details are provided in the table.
Priority The Priority tab shows the top priority intrusions by connections and by blocked. Select the Priority tab.
Analytics REPORTS Administration
Details17
SpywareThis report tracks the spyware that has been detected. You can filter on connections that occurred on or by which spyware was blocked. Details are provided in the table.
BotnetThis report tracks the Botnet addresses that are detected.
Web CategoriesThe Web Categories summary has two types of reports (represented by the different tabs): Web Categories and Websites. The Web Categories report displays the number of connections based on web categories, such as Information Technology or Business and Economy. The Websites report displays the number of connections based on websites. You can filter on the categories in the View drop-down list. Details are provided in the table.
SourcesThis report displays the number of connections based on the IP address of the source. You can filter on the IP addresses listed in the View drop-down list or on other options listed in the By drop-down list. Details are provided in the table.
DestinationsThis report displays the number of connections based on the IP address of the source. You can filter on the source type listed in the View drop-down list or on other options listed in the By drop-down list. Details are provided in the table.
Source LocationsThis report displays the number of connections based on the location of the source. You can filter on the connection type listed in the View drop-down list or on other options listed in the By drop-down list. Details are provided in the table.
Destination LocationsThis report displays the number of connections based on country of the destination. You can filter on the locations listed in the View drop-down list or on other options listed in the By drop-down list. Details are provided in the table.
BW QueuesThis report tracks the bandwidth data. The default is the Inbound Realtime view, but you can choose the Outbound Realtime view from the View drop-down list. You can also filter on other options listed in the By drop-down list. Data for both views are shown in the table.
Analytics REPORTS Administration
Details18

BlockedThis report tracks the number of blocked connections. The default view is Total, but you can select Threats or Botnet from the View drop-down list. Data for both options are shown in the table.
ThreatsThis report tracks the number of connections with threats. The default view is Total, but you can select Intrusions or Virus from the View drop-down list. You can also filter on other options listed in the By drop-down list. Details are shown in the table.
Customizing and navigating the reports is summarized in Detailed Reports Navigation.
Group Level ReportsGroup reports are the same for all solutions. CSC-MA retains reporting data by default for 365 days. However, you choose a time period for more than a year by clicking on the Custom button.
Group level Details support all the reports available in the unit level Details. The reports, however, do not support custom time ranges and are restricted to pre-defined time ranges. They are:
• Last 15 minutes
• Last 1 hour
• Last 1 day
• Last 1 month
The difference between a unit-level and a group-level Details report are the following:
• Unit-level reports support customizations in time range, whereas the group-level reports support only pre-defined time ranges.
• Unit-level reports support customization in reports for columns displayed, views (grid/chart) and filters. Whereas customization is not yet supported for group-level reports.
• Unit-level reports support the exporting of reports in PDF format. Whereas the exporting of reports in PDF format is not yet supported for group-level reports.
You can schedule reports to be generated, emailed and archived from Details.
Viewing Global and Unit Level Reports To view the reports for your firewall appliances, do the following:
1 Log in to your SonicWall firewall management system.
2 Select the global view or the unit view (appliance) from the Device Manager tree.
3 Select the report you want in the command menu.
NOTE: All reports show a one-day period unless another interval is specified in the time bar.
Analytics REPORTS Administration
Details19

3
Scheduled Reports
The Scheduled Reports section of the REPORTS view provides the tools to manage scheduled reports and view the reports once generated.
Topics:
• Schedules
• Archive
• Personalizing Scheduled PDF Reports
• Capture Client Integration with CSC-MA
SchedulesGo to Scheduled Reports > Schedules to set up or change the reports you want generated on a regular basis.
Analytics REPORTS Administration
Scheduled Reports20

Topics:
• Managing the Reports
• Navigating the Schedules Page
• Setting Up the Reports
• Setting Up Group-Level Reports
• Checking the Reports
• Setting the Report Date Range
Managing the ReportsSeveral icons at the top right corner of the Scheduled Reports > Schedules table help you manage your reports. Some restrictions and limits are enforced, and a few additional steps are involved while creating a group-level Scheduled Report. Refer to the image and table below to learn more about them.
Navigating the Schedules PageGo to Scheduled Reports > Schedules to view a list of all the scheduled reports that have been defined. The details of each report are shown in the table.
NOTE: A maximum of 10 schedules are allowed to be created for a single group.
Scheduled Reports icons
Icon Description
Allows you to refresh the data.
Allows you to archive your report when you click on the icon.
Allows you to archive your report for the specific date range you define.
Allows you to delete scheduled reports.
Allows you to create a scheduled report.
Analytics REPORTS Administration
Scheduled Reports21

Click the search icon at the top left of the table to search for a specific report. As you type characters in the field, the table filters accordingly. To clear the filter, delete the characters.
• Click SCHEDULE NAME to see details about the report schedule.
• Click ID to see the number associated with a report.
• Click SCHEDULE TYPE to sort the schedules.
• The icons in the ARCHIVE/EMAIL column indicate whether the report is set up for archiving or emailing, or both. This parameter can be changed by clicking the Edit icon.
• Click EMAIL SUBJECT to sort by email subject.
• Click OWNER to sort by owner.
• Click LAST RUN TIME to sort by the time the schedule was last executed.
• Click STATUS to see whether the report was successfully run or not.
• Click ACTIONS to Edit or Delete a report.
Setting Up the ReportsYou can set up a Flows report or CTA (Capture Threat Assessment) report.
To set up a scheduled report:
1 At the top right of the Scheduled Reports table, click the icon to Create a Schedule Report.
2 Type the Report Name.
3 Select the Report Interval. You can choose Daily, Weekly, and Monthly. The default time interval is Daily.
4 Select the Report Type: Flows or CTA.
5 Check Archive if you want the report stored locally.
6 Check Email if you want the report emailed directly to someone and provide the email address in the field that appears.
7 Enable Zip Report if you want to zip the file before mailing it.
NOTE: You can select both the Email and the Archive options.
Analytics REPORTS Administration
Scheduled Reports22

8 Enable Password Protect if you want added security for the report. Enter and confirm the password when asked.
9 Click Next.
10 From the Report List, select the type of information you want included in your report.
Once you check the boxes you want, your choice appears under SELECTED REPORTS.
11 Click Next.
12 Select or upload a logo for your report, if desired.
13 Add a title for the cover of the report.
14 Click Next.
15 Update Permission Settings, if needed, and click Next.
Analytics REPORTS Administration
Scheduled Reports23

16 Review report settings and click Create.
17 Click Close.
Setting Up Group-Level Reports
To set up a group-level report:
1 At the top right of the Schedules table, click on the icon to Create a Schedule Report.
2 Check the box next to the unit or units you want the report for.
Analytics REPORTS Administration
Scheduled Reports24

3 Click Next.
4 Type the Report Name under TASK INFO.
5 Select the Report Interval. You can choose Daily, Weekly, and Monthly. The default time interval is Daily.
6 Check Email if you want the report emailed directly to someone and provide the email address in the field that appears.
7 Check Archive if you want the report stored locally in the archive for viewing later.
8 Click Next.
9 Click the side icon under REPORT LIST - GROUP to Select All or just one or more of the reports.
10 Check the box next to the information you want.
NOTE: You can select both the Email and Archive options.
Analytics REPORTS Administration
Scheduled Reports25

11 Click Next.
12 Click Create.
Checking the ReportsAfter you have created your reports, you can check on them by clicking the check boxes next to them. You can also check if your configurations have been saved and are scheduled as you have planned.
1 Navigate to CONSOLE | Scheduled Reports | SCHEDULE NAME column.
2 Check the box next to the name of your report.
3 Click the Archive Now icon at the top right of the table.
Analytics REPORTS Administration
Scheduled Reports26

4 Click Submit.
5 Click Close.
Setting the Report Date Range1 Check the box next to your report SCHEDULE NAME.
2 Then, click the Archive for date range icon at the top right of the table to select your date range.
3 Click in the Start Date and End Date fields to select your preferred dates.
4 Click Submit.
5 Click Close.
Analytics REPORTS Administration
Scheduled Reports27

ArchiveGo to Scheduled Reports > Archive report to view a list of all the scheduled reports that have been run and have the Archive parameter set. The details of each report are shown in the table. To view the report, click the Download icon above ACTIONS. To delete a report, click the Delete icon.
Use the Search icon at the top of the table to search for a specific report. As you type characters in the field, the table filters accordingly. To clear the filter, delete the characters.
• Check the box to select the report you want.
• Click SCHEDULE NAME to see details about the report schedule.
• Click FORMAT to see the way your report is formatted, whether PDF or some other option.
• Click SOURCE to see the packet data type.
• Click TRIGGER to see the choices that cause your report to be stored. The choices are Archive Now, Immediate(UI), and Scheduled.
• Click GENERATION TIME to see the time stamp of when your report is created.
• Click START TIME to see the time when your report began.
• Click END TIME to see the time when your report finished.
• Click ACTIONS to Download or Delete a report.
Personalizing Scheduled PDF ReportsImprovements in scheduled flow reports allow users to personalize scheduled reports. Users can add or modify
logos, headers, footers, and cover titles in scheduled flow reports.
To personalize schedule PDF report:
1 Navigate to REPORTS | Scheduled Reports.
2 Click Schedules.
NOTE: This feature is not available on Analytics licensed with GMS 9.2.
Analytics REPORTS Administration
Scheduled Reports28

3 Click the Create a Schedule Report icon.
4 Enter a name for the report and select Report Interval and Report Type.
5 Select Email or Archive based on where you want to receive the report.
6 Click Next.
7 Select the reports that you want to customize and then click Next.
8 Under COVER PAGE SETTINGS, click Upload a logo and then click Choose File.
9 Browse the logo file from your computer and click Open.
Analytics REPORTS Administration
Scheduled Reports29

10 Enter a title for the cover.
11 Click Next.
12 Click Create.
13 If you have selected the reports to be archived, you can find the reports under Archives.
To access a custom report:
1 Navigate to REPORTS > Scheduled Reports.
2 Click Archive.
3 Click the Download icon next to a report.
4 You can also select multiple reports and download.
5 The report gets downloaded to the local machine.
Analytics REPORTS Administration
Scheduled Reports30

6 The report PDF has the custom logo on top of all the pages.
Capture Client Integration with CSC-MACSC-MA and On-Premises Analytics allows integration of Capture Client. This helps identify endpoints protected
by firewalls, identify off-network devices that are protected by Capture Client, and investigate on-network or
off-network endpoint threats.
To monitor Capture Client data:
1 Navigate to REPORTS.
2 In the left pane, under Details, click Sources.
NOTE: This feature is not available with Analytics licensed with GMS 9.2
Analytics REPORTS Administration
Scheduled Reports31

3 In the table, under CONNECTIONS, click the Capture Client icon.
4 This will show Managed Endpoint Details window.
5 You can monitor basic Capture Client data from this window.
6 Click View More to get redirected to Capture Client login screen.
Analytics REPORTS Administration
Scheduled Reports32

4
SonicWall Support
Technical support is available to customers who have purchased SonicWall products with a valid maintenance contract and to customers who have trial versions.
The Support Portal provides self-help tools you can use to solve problems quickly and independently, 24 hours a day, 365 days a year. To access the Support Portal, go to https://www.sonicwall.com/support.
The Support Portal enables you to:
• View knowledge base articles and technical documentation
• View video tutorials
• Access MySonicWall
• Learn about SonicWall professional services
• Review SonicWall Support services and warranty information
• Register for training and certification
• Request technical support or customer service
To contact SonicWall Support, visit https://www.sonicwall.com/support/contact-support.
Analytics REPORTS Administration
SonicWall Support33

About This Document
SonicWall®Firewall Management REPORTS / GMS 9.2, CSC-MA 1.7 AdministrationUpdated - February 2020232-005148-00 Rev B
Copyright © 2020 SonicWall Inc. All rights reserved.
SonicWall is a trademark or registered trademark of SonicWall Inc. and/or its affiliates in the U.S.A. and/or other countries. All other trademarks and registered trademarks are property of their respective owners
The information in this document is provided in connection with SonicWall Inc. and/or its affiliates’ products. No license, express or implied, by estoppel or otherwise, to any intellectual property right is granted by this document or in connection with the sale of SonicWall products. EXCEPT AS SET FORTH IN THE TERMS AND CONDITIONS AS SPECIFIED IN THE LICENSE AGREEMENT FOR THIS PRODUCT, SONICWALL AND/OR ITS AFFILIATES ASSUME NO LIABILITY WHATSOEVER AND DISCLAIMS ANY EXPRESS, IMPLIED OR STATUTORY WARRANTY RELATING TO ITS PRODUCTS INCLUDING, BUT NOT LIMITED TO, THE IMPLIED WARRANTY OF MERCHANTABILITY, FITNESS FOR A PARTICULAR PURPOSE, OR NON- INFRINGEMENT. IN NO EVENT SHALL SONICWALL AND/OR ITS AFFILIATES BE LIABLE FOR ANY DIRECT, INDIRECT, CONSEQUENTIAL, PUNITIVE, SPECIAL OR INCIDENTAL DAMAGES (INCLUDING, WITHOUT LIMITATION, DAMAGES FOR LOSS OF PROFITS, BUSINESS INTERRUPTION OR LOSS OF INFORMATION) ARISING OUT OF THE USE OR INABILITY TO USE THIS DOCUMENT, EVEN IF SONICWALL AND/OR ITS AFFILIATES HAVE BEEN ADVISED OF THE POSSIBILITY OF SUCH DAMAGES. SonicWall and/or its affiliates make no representations or warranties with respect to the accuracy or completeness of the contents of this document and reserves the right to make changes to specifications and product descriptions at any time without notice. SonicWall Inc. and/or its affiliates do not make any commitment to update the information contained in this document.
For more information, visit https://www.sonicwall.com/legal.
End User Product Agreement
To view the SonicWall End User Product Agreement, go to: https://www.sonicwall.com/en-us/legal/license-agreements.
Open Source Code
SonicWall is able to provide a machine-readable copy of open source code with restrictive licenses such as GPL, LGPL, AGPL when applicable per license requirements. To obtain a complete machine-readable copy, send your written requests, along with certified check or money order in the amount of USD 25.00 payable to “SonicWall Inc.”, to:
General Public License Source Code Request SonicWall Inc. Attn: Jennifer Anderson1033 McCarthy BlvdMilpitas, CA 95035
Legend
WARNING: A WARNING icon indicates a potential for property damage, personal injury, or death.
CAUTION: A CAUTION icon indicates potential damage to hardware or loss of data if instructions are not followed.
IMPORTANT, NOTE, TIP, MOBILE, or VIDEO: An information icon indicates supporting information.
Analytics REPORTS Administration
SonicWall Support34