Embed Size (px)
Citation preview
Otto-Graf-Journal Vol. 10, 19999
SOME TESTS ON CREEP AND SHRINKAGE OF RECYCLEDLIGHTWEIGHT AGGREGATE CONCRETE
EINIGE KRIECH- UND SCHWINDVERSUCHE AN REZYKLIERTEMLEICHTBETON
QUELQUES ESSAIS SUR LE FLUAGE ET LE RETRAIT DU BETONLEGER RECYCLE
Hans-W. Reinhardt, Julian Kümmel
SUMMARY
Tests have been performed on four concrete mixtures made withaggregates originating from crushed lightweight aggregate concrete. The water-cement ratio and the amount of recycled aggregates were varied. Two mixturescontained natural sand while two other mixtures did not. The results show theexpected influence of water-cement ratio on strength, stiffness, shrinkage andcreep. The higher the amount of recycled aggregates, the lower are strength andstiffness and the higher are shrinkage strain and creep.
ZUSAMMENFASSUNG
An vier Betonen mit rezykliertem Leichtbeton wurden Kriech- undSchwindversuche durchgeführt. Wasserzementwert und Rezyklatmenge wurdenvariiert. Zwei Betonzusammensetzungen enthielten Natursand, zwei nicht. DieErgebnisse zeigen den erwarteten Einfluß des Wasserzementwerts aufFestigkeit, Steifigkeit, Schwinden und Kriechen. Je höher der Rezyklatanteil ist,umso niedriger sind Festigkeit und Steifigkeit und umso höher sind Schwindenund Kriechen.

H.-W. REINHARDT, J. KÜMMEL
10
RESUME
Des essais de retrait et de fluage ont été réalisés sur quatre bétonscontenant des agrégats de béton léger recyclé. Nous avons varié le rapporteau/ciment et la teneur en agrégats recyclés. Deux des quatre compositionscontenaient du sable naturel. Les résultats montrent l'influence prévue durapport eau/ciment sur la résistance, la rigidité, le retrait et le fluage. Uneaugmentation de la teneur en agrégats recyclés mène à une diminution de larésistance et de la rigidité, ainsi qu'à une augmentation du retrait et du fluage.
1. INTRODUCTION
A large cooperative research project was carried out which was aimed atthe investigation of demolition techniques of structures and the reuse of mineralmaterials and which was called life cycle of materials in concrete construction[in German: Baustoffkreislauf im Massivbau, BiM]. Within this framework, aproject dealt with recycling of lightweight aggregate concrete. The questionarose whether normal crushing techniques were able to produce a materialwhich could be reused in concrete and not a material which consisted mainly ofdust and fines. A second question concerned the deformation properties ofconcrete made out of crushed lightweight aggregate concrete. Someexperiments were carried out which are described and discussed in thefollowing.
2. MATERIALS
Since there was no chance to receive lightweight aggregate (LWA)concrete from a demolition site it was decided to produce a LWA concrete. Theprimary concrete consisted of expanded clay aggregates (Liapor G6 4/16),quartz sand 0/4, CEM I 42.5 R and a water-cement ratio of 0.56. Thecompression strength corresponded to a LC 30/33 and a density class of D1.6(prEN 206). After 6 to 12 months, the concrete was crushed in a three stepprocedure. First, a jaw breaker crushed the concrete slab into pieces with adiameter > 45 mm. Second, these pieces were fed into a rebound crusher.

Some tests on creep and shrinkage of recycled lightweight aggregate concrete
A rebound crusher produces rather cubical grains opposite to a jaw breakerwhich produces more flaky and elongated material. After sieving, the grainslarger than 16 mm were crushed again in a rebound crusher. The resultingfraction 4/16 mm is shown in Fig. 1.
Fig. 1. Crushed lightweight aggregate concrete particles of size 4/16 mm
It can be serather smooth.
The crushed4/8 and 8/16 mm.
Table 1. Properties o
Aggregatefraction
mm0/22/44/8
8/16
10
Otto-Graf-Journal Vol. 10, 199911
en that the shape is very appropriate and that the surface is
LWA concrete was available in the grain size fractions 0/4,Some properties are given in Table 1.
f crushed LWA concrete aggregate
Apparentdensitykg/m3
Bulkdensitykg/m3
Capillary water absorptionafter 10 min.% by mass
1760165016401690
980
840849
16.0
13.211.7

H.-W. REINHARDT, J. KÜMMEL
12
The density varies between 1640 and 1700 kg/m3 although there is noclear trend with respect to grain size. Original lightweight aggregate tends tolower density with increasing size which is the result of larger porosity in lagergrains. However, cement paste and natural sand particles adhere to the crushedLWA concrete grain which causes various mixtures of particles.
German practice is to account for the 30 minutes water absorption in themix design. After 30 minutes, there is only little more water absorbed.
When natural sand is used it is a quartzitic material of rounded shape witha density of 2630 kg/m3. An ordinary portland cement CEM I 32.5 R has beenused throughout the tests.
3. FRESH CONCRETE
Four mixes were designed which allowed two water-cement ratios andtwo aggregate compositions. The workability should be around 40 cm measuredon the flow table according to DIN 1048. Table 2 shows the composition of themixtures and Table 3 the properties of the fresh concrete.
Before mixing the recycled aggregates 4/8 and 8/16 were wetted byimmersion during 15 minutes. The aggregates were then removed from thewater and air dried until the surface was mat. The mixing procedure followedalways the same sequence, i.e. aggregates plus two third of the water weremixed during 60 sec., stand still during 120 sec., adding of cement and theremaining water and another 90 sec. mixing. The specimens were demouldedafter one day, then stored in a fog room for 6 days, and stored in a climatecontrolled room (20°C, 65% RH) until the 28th day. After 28 days, the creepspecimens and companion shrinkage specimens were moved to a room withpartial climate control.
Some tests on creep and shrinkage of recycled lightweight aggregate concrete
Otto-Graf-Journal Vol. 10, 199913
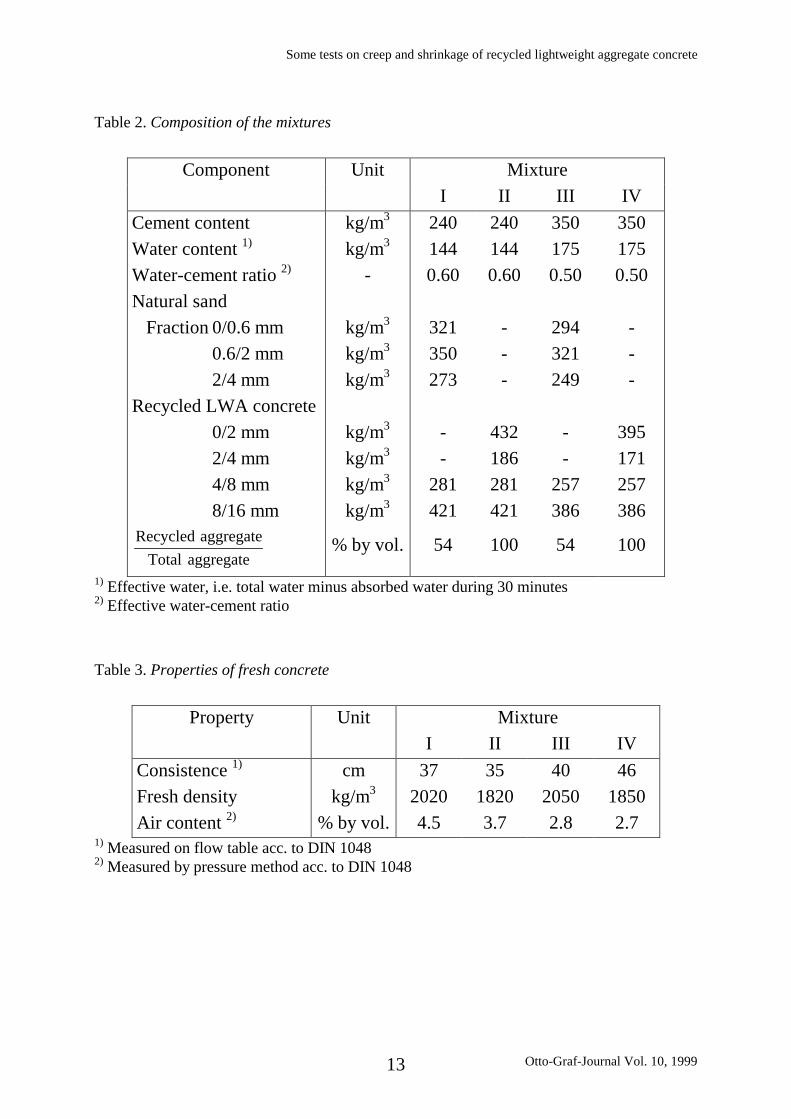
Table 2. Composition of the mixtures
Component Unit MixtureI II III IV
Cement contentWater content 1)
Water-cement ratio 2)
Natural sandFraction 0/0.6 mm
0.6/2 mm2/4 mm
Recycled LWA concrete0/2 mm2/4 mm4/8 mm8/16 mm
aggregateTotalaggregateRecycled
kg/m3
kg/m3
-
kg/m3
kg/m3
kg/m3
kg/m3
kg/m3
kg/m3
kg/m3
% by vol.
2401440.60
321350273
--
281421
54
2401440.60
---
432186281421
100
3501750.50
294321249
--
257386
54
3501750.50
---
395171257386
100
1) Effective water, i.e. total water minus absorbed water during 30 minutes2) Effective water-cement ratio
Table 3. Properties of fresh concrete
Property Unit MixtureI II III IV
Consistence 1)
Fresh densityAir content 2)
cmkg/m3
% by vol.
3720204.5
3518203.7
4020502.8
4618502.7
1) Measured on flow table acc. to DIN 10482) Measured by pressure method acc. to DIN 1048

H.-W. REINHARDT, J. KÜMMEL
14
4. HARDENED CONCRETE
One of the features of lightweight concrete is the dry density. This hasbeen determined on 28 days old specimens by drying at 105°C until constantmass. The compressive strength has been measured on 100 mm cubes. Young´smodulus has been calculated from the increase of strain due to an increase ofstress up to one third of the nominal failure load of a 100 mm wide x 300 mmlong cylinder at 28 days. Table 4 shows the results as mean of three singlevalues.
Table 4. Properties of hardened concrete
Property Unit MixtureI II III IV
Dry densityDensity class 1)
Moisture content 2)
Compressive strength 3)
Strength class 1)
Young´s modulus
kg/m3
-% by vol.
MPa-
GPa
1860D2.06.7
29.2LC 20/22
19.5
1520D1.611.915.2
LC12/139.3
1900D2.07.4
37.6LC30/33
21.6
1580D1.612.530.6
LC20/2214.6
1) According to prEN 2062) Calculated from weight loss during drying3) 100 mm cubes
5. DEFORMATION OF HARDENED CONCRETE
The deformation of a non-loaded specimen is due to shrinkage andthermal movement. A loaded specimen shows additional elastic and creepdeformation.

Some tests on creep and shrinkage of recycled lightweight aggregate concrete
Otto-Graf-Journal Vol. 10, 199915
5.1 Shrinkage
Shrinkage was measured on 100 mm x 300 mm cylinders with a gagelength of 200 mm. Three measuring lines were positioned on 120 degree whichallowed the calculation of a mean value and the determination of excentricmovement. Fig. 2 shows the measured strain as function of time starting at anage of 1 day, i.e. immediately after demoulding. The specimens were stored in afog room with nearly 100% RH during 6 days and moved to a climatecontrolled room (65% RH) for the subsequent time. It can be seen that allspecimens increased their length during the time in the fog room. Those madeout of 100% recycled aggregates increased the length by about 0.25 mm/mwhile the ones with 54% recycled aggregates increased by about 0.18 mm/m.Concrete with more cement and a lower water-cement ratio expanded less thanthe mixture with less amount and a higher water-cement ratio.
Between 15 and 20 days, all concretes started to shrink. There is asignificant difference between concrete with 100 and 54% recycled aggregatesand there is almost the same shrinkage irrespective of the cement content andwater-cement ratio.
-0,8
-0,6
-0,4
-0,2
0,0
0,2
0 40 80 120 160 200 240
Concrete age, days
Stra
in, m
m/m
C 240; R 4/16; w/c 0.6; IC 240; R 0/16; w/c 0.6; IIC 350; R 4/16; w/c 0.5; IIIC 350; R 0/16; w/c 0.5; IV
Fig. 2. Shrinkage as function of time

H.-W. REINHARDT, J. KÜMMEL
16
5.2 Creep
The cylinders were loaded to one third of the nominal strength at an ageof 28 days. The total strain was measured by three dial gauges mounted on thecylinder surface. The gauge length was 200 mm. Fig. 3 illustrates thecomponents of total strain of a specific test (Mixture II) until 65 days ofloading. The elastic part is assumed constant, i.e. the continuous hydration andincrease of stiffness is not taken into account.
Creep
Temperature
Shrinkage
Elastic
Time since loading, days
Stra
in, 1
0-3
0
1
2
0 20 40 60 80 100
Indoor, dry
Fig. 3. Components of total strain
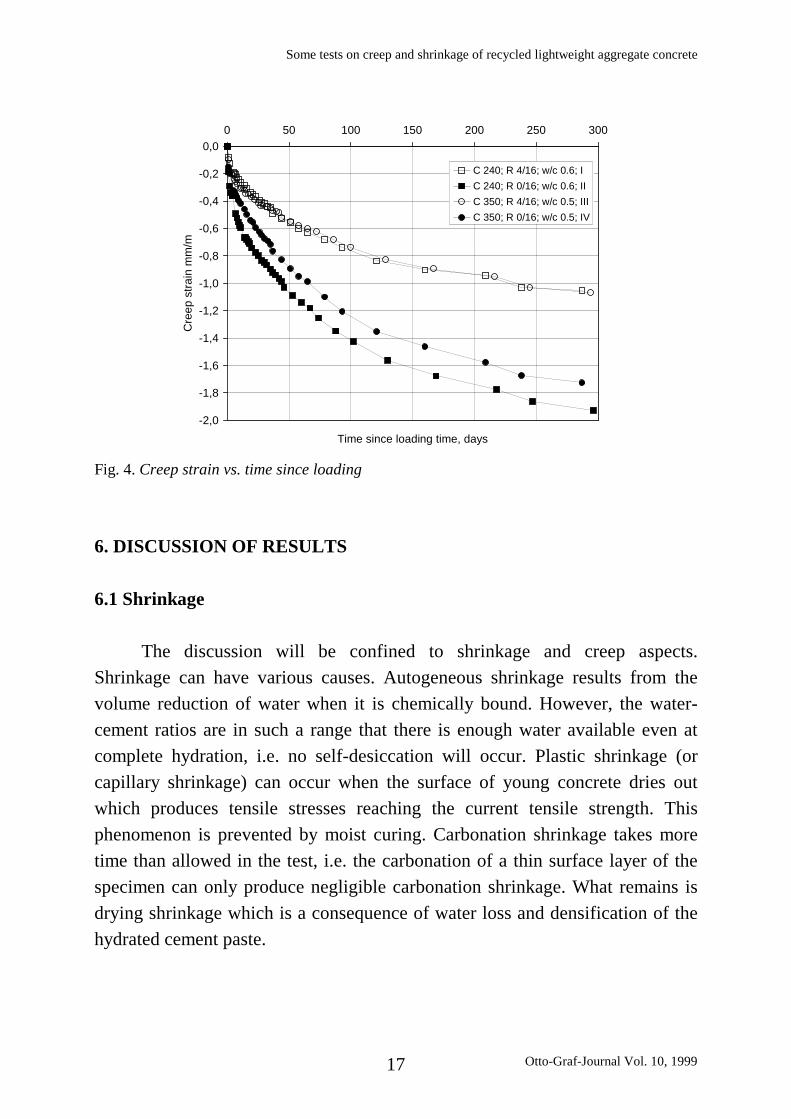
Shrinkage is measured on companion specimens in the creep room.Temperature fluctuations were measured and calculated with a coefficient ofthermal expansion equal to 9 ⋅ 10-6 K-1. Finally, the remaining strain is attributedto creep not distinguishing between basic creep and drying creep. The tests havebeen continued until almost 300 days. The results are shown in Fig. 4. It isobvious that the concretes with 100% recycled aggregates creep more than theconcretes with only 54% recycled aggregate do. A higher water-cement ratioleads to higher creep which is confirmed by the difference of creep of mixturesII and IV and I and III.
Some tests on creep and shrinkage of recycled lightweight aggregate concrete
Otto-Graf-Journal Vol. 10, 199917
-2,0
-1,8
-1,6
-1,4
-1,2
-1,0
-0,8
-0,6
-0,4
-0,2
0,00 50 100 150 200 250 300
Time since loading time, days
Cre
ep s
train
mm
/mC 240; R 4/16; w/c 0.6; IC 240; R 0/16; w/c 0.6; IIC 350; R 4/16; w/c 0.5; IIIC 350; R 0/16; w/c 0.5; IV
Fig. 4. Creep strain vs. time since loading
6. DISCUSSION OF RESULTS
6.1 Shrinkage
The discussion will be confined to shrinkage and creep aspects.Shrinkage can have various causes. Autogeneous shrinkage results from thevolume reduction of water when it is chemically bound. However, the water-cement ratios are in such a range that there is enough water available even atcomplete hydration, i.e. no self-desiccation will occur. Plastic shrinkage (orcapillary shrinkage) can occur when the surface of young concrete dries outwhich produces tensile stresses reaching the current tensile strength. Thisphenomenon is prevented by moist curing. Carbonation shrinkage takes moretime than allowed in the test, i.e. the carbonation of a thin surface layer of thespecimen can only produce negligible carbonation shrinkage. What remains isdrying shrinkage which is a consequence of water loss and densification of thehydrated cement paste.

H.-W. REINHARDT, J. KÜMMEL
18
Fig. 5 shows the mass changes as function of time. All four concretesincrease their weight during storage in the fog room by about 1% by mass. Thismeans that there is a moisture gradient from the moist air to the pore humidityof the concrete. There are two possible reasons. First, the lightweight aggregateshave absorbed water from the cement paste and the cement paste has takenwater up from the air. This should result in a small volume decrease due toshrinkage of the paste which may be compensated by the water absorption fromthe air. Second, the hardened cement paste of the recycled LWA concrete hasabsorbed water from the new cement paste or the moist air and has swollen.This second assumption seems appropriate because it has increased in mass asseen from Fig. 5 and in volume as seen from Fig. 2.
-8%
-6%
-4%
-2%
0%
2%0 40 80 120 160 200 240
Concrete age, days
Mas
s ch
ange
, % b
y m
ass
C 240; R 4/16; w/c 0.6; IC 240; R 0/16; w/c 0.6; IIC 350; R 4/16; w/c 0.5; IIIC 350; R 0/16; w/c 0.5; IV
Fig. 5. Mass change vs. time
Comparing Fig. 2 and Fig. 5 yields that the maximum expansioncoincides with the maximum mass increase which happens after 6 days. Theexposure in 65% RH causes immediate drying and the mass gain is equilibratedafter about 1 day.
Some tests on creep and shrinkage of recycled lightweight aggregate concrete
Otto-Graf-Journal Vol. 10, 199919
However, shrinkage is delayed and only, after another 10 to 14 days, thelength has reached the initial length again. This means that the componentwhich can shrink, i.e. the hydrated cement paste, is still water saturatedalthough the overall water content has decreased. It is assumed that water canbe absorbed from the lightweight aggregate while the surface of the specimen isdrying out. A flow of moisture is taking place from the aggregate to thehydrated cement paste (HCP) because the HCP has smaller pores than theLWA.
To show the relation between moisture change and strain Figs. 2 and 5are combined to one graph in Fig. 6. There are four stages to be distinguished.Stage one is situated in the upper right quadrant with increasing mass andincreasing length. When drying starts the mass decreases while the strain islagging behind. When εs = 0 is reached the mass decreases only slowly butshrinkage starts. Finally the shrinkage rate increases once again. These fourstages occur for concrete with 54% recycled aggregates and even morepronounced for concrete with 100% recycled aggregates. The four stages arequalitatively related to the four phenomena: water absorption of hydratedcement paste adhering to the crushed LWA concrete grains, evaporation ofwater and emptying of pores of LWA, shrinkage of old and new paste at highRH due to emptying of large capillary pores, and finally shrinkage of HCP atlow RH due to evaporation of physically bound water.
This typical behaviour is an obvious feature of all four concrete mixtureswhich contain crushed LWA concrete as recycled aggregate.

H.-W. REINHARDT, J. KÜMMEL
20
-0,8
-0,6
-0,4
-0,2
0,0
0,2
0,4
-8 -6 -4 -2 0 2Mass change, % by mass
Stra
in m
m/m
C 240; R 4/16; w/c 0.6; IC 240; R 0/16; w/c 0.6; IIC 350; R 4/16; w/c 0.5; IIIC 350; R 0/16; w/c 0.5; IV
Fig. 6. Strain vs. mass change during 230 days
6.2 Creep
The creep test started only at an age of 28 days, i.e. moisture movementand drying shrinkage had already taken place for a great deal. As Fig. 4 showsthere is continuous creep up to 300 days. The creep compliance function isgiven by
( ) ),()(
1, 00
0 ttCtE
ttJ += (1)
with E (t0) = Young´s modulus characterizing the instantanous deformation atage t0 and C (t, t0) = creep compliance or specific creep. Eq. (1) is synonymouswith the following
( ))(
),(1,
0
00 tE
ttttJ
ϕ+= (2)
with ϕ (t, t0) = creep coefficient which is equivalent to E (t0) ⋅ J (t, t0) - 1 or theratio between creep deformation to instantanous deformation.

Some tests on creep and shrinkage of recycled lightweight aggregate concrete
Otto-Graf-Journal Vol. 10, 199921
Total strain minus shrinkage and thermal strain is given by
σε ),()( 0ttJt = (3)
Fig. 7 shows the relation between J (t, t0) and time since loading. J (t, t0)increases more with a larger amount of recycled aggregates and with higherwater-cement ratio.
0,0
0,2
0,4
0,6
0,8
1 10 100 1000
log (t - t0), days
J (t,
t 0),
10 -3
MPa
-1
C 240; R 4/16; w/c 0.6; IC 240; R 0/16; w/c 0.6; IIC 350; R 4/16; w/c 0.5; IIIC 350; R 0/16; w/c 0.5; IV
Fig. 7. Creep compliance function vs. time since loading
While concrete with 54% recycled aggregates show a compliance whichis in the same order of magnitude like primary concrete, i.e. without recycledaggregates, concrete with 100% recycled aggregates shows considerable morecreep and elastic strain.

H.-W. REINHARDT, J. KÜMMEL
22
7. CONCLUSIONS
The main results of the limited investigations are:
- It is possible to crush lightweight aggregate concrete such that it can bereused as aggregate
- Concrete made of such recycled aggregates reaches a low to moderatestrength depending on cement content and water-cement ratio
- The secondary concrete is a lightweight concrete again- Shrinkage is depending on the amount of recycled aggregates used, it is
about 50% more for concrete with 100% recycled aggregates compared toconcrete with 54% recycled aggregates.
- Creep is also strongly affected by the amount of recycled aggregate.
The interaction of water and swelling and shrinkage is a phenomenonwhich deserves more research.
8. ACKNOWLEDGEMENT
The authors like to acknowledge the contribution by S. Pohl and B. Rehmwho prepared their diploma thesis (Diplomarbeit) within BiM. The cooperationwith Liapor Franken is greatfully acknowledged.
REFERENCES
http://www.B-i-M.de/bimonline_frame.htm (Baustoffkreislauf im Massivbau)

Otto-Graf-Journal Vol. 10, 199923
CORROSION OF STAINLESS STEEL REINFORCEMENT INCRACKED CONCRETE
KORROSION VON NICHTROSTENDEM BETONSTAHL INGERISSENEM BETON
LA CORROSION DE L´ACIER D’ARMATURE INOXIDABLE DANS LEBETON FISSURE
Ulf Nürnberger, Willibald Beul
SUMMARY
The corrosion risk of stainless steel is more pronounced in chloridecontaining carbonated concrete than in salt enriched alkaline concrete.Therefore doubts had been existed that stainless steel is sufficiently sure incracked concrete of parking decks and walls by the road side contaminated withde-icing salts. Cracks can carbonate quickly and are open for chloridepenetration. Electrochemical corrosion potential measurements and corrosiontests on cracked beams, reinforced with welded stainless steel bars, could notconfirm this assumption. Stainless steel reinforcement, licensed in Germany, isalso suit for the very unfavourable case of highly chloride contaminated crackedconcrete.
ZUSAMMENFASSUNG
Das Korrosionsrisiko von nichtrostendem Stahl ist in chloridhaltigemkarbonatisiertem Beton ausgeprägter als in salzangereichertem alkalischemBeton. Deshalb bestanden Zweifel darüber, daß der nichtrostende Stahl imgerissenen Beton von Parkdecks und Stützmauern entlang von Straßenausreichend sicher ist, wenn der Beton tausalzhaltig ist. Risse könnenverhältnismäßig rasch karbonatisieren und Chloride können leicht eindringen.Elektrochemische Messungen des Korrosionspotentials und Korrosions-untersuchungen an gerissenen Stahlbetonbalken, die mit nichtrostenden Stählenbewehrt waren, konnten die genannte Vermutung jedoch nicht bestätigen.

U. NÜRNBERGER, W. BEUL
24
Die in Deutschland zugelassenen nichtrostenden Betonstähle sind auchfür den sehr ungünstigen Korrosionsfall des mit Chloriden verseuchtengerissenen Betons geeignet.
RESUME
Le risque de corrosion de l’acier inoxidable dans le béton carbonatisé quicontiens des chlorides est plus grave que dans le béton alcalin enrichi du sel.Pour cette raison on avait des doutes, si l’acier inoxidable dans le béton fissurédes garages en élévationet des murs de soutènement á coté des routes seraitassez sûre, lorsque le béton contiens du sel antigel. Les fissures peuventcarbonatiser relativement vite et les chlorides peuvent pénétrer facilement. Desrecherches électro-chimiques sur le potentiel de corrosion et sur la corrosiondans des poutres en béton armé avec de l’acier inoxidable ne pouvaient pasverifier cette hypothese. Les aciers d’armature inoxidables qui sont acceptés enAllemagne sont utiles aussi pour le cas très défavorable d’un béton fissuré etcontaminé de chlorides.
KEYWORDS: corrosion, concrete crack, reinforcement, stainless steel,chloride, carbonation
1. INTRODUCTION
In reinforced concrete structures the concrete guarantees chemical andphysical corrosion protection of the unalloyed reinforcement. Thus, the alkalineelectrolyte of the pores passivates the steel and the concrete - as a more or lessdense (fine porous) material - keeps corrosion-promoting substances away fromthe reinforcement. That is, if a sufficient depth of concrete cover is provided. Ingeneral, steel in concrete is adequately protected against corrosion.
However, despite these protective mechanisms, corrosion ofreinforcement can occur. This can result either from the carbonation of theconcrete or from the effect of chloride ions if oxygen and moisture are alsoavailable. Chloride ions may penetrate into hardened concrete of structuresexposed to marine environments or to de-icing salts.

Corrosion of stainless steel reinforcement in cracked concrete
Otto-Graf-Journal Vol. 10, 199925
If corrosion problems persist additional corrosion protection methodssuch as galvanising, epoxy coatings, inhibitors or cathodic protection must beused. Nevertheless, there are limits to the application of these[Nürnberger, 1995] and more comprehensive solutions need to be developed.
Alternatively a corrosion resistant stainless steel reinforcement can beused. Nevertheless, it is not envisaged that stainless steel will replace any reallysignificant part of the massive tonnage of the present carbon steel reinforcementoutput. The use of higher quality steel, such as austenitic stainless steels, willincrease the reliability of multi-storey car park decks and outer stairs which arelikely to be contaminated with de-icing salts, concrete elements in thermalbaths, piers at the sea-coat and plants for the desalination of sea water. Stainlesssteel is also suitable for the reinforcement in lightweight pre-cast elements.
Test results [Nürnberger et al., 1995; Nürnberger et al., 1993;Nürnberger, 1996(1); Nürnberger, 1996(2)] concerning the corrosion behaviourof stainless steel in concrete have shown that the corrosion risk is morepronounced in chloride containing carbonated concrete than in salt enrichedalkaline concrete. Therefore engineers in Germany had doubts about the factthat stainless steel is sufficiently sure in cracked concrete contaminated withchlorides. Concrete cracks carbonate very quickly and they also favour chloridepenetration [Nürnberger, 1995]. As a consequence the reinforcement may beembedded in a depassivated chloride containing environment.
There exist concrete constructions such as parking decks and walls by theroad side, where cracking of the concrete and chloride contamination mayoccur. Therefore the investigations on stainless steel reinforcement in uncrackedconcrete [Nürnberger et al., 1995] had been continued to characterise thecorrosion behaviour in cracks of the concrete.
U. NÜRNBERGER, W. BEUL
26
2. CORROSION RESISTANCE OF STAINLESS STEELREINFORCEMENT
In the elder research programme [Nürnberger et al., 1995; Nürnberger etal, 1993] the corrosion behaviour of traditional stainless steel types in theunwelded and a welded state was clarified.
The research programmes comprised- electrochemical tests- and fielding testing
In the former laboratory tests for several steel types with graded alloyingelements the pitting potential with respect to- the chloride content,- the state of concrete (alkaline or carbonated),- the workmanship (unwelded and welded)was determined. The exposure tests on reinforced concrete beams concentratedon the behaviour of the material- 1.4003 a ferritic steel X 2 Cr Ni 2,- 1.4571 a austenitic steel X 6 Cr Ni Mo Ti 17-12-2- 1.4462 a ferritic-austenitic steel X Cr Ni Mo N 22-5-3.
The pitting potential characterises the risk of localised corrosion in theform of pitting. Experimentally the value of the pitting potential can bedetermined by polarising a mortar electrode in the positive direction byapplication of an external current until pitting occurs. The more positive thepitting potential the lower the corrosion risk. The pitting potential may varydepending on
- the corrosive environment,- the type and level of alloying additions of the steel,- and surface parameters such as roughness, oxyde layers, crevices and welds.

Corrosion of stainless steel reinforcement in cracked concrete
Otto-Graf-Journal Vol. 10, 199927
Fig. 1. Parameters of current density versus potential curve of stainless steel in neutral toalkaline mediums
Fig. 1 schematically shows the relationships. The pitting potentialbecomes more negative with increasing chloride concentration and temperatureand falling pH-value. The figure explains an anodic curve of steel in anelectrolyte without and with chlorides. Alloying elements such as chromiumand molybdenum increase the pitting potential, respectively the corrosionresistance. Welded steels show a worse behaviour than unwelded steels.
Fig. 2. Pitting potential of plain welded steel specimens in PC-mortar (potentiostatic test)
U. NÜRNBERGER, W. BEUL
28
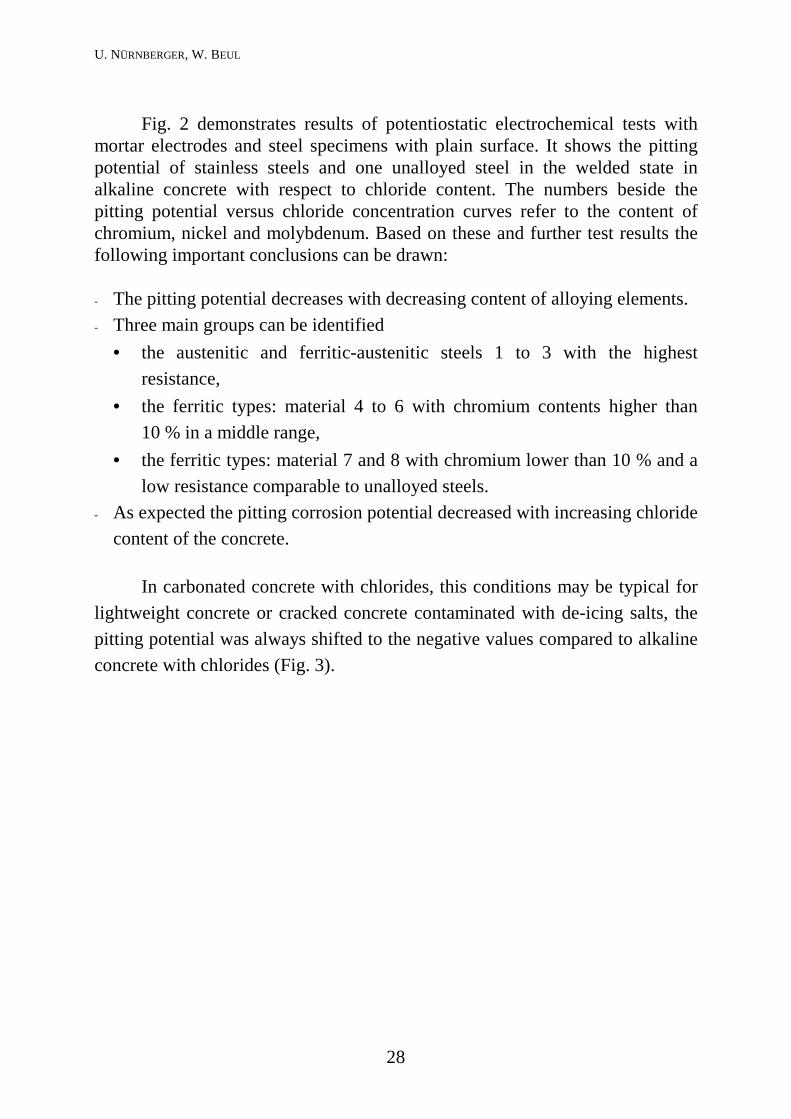
Fig. 2 demonstrates results of potentiostatic electrochemical tests withmortar electrodes and steel specimens with plain surface. It shows the pittingpotential of stainless steels and one unalloyed steel in the welded state inalkaline concrete with respect to chloride content. The numbers beside thepitting potential versus chloride concentration curves refer to the content ofchromium, nickel and molybdenum. Based on these and further test results thefollowing important conclusions can be drawn:
- The pitting potential decreases with decreasing content of alloying elements.- Three main groups can be identified
• the austenitic and ferritic-austenitic steels 1 to 3 with the highestresistance,
• the ferritic types: material 4 to 6 with chromium contents higher than10 % in a middle range,
• the ferritic types: material 7 and 8 with chromium lower than 10 % and alow resistance comparable to unalloyed steels.
- As expected the pitting corrosion potential decreased with increasing chloridecontent of the concrete.
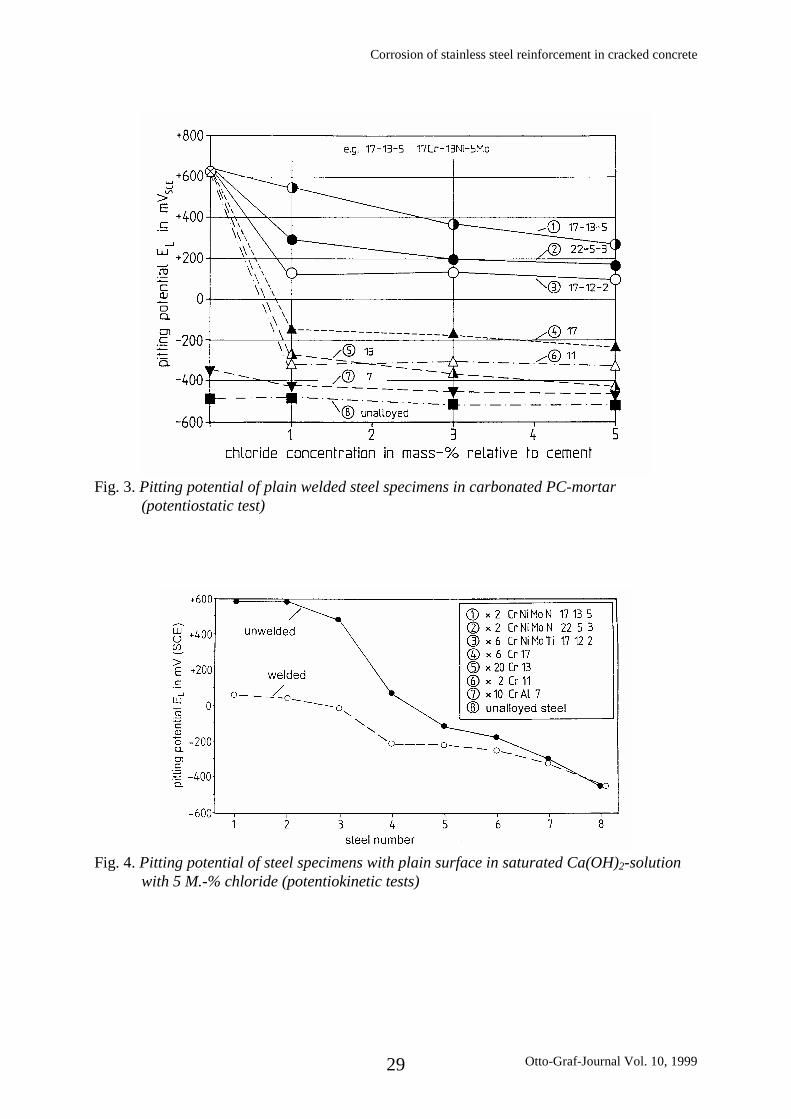
In carbonated concrete with chlorides, this conditions may be typical forlightweight concrete or cracked concrete contaminated with de-icing salts, thepitting potential was always shifted to the negative values compared to alkalineconcrete with chlorides (Fig. 3).
Corrosion of stainless steel reinforcement in cracked concrete
Otto-Graf-Journal Vol. 10, 199929
Fig. 3. Pitting potential of plain welded steel specimens in carbonated PC-mortar(potentiostatic test)
Fig. 4. Pitting potential of steel specimens with plain surface in saturated Ca(OH)2-solutionwith 5 M.-% chloride (potentiokinetic tests)

U. NÜRNBERGER, W. BEUL
30
Fig. 5: Pitting potential of deformed steel specimens in mortar (potentiostatic test)
Fig. 4 gives you a short impression of the very different behaviour ofunwelded and welded steels. The pitting potential of the welded specimensbecomes more negative, but the difference between unwelded and welded steelsdecreases with decreasing chromium and molybdenum. In the case of weldsscale and temper colours reduce passivity and can aggravate pitting if norremoved.
Fig. 5 shows the results of ribbed
- austenitic steel 1.4571 with 17 % chromium, 12 % nickel and 2 %molybdenum,
- a ferritic steel 1.4003 with 13 % chromium- and the unalloyed steel.
Corrosion of stainless steel reinforcement in cracked concrete
Otto-Graf-Journal Vol. 10, 199931
The steel specimens were unwelded (above) or welded (below) and testedin alkaline concrete (continuous curves) and carbonated concrete (interruptedcurves). In addition to those results from welded pieces with plain surface thefollowing conclusions can be drawn:• Ribbed reinforcing bars show a more unfavourable behaviour than plain bars.• Unwelded ribbed stainless steel bars (above) in concrete with chlorides show
a more positive pitting potential than welded bars (below).• For unalloyed material no difference between welded and unwelded bars was
observed.
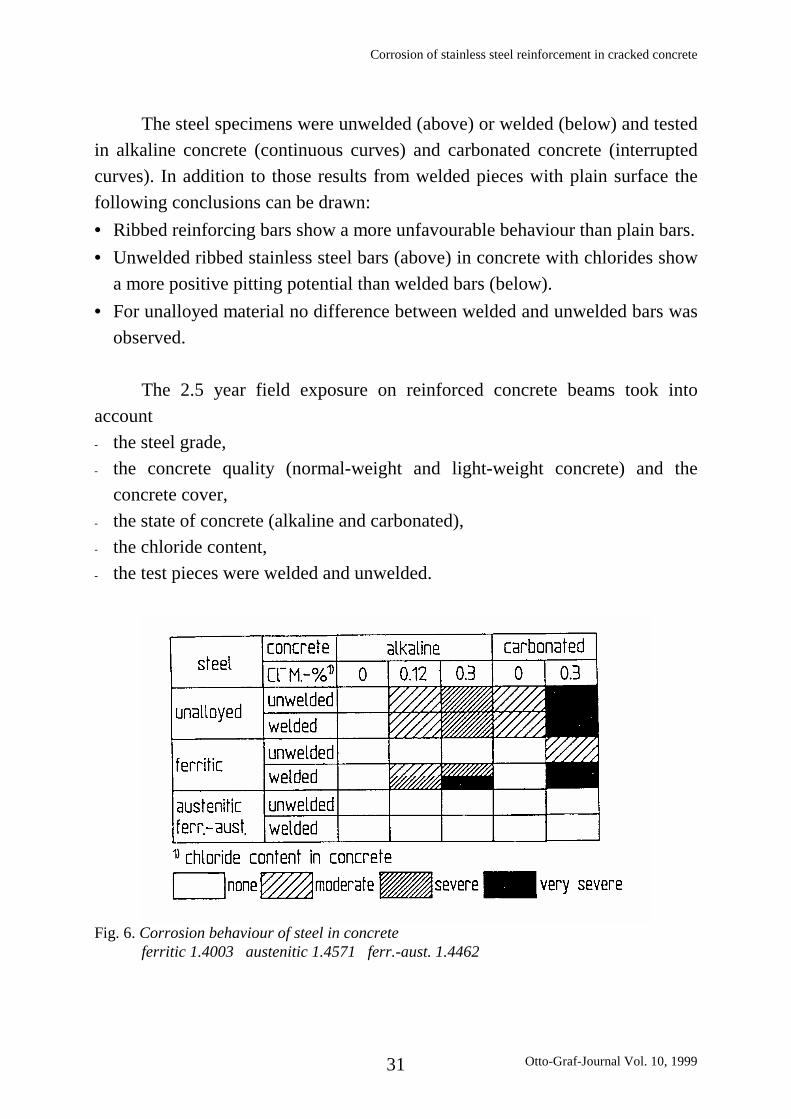
The 2.5 year field exposure on reinforced concrete beams took intoaccount- the steel grade,- the concrete quality (normal-weight and light-weight concrete) and the
concrete cover,- the state of concrete (alkaline and carbonated),- the chloride content,- the test pieces were welded and unwelded.
Fig. 6. Corrosion behaviour of steel in concreteferritic 1.4003 austenitic 1.4571 ferr.-aust. 1.4462

U. NÜRNBERGER, W. BEUL
32
Fig. 6 shows a very simple but clear representation of the test results bymeans of corrosion degrees basing on pitting depth and loss of weight. Areaswithout and with welds are separated. As expected, unalloyed steel corrodes incarbonated and/or chloride concrete. The strongest attack occurred incarbonated plus chloride-contaminated concrete. No corrosion appeared withthe austenitic and ferritic-austenitic steel in the unwelded or welded states.
The unwelded ferritic chromium steel showed a distinctly better beha-viour than unalloyed steel. Only in chloride-contaminated carbonated concrete areduced pitting corrosion occurs. For the welded steel within the weld linechlorides produced locally distinct pitting corrosion. The depth of pittingincreased with increasing chloride content and was more pronounced inchloride-containing carbonated concrete. In carbonated chloride-free concreteno corrosion occurred.
As a consequence of the performed investigations austenitic steel 1.4571and ferritic-austenitic steel 1.4462 proved to give excellent performance underconditions, where chlorides can enter concrete constructions. A ferritic grade1.4003 will suffice in less aggressive environments. It will hinder spalling ofconcrete cover and corrosion in carbonated concrete.
3. INVESTIGATIONS IN CRACKED CONCRETE
In the new research programme it should be tested, whether the problemof strong chloride corrosion of the (unalloyed) reinforcement in crackedconcrete constructions can be solved by use of stainless steel. If such areinforcement in welded condition is sufficiently safe, such a preventivemeasure should be recommended, even if the concrete may be cracked over thewhole section and contaminated with de-icing salt. Therefore cracked concretebeams reinforced with welded unalloyed and stainless bars had been storedunder conditions of parking decks and walls by the road side exposed tochloride containing water.

Corrosion of stainless steel reinforcement in cracked concrete
Otto-Graf-Journal Vol. 10, 199933
Reinforced concrete beams had been manufactured and the followingparameters had been varied:• steel quality unalloyed
ferritic-austeniticaustenitic �
welded,unwelded
Concerning the welded bar a weld seam was crossing the cracked area.• concrete normal weight concrete (B 35)• crack width 0.05 - 1.0 mm• concrete crack uncarbonated, artificial carbonated• concrete cover 2.5 and 5.0 cm• storage conditions of the reinforced beams
− outdoor conditions (Fig. 7)− indoor conditions
The reinforced construction elements were sprayed with chloridesolutions and dried out analogous to the conditions of a wall by the road sideand of parking houses.
Fig. 7. Storage of cracked concrete specimens under outdoor conditions
During storage of 2.5 years the corrosion potential of the steel wasmeasured continuously, to detect the start of corrosion inside concrete cracks.Some beams were opened to reveal the state of the bars.

U. NÜRNBERGER, W. BEUL
34
The following Fig. 8 - 10 show exemplary the test results of potentialmeasurement for the indoor storage of three welded steels:- unalloyed steel,- ferritic-austenitic steel X 2 Cr Ni Mo N 22-5-3 (1.4462),- austenitic steel X 6 Cr Ni Mo Ti 17-12-2 (1.4571)
The concrete cracks were carbonated artificially.
In the case of unalloyed steel there exists an essential drop of corrosionpotential, when the chloride reached the reinforcement in the concrete crack andthe steel became active after 1 to 3 months. There is no clear influence ofwelding and concrete cover. These results point to a strong corrosion of thewhole unalloyed reinforcement.
Concerning the corrosion resistant reinforcement the steel remainedpassive over the whole testing time. This indicates a corrosion resistance underthese very aggressive environment.
After breaking up some beams after 2.5 years strong corrosion was foundin the carbonated and not carbonated concrete cracks if the crack widthexceeded 0.1 mm in the case of unalloyed steel. The corrosion type was more orless uniform and wide pitting in the carbonated chloride containing concrete. Inthe alkaline chloride containing concrete crack the corrosion type was strongwide pitting. The corrosion degree depended of the parameters of the concrete(concrete cover) and the crack (crack width), but the influence of theseparameters was not clearly. No serious corrosion was to detect on the highalloyed steels up to a crack width of 1 mm. The alloyed steel only showed somevery small and shallow corrosion pits along the border of the welding material.That was independent of other parameters of the concrete and the cracks.

Corrosion of stainless steel reinforcement in cracked concrete
Otto-Graf-Journal Vol. 10, 199935
Fig.8-10. Corrosion potentials of chloride treated cracked reinforced concrete beams(concrete cracks: carbonated)
U. NÜRNBERGER, W. BEUL
36
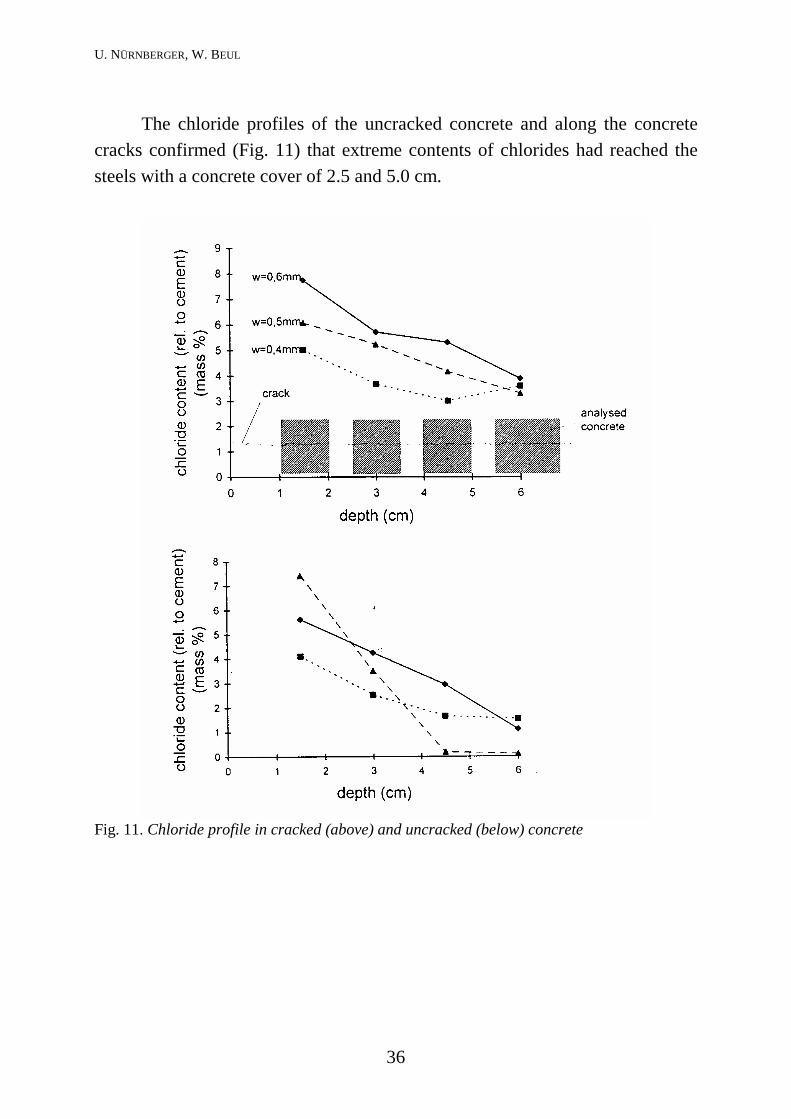
The chloride profiles of the uncracked concrete and along the concretecracks confirmed (Fig. 11) that extreme contents of chlorides had reached thesteels with a concrete cover of 2.5 and 5.0 cm.
Fig. 11. Chloride profile in cracked (above) and uncracked (below) concrete
Corrosion of stainless steel reinforcement in cracked concrete
Otto-Graf-Journal Vol. 10, 199937
REFERENCES
NÜRNBERGER, U.: Korrosion und Korrosionsschutz im Bauwesen. BauverlagWiesbaden (1995)
NÜRNBERGER, U.; BEUL, W.; ONUSEIT, G.: Korrosionsverhalten geschweißternichtrostender Bewehrungsstähle in Beton. Bauingenieur 70 (1995) 73 – 81
NÜRNBERGER, U.; BEUL, W.; ONUSEIT, G.: Corrosion behaviour of weldedstainless reinforcing steel in concrete. Otto Graf Journal 4 (1993) 225 – 259
NÜRNBERGER, U.: Corrosion behaviour of welded stainless reinforced steel inconcrete. Corrosion of reinforcement in concrete construction. The royalsociety of chemistry (1996, 1) 623 - 629
NÜRNBERGER, U.: Stainless Steel in Concrete. The Institute of Materials,Book 657, London (1996, 2)

38
DETERMINATION OF PORTLANDITE AND OTHER CEMENTCOMPOUNDS IN HARDENED CEMENT PASTE AFTER SQUEEZINGPORE SOLUTION WITH HIGH PRESSURE
BESTIMMUNG DES PORTLANDITANTEILS UND ANDERERZEMENTINHALTSSTOFFE IN ZEMENTSTEIN NACH AUSPRESSENVON PORENWASSER UNTER HOHEM DRUCK
DÉTERMINATION DE LA TENEUR EN PORTLANDITE ET AUTRESCOMPOSANTS DES CIMENTS DANS LES PÂTES DE CIMENTDURCIES PAR EXTRACTION DE L'EAU INTERSTITIELLE PARPRESSAGE SOUS HAUTE PRESSION
Mine Aktas, Christina Laskowski, Gerhard Volland
SUMMARY
The present work shows, that squeezing pore water out of hardenedcement pastes with different w/c-ratios allows to determine the quantity of poresolution. Balancing total water in hardened cement pastes with a w/c-ratio of0,50 (Σ water of crystallisation (hydration water) + squeezed interstitial water ing/kg cement paste) leads to uncertainties less than 5 %. The ion balance ofsqueezed interstitial water proves that with high probability the squeezed waterreflects the status of the interstitial water in hardened cement paste. With thecomplete squeezing of interstitial or pore solution with high pressure at roomtemperature it is possible to extract all soluble salts including Ca(OH)2 solved ininterstitial water with out disturbing the establishment of equilibrium(equilibrium concentration) of the salts in pore solution. The combination ofsqueezing and DTA allows the determination of Portlandite in hardened cementpaste with a w/c-ratio of 0,50. The x-ray diffraction spectra of squeezedhardened cement paste prove the obtained results by DTA. The influence ofCa(OH)2 in the hydrating solution in portland cement during and after theprocess of separating pore solution could be minimized.
Determination of portlandite and other cement compounds in hardened cement paste
Otto-Graf-Journal Vol. 10, 199939
ZUSAMMENFASSUNG
Die vorliegende Arbeit zeigt, daß durch Auspressen von Porenwasser mithohem Druck aus Zementstein mit unterschiedlichen Wasser/Zement-Wertendie Gesamtmenge an Porenwasser ausgepreßt werden kann. Der Fehler bei derBestimmung der Gesamtwasserbilanz (Hydratwasser plus freies Porenwasser)liegt für einen Zementstein mit einem Wasser/Zement-Wert von 0,50 unter 5 %.Die Ionenbilanzen der ausgepreßten Porenlösungen belegen, daß mit hoherWahrscheinlichkeit das so erhaltene Porenwasser die Verhältnisse imPorenwasser im Zementstein richtig widerspiegeln. Mit dem nahezuvollständigen Auspressen von Porenwasser bei hohem Druck undRaumtemperatur ist es möglich alle gelösten Salze im Porenwasser,einschließlich des Ca(OH)2 ohne Störungen des Gleichgewichtszustands derSalze im Porenwasser aus dem Zementstein zu entfernen. Die Kombination vonAuspressen und Differentialthermoanalyse erlaubt die Bestimmung desProtlanditanteils im Zementstein bei einem w/z-Wert von 0,50. DieRöntgenbeugungsspektren der Zementsteinproben bestätigen die Ergebnisse derDTA und zeigen, daß die Gehalte von Portlandit im Zementstein mit dem w/z-Wert korrelieren. Das Verfahren erlaubt es die Einflüsse von Ca(OH)2 imPorenwasser auf die Hydratation von Portlandzement bei der Bestimmung derPhasenanteile zu minimieren.
RESUME
Le travail présent montre que l'extraction par pressage sous haute pressionpermet de déterminer la quantité totale d'eau interstitielle contenue dans despâtes de ciment durcies ayant différents rapports eau/ciment. Pour une pâte deciment durcie avec un rapport eau/ciment de 0,50, l'erreur commise lors del'établissement du bilan des eaux (eau de cristallisation (eau d'hydratation) + eauinterstitielle) est inférieure à 5 %.Le bilan ionique de l'eau extraite montre qu'avec une forte probabilité, celle-cireflète correctement la composition de l'eau interstitielle contenue dans la pâtede ciment durcie. Grâce à l'extraction sous haute pression à températureambiante, il est possible d'extraire tous les sels (y compris Ca(OH)2) dissousdans l'eau interstitielle sans perturber l'équilibre (concentration d'équilibre) dessels. La combinaison du pressage et de l'analyse thermique différentielle permetde déterminer la teneur en Portlandite des pâtes de ciment durcies ayant unrapport eau/ciment de 0,50.

M. AKTAS, C. LASKOWSKI, G. VOLLAND
40
Les spectres de diffraction des rayons X des échantillons de pâte durcieconfirment les résultats obtenus par analyse thermique différentielle et montrentque la teneur en Portlandite des pâtes de ciment durcies est corrélée avec lerapport eau/ciment. Ce procédé permet de minimaliser l'influence du Ca(OH)2de l'eau interstitielle sur l'hydratation du ciment Portland pendant ladétermination des concentrations des différents composants.
1. INTRODUCTION
One of the possibilities of studying the influence of pore solution onhardening processes in cement is given by the analysis of squeezed pore solutioncombined with Differential Thermal Analysis and X-Ray Diffraction ofhardened cement paste. In the past mainly hardened cement pastes with acement/solvent-ratio (w/c) of 0,60 were used for experiments to squeeze poresolution [Schießl et al., 1997; VDZ, 1993-1993]. The present work shows someorientating results with cement pastes with w/c-ratios differing from 0,60 to0,40.
To get knowledge of the influence of pore solution to hardeningprocesses in cement paste, it is necessary to dry the hardened cement paste. Thiscan happen in three different ways
- Drying the hardened cement paste at higher temperatures- Extraction of pore solution with various organic liquids- Squeezing the pore solution with high pressure
Normally drying processes as well as extraction processes influence theaccuracy of the results [Ramachandran, 1984; Manns, 1975; Locher et al.,1976]. The difficulties to measure the residual moisture, as well as questions ofthe distribution of the soluble salts in pore solution and organic liquids in porousstructure lead to uncertainties determining the mass equivalents in hardenedcement paste. Especially the thermoanalytical determination of Portlandite[Ca(OH)2 calziumhydroxide] is influenced by Ca(OH)2 by pore solution.Relating to the drying conditions or to the water/liquid distributions differentamounts of free, physicochemial or chemical bound water from hydrated cementcompounds like Gypsum or Ettringite can be detected.
Determination of portlandite and other cement compounds in hardened cement paste
Otto-Graf-Journal Vol. 10, 199941
If it is possible to obtain the total amount of free pore solution bysqueezing with high pressure, without disturbing the hardened cement pastestructure it should be possible to detect the composition of cement paste andpore solution under reproducible conditions. Squeezing processes were normallycarried out under room temperature. Under defined conditions (sample size,pressure) it should be possible to obtain a sample of hardened cement paste withsmall reproducible amounts of free pore solution. If pressure does not influencethe mineralization or adsorption processes of water the determination of thecontents of pore solution and cement paste will lead to reproducible results. Thedetermination of the compounds in pore solution in combination with DifferentThermal Analysis and X-Ray-Diffraction of hardened cement paste should givethe opportunity to balance hydration processes.
Normally CO2 from surrounding air has an influence to the mineralizationin cement paste. The results of the present work were obtained by limiting thisinfluence by excluding the contact of the cement paste with air during thehardening period, so only internal alkali-carbonate-reactions from dolomite orcalcite contents of the cement influence the mineralization.
The possibility to examine cement paste without pore solution has theadvantage to minimise the reaction of alkali in pore solution during the samplepreparation (pulverising, drying). The squeezing procedure leads to samples ofhardened cement pastes (age 28 days), which allow to determine the mineralsformed in the cement paste by Differential Thermal Analysis (DTA) and X-Ray-Diffraction with few disturbances from remaining pore water. This method givesthe possibility to calculate hydration degrees.
2. EXPERIMENTAL PROCEDURE
Three samples of cement pastes with different c/s-ratios (0,60, 0,50 and0,40) were made with CEM I 32,5 R. After mixing the cement paste was filledin plastic bottles (250 ml) an the bottles locked air tight. To prevent demixingprocesses the bottles with the cement paste were shacked for 24 hoursthoroughly. Afterwards the samples were stored in the plastic bottles locked airtight for 28 days at 20 °C.

M. AKTAS, C. LASKOWSKI, G. VOLLAND
42
After this storage period the plastic bottles were destroyed and thehardened cement paste samples squeezed with high pressure under reproducibleconditions (500 N/mm²). The pore solution was collected without any contact toair and sensitive parameters like pH, conductivity, hydroxide and specificgravity measured immediately. The used squeezing apparatus (manufacturer:Fa. Böhler UDDEHOLM – special production) is shown in Figure 1. The otheranalysed parameters in the squeezed solution were Na+, K+, Ca2+, Cl-, SO4
2-,NO3
- and CrO42-. The determination methods are mentioned in Table 1. In the
squeezed cement pastes loss at red heat and sulphate (DIN EN 196) wereanalysed. The amount of hydration water, Portlandite and CO2 were analysed byDifferential Thermal Analysis (DTA) [Satava et al., 1975; Huppertz et al.,1999]. Additionally X-Ray-Diffractionsspectra were taken from each sample.This gave the possibility to compare the results obtained with both methods forEttringite, Portlandite and CSH (calzium-silcate-hydrate)-phases in the hardenedcement pastes.
3. RESULTS
Table 1 shows the results of the determination of different anions andcations in pore solution squeezed form hardened cement paste with differentw/c-ratios. As expected increases the amount of sodium- andpotassiumhydroxide in the pore solution with increasing ratios of cement. Thisleads to an increase of the pH-value and the conductivity in the analysedsolutions. The calculation of the ion balance (sum anions and sum cations)demonstrates, that the total amount of soluble salts in pore solution wasidentified.
Table 2 shows the results of DTA and wetchemical analysis of thesqueezed hardened cement paste and additionally the DTA results of the usedcement (CEM 32,5 I R) . According to the known mechanisms about thehydration processes (hydration steps) the parameter hydrate water/ water ofcrystallisation bound at Portlandite and CSH (calcium silicate hydrate)-phasesand gypsum, ettringite is mainly of interest.

Determination of portlandite and other cement compounds in hardened cement paste
Otto-Graf-Journal Vol. 10, 199943
Table1. Compounds of squeezed pore solution from hardened cement paste with differentw/c-ratios after storing the samples for 28 days at 20 °C air tight
Mixture nr.w/c-ratio
10.60
20.50
30.40
Method of determination
pH-value 13.81 14.00 14.11 DIN 38 404 T5Conductivity 96.9
mS/cm117.2
mS/cm164.0
mS/cmDIN EN 27888
Specificgravity g/cm3
1.074 1.073 1.082
Na+ mmol/l 27.2 31.9 38.6 DIN 1164K+ mmol/l 384.0 522.5 721.4 DIN 1164Cl- mmol/l 0.21 0.06 0.03 DIN 38 405 D1NO3
- mmol/l 0.19 0.22 0.03 DIN EN ISO 10304 T2 (D20)
SO42- mmol/l 0.22 0.68 1.19 DIN EN ISO 10304 T2 (D20)
Cr(VI) mmol/l 0.18 0.19 0.29 DIN 38 405 D 24OH- mmol/l 410 554 760 DIN 38 409 T7Ca2+ mmol/l 1.6 1.9 1.5 DIN EN ISO 11885 E 22Σ cations mval/l 413 556 762 CalculatedΣ anions mval/l 411 555 761 CalculatedΣ Ions g/l 22,73 30,71 42,18 Calculated
Table 2. DTA results for cement CEM I 32.5 and squeezed hardened cement paste withdifferent w/c-ratios after storing the samples for 28 days at 20 °C air tight
Mixture nr. Cement 1 2 3w/c-ratio 0.60 0.50 0.40Loss on red heat m.-% 2.84 23.04 26.53 25.15Hydrate water (total) M.-% 0.73 20.24 24.52 23.02Water from Portlandite M.-% 0.35 4.89 4.55 4.19CO2 M.-% 2.05 2.15 1.70 1.82SO3 M.-% 2.57 2.02 1.91 1.95Water of crystallisation
without Portlandite M.-%0.38 15.35 19.97 20.96
CaCO3 M.-% 4.70 6.13 5.13 5.37

M. AKTAS, C. LASKOWSKI, G. VOLLAND
44
Figure 1. Schematic outline of the squeezing apparatus (max. pressure 300 t) with a cementsample. Ejector pad and sample container steel 155 CrVMo
Figure 2. Detail of X-Ray-Diffraction Spectra (Ettrinigte) for squeezed hardened cement paste(age 28 days) with different w/c-ratios

Determination of portlandite and other cement compounds in hardened cement paste
Otto-Graf-Journal Vol. 10, 199945
Figure 3. Detail of X-Ray-Diffraction Spectra (CSH-phases) of squeezed hardened cementpaste (age 28 days) with different w/c-ratios
Figure 4. Detail of X-Ray-Diffraction Spectra (Protlandite) of squeezed hardened cementpaste (age 28 days) with different w/c-ratios

M. AKTAS, C. LASKOWSKI, G. VOLLAND
46
Parallel to DTA and the wetchemical analysis X-Ray-Diffraction of thesqueezed cement paste was carried out. Figures 2 to 4 show details of XRD-spectra of the hardened cement pastes with different w/s-ratios (Fig. 2 Ettringitepeak; Fig. 3 CSH (calcium silicate hydrate)-phase; Fig. 4 Portlandite). Thesefigures prove that the intensity of the XRD-signals are related to the w/c-ratiosof the cement pastes.
4. DISCUSSION
Table 3. Calculation of the components of pore solution in hardened cement paste with w/sratio of 0.50 after storing the samples for 28 days at 20 °C air tight
Mixture Nr. 2w/c-ratio 0.50Mass squeezed pore solution in g (measured) 18.588Mass cement paste after squeezing in g (measured) 309.8loss on heat of squeezed cement paste in m.-%(measured)
26.53
loss on heat of cement (CEM 32,5 I R) in m.-%(measured)
2.84
Mass cement (minus loss on heat) in cement pastein g (calculated)
227.6
Mass cement used for the admixture in the cementpaste in g (calculated)
234.3
Pore solution in g/kg cement (calculated) 79.33Specific gravity of pore solution g/ml (measured) 1.073Pore solution in ml per kg cement (calculated) 73.9Pore solution in g per kg cement (calculated) 73.5
Based on the results shown in Table 1 and 2 it is possible to calculate theamounts of water in the different physical, physicochemical or chemicalbounding forms in hardened cement pastes. One example for the method tocalculate these basic data for the hydration situation in hardened cement paste isshown in Table 3 and 4 for a cement paste with a w/c-ratio of 0,50.

Determination of portlandite and other cement compounds in hardened cement paste
Otto-Graf-Journal Vol. 10, 199947
Based on these results it is possible to balance the total water (poresolution, water of crystallisation) in hardened cement paste. Table 4 gives anexample for a hardened cement paste with a w/c-ratio of 0,50.
Table 4. Balance of the amount of pore solution and water of crystallisation in hardenedcement paste. Admixture 2 with w/c- ratio 0.50 after storing the samples for 28 daysat 20 °C air tightThe w/c-ratio of 0,50 give the theoretical value of 333 g H2O/kg cement paste
Admixture Nr. 2w/c-value 0.50Σ water of crystallisation (hydration water) per 1 kg cement pastein g/kg (DTA-results; see Table 2)
245
Squeezed pore solution in the hardened cement paste in g/kgcement paste (calculated, see Table 3)
74
Σ water of crystallisation (hydration water) + squeezed poresolution in g/kg cement paste
319
Difference from theoretical value (333g H2O/kg cement paste)in g (in %)
14 (1.4 %)
The present results demonstrate, that squeezing is a very good possibilityto balance the water distribution in hardened cement pastes. The determinationof hydration water (Σ water of crystallisation (hydration water) + squeezed poresolution in g/kg cement paste) has an uncertainty of less than 2 %. Thisdemonstrates that uncertainties from the determination of pore solution couldnot affect the determination of hydration water by DTA in hardened cementpaste after squeezing. Squeezing the pore solution can be used as a basic methodto calculate the hydration degree of a hardened cement paste with a w/c-ratio of0,50.
If the cement pastes are calibrated on the loss on heat status (initial weightminus loss on heat = 100 %) it is possible to compare the DTA results fordifferent compounds of the hardened cement paste with the results obtained byx-ray Diffraction.
In Table 5 all results are related to the loss on heat status so that thecontents of different cement phases in hardened cement pastes can be compared.
M. AKTAS, C. LASKOWSKI, G. VOLLAND
48
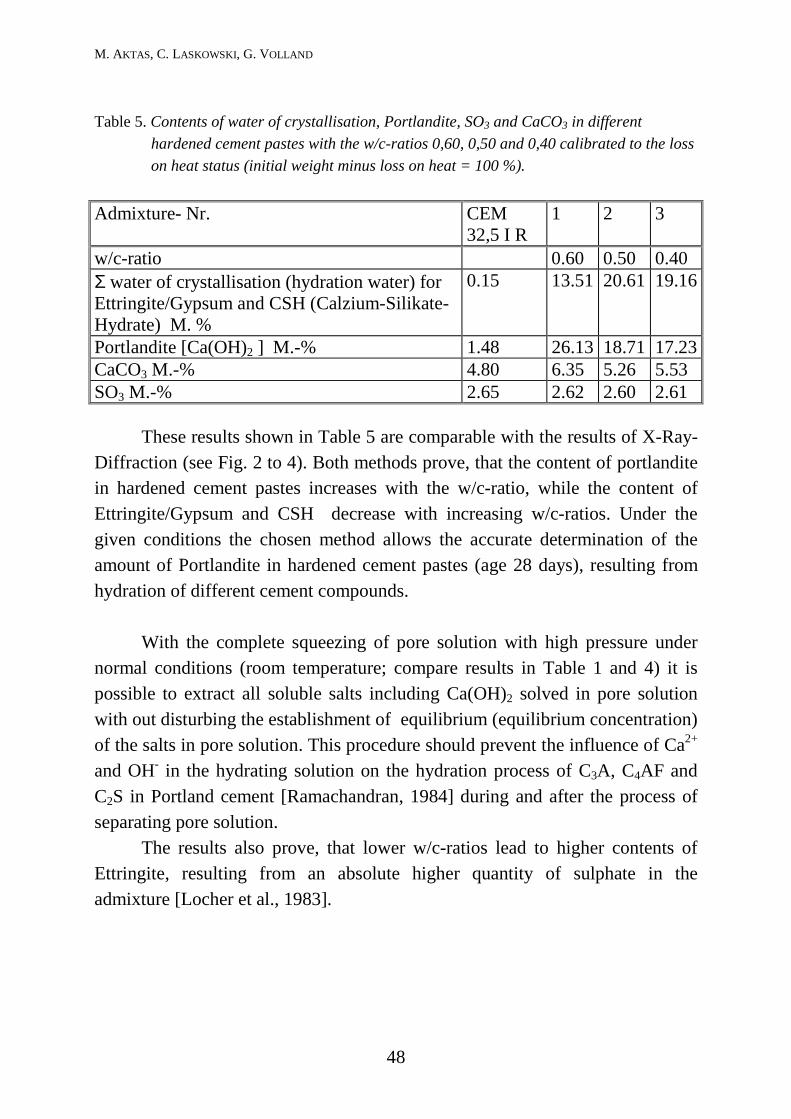
Table 5. Contents of water of crystallisation, Portlandite, SO3 and CaCO3 in differenthardened cement pastes with the w/c-ratios 0,60, 0,50 and 0,40 calibrated to the losson heat status (initial weight minus loss on heat = 100 %).
Admixture- Nr. CEM32,5 I R
1 2 3
w/c-ratio 0.60 0.50 0.40Σ water of crystallisation (hydration water) forEttringite/Gypsum and CSH (Calzium-Silikate-Hydrate) M. %
0.15 13.51 20.61 19.16
Portlandite [Ca(OH)2 ] M.-% 1.48 26.13 18.71 17.23CaCO3 M.-% 4.80 6.35 5.26 5.53SO3 M.-% 2.65 2.62 2.60 2.61
These results shown in Table 5 are comparable with the results of X-Ray-Diffraction (see Fig. 2 to 4). Both methods prove, that the content of portlanditein hardened cement pastes increases with the w/c-ratio, while the content ofEttringite/Gypsum and CSH decrease with increasing w/c-ratios. Under thegiven conditions the chosen method allows the accurate determination of theamount of Portlandite in hardened cement pastes (age 28 days), resulting fromhydration of different cement compounds.
With the complete squeezing of pore solution with high pressure undernormal conditions (room temperature; compare results in Table 1 and 4) it ispossible to extract all soluble salts including Ca(OH)2 solved in pore solutionwith out disturbing the establishment of equilibrium (equilibrium concentration)of the salts in pore solution. This procedure should prevent the influence of Ca2+
and OH- in the hydrating solution on the hydration process of C3A, C4AF andC2S in Portland cement [Ramachandran, 1984] during and after the process ofseparating pore solution.
The results also prove, that lower w/c-ratios lead to higher contents ofEttringite, resulting from an absolute higher quantity of sulphate in theadmixture [Locher et al., 1983].

Determination of portlandite and other cement compounds in hardened cement paste
Otto-Graf-Journal Vol. 10, 199949
REFERENCES
SCHIEßL, P.; MÖRSCH J.; SCHRÖDER P.: Zulassungsprüfungen für dieVerwendung von Silica Suspension in Spannbeton mit sofortigem Verbund.IBAC Forschunsgbericht F 617 (1997)
VERBAND DER ZEMENTINDUSTRIE: VDZ-Tätigkeitsbericht 1993 bis 1996. p. 120
RAMACHANDRAN, V.S.: Concrete Admixtures Handbook –Properties, Scienceand Technology. Noyes Publications Park Ridge, New Jersey USA (1984)
MANNS, W.: Über den Wassergehalt von Beton bei erhöhten Temperaturen.Beton 25 (1975), H. 1, pp. 26 - 30
LOCHER, F.W.; RICHARTZ, W.; SPRUNG, S.: Erstarren von Zement Teil I -Reaktionen und Gefügeentwicklung. Zement-Kalk-Gips 29 (1976), H. 10,pp. 435 - 442
SATAVA, V.; VEPREK, O.: Verfolgung hydrothermaler Reaktionen mittelsDifferentialthermoanalyse. Zement-Kalk-Gips (1975), H. 4, pp. 170 - 173
HUPPERTZ, F.; WIENS, U.; RANKERS, R.: Methoden zur Bestimmung derReaktivität von Zement und Puzzolanen. GIT Laborfachzeitschrift 43,(1999), pp. 665 - 659
LOCHER, F.W.; RICHARTZ, W.; SPRUNG, S.: Erstarren von Zement Teil IV-Einfluß der Lösungsmittelzusammensetzung. Zement-Kalk-Gips (1983),H.5, pp. 231 - 244

Otto-Graf-Journal Vol. 10, 199950
FOUNDATIONS OF POWER LINE PYLONS ON GYPSUM BEARINGSOILS
GRÜNDUNG VON MASTEN FÜR HOCHSPANNUNGSLEITUNGENAUF GIPSHALTIGEM UNTERGRUND
FOUNDATIOUS SUR GYPSE ROCHE POUR DES MATS HAUTETENSION
Hermann Schad
SUMMARY
Buildings on salinar rock soils can require special considerations in caseof the leaching of the rock. But in most cases no special constructions arenecessary because the foundation is simple and solid and the calculation is done″erring on the side of caution″. It is shown that calculations with differentmethods and codes for a tension footing come to nearly the same results.
ZUSAMMENFASSUNG
Wenn Bauwerke auf Salinargesteinen errichtet werden, können spezielleÜberlegungen erforderlich sein, da durch die Auslaugung des GesteinsHohlräume entstehen. Wenn jedoch einfache und robuste Konstruktionen zurAusführung kommen, die auf der ″sicheren Seite″ bemessen sind, kann auf einespezielle Sicherung verzichtet werden. Es wird gezeigt, dass sowohl empirischeAnsätze als auch numerische Analysen zutreffende Ergebnisse liefern.
Foundation of power line pylons on gypsum bearing soils
Otto-Graf-Journal Vol. 10, 199951
RESUMEE
En ce qui concerne des bâtiments fondés sur roche salinaire, on a besoinde quelques réflexions speciales à cause du lessivage du roche. On peutrenoncer des mesures spéciales, si on a des constructions simples et robustes,calculées avec une sécurité suffissante. Les essais suivants montrent, que nonseulement les méthodes empiriques, mais aussi les analyses numériques donnentdes solutions correctes.
KEYWORDS: Foundations, Gypsum, Leaching
1. INTRODUCTION
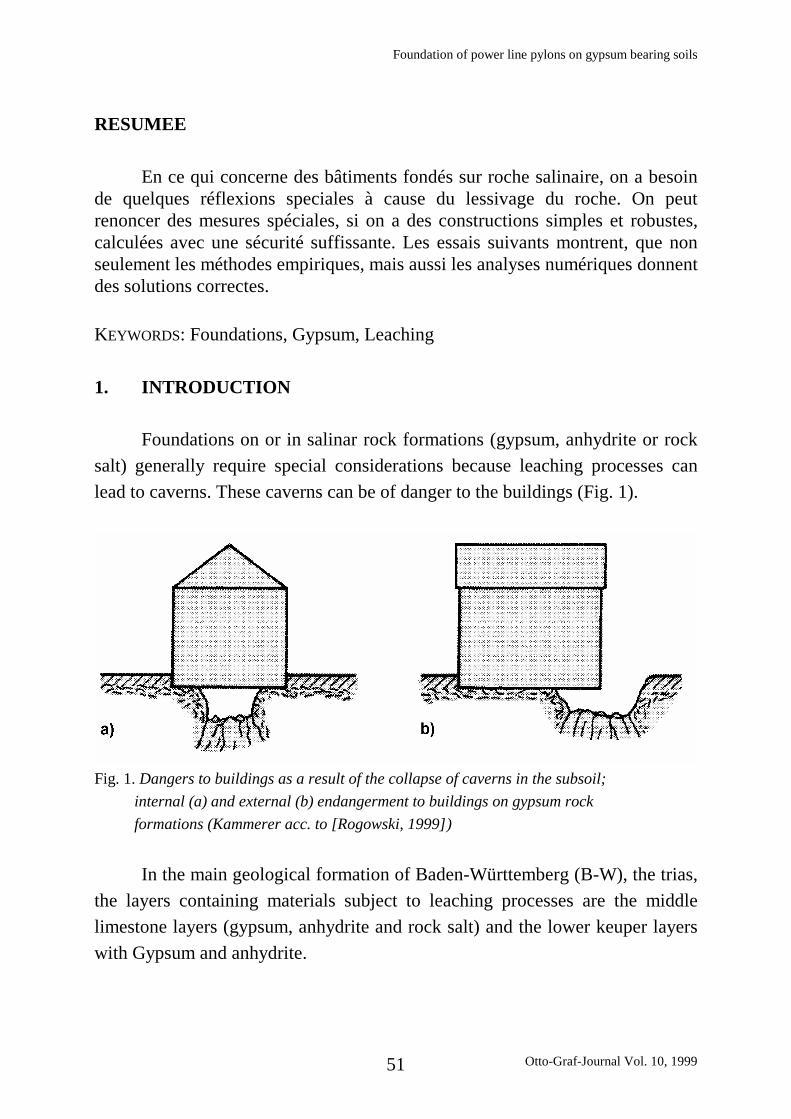
Foundations on or in salinar rock formations (gypsum, anhydrite or rocksalt) generally require special considerations because leaching processes canlead to caverns. These caverns can be of danger to the buildings (Fig. 1).
Fig. 1. Dangers to buildings as a result of the collapse of caverns in the subsoil; internal (a) and external (b) endangerment to buildings on gypsum rock formations (Kammerer acc. to [Rogowski, 1999])
In the main geological formation of Baden-Württemberg (B-W), the trias,the layers containing materials subject to leaching processes are the middlelimestone layers (gypsum, anhydrite and rock salt) and the lower keuper layerswith Gypsum and anhydrite.
H. SCHAD
52
The danger to buildings as a result of swelling due to clay minerals andthe change of anhydrite to gypsum are more common than the damage due tothe collapse of underground caverns. Even though the danger as a result of thecollapse of underground caverns looks to be very dramatic. It does not occuroften because the leaching process is very slow compared with the lifeexpectancy of the buildings. Therefore only in very special cases are buildingson the surface at danger.
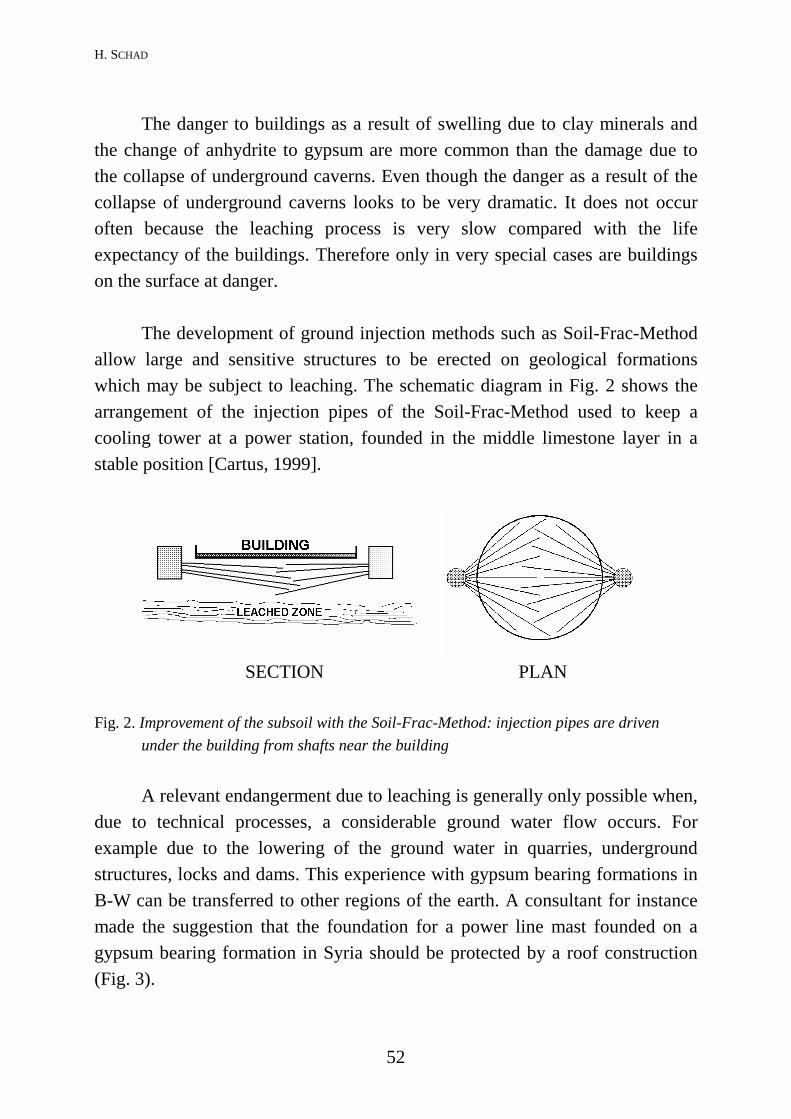
The development of ground injection methods such as Soil-Frac-Methodallow large and sensitive structures to be erected on geological formationswhich may be subject to leaching. The schematic diagram in Fig. 2 shows thearrangement of the injection pipes of the Soil-Frac-Method used to keep acooling tower at a power station, founded in the middle limestone layer in astable position [Cartus, 1999].
SECTION PLAN
Fig. 2. Improvement of the subsoil with the Soil-Frac-Method: injection pipes are drivenunder the building from shafts near the building
A relevant endangerment due to leaching is generally only possible when,due to technical processes, a considerable ground water flow occurs. Forexample due to the lowering of the ground water in quarries, undergroundstructures, locks and dams. This experience with gypsum bearing formations inB-W can be transferred to other regions of the earth. A consultant for instancemade the suggestion that the foundation for a power line mast founded on agypsum bearing formation in Syria should be protected by a roof construction(Fig. 3).

Foundation of power line pylons on gypsum bearing soils
Otto-Graf-Journal Vol. 10, 199953
In the following the case of gypsum leaching will be considered withrespect to the possible endangerment of overhead power line masts. It will beshown that roof constructions are not necessary.
Fig. 3. Power line mast and foundation protected by a roof
2. FOUNDATION TYPE AND GYPSIFERIOUS SUBGRADE
For conventional foundations on gypsiferous subgrade no particularprecautionary measures are required since the process of gypsum leaching willonly lead to phenomena such as sink holes and depressions etc. over geologicaltime scales (many thousands of years). During the service time of normaltechnical installations (100 years) gypsum leaching will have nearly no effecton conventional foundations provided these are dimensioned safely. Specialmeasures would only be necessary in the case of pre-stressed grout anchors orsimilar.

H. SCHAD
54
Setting the towers for overhead power lines on deep embedded anchors isa type of foundation which is simple to construct yet not susceptible to trouble.It is an individual footing which may be classified as a shallow foundation.Since the loads to which the structure is exposed are predominantly horizontalforces (wind, wire tension), it is not necessary to examine the foundations forultimate bearing capacity or settlement. In view of the considerable anchoringdepth it is not necessary to provide evidence of the horizontal forces.
Crucial for the sizing and safety of the foundation is the uplift resistanceof the footing. It is therefore necessary to test whether the calculation for theuplift is regarded as ″erring on the side of caution″.
3. VERIFICATION OF THE FOUNDATION CALCULATION
There are to compare the calculations according the Safetity Rules ForOverhead Lines (SROL) with
• FE-analyses (rotationally symmetric, Mohr-Coulomb's elastic-plasticmaterial law) and
• calculations according [Vermeer et al., 1985]
The calculation with respect to uplift resistance are based on thefollowing assumptions:
• unit weight of soil (backfill): 15 kN/m3;• angle of friction (ϕ ): 15o;• cohesion (c): 0.
These assumptions should be regarded as being conservative. Since theangle of dilatancy (ψ ) must be taken into consideration for the comparativecalculations, the simple and safe assumption ψ = 0 was selected. For friablemoderately compacted backfill material the angle of dilatancy lies between 5o
and 10o.

Foundation of power line pylons on gypsum bearing soils
Otto-Graf-Journal Vol. 10, 199955
For cohesive material the assumption ψ = 0 does not incorporate anysafety margin; for this reason, cohesion should be set at between 5 kN/m2 to20 kN/m2. These assumptions for the soil mechanic characteristic values takeinto consideration the fact that the soil is exposed to a substantial alternationbetween drying out and high moisture levels and that the effects of binding ordilatancy are not permanent. The assumption c = 0 is based on the premise thatthe cohesive effect of a binding agent is not present.
The formula is [Vermeer et al., 1985]:
cvLc
Bc
LH
BH
HLBP ϕ
γγϕ
γcos22tan1lim ⋅�
�
���
�
⋅⋅+
⋅⋅+⋅�
�
�
� ++=⋅⋅⋅
For the investigation of foundations for which
0;; === cLB cvϕϕ
the formula [Vermeer et al., 1985] can be transformed to
.sin212lim ϕ
γ BH
BHP ⋅+=
⋅⋅
The limit-loads of the FE-calculations are the maxima of the load-displacement-curves of Fig. 4. For the FE-analyses the Plaxis-Code [Plaxis]with the FE-meshes of Fig. 5 was used. The results of the calculations accordingto [Vermeer et al., 1985] and the FE method are summarised in Table 1.
The limit loads of the FE calculation derive from the load-displacementcurves shown in Fig. 4. For the elastic-plastic calculation a shear modulus of20,000 kN/m2 and a Poisson's ratio of 0.25 were selected. The squarefoundations were converted to circular foundations of the same area.
So a rotationally symmetrical analysis was performed. The FE grids arepresented in Fig.5.

H. SCHAD
56
Fig. 4. Load-Displacement-Curves of FE-analyses
Table 1. Results of the calculations

Foundation of power line pylons on gypsum bearing soils
Otto-Graf-Journal Vol. 10, 199957
Fig. 5. FE-grids for the analyses6 EVALUATION OF THE CALCULATION

H. SCHAD
58
Both the calculation according to the formula by [Vermeer et al., 1985]and the calculation according to the elastic-plastic FE analysis give slightlyhigher limit loads than those calculated according SROL. This demonstratesthat both the assumptions made and the SROL calculation incorporate a marginof safety.
Whereas the SROL calculation was made using factored loads, applicableGerman safety standards require that calculations are made using loads in thestate of serviceability and that testing is carried out to establish whether thesafety requirements of German Subgrade Standard DIN 1054 [DIN 1054, 1976]are fulfilled.
In the ANSI standard C2, on which the SROL calculation is based, thefollowing Overload Capacity Factors (table 261-4) are defined:• Vertical loads: Grade B: 1.5; Grade C: 1.5 (when vertical loading
significantly reduces the loading on a structure member, a vertical overloadfactor of 1.0)
• Transverse loads: Wind: Grade B: 2.5; Grade C: 2.2Wire tension: Grade B: 1.65; Grade C: 1.1
• Longitudinal loads: In general Grade B: 1.1;Grade C: no requirements;at deadends: Grade B: 1.65; Grade C: 1.1
According to DIN 1054 shallow embedded anchors may be classifiedeither as foundation elements with uplift (taking into consideration lateral soilreaction) or as anchor piles with alternating loads. The required safetycoefficients are as follows:• Foundation elements with uplift: Loading case 1: 1.4;
Loading case 2: 1.4; Loading case 3: 1.2.• Piles with alternating loads: Loading case 1: 2.0;
Loading case 2: 2.0; Loading case 3: 1.75.

Foundation of power line pylons on gypsum bearing soils
Otto-Graf-Journal Vol. 10, 199959
Since the main load for linear power lines from wind and wire tension isonly relevant at angles or corners it is clear that the safety coefficients requiredby ANSI C2 are higher than those required by [DIN 1054, 1976].
6. CONCLUSION
It was shown that calculations with different standards and methods cometo similar results. Because the tension footings are a simple and solidconstruction Gypsum leaching does not present any danger in the duration ofserviceability. The installation of a ″roof″ (slab A of Fig. 3) is not necessary.Moreover, the construction method selected and the assumptions on which thecalculations are based can be classified as being safe with respect to the extremevariation between drying out and high moisture levels.
ACKNOWLEDGEMENT
The author would like to thank Mr. G. Gay for his valuable discussionand translation.
REFERENCES
ROGOWSKI, E.: Geologisch bedingte Bauschäden, Seminar Schadensanalysenim Grundbau. Technische Akademie Esslingen, 1999
VERMEER, P. A.; SUTJIADI, W.: The uplift resistance of shallow embeddedanchors. Proceedings 11th Int. Conference on Soil Mechanics andFoundation Engineering, San Francisco, 4/C/14, 1635 –1638, 1985
PLAXIS: Finite Element Code for Soil and Rock Plasticity. Plaxis B.V. 3160 ABRhon (Rotterdam), Netherlands
DIN 1054: Baugrund: Zulässige Belastung des Baugrunds. DIN DeutschesInstitut für Normung e.V., Berlin, (11/1976):
CARTUS, M. : Setzungsschäden und ihre Sanierung durch das Soilfrac-Verfahren. Seminar Schadensanalysen im Grundbau. Technische AkademieEsslingen, 1999
Otto-Graf-Journal Vol. 10, 199960
FIELD TESTS ON THERMALLY SPRAYED ZINC-(ALUMINIUM)-COATINGS ON STEEL
FELDUNTERSUCHUNGEN AN THERMISCH GESPRITZTEN ZINK-(ALUMINIUM)-ÜBERZÜGEN AUF STAHL
EXAMENS EN EXTÉRIEUR DE REVÊTEMENTS ZINC-(ALUMINIUM)THERMO VAPORISÉS SUR ACIER
Manuela Zecho, Ulf Nürnberger, Klaus Menzel
SUMMARY
To estimate the corrosion protective effect of zinc spray coatings,produced by means of modern technologies in comparison with hot-dipgalvanised coatings, tests were conducted under a variety of test conditions.ZnAl 15 spray coatings were also examined to obtain a direct comparison withfrequently observed improved corrosion resistance of hot-dipped aluminiumcontaining zinc coatings.
The investigations show, that using modern spraying techniques animproved corrosion resistance of zinc-sprayed coatings is possible to achieve.In a lot of media it can be selected equally between zinc sprayed and hot-dipgalvanized coatings. Furthermore, it was also revealed that, in many situations,ZnAl 15 spray coatings produce a considerably improved corrosion resistancethan zinc coatings.
ZUSAMMENFASSUNG
Zur Beurteilung der verbesserten Korrosionsschutzwirkung von mitmodernen Techniken aufgebrachten Zinkspritzüberzügen im Vergleich zurFeuerverzinkung wurden in einer Vielzahl baupraktischer Medien Versuchedurchgeführt. Zusätzlich wurden ZnAl 15-Spritzüberzüge untersucht, um dievielfach beobachtete verbesserte Schutzwirkung von aluminiumhaltigen Zink-schmelztauchüberzügen im direkten Vergleich überprüfen zu können.

Field tests on thermally sprayed zinc-(aluminium)-coatings on steel
Otto-Graf-Journal Vol. 10, 199961
Anhand der durchgeführten Untersuchungen wird deutlich, daß mitmodernen Spritztechniken durchaus Spritzüberzüge mit einer verbessertenKorrosionsschutzwirkung hergestellt werden können als mit herkömmlichenVerfahren. In einer Vielzahl von Medien kann durchaus gleichberechtigtzwischen einer Feuerverzinkung und einer Spritzverzinkung gewählt werden.Darüberhinaus konnte gezeigt werden, daß aluminiumhaltigeZinkspritzüberzüge vielfach eine deutlich bessere Korrosionsschutzwirkungaufweisen als Zinküberzüge.
RESUME
Pour apprécier l'amélioration de la résistance à la corrosion derevêtements de zinc appliqués par des techniques modernes de projection parrapport à la galvanisation à chaud, des essais ont été effectués sur différentssupports expérimentaux. Des revêtements par projection ZnAl 15 ont été enoutre examinés afin de vérifier par comparaison directe l'amélioration maintesfois observée de la résistance à la corrosion de revêtement de zinc par projectioncontenant de l'aluminium.
Les examens réalisés montrent clairement que la mise en œuvre detechniques modernes de projection permet d'obtenir des revêtements parprojection bien plus résistants à la corrosion qu'avec des procédés traditionnels.Sur plusieurs supports, il est possible de choisir indifféremment entre unegalvanisation à chaud et un revêtement de zinc par projection. Il a été de plusdémontré que les revêtement de zinc par projection contenant de l'aluminiumprésentent une résistance à la corrosion nettement supérieure à celle desrevêtements de zinc.
KEYWORDS: Corrosion, thermal spraying, zinc, zinc-aluminium, aluminium,galvanised steel, coatings.
M. ZECHO, U. NÜRNBERGER, K. MENZEL
62
1 INTRODUCTION
Thermal spraying is a commonly used method of corrosion protection byspraying zinc on steel. In civil engineering, however, hot-dip galvanising ismore commonly used for corrosion protection purposes [Johnen, 1981;Hoff, 1997; Oeteren, 1980; Smolka, 1985].
When comparing these two methods, it is assumed that the corrosionprotective effect of hot-dip galvanised coatings is better than that of thermallysprayed coatings due to the higher porosity of the latter. Therefore, in the caseof spray coatings, an additional organic coating is usually required[DIN EN 22063, 1994; Schulz, 1996]. Nevertheless, modern state-of-the-arttechnology is able to produce spray coatings with a improved corrosionprotection effect [Lester et al., 1995].
In comparison with hot-dip galvanising, metallising reveals numerousadvantages: On-site metallisation can be used for large components.Maintenance of corrosion protection surfaces can easily be carried out. Inaddition, when thermal spraying is used, there is no risk of defects occurring,such as cracks and warping.
Zinc coatings are known to provide good corrosion protection for steelstructures under various conditions. However, with the demand for a longerservice life in civil engineering structures, use of non-zinc coating materials isbecoming increasingly popular. Good results are obtained using aluminiumcontaining zinc coatings. Hot-dipped coatings with 5 Wt.-% or 55 Wt.-%aluminium are commonly used. But aluminium containing coating baths cannotbe used for batch galvanising [Nürnberger, 1995]. An advantage of metallisingis that it is possible to produce ZnAl-coatings with different aluminiumcontents.
Field tests on thermally sprayed zinc-(aluminium)-coatings on steel
Otto-Graf-Journal Vol. 10, 199963
When zinc is alloyed with aluminium, the corrosion behaviour tends tobecome more similar to aluminium. At higher aluminium content levels, loweroverall attack and increased sensitivity to pitting can be observed. Zinc andzinc-aluminium coatings with smaller amounts of aluminium provide cathodicprotection to steel if the coating is partially damaged, removed (e.g. cuttingedges) or dissolved [Jailloux et al., 1996; Johnsson et al., 1989; Johnsson et al.,1983; Nagasaka et al., 1985; Schulz et al., 1992].
2 THERMAL SPRAYING
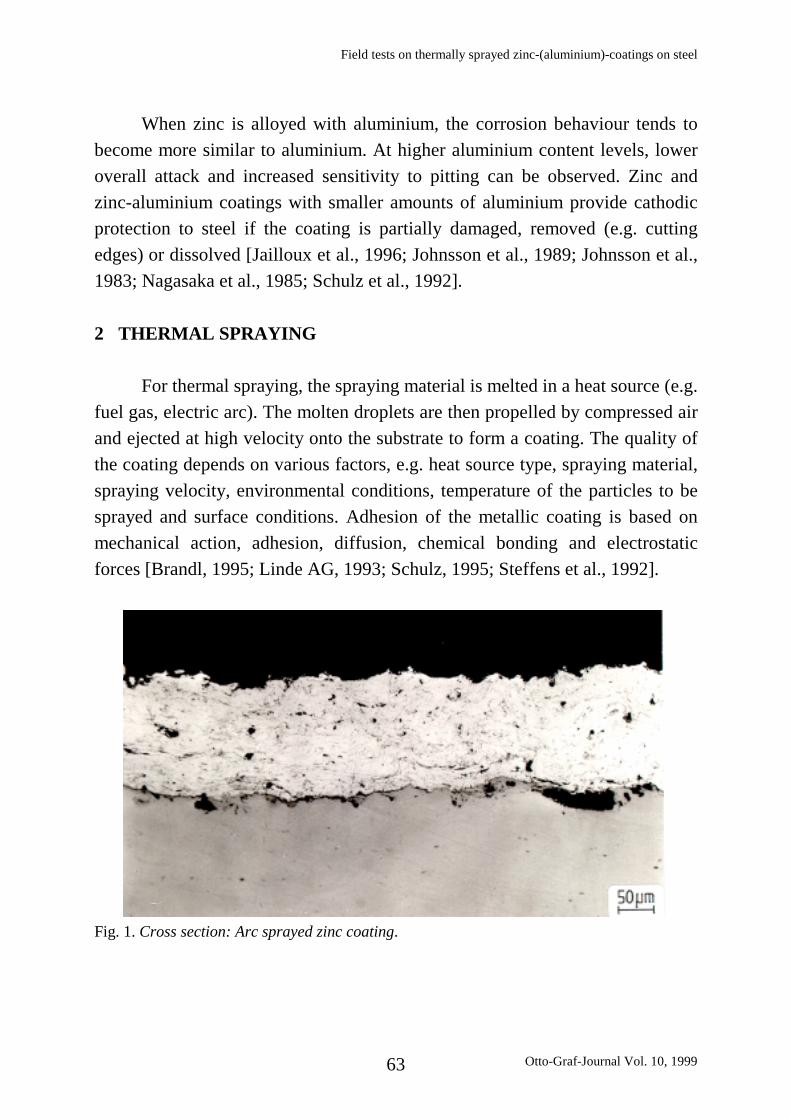
For thermal spraying, the spraying material is melted in a heat source (e.g.fuel gas, electric arc). The molten droplets are then propelled by compressed airand ejected at high velocity onto the substrate to form a coating. The quality ofthe coating depends on various factors, e.g. heat source type, spraying material,spraying velocity, environmental conditions, temperature of the particles to besprayed and surface conditions. Adhesion of the metallic coating is based onmechanical action, adhesion, diffusion, chemical bonding and electrostaticforces [Brandl, 1995; Linde AG, 1993; Schulz, 1995; Steffens et al., 1992].
Fig. 1. Cross section: Arc sprayed zinc coating.
M. ZECHO, U. NÜRNBERGER, K. MENZEL
64
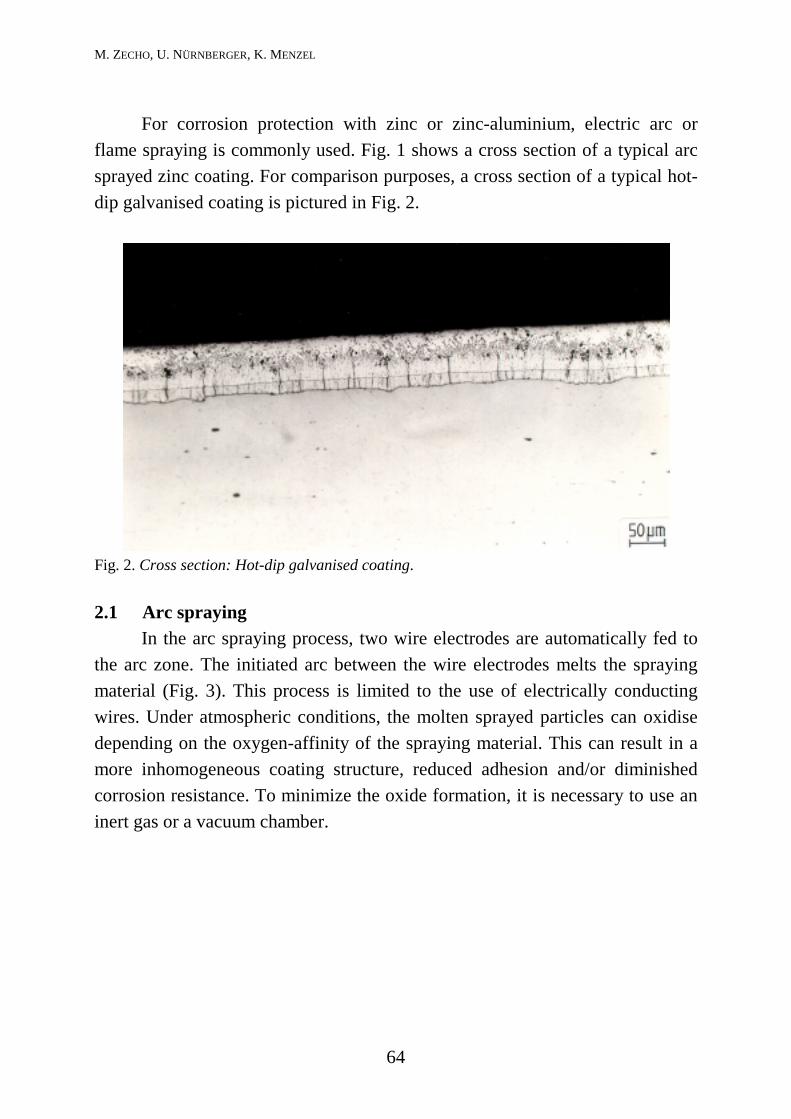
For corrosion protection with zinc or zinc-aluminium, electric arc orflame spraying is commonly used. Fig. 1 shows a cross section of a typical arcsprayed zinc coating. For comparison purposes, a cross section of a typical hot-dip galvanised coating is pictured in Fig. 2.
Fig. 2. Cross section: Hot-dip galvanised coating.
2.1 Arc sprayingIn the arc spraying process, two wire electrodes are automatically fed to
the arc zone. The initiated arc between the wire electrodes melts the sprayingmaterial (Fig. 3). This process is limited to the use of electrically conductingwires. Under atmospheric conditions, the molten sprayed particles can oxidisedepending on the oxygen-affinity of the spraying material. This can result in amore inhomogeneous coating structure, reduced adhesion and/or diminishedcorrosion resistance. To minimize the oxide formation, it is necessary to use aninert gas or a vacuum chamber.

Field tests on thermally sprayed zinc-(aluminium)-coatings on steel
Otto-Graf-Journal Vol. 10, 199965
Fig. 3. Principle of arc spraying
2.2 Flame spraying
In this process the spraying material is melted in an oxy-fuel-flame andpropelled towards the substrate by the expanding gas fuel (Fig. 4). If necessary,atomising air can be blasted in so as to accelerate the spray stream.
Fig. 4. Principle of high velocity flame spraying [DIN EN 657, 1994]
M. ZECHO, U. NÜRNBERGER, K. MENZEL
66
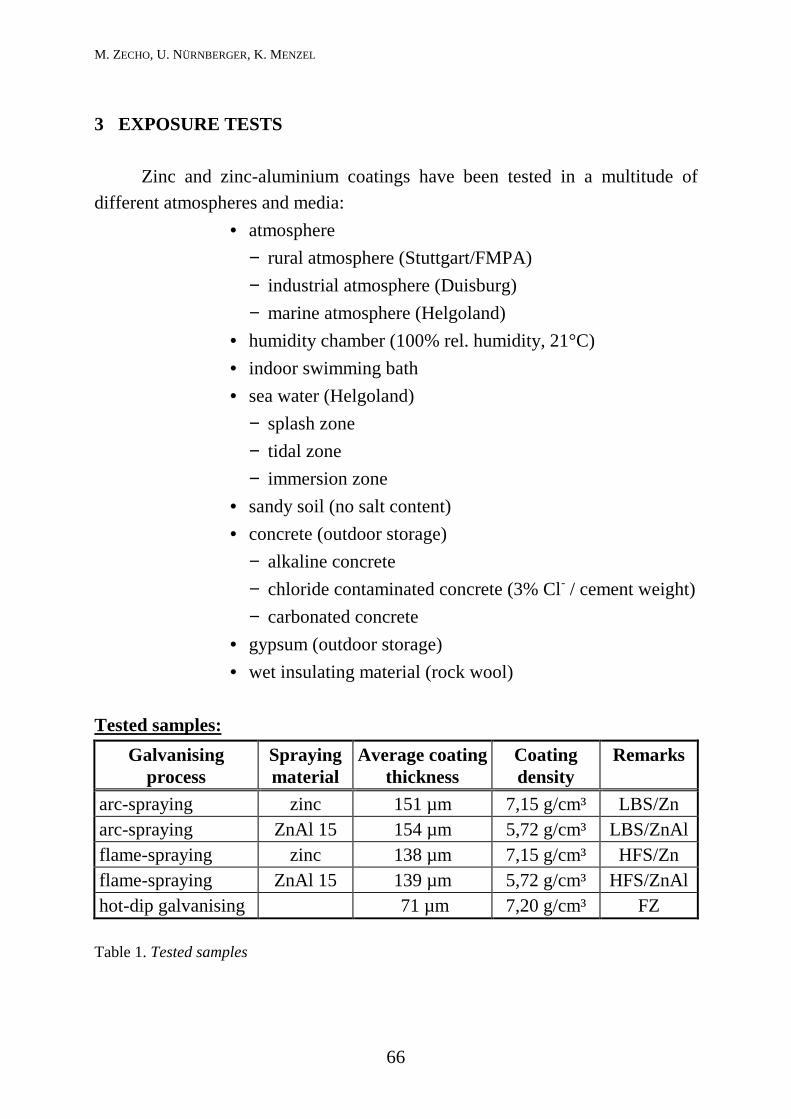
3 EXPOSURE TESTS
Zinc and zinc-aluminium coatings have been tested in a multitude ofdifferent atmospheres and media:
• atmosphere− rural atmosphere (Stuttgart/FMPA)− industrial atmosphere (Duisburg)− marine atmosphere (Helgoland)
• humidity chamber (100% rel. humidity, 21°C)• indoor swimming bath• sea water (Helgoland)
− splash zone− tidal zone− immersion zone
• sandy soil (no salt content)• concrete (outdoor storage)
− alkaline concrete− chloride contaminated concrete (3% Cl- / cement weight)− carbonated concrete
• gypsum (outdoor storage)• wet insulating material (rock wool)
Tested samples:Galvanising
processSprayingmaterial
Average coatingthickness
Coatingdensity
Remarks
arc-spraying zinc 151 µm 7,15 g/cm³ LBS/Znarc-spraying ZnAl 15 154 µm 5,72 g/cm³ LBS/ZnAlflame-spraying zinc 138 µm 7,15 g/cm³ HFS/Znflame-spraying ZnAl 15 139 µm 5,72 g/cm³ HFS/ZnAlhot-dip galvanising 71 µm 7,20 g/cm³ FZ
Table 1. Tested samples

Field tests on thermally sprayed zinc-(aluminium)-coatings on steel
Otto-Graf-Journal Vol. 10, 199967
EvaluationAfter an exposure period of up to 3 years, the corrosion products were
removed from the samples by pickling in saturated ammoniumacetate solutionand then weighed. Changes in weight are translated into loss of thickness byusing the following equation:
∆∆∆∆d = ∆∆∆∆m
ρρρρ * A (1)
∆d: change in coating thickness∆m: change in massA: coating areaρ: coating density
In the following a thickness increase is called "negative corrosion loss".
3.1 Results after exposure to atmospheric conditions
After 3 years' exposure, ZnAl 15 coatings show an increase or a smallerloss in thickness than hot dip galvanising or zinc metallising in all sorts ofatmospheres (rural, industrial and marine atmospheres, humidity chambers andindoor swimming bath); refer to Fig. 5.
-15
-10
-5
0
5
10
15
20
[µm
]
FZ LBS/Zn HFS/Zn LBS/ZnAl HFS/ZnAl
ruralatmosphere
industrialatmosphere
marineatmosphere
humiditychamber
indoorswimming
bath
Fig. 5. Change in thickness in different atmospheres after 3 years´ exposure.

M. ZECHO, U. NÜRNBERGER, K. MENZEL
68
For zinc (hot-dip galvanised or metallised), the loss of thickness is in theorder of rural to industrial to marine atmospheres. Because of the relative smallloss of thickness under atmospheric conditions, the changes in thickness of thevarious zinc-coatings can be grouped in the same order of magnitude.
3.2 Results after exposure in sea water
It is clear that ZnAl 15 and Zinc react differently in sea water. Thecorrosion resistance of ZnAl 15 is obviously superiour to thoes of pure zinc(Fig. 6). In the tidal zone and immersion zone, zinc coatings show a significantloss of thickness. Owing to the thinner coating, the hot dip galvanised coating isnearly completely dissolved after 3 years of exposure. The results in the splash-zone are similar to those in the marine atmosphere.
-10
0
10
20
30
40
50
60
70
80
90
[µm
]
FZ LBS/Zn HFS/Zn LBS/ZnAl HFS/ZnAl
splash zone tidal zone immersion zone
Fig. 6. Change in thickness in sea water after 3 years of exposure

Field tests on thermally sprayed zinc-(aluminium)-coatings on steel
Otto-Graf-Journal Vol. 10, 199969
3.3 Results after exposure in concrete
The results of contact with concrete show that ZnAl 15 is less resistant tocorrosion because of the reduced alkali resistance due to the aluminium content.In highly chloride-contaminated concrete, corrosion loss of zinc coatings(min. 75 µm) is also significant (Fig. 7).
0
20
40
60
80
100
120
140
160
180
[µm
]
FZ LBS/Zn HFS/Zn LBS/ZnAl HFS/ZnAl
alkaline concrete concrete +3 % chloride
carbonated concrete
Fig. 7. Change in thickness after 3 years´ exposure to concrete (outdoor storage).
3.4 Results after exposure to sandy soil, gypsum and wet insulatingmaterial
After three years of exposure to sandy soil, gypsum (outdoor storage) andmoist insulating material (rock wool), ZnAl 15 proves to be more corrosionresistant than zinc (Fig. 8). This behaviour is most obvious after exposure togypsum and wet insulating material. In the case of zinc coatings (hot-dipgalvanised and metallised), the thickness loss is in the range of at least 52 µm.Here, it is remarkable that the hot-dip galvanised coating shows the most severethickness loss. In contrast, the ZnAl 15 coatings show a significant thicknessincrease.
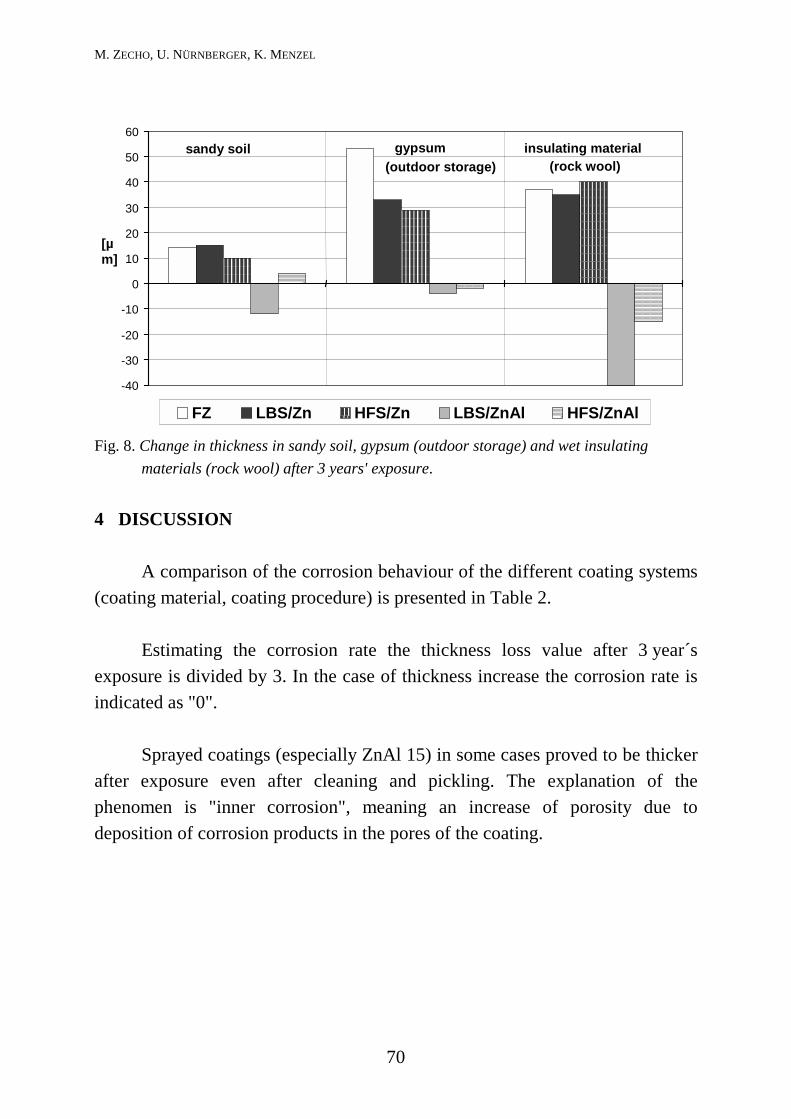
M. ZECHO, U. NÜRNBERGER, K. MENZEL
70
-40
-30
-20
-10
0
10
20
30
40
50
60
[µm]
FZ LBS/Zn HFS/Zn LBS/ZnAl HFS/ZnAl
sandy soil gypsum(outdoor storage)
insulating material(rock wool)
Fig. 8. Change in thickness in sandy soil, gypsum (outdoor storage) and wet insulatingmaterials (rock wool) after 3 years' exposure.
4 DISCUSSION
A comparison of the corrosion behaviour of the different coating systems(coating material, coating procedure) is presented in Table 2.
Estimating the corrosion rate the thickness loss value after 3 year´sexposure is divided by 3. In the case of thickness increase the corrosion rate isindicated as "0".
Sprayed coatings (especially ZnAl 15) in some cases proved to be thickerafter exposure even after cleaning and pickling. The explanation of thephenomen is "inner corrosion", meaning an increase of porosity due todeposition of corrosion products in the pores of the coating.

Field tests on thermally sprayed zinc-(aluminium)-coatings on steel
Otto-Graf-Journal Vol. 10, 199971
LBS/Zn LBS/ZnAl
HFS/Zn
HFS/ZnAl
FZ
rural atmosphere (Stuttgart)
industrial atmosphere (Duisburg)
marine atmosphere (Helgoland)
humidity chamber(100% rel.H., 21°C)
indoor swimming bath
splash zone(Helgoland)
tidal zone (Helgoland)
immersion zone (Helgoland)
sandy soil
alkaline concrete(outdoor storage)
carbonated concrete(outdoor storage)
chloride cont. concrete(3 wt.-% Cl- rel. to cement content,outdoor storage)
gypsum(outdoor storage)
wet insulating material (rockwool)
corrosionrate:<1µm/a
corrosionrate:1-5 µm/a
corrosionrate:5-15 µm/a
corrosion rate:>15 µm/a
Table 2. Corrosion rates of metallic coatings after three years' exposure.[Zecho, 1999]
M. ZECHO, U. NÜRNBERGER, K. MENZEL
72
The real "corrosion loss" in such cases had to consider this byquantitative analysis of porosity before and after exposure by means of imageanalysis on metallographically preparated cross sections of the samples. But it isto notice, that there exist no clear correlation between exposure period andthickness increase. Therefore, determining the remaining metal content of thecoating after exposure would supply more exact results in order to be able toestimate the remaining corrosion protective effect of the coating [Zecho, 1999].
Comparison: Hot-dip galvanised vs. Thermally sprayed zinc coatingsA similar magnitude of thickness loss is revealed for the corrosion rates
of hot-dip galvanised and thermally sprayed zinc coatings. There is nosignificant difference between the corrosion behaviour of hot-dipped andmetallised zinc coatings. This shows that modern state-of-the-art technology isable to produce spray coatings with a improved corrosion protection effect.
Effect of spraying methods on corrosion lossThe spraying methods used here (electric arc spraying, high velocity
flame spraying) do not have any significant effect on the corrosion loss of thezinc- and ZnAl 15 coatings. Only the thickness increase of the ZnAl 15 coatingstends to be higher in the case of electric arc spraying.
Effect of coating materials on corrosion lossAs far as coating materials are concerned, it can be seen, that in several
media, ZnAl 15 displays different corrosion behaviour when compared withzinc.
Under mild conditions such as in a rural, industrial and marineatmosphere as well as in the humidity chamber and splash-zone, ZnAl 15 showsless corrosion loss than zinc and sometimes a thickness increase. However, itshould be noted that in the above-mentioned atmospheres, the corrosion loss ofzinc is also low.
Field tests on thermally sprayed zinc-(aluminium)-coatings on steel
Otto-Graf-Journal Vol. 10, 199973
In sea-water (tidal zone / immersion zone), ZnAl 15 shows significantlylower corrosion rates than zinc (zinc-sprayed and hot-dip galvanised coatings).The corrosion loss in the case of the zinc coatings (min. 70 µm) after threeyears' exposure is very high. ZnAl 15, on the other hand, shows a thicknessincrease. Similar behaviour can be observed in gypsum and wet insulatingmaterials.
As expected, the corrosion rate of ZnAl 15 in concrete (alkaline medium)is considerably higher than that of zinc. In chloride-contaminated concrete, thecorrosion loss of zinc coating is also extremely high (max 115 µm) but thecorrosion loss of ZnAl 15 is higher still (up to 170 µm).
SummaryThe investigations show that when exposed to various atmospheric
conditions, zinc-sprayed and ZnAl 15 sprayed coatings as well as hot-dipgalvanised coatings can be recommended. ZnAl 15 coatings should be preferedin sea-water as well as in gypsum and wet insulating materials. In these media,zinc cannot be used without additional corrosion protection (e.g. organiccoating).
ACKNOWLEDGEMENTS
Project, No. 9590 was funded by the German Federal Ministry of Tradeand Commerce through the AIF Arbeitsgemeinschaft industriellerForschungsvereinigungen (Association of Industrial Research Organisations)and supervised by the Forschungsgemeinschaft Zink e.V. (Zink Research Groupreg. assoc.).

M. ZECHO, U. NÜRNBERGER, K. MENZEL
74
REFERENCES
BRANDL, W.: Verfahren zum thermischen Spritzen. Thermisches Spritzen(6/1995), T. 8, Kap. 4.1
JAILLOUX, J.M., MENZEL, K., ZECHO, M.: Corrosion protection of steel in soilby sprayed zinc-aluminium coatings. Otto Graf Journal 7 (1996),pp. 190-205
JOHNEN, H.J.: Zink; Zink-Taschenbuch. Zinkberatung e.V., ed. by H.J. Johnen,Metall-Verlag GmbH, Berlin (1981)
JOHNSSON, T., KUCERA, V.: Eight years´ field exposure of coatings of zinc,aluminium and their alloys. 2. internationale Bandverzinkertagung, Rom,(1988) / Proc. Zinc Development Association, London, (1989),pp. A6/1-A6/11
JOHNSSON, T., NORDAG, L.: Corrosion resistance of coatings of aluminium, zincand their alloys. Proc. 9th Scandinavian Corrosion Congress,Copenhagen, (9/1983), pp. 243-255
HOFF, I.: The heat is on; Protecting steel with thermal sprayed zinc coatings.Welding and Metal Fabrication 65 (1997), No. 4, pp. 12-13
LESTER, T.P., FITZSIMONS, B.: New Methods, Specifications and Standards inOffshore Corrosion Protection. ITSC 95, 14th International ThermalSpray. Conf., Thermal Spraying, Current Status and Future Trends, Kobe,Proc. Vol. 22 (1995), Band 2
LINDE AG: Thermisches Spritzen. Sonderdruck Fa. Linde AG Höllriegelskreuth,(1993)
NAGASAKA, H., SUZUKI, R., IBARKI: Corrosion behaviour of variouscomposition ZnAl-alloys and coatings sprayed from them. DVS 80(1985), pp. 191-194
NÜRNBERGER, U.: Korrosion und Korrosionsschutz im Bauwesen. BauverlagGmbH Wiesbaden, (1995)
OETEREN, VAN A.: Korrosionsschutz durch Beschichtungsstoffe. Carl-Hanser-Verlag, München (1980) Band 1
SCHULZ, W.-D.: Thermisches Spritzen von Zink, Aluminium und derenLegierungen. Thermisches Spritzen (6/95), T. 8, Kap. 4.2

Field tests on thermally sprayed zinc-(aluminium)-coatings on steel
Otto-Graf-Journal Vol. 10, 199975
SCHULZ, W.-D.: Thermisches Spritzen von Zink, Aluminium und derenLegierungen als Korrosionsschutz von Stahlkonstruktionen.Schweissen & Schneiden 48 (1996), No. 2, pp. 137-142
SCHULZ, W.D., EISENGRÄBER, A., GORGAS, V.: Zum Korrosionsverhalten vonZink-, Aluminium- und Zink-Aluminium-Spritzschichten imKurzzeitkorrosionsversuch. Schweissen & Schneiden, Sonderdruck ausHeft 12 (1992), pp. 1-3
SMOLKA, K.: Thermisches Spritzen. Die Schweißtechnische Praxis. DeutscherVerlag für Schweißtechnik GmbH Düsseldorf, (1985), Band 15
STEFFENS, H.D., BRANDL, W.: Moderne Beschichtungsverfahren. DGMInformationsgesellschaft mbH Oberursel, (1992)
ZECHO, M.: Korrosionsverhalten von Zink- und Zink-Aluminium-Überzügen aufStahl. Diss. Uni-Stuttgart, (1999)
DIN EN 657: Thermisches Spritzen: Begriffe, Einteilung. (1994)
DIN EN 22063: Thermisches Spritzen; Zink, Aluminium und ihre Legierungen,(1994)

76
A VIRTUAL ADVISOR FOR RECYCLING PROCESSES INCONCRETE CONSTRUCTION
EIN VIRTUELLER BERATER FÜR KREISLAUFPROZESSE IMMASSIVBAU
UN CONSEILLER VIRTUEL POUR LES PROCESSUS DERECYCLAGE DU BÉTON DE CONSTRUCTION
Marcus Schreyer, Joachim Schwarte
SUMMARY
Knowledge based online systems are useful tools to increase theefficiency of the utilisation of research results in practical applications. BiM-Online is an interactive system that covers the field of recycling processes incivil engineering.
ZUSAMMENFASSUNG
Wissensbasierte Online-Systeme sind zweckdienliche Hilfsmittel zurVerbesserung der Nutzung aktueller Forschungsergebnisse in der Baupraxis.BiM-Online ist ein interaktives System, das den Bereich der Kreislaufprozesseim Massivbau abdeckt.
RESUME
Les systèmes interactifs basés sur la connaissance sont des ressourcespropices à améliorer l'utilisation des résultats de la recherche appliquée. BiM-Online est un système interactif qui couvre le domaine du recyclage dans legénie civil.
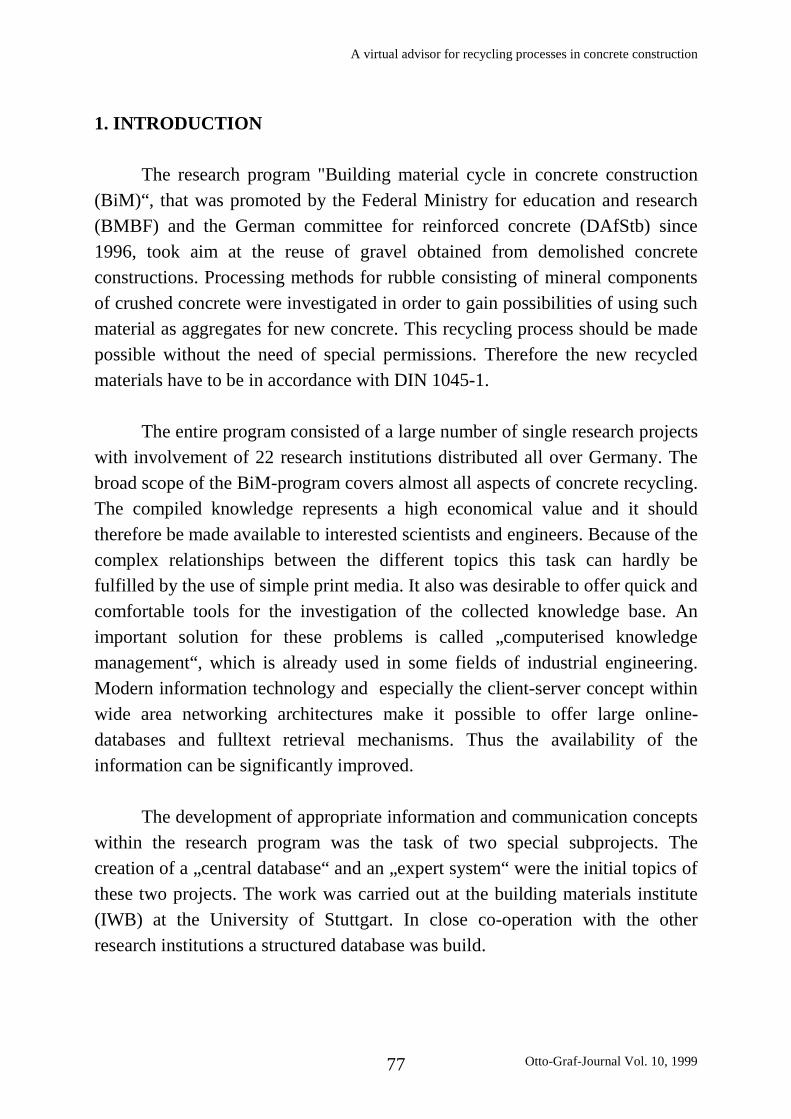
A virtual advisor for recycling processes in concrete construction
Otto-Graf-Journal Vol. 10, 199977
1. INTRODUCTION
The research program "Building material cycle in concrete construction(BiM)“, that was promoted by the Federal Ministry for education and research(BMBF) and the German committee for reinforced concrete (DAfStb) since1996, took aim at the reuse of gravel obtained from demolished concreteconstructions. Processing methods for rubble consisting of mineral componentsof crushed concrete were investigated in order to gain possibilities of using suchmaterial as aggregates for new concrete. This recycling process should be madepossible without the need of special permissions. Therefore the new recycledmaterials have to be in accordance with DIN 1045-1.
The entire program consisted of a large number of single research projectswith involvement of 22 research institutions distributed all over Germany. Thebroad scope of the BiM-program covers almost all aspects of concrete recycling.The compiled knowledge represents a high economical value and it shouldtherefore be made available to interested scientists and engineers. Because of thecomplex relationships between the different topics this task can hardly befulfilled by the use of simple print media. It also was desirable to offer quick andcomfortable tools for the investigation of the collected knowledge base. Animportant solution for these problems is called „computerised knowledgemanagement“, which is already used in some fields of industrial engineering.Modern information technology and especially the client-server concept withinwide area networking architectures make it possible to offer large online-databases and fulltext retrieval mechanisms. Thus the availability of theinformation can be significantly improved.
The development of appropriate information and communication conceptswithin the research program was the task of two special subprojects. Thecreation of a „central database“ and an „expert system“ were the initial topics ofthese two projects. The work was carried out at the building materials institute(IWB) at the University of Stuttgart. In close co-operation with the otherresearch institutions a structured database was build.

M. SCHREYER, J. SCHWARTE
78
This could be used by the involved researchers to get information aboutinterim results and the current process status of other subprojects and was avaluable resource that made co-operation more efficient. This first step of theknowledge base was realised as a combination of relational database-tables anda document collection. The users had access to the content of this hierarchicallyorganised database structures via a webbased hypertext surface which can beused in an intuitive way.
In order to prevent rash publication of preliminary results, the access tothe half-yearly interim reports and to the results from material testing weresubject to a password protection during the course of the project. Additionalinformation of more general interest was made available to Internet userswithout direct participation in BiM. The public part of the online system covereda topical overview, a listing of the project participants and information aboutexisting publications that was organised in a special database. Since June 1999the entire database presenting the final results of the research program was madeaccessible to public. By the end of October 1999 the information system, thatcan be approached via the address http://www.b-i-m.de and is called BiM-Online, is used by approximately 30 users per day. Email contacts and theanalysis of the server logfiles show, that most of the system users are located inuniversities and other research facilities.
2. BIM-ONLINE DIALOGUE
Users concerned with civil engineering practice demand capabilities oninformation systems that differ from the needs of scientists and researchers.During planing, design and execution of building projects usually little time isleft for the involved engineers to study research results and to draw appropriateconclusions.
Beyond the supply of the scientific result of the BiM-program it wastherefore necessary to anticipate possible problems and questions arising duringdemolition, processing and reuse of building material and to offer helpfulstatements. These statements concerning practical questions were summarised inso-called „lessons“. Each lesson is a coherent sequence of usually severalinformation pages regarding a certain question.
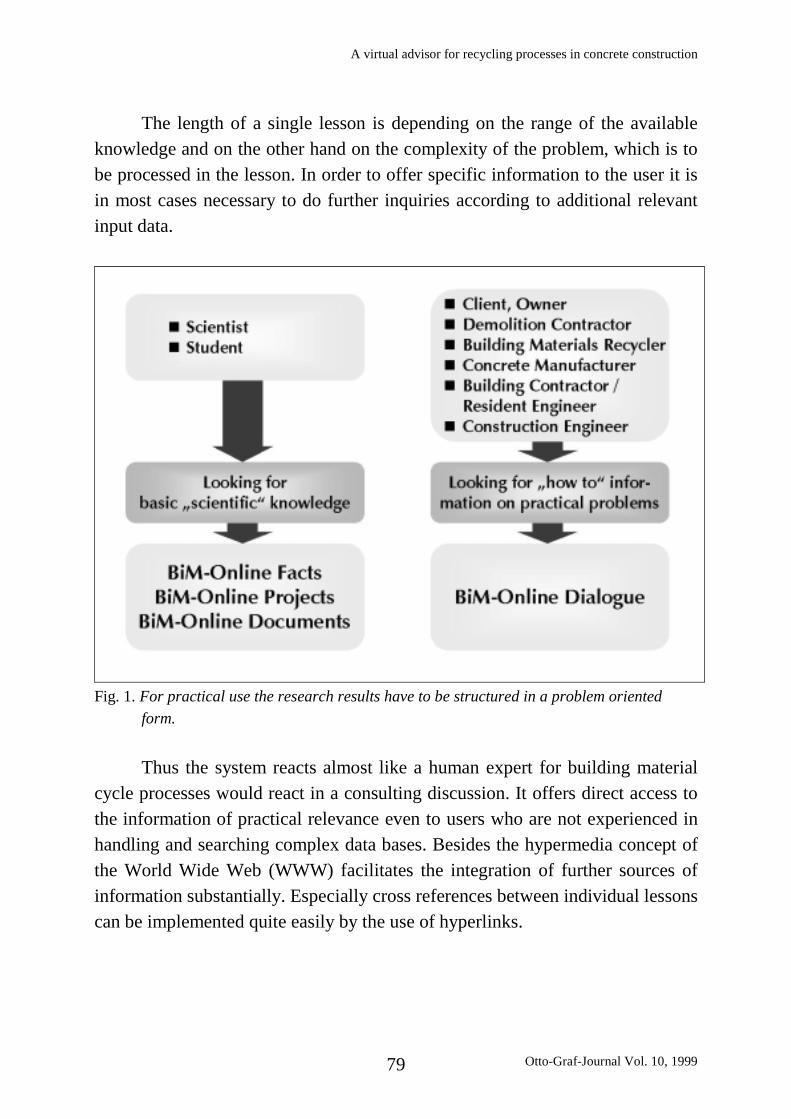
A virtual advisor for recycling processes in concrete construction
Otto-Graf-Journal Vol. 10, 199979
The length of a single lesson is depending on the range of the availableknowledge and on the other hand on the complexity of the problem, which is tobe processed in the lesson. In order to offer specific information to the user it isin most cases necessary to do further inquiries according to additional relevantinput data.
Fig. 1. For practical use the research results have to be structured in a problem orientedform.
Thus the system reacts almost like a human expert for building materialcycle processes would react in a consulting discussion. It offers direct access tothe information of practical relevance even to users who are not experienced inhandling and searching complex data bases. Besides the hypermedia concept ofthe World Wide Web (WWW) facilitates the integration of further sources ofinformation substantially. Especially cross references between individual lessonscan be implemented quite easily by the use of hyperlinks.

M. SCHREYER, J. SCHWARTE
80
The user is able to gain information directly concerned with the BiM-research-program as well as secondary information provided by other online-sources without loosing the advantages of the clearly structured user interface ofBiM-Online. The screenshot in the middle of Fig. 2a shows the screen contentafter clicking the „Literatur“-button: In an additional window those literaturesources which cover the basic knowledge of the current lesson page are listed.The dialogue-system hereby makes use of the literature database which is alsoavailable as an independent module of BiM-Online. If the cited document isavailable within the BiM document collection the user is able to request its on-screen-reproduction by mouseclick. Adequate presentation of the informationnetwork which is very complex and extensive in width as well as in depth makesgreat demands on the user interface. Fulfilling these needs is very important inorder to prevent the user from the feeling of „being lost in hyperspace“.
The current range of the total knowledge base of the BiM-dialogue-system spans over 83 lessons with altogether 379 dialogue-steps. Additionallessons covering the field of environmentalfair demolition methods are stillunder development and hence not counted so far. Due to the desired efficiencyof the information search it is not useful to offer all the contained lessons toevery single user. It is rather necessary to delimit the user interests at the verybeginning of the online session in order to select an appropriate subset of thelessons. Information systems and databases usually offer two different strategiesto cope with these needs:
A) keyword search within the information baseB) selection of contents via menu lists
Using strategy A, the userspecific content can be precisely reduced if auseful keyword is taken into account. The power of keyword search strategiescan be further increased by the use of boolean expressions. The words OR,AND, and NOT are used to create relationships among the keywords in searchqueries. Such advanced queries are a flexible tool for sophisticated databaseretrieval. However users that are not too familiar with the topic will encountersome difficulties in finding appropriate keywords.

A virtual advisor for recycling processes in concrete construction
Otto-Graf-Journal Vol. 10, 199981
Fig.2a Example for a BiM-Online Dialogue: A recycler wants to know wich cleaning methodsare suitable for rubble, polluted with heavy metal. He acesses the knowledge base viathe interest profile keyword=“Heavy metal“, interest group=“Recycler“ andsubtopic=“recycling rubble“. Two hits in the topic „Handling polluted material“were listed. The second lesson called „Cleaning polluted material“ is chosen andconfirmed.
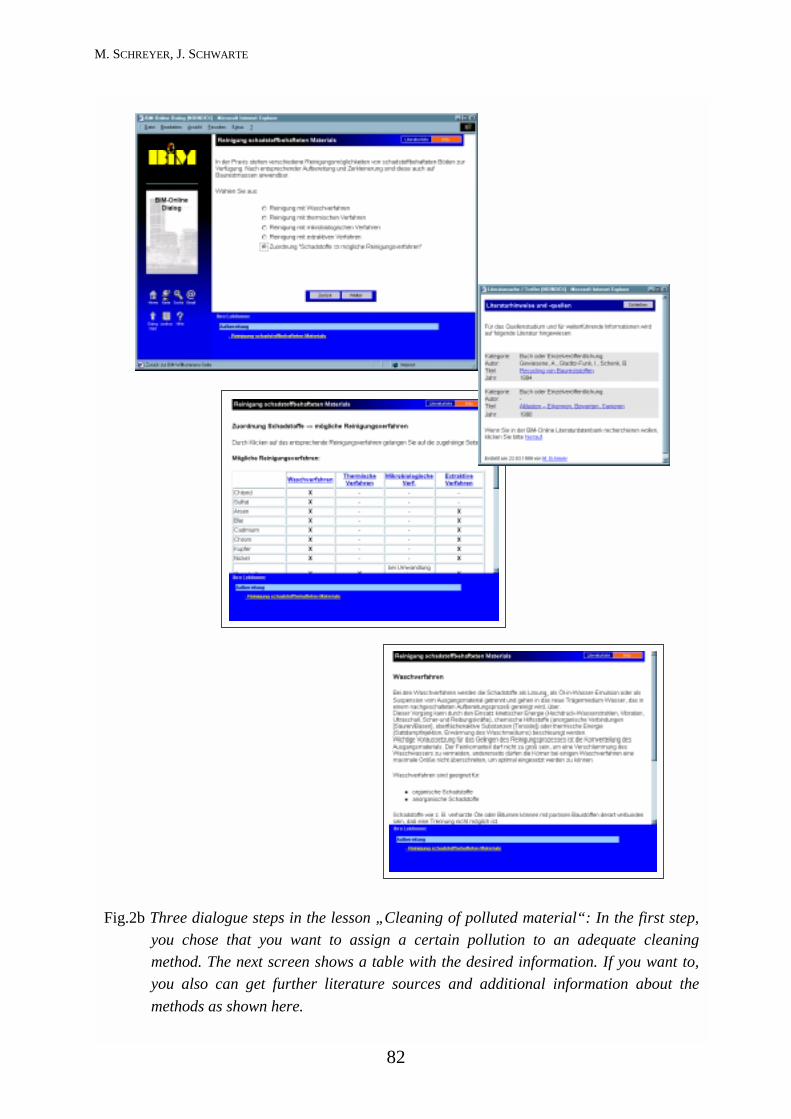
M. SCHREYER, J. SCHWARTE
82
Fig.2b Three dialogue steps in the lesson „Cleaning of polluted material“: In the first step,you chose that you want to assign a certain pollution to an adequate cleaningmethod. The next screen shows a table with the desired information. If you want to,you also can get further literature sources and additional information about themethods as shown here.

A virtual advisor for recycling processes in concrete construction
Otto-Graf-Journal Vol. 10, 199983
In such cases strategy B offers a framework of hierarchically structuredmenu items. On the other hand menu systems possess the disadvantage that theybecome strongly nested and confusing when the databases grow larger. Unlikethe keyword search the menu based information retrieval is not able to offerpossibilities to take different subsection into consideration at the same time. Theuser dialogue is completely determined by the menu structure created by thesystem developer.
In order to achieve the advantages of both discussed search strategiesBiM-Online-Dialogue incorporates an input box that combines both methods toa userspecific interest profile. Such a profile consists of keyword queriessupplemented by specific menu lists, in which the user can assign to one ofseveral given groups of interests and distinguish the lessons that are of specialrelevance to him. All single lessons in the database had to be classified withregard to this profiling mechanism. In this way the dialogue system has beenprovided with the ability to recognise interconnections between lesson contentand the profile of user interest. The user can search the knowledge base startingwith a coarse assignment to a field of activity and obtain a first overview ofthose aspects in which the recycling processes could have significant influenceon his work. Users who are more familiar with the system can increase theefficiency of the search by the additional use of the above mentioned booleanexpressions.
After the selection of appropriate lessons the screen shows a currentlesson in the upper part with a list of the recommended choices below it. Theuser has the possibility of starting and processing his lessons in any desiredorder.
Technically the implementation of the access to the lesson is carried outby the use of the programming concept „active server pages“ (ASP) whichforms the so-called „middleware“ between the relational database that includesthe knowledge and the HTML user interface that is accessible via internetconnection. ASP is a technology that offers serversided scripting.

M. SCHREYER, J. SCHWARTE
84
The scripts themselves can be programmed in the easy to learn programminglanguage Visual-Basic-Script (VBS) that is closely related to the widely knownVisual Basic. The VBS-program code can be directly implemented into theHTML source-code of the respective webpages. This versatile and powerfulprogramming technology is used to control the database queries via SQL-commands. The close interaction between WWW-technology for theimplementation of accessible user interfaces and client-server-concepts for theprogramming of the database access is the basis for such large knowledge basedsystems in the internet. Thus the administrative requirements that arise duringthe growth and the development of the content can be reduced to an affordablelevel.
The structure of the individual lessons is partly linear, i.e. the informationis presented in a certain sequential order. In most cases however the flow of alesson depends on the interaction with the user. The dialogue between the userand BiM online makes it possible to deal with non-standard situationsconcerning a given problem and to request detailed information from the user incases in which a very general statement would not be useful (Fig. 2).
Examples:
Lessons of linear structure (sequential order of the information units is fixed):- Processing of concrete and masonry rubble to RC-aggregates- Pollutant contamination and limit values
Dialogue-based lessons (user interaction influences the process):- Selection of an optimal method for crushing waste concrete- Elastic modulus of concrete with RC-aggregates

A virtual advisor for recycling processes in concrete construction
Otto-Graf-Journal Vol. 10, 199985
3. SUMMARY
Modern information and communication technology makes it possible toincrease the availability of knowledge in a new and amazing manner. At thebuilding material institute at the University of Stuttgart current methods areinvestigated in order to organise scientific results in complex research data basesthat are accessible via internet. Additionally the here presented systemcomponent BiM-Dialogue has the aim to accelerate the transfer of researchresults into practical application.
The still fast growing internet is particularly suitable for such tasks,because it enables the access to such information systems to almost everyone ina comfortable way, since it is independent of the computer operation system. Itutilises an user interface which is easy to use and which offers modernmultimedia abilities. The distribution of knowledge via internet is veryeconomical and the hypertext concept is an ideal basis for the representation ofeven very complex topics.
BiM-Online uses those modern technologies to increase the efficiency ofthe utilisation of current research results concerning recycling processes in civilengineering. The totality of the results produced in a large research program iscollected and has been made available to public using problem orientatedinterfaces that take userspecific needs into account.
REFERENCES
ABELE, T.: BiM-Online - Bauen mit Beton aus rezykliertem Zuschlag,Diplomarbeit 1999 Institut für Werkstoffe im Bauwesen, Univ. Stuttgart
BINGEL, O.: BiM-Online - Rezyklierter Zuschlag aus aufbereitetem Betonbruch /Bauschutt, Diplomarbeit 1999 Institut für Werkstoffe im Bauwesen, Univ.Stuttgart
M. SCHREYER, J. SCHWARTE
86
LUIK, M.: BiM-Online - Rezeptur und Eigenschaften von Beton mit rezykliertenZuschlägen, Diplomarbeit 1999 am Institut für Werkstoffe im Bauwesen,Univ. Stuttgart
REINHARDT, H.-W.; SCHWARTE, J.; SCHREYER, M.: BiM-Online - Ein neuesInformationskonzept DAfStb / DIN / BMBF - Meeting "Beton mitrezykliertem Zuschlag für Konstruktionen nach DIN 1045-1", Berlin 05/1998
REINHARDT, H.-W.; SCHWARTE, J.; SCHREYER, M.: BiM-Online - EinInformationssystem zum Thema Baustoffrecycling. Arconis 3/1999,Fraunhofer Informationszentrum Raum und Bau (IRB)
SCHREYER, M.: Baustoffkreislauf im Massivbau - "Strukturierte Speicherung derErgebnisse in einer Datenbank". IWB Mitteilungen 1996/1997

Otto-Graf-Journal Vol. 10, 199987
AN ELASTIC ADHESION SYSTEM FOR STRUCTURAL BONDING OFFACADE PANELS
EIN ELASTISCHES KLEBESYSTEM ZUR TRAGENDENBEFESTIGUNG VON FASSADENPLATTEN
UN SYSTEME ADHESIVE ELASTIQUE POUR LA FIXATIONPORTANTE DE PANNEAUX DE FACADE
Gunter Krüger, Roland Schneider
SUMMARY
Concerning design and construction the application of elastic adhesivetechnique improves the potential in construction and design of facades. TheSika-Tack-Panel system having achieved the first technical approval inGermany is described with test results and an example of application.
ZUSAMMENFASSUNG
Der Einsatz der elastischen Klebetechnik eröffnet neue Möglichkeiten inder Konstruktion und der Gestaltung von Fassaden. Anhand vonVersuchsergebnissen und einem Anwendungsbeispiel werden die Eigenschaftendes Sika-Tack-Panel Klebesystems beschrieben, das als erstes System inDeutschland eine allgemeine bauaufsichtliche Zulassung erhalten hat.
RESUME
L’utilisation de la technique adhésive élastique offre des possibilitésnouvelles pour la construction et le dessin de façades. Sur la base de résultatsd’essais et à l’aide d’un exemple d’application les caractères du système Sika-Tack-Panel, qui comme premier système a obtenu un agrément, sont décrits.
KEYWORDS: elastic adhesion system, facade panel

G. KRÜGER, R. SCHNEIDER
88
1. INTRODUCTION
For a couple of years the use of decorative plates in ventilated curtainwalls has become an integral part of new buildings and renovation projects inthe private, commercial and public domain (Fig. 1). The bonding of facadeplates on the support frame by an elastic adhesive joint represents a newtechnique in Germany comprising several advantages in comparison toconventional fixing systems (screws, rivets, cramps ,anchors, etc.).
Fig. 1. Single-storey building as an example for the use of decorative facade panels
The elastic adhesive technique allows an invisible back-panel fixingwithout any weakening of the cross-section of the plate. Due to an extensivebonding area along the edges of the panels, the loads resulting from wind,temperature and the self-weight of the plate are carried out uniformly. A stressconcentration as produced i.e. by anchors is avoided. In the case of failure of afacade plate the adhesive joint is able to hold large fragments in place. Quitedifferent types of plates, i.e. HPL (high pressure laminate), ceramic, aluminium-compounds or cement bonded plates can be used with the same adhesionsystem. In particular the elastic adhesion technique is suitable for the use of thinand large-size plates. Therefore a number of new design possibilities and apotential for cost reduction is presented.

An elastic adhesion system for structural bonding of facade panels
Otto-Graf-Journal Vol. 10, 199989
The Sika Tack-Panel system is the first system in Germany havingachieved a technical approval (approval number Z-36.4-18). As yet, theapproval is valid for the use of aluminium support frames and the followingceramic or HPL (high pressure laminate) facade plates: Megaceram 650, TrespaMeteon / FR, Resoplan, Isovolta Max Exterior.
As the adhesive acts as a structural connection between the facade plateand the support frame without any additional devices to carry the self-weight ofthe plate or to retain the plate in case of complete mechanical failure of theadhesive joint, the system performance has to fulfil high requirements. Toguarantee durable safety in use, the adhesive itself and the adhesion to thesubstrates has to possess a sufficient resistance to worst surrounding conditions.Furthermore, a particular attention has to be paid to the practical installation ofthe adhesive system.
The test program carried out for verification of the system performancewas mostly following the EOTA draft guideline for structural adhesive glazingsystems. The program comprised tests for the identification of the adhesive(thermo-gravimetric analysis, specific weight, etc.), tests for the determinationof tensile and shear properties and tests to study the resistance to specialenvironmental conditions (temperature, water, chemical and biological affect).As the system can be applied in the workshop as well as on the building site, theeffects of non-observance of the application instructions was tested.
In the following the properties of the system are described by the mostimportant test results and a building project in Sindelfingen near Stuttgart.
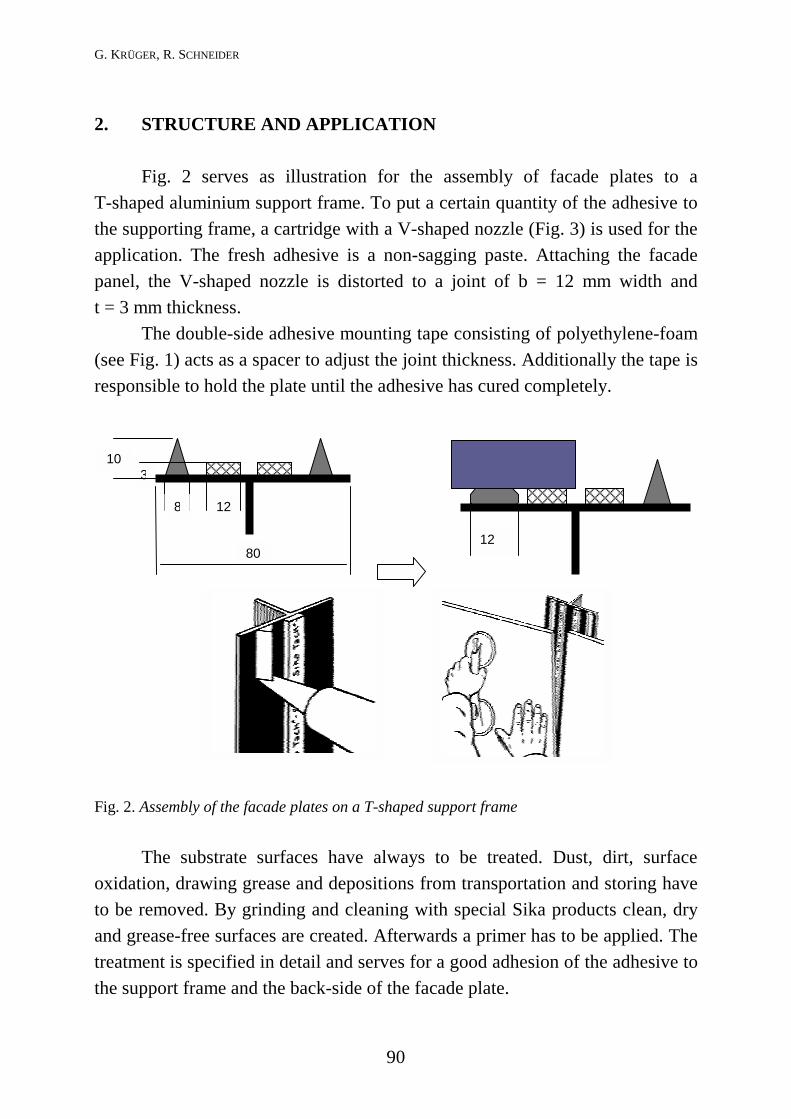
G. KRÜGER, R. SCHNEIDER
90
2. STRUCTURE AND APPLICATION
Fig. 2 serves as illustration for the assembly of facade plates to aT-shaped aluminium support frame. To put a certain quantity of the adhesive tothe supporting frame, a cartridge with a V-shaped nozzle (Fig. 3) is used for theapplication. The fresh adhesive is a non-sagging paste. Attaching the facadepanel, the V-shaped nozzle is distorted to a joint of b = 12 mm width andt = 3 mm thickness.
The double-side adhesive mounting tape consisting of polyethylene-foam(see Fig. 1) acts as a spacer to adjust the joint thickness. Additionally the tape isresponsible to hold the plate until the adhesive has cured completely.
Fig. 2. Assembly of the facade plates on a T-shaped support frame
The substrate surfaces have always to be treated. Dust, dirt, surfaceoxidation, drawing grease and depositions from transportation and storing haveto be removed. By grinding and cleaning with special Sika products clean, dryand grease-free surfaces are created. Afterwards a primer has to be applied. Thetreatment is specified in detail and serves for a good adhesion of the adhesive tothe support frame and the back-side of the facade plate.
103
128
8012

An elastic adhesion system for structural bonding of facade panels
Otto-Graf-Journal Vol. 10, 199991
3. CHEMICAL REACTION SCHEME DURING ADHESIVECURING
The adhesive is a one-component product based on polyurethane.Reacting with the air humidity it turns into an elastic adhesive. The chemicalreaction takes place in two steps.
In a first step the isocyanate group reacts with water and turns into acarbamin-acid. This compound is not - stable and decays to an amin with therelease of CO2.
R−N=C=O + H−O−H [R−NH−CO−O−H] R−NH2 + CO2
Isocyanate-group carbamin- acid amin
In the second step the amin reacts with an isocyanate-group; twoprepolymeres molecules are connected.
aminR−N=C=O + R−NH2 R−NH−CO−NH−RIsocyanate-group urea-group
Additional cross-links are formed by the reaction of further isocyanate-groups with urea-groups. The biurethane structure is produced.
N−CO−NH−R
O=C−NH N−CO−HH−R
O=C−NH

G. KRÜGER, R. SCHNEIDER
92
The reaction velocity and the curing time depend on the temperature andthe air humidity. At T = +23°C and RF = 50 % skinning of the adhesive surfacestarts after an assembly open time of 20 minutes. From the surface the curingreaction continues into adhesive volume.
The optimum temperature range for adhesive hardening is between +5°Cand +35°C. The relative humidity should be below RF = 75 %. Under theseconditions a adhesive joint of 12 mm width and 3 mm thickness has curedcompletely within 24 h.
4. TEST RESULTS
The following Table 1 gives an overview of the most importantmechanical properties of the structural adhesive determined according toGerman, European or international standards.
Table 1. Adhesive properties
density ISO 1183, method A 2,05 g/cm3
shrinkage ISO 10563 -8,47 % (mass)
-7,93 % (volume)
tensile strength,
elongation at break
DIN EN 28 339 2,48 N/mm2
350 %
tensile shear strength,
elongation at break
DIN 53 283 2,52 N/mm2
540 %
shore A hardness DIN 53 505 55
elastic recovery EN 27 389 92 %
In addition the mechanical properties of the structural adhesive werestudied using test samples with a joint cross-section b x t (see Fig. 2) accordingto realistic facade application. Stresses and strains in tension and shear werecalculated on the basis of the measured displacements and forces and these

An elastic adhesion system for structural bonding of facade panels
Otto-Graf-Journal Vol. 10, 199993
nominal geometric dimensions. To obtain a defined adhesive curing and ageing,all test samples were conditioned for 2 weeks at a temperature T = 23°C and ahumidity RF = 50 %, followed by further 3 weeks according to DIN EN 28 339,method B.
0,0
0,5
1,0
1,5
2,0
2,5
3,0
0 1 2 3 4 5 6 7shear [-]
shea
r str
ess
[N/m
m2 ]
design shear stress τdesign = 0,15 N/mm2
design sheardisplacement sdesign = 1mm
failure
Fig. 3. Shear test
Fig. 3 shows a typical stress strain curve observed in a shear test with thesamples described above. The type of failure was cohesive at stresses of about2,7 N/mm2. The design stress and displacement for practical applications waslimited by the approval to 0,15 N/mm2 and 1 mm, respectively.
The mechanical property of the structural adhesive subjected to steadyloads at room temperature (T = +20°C) and at T = +60°C is shown in Fig. 5.The shear force applied was 0.018 N/mm2, coming up to about three times theself-weight of the facade plate in the example showed below.

G. KRÜGER, R. SCHNEIDER
94
The elastic shear displacement that recovers after stress removal, isoverlied by an irreversible creep. At the end of the test after about 3 weeks themeasured creep velocity was about 0.01 mm/week. With additional temperatureloading a reduction of the shear stiffness and an increasing tendency to creepwas observed.
0,00
0,05
0,10
0,15
0,20
0,25
0,30
0,35
0 200 400 600 800 1000 1200time [h]
shea
r dis
plac
emen
t [m
m] T = +60°C
T = + + + +20°C
Fig. 4. Fatigue stress test at temperatures T = +20°C and T= +60°C
0,0
0,5
1,0
1,5
2,0
2,5
3,0
3,5
4,0
4,5
0 1 2 3 4strain [-]
tens
ion
stre
ss [N
/mm
2 ]
crack formation and growth cracks
linear range
T = +23°C
T = +80°C
T = − − − −20°C
tension design stress σmax = 0.2N/mm2
failure
Fig. 5. Results of tensile tests at temperatures T = -20°C , T = +23°C and T= +80°C

An elastic adhesion system for structural bonding of facade panels
Otto-Graf-Journal Vol. 10, 199995
Exemplary Fig. 5 shows the property of the adhesive joint subjected touniaxial tension at different temperatures. At T = -20°C and T = +23°C a typicalan initial linear increase of the strain with the external stress is observed. Withinthis linear range the stiffness is mainly determined by an elastic reversibledeformation.
With increasing load due to constriction a stress concentration is formedat the joint edges that finally leads to the formation of cracks. From there theslope of the stress-strain-curve is determined by the resistance of the adhesivejoint to crack propagation. This load level can not be used for practicalapplication. However, the high resistance to tearing inheres safety againstexcessive local stress. With increasing temperature softening of the adhesive inconjunction with a decrease of the tension strength and the elongation isobserved.
The test program also contained the prove of the application. Further testswith conditioned samples aimed to determine the resistance of the adhesiveitself and the adhesion to different environmental conditions. A survey to thetest program gives Table 2.
The adhesion system showed a non-critical behaviour with respect to theapplication instructions and the resistance to different environmental influences.The failure was predominantly cohesive in the adhesive joint. Occasionallyobserved gas inclusions are caused by poor conditions during the adhesivecuring. Some of the HPL-plates tested failed after long-time immersion inwater, since the adhesion was stronger than the internal strength of the testsamples. In some test partially adhesive failure was observed between theadhesive and the primer or the primer and substrates.
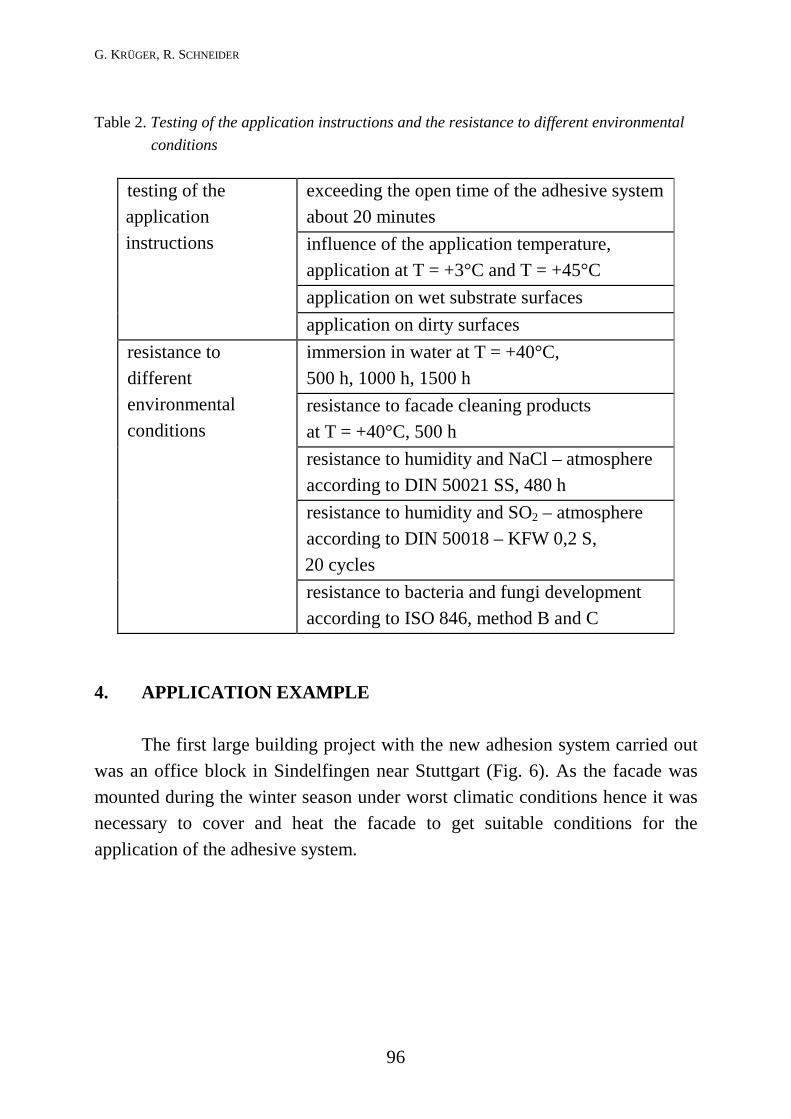
G. KRÜGER, R. SCHNEIDER
96
Table 2. Testing of the application instructions and the resistance to different environmentalconditions
exceeding the open time of the adhesive systemabout 20 minutesinfluence of the application temperature,application at T = +3°C and T = +45°Capplication on wet substrate surfaces
testing of theapplicationinstructions
application on dirty surfacesimmersion in water at T = +40°C,500 h, 1000 h, 1500 hresistance to facade cleaning productsat T = +40°C, 500 hresistance to humidity and NaCl – atmosphereaccording to DIN 50021 SS, 480 hresistance to humidity and SO2 – atmosphereaccording to DIN 50018 – KFW 0,2 S,20 cycles
resistance todifferentenvironmentalconditions
resistance to bacteria and fungi developmentaccording to ISO 846, method B and C
4. APPLICATION EXAMPLE
The first large building project with the new adhesion system carried outwas an office block in Sindelfingen near Stuttgart (Fig. 6). As the facade wasmounted during the winter season under worst climatic conditions hence it wasnecessary to cover and heat the facade to get suitable conditions for theapplication of the adhesive system.

An elastic adhesion system for structural bonding of facade panels
Otto-Graf-Journal Vol. 10, 199997
Fig. 6. Office block with bonded facade
The building project has a facade area of about 1400 m². The height ofthe building is more than 20 m. The MEGACERAM facade panels used have6,5 mm thickness and the dimensions length x width = 1,30 m x 0,50 m.
Fig.7 Horizontal cut of the facade

G. KRÜGER, R. SCHNEIDER
98
Fig. 7 shows a horizontal cut of the facade. The aluminium-support frameconsists of T-shaped support frames. L-shaped support frames are located in themid-span of the panels as well as at the corner and boundary lines. They arearranged vertically to provide for a good ventilation and to prevent water fromcollecting in the vicinity of the structural adhesive.
5. CONCLUSION AND OUTLOOK
The Sika-Tack-Panel adhesion system reached the first approval inGermany for structural bonding of facade panels without an additionalmechanical safety device. An extensive test program was carried out to get theapproval. The aim was to determine the mechanical properties of the structuraladhesive under different load conditions, the resistance environmentalinfluences and the safety due to the application of the adhesive system. Thedesign values were determined on the basis of the test results.
The adhesive system is subjected to a quality control of the manufacturerand the supervision by the FMPA. Moreover, only qualified staff is allowed forthe application. Already a couple of companies have been certified. Thisguarantees the quality of the product as well as the application of the systemrequired.
The admission of further types of facade panels to the approval is inmind. In the future, engineers and architects can dispose of the whole range offacade plates, that can be mounted with the adhesion system. Some furtherbuilding projects have been carried out or are in the planning stage and provethat the advantages of the adhesive system have been already recognised.
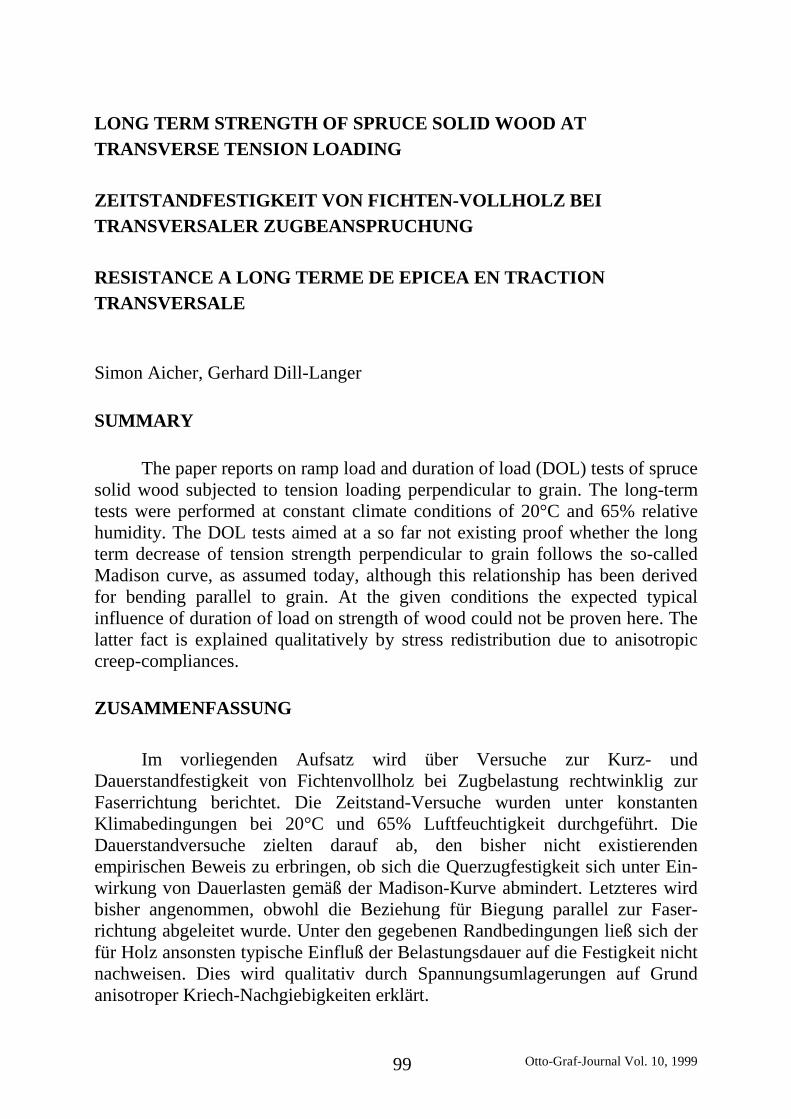
Otto-Graf-Journal Vol. 10, 199999
LONG TERM STRENGTH OF SPRUCE SOLID WOOD ATTRANSVERSE TENSION LOADING
ZEITSTANDFESTIGKEIT VON FICHTEN-VOLLHOLZ BEITRANSVERSALER ZUGBEANSPRUCHUNG
RESISTANCE A LONG TERME DE EPICEA EN TRACTIONTRANSVERSALE
Simon Aicher, Gerhard Dill-Langer
SUMMARY
The paper reports on ramp load and duration of load (DOL) tests of sprucesolid wood subjected to tension loading perpendicular to grain. The long-termtests were performed at constant climate conditions of 20°C and 65% relativehumidity. The DOL tests aimed at a so far not existing proof whether the longterm decrease of tension strength perpendicular to grain follows the so-calledMadison curve, as assumed today, although this relationship has been derivedfor bending parallel to grain. At the given conditions the expected typicalinfluence of duration of load on strength of wood could not be proven here. Thelatter fact is explained qualitatively by stress redistribution due to anisotropiccreep-compliances.
ZUSAMMENFASSUNG
Im vorliegenden Aufsatz wird über Versuche zur Kurz- undDauerstandfestigkeit von Fichtenvollholz bei Zugbelastung rechtwinklig zurFaserrichtung berichtet. Die Zeitstand-Versuche wurden unter konstantenKlimabedingungen bei 20°C und 65% Luftfeuchtigkeit durchgeführt. DieDauerstandversuche zielten darauf ab, den bisher nicht existierendenempirischen Beweis zu erbringen, ob sich die Querzugfestigkeit sich unter Ein-wirkung von Dauerlasten gemäß der Madison-Kurve abmindert. Letzteres wirdbisher angenommen, obwohl die Beziehung für Biegung parallel zur Faser-richtung abgeleitet wurde. Unter den gegebenen Randbedingungen ließ sich derfür Holz ansonsten typische Einfluß der Belastungsdauer auf die Festigkeit nichtnachweisen. Dies wird qualitativ durch Spannungsumlagerungen auf Grundanisotroper Kriech-Nachgiebigkeiten erklärt.

S. AICHER, G. DILL-LANGER
100
RESUME
Cet article rapporte des essais sur la resistance à court et long terme del’épicea en traction perpendiculaire. Les essais a long terme ont été conduitssous un environment maintenu constant de 20°C et 65% d'humidité relative. Lesessais à long terme avaient pour but de montrer que la resistance en tractionperpendiculaire décroissait sous la charge selon la relation connue sous le nomde ‘Courbe de Madison’. Cette relation empirique communément admiseaujourdhui, a été établie à partir d'essais en flexion parallele au fil. Dans lesconditions réalisées, l’effet attendu de la durée de charge n’a pas été observé.Une explication qualitative est proposée basée sur l'hypothèse d'uneredistribution des contraintes due à l'anisotropie de fluage du materiau.
KEYWORDS: Long term strength, tension perpendicular to grain, spruce solidwood, effect of anisotropic creep
1. INTRODUCTION
The duration of load effect of wood comprising the combined effects ofaccumulated time of loading, load level and climate conditions on strength isone of the most important characteristics of the material wood.
Since the first systematic investigations [Wood, 1947] resulting in todaysDOL master curve, the so-called Madison relationship, numerous investigationswith clear wood and structural lumber were performed. Milestones were i. a.laid by [Barrett et al., 1978; Madsen, 1992; Morlier et al., 1998].
The question may be posed whether the duration of load effect is anintrinsic material property of structural timber irrespective of mode of loading.A simple answer is given in Eurocode 5: Design of timber structures, saying‘yes’. Looking deeper into the problem and bearing in mind the anisotropicconstitutive law, it might be supposed that there are differences in loadingmodes parallel and perpendicular to fibre direction. In case of the latter load-grain configuration the globally cylindrical material law, dependant on size andsawing pattern, induces a highly inhomogeneous stress and strain state even inuniaxial tension tests.

Long term strength of spruce solid wood at transverse tension loading
Otto-Graf-Journal Vol. 10, 1999101
This paper presents the results of an extensive investigation on the DOLeffect in transverse tension loading of spruce solid wood at constant climateconditions performed in the frame of a European research project. It is revealedthat the Madison curve does not apply to the specifically regarded configuration.
2. MATERIAL
The investigated material was spruce (picea abies) from a single stand inSouthern Sweden. The specimens comprised 25 boards with a cross-section of45×195 mm and lengths between 4000 and 5000 mm. In order to classify thematerial with respect to density and stiffness parallel to grain the boards werecut to 2 m length. For these boards MOE was determined via bending vibration.
The volume and dimensions of the actual test volume within the specimen(see below Fig. 1a, b) were chosen according to European standard [EN 1193]as V = 0.000567 m3 and h = 180 mm, b = 45 mm, l = 70 mm, respectively. Thetest volumes contained no visible defects such as knots and resin pockets, i. e.conformed to so-called clear wood. The material was stored at 20°C, 65% RHuntil ramp-load testing respectively start of DOL tests.
In order to obtain well matched test samples for ramp-load tests(n = 45 specimens) and the long term tests in three different climates (each with15 specimens)1 the entity of all test volumes was split into six MOE-classes.Each MOE class extended over a range of 1 GPa; the MOE means of each classwere 9.5, 10.5, 11.5, 12.5, 13.5 and 14.5 GPa. The respective specimen numbersof the four collectives were determined randomly from the different MOEclasses.
1 here only the results of the tests in constant climate 20°C, 65% RH are presented.

S. AICHER, G. DILL-LANGER
102
3. SPECIMENS
Preliminary tests on tension strength perpendicular to the grain of solidwood were conducted according to [EN 1193] and to more detailed proceduresstated in [Ehlbeck et al., 1994].
Yet, the described load transfer mechanism via intermediate woodenblocks of spruce with grain direction parallel to load direction turned out to berather inapt for the case of solid wood. The vast majority of preliminary testspecimens failed in the glue-line between intermediate blocks and the actual testvolumes, the reason therefore being still too high stiffness differences betweentest volume and adhered load transferring on-gluings.
It was thus necessary to develop an improved specimen with a smallerstiffness difference between intermediate wooden blocks and test volume. Itshould be stated that a sole necking of the spruce volume, suitable for manyother materials, is no solution to the problem due to inhomogenities andstochastic micro-defect distribution. Figures 1 a and b illustrate the realizedspecimen configurations, slightly different for ramp load and DOL tests,consisting of a spruce test volume and two intermediate on-gluings with graindirection perpendicular to load direction. As tension strength of beech indirection perpendicular to the grain is only about two times higher than strengthof spruce, the load transferring beech on-gluings had to be necked. In the case ofshort term tests (Fig. 1a) the beech on-gluings were directly connected to steelgrips and thereby to the test machine. In case of the long term tests (Fig. 1b)additional spruce blocks (on-gluings 2) with grain direction parallel to loaddirection were adhered to the beech on-gluings. The end-grain faces of the on-gluings 2 were adhered to steel plates incorporating centrically a screw holeserving for screwed and hinged fixations to the DOL rig. The steel to woodadhesion was performed by means of a two component Polyurethane adhesive;in order to increase the interface capacity two steel rods were adhered parallel tograin direction and fixed to the steel plates.

Long term strength of spruce solid wood at transverse tension loading
Otto-Graf-Journal Vol. 10, 1999103
Fig. 1a, b. Sketches of developed specimen built ups slightly different for ramp load and long-term testinga) ramp load specimen b) DOL specimen
4. RAMP LOAD TESTS
All 45 ramp load tension tests were performed according to [EN 1193] instroke control at a constant cross-head speed of 0.8 mm / min. The majority offailures (75%) obtained with the special specimen configuration described abovewas located near mid-height (h/2) of the specimens. The rest of the specimensfailed close to or partly in the interface between test volume and on-gluings.Figure 2 shows the results of the ramp-load tests as cumulative frequencydistribution vs. strength perpendicular to grain altogether with a fitted Gaussdistribution. Other fit approximations (lognormal and 3parameter Weibull) givealmost equal fit results. The mean strength (± standard deviation) and thecoefficient of variation were ft, 90 = 2.16 ± 0.393 N/mm2, C.O.V. = 18.1%, Theminimum and maximum values were 0.999 and 2.96 N/mm2.
a
testvolume
on-gluing
(beech)
steelgrips
Ft
b
steel bolts
steelplate
fiberdirection
test volume(spruce)
on-gluing 1(beech)
on-gluing 2(spruce)

S. AICHER, G. DILL-LANGER
104
0
0.2
0.4
0.6
0.8
1
0.5 1 1.5 2 2.5 3Strength perpendicular to grain [MPa]
Cum
ulat
ive
frequ
ency
Ramp-loadtests
Fitted Gaussdistribution
Fig. 2. Cumulative frequency distribution of ramp-load strength perpendicular to grainaltogether with a fitted Gauss distribution.
5. LONG TERM TESTS
5.1 Test set-up and loading regime
The long-term loads were applied via a lever principle and hanging deadloads. Figure 3 shows the realised test set-up in the climate chamber. Theloading regime consisted in a stepwise increase of the applied load with a steplength of 28 days. The applied tension stress of the first step was chosen as1.404 N/mm2 representing a stress level SL of 65% relative to the mean ramp-load strength value. The sucessive equal load increments were set to0.108 N/mm2 representing 5% of ft, 90, ramp resp. 7.7% increases of the first loadlevel.
The initial load was applied via a screw driven load table lowered atconstant speed until the dead load in the bucket at the lever arm end was free ofsupport. For the load increments penny shaped steel shred was poured cautiouslyinto the buckets.

Long term strength of spruce solid wood at transverse tension loading
Otto-Graf-Journal Vol. 10, 1999105
The times to failure of the individual specimens were registered byelectrical switches activated in case of fracture.
Fig. 3. Photograph of realised long-term test set-up in the climate chamber

S. AICHER, G. DILL-LANGER
106
5.2 Results
Table 1 contains a compilation of the most important results of the DOL tests,being long term strength, time to failure from beginning of the test and time tofailure within respective load step. Further, density and MOE of the boardswhere the specimens were cut from are given.
Table 1. Compilation of most important DOL results; further MOEs from bending vibrationtests and individual densities are given.
Specimen Board sequential No. of Long-term time to time to failure Density MOE acc. toNo. No. order of load-step strength failure from from begin bending
failure f t,90 begin of test of load step ρ12 vibration[MPa] [h] [h] [kg/m3] [MPa]
1 1b 1 3 1.62 1349.2 8.1 416 10.82 2a 3 5 1.84 2862.3 174.3 446 13.73 4a 11 9 2.27 5745.7 369.7 476 13.74 8a 2 4 1.73 2610.3 594.3 450 12.05 9b 5 7 2.05 4037.7 12.8 434 10.06 10a 9 8 2.16 4970.0 266.0 480 14.47 11a 13 10 2.38 6081.8 33.8 410 9.88 11b 7 8 2.16 4700.1 20.1 417 11.89 12b 15 11 2.48 7253.7 533.7 492 11.410 18a 14 11 2.48 6779.8 59.8 459 10.811 18a 4 5 1.84 3229.6 541.6 459 10.812 20a 8 8 2.16 4740.7 60.7 476 12.213 20a 10 8 2.16 5320.8 616.8 476 12.214 18a 12 10 2.38 6048.0 4.8 461 10.815 23a 6 7 2.05 4430.5 398.5 478 14.8
Figure 4 visualises the evolution of the failures along the time axis of thestepped loading regime. It can be seen that the first failure occured shortly afterthe beginning of load step 3 with a nominal stress level of 75 %. The 8thspecimen, i.e. the 50% fractile specimen, failed at load step 8 at a nominal stresslevel of 100%. The last failures were observed at nominal stress levels of 115%within 11th load step. Thus the DOL test lasted for almost one year despite ofthe stepped loading regime.

Long term strength of spruce solid wood at transverse tension loading
Otto-Graf-Journal Vol. 10, 1999107
0
0.2
0.4
0.6
0.8
1
1.2
-500 1500 3500 5500 7500Time [h]
Nom
inal
stre
ss le
vel S
L
0
Failures of DOL tests
load step No. 1load step No. 1
load step No. 8
load step No. 11
Fig. 4. Times to failure along load history with increased stepped nominal stress levels
The DOL stress level of 100% of the median specimen (50% fractile)forwards the non expected result being that no strength reduction is obtained atthe 50% fractile level. In order to find out whether the latter observation holdstrue for the whole range of strength values the strength distributions of rampload and DOL tests were compared. Figure 5 gives the cumulative frequenciesof ramp load and DOL results revealing the nearly perfect coincidence of bothdistributions; only in the upper branch of the distribution some slight decrease ofstrength may be assumed.
In other words almost no DOL effect was observed for solid woodsubjected to transverse tension loading at constant climate conditions of 20°Cand 65% RH.

S. AICHER, G. DILL-LANGER
108
0
0.2
0.4
0.6
0.8
1
0.5 1 1.5 2 2.5 3Strength perpendicular to grain [MPa]
Cum
ulat
ive
frequ
ency
Ramp-loadtests
DOL tests at constant climate conditions
Fig. 5. Cumulative frequency of strength perpendicular to grain in DOL tests at constantclimate conditions of 20°C / 65% RH; also given are the results and the fitteddistribution of the ramp load tests.
The almost lacking DOL effect is most clearly demonstrated in Fig. 6where the ‘ranked’ stress levels are plotted vs. logarithmic time scale. Within theranking procedure the strengths of the DOL specimens are related to ramp loadstrengths of equal cumulative failure frequency what results in a set ofindividual stress levels for all specimens. In detail, the ramp load strength for agiven frequency has to be taken from a fitted strength distribution, here being anormal distribution. In the case of the median of the distribution, the nominalstress level coincides with the individual stress level. Figure 6 additionallyshows the DOL effect normally supposed for clear wood specimens (‘Madisoncurve’) respectively for glulam as experienced in [Aicher et al., 1998]. Thelinear behaviour with a slope of about –6.3 in the semi-logarithmic plot of stresslevel vs. time to failure is supposed to be a typical characteristic of wood andwood based materials. However, solid wood, at least of the used size andspecies, subjected to tension load perpendicular to grain obviously does notexhibit this feature.

Long term strength of spruce solid wood at transverse tension loading
Otto-Graf-Journal Vol. 10, 1999109
0.6
0.7
0.8
0.9
1
1.1
0.01 0.1 1 10 100 1000 10000Time to failure tf within load step [h]
Stre
ss le
vel
sample mean
DOL-data
'Madison curve' SL(tf) = a - 6,3*lg (tf)
Fig. 6. Individual failure stress levels vs. time to failure within failure load steps; additionallygiven is the Madison curve, i .e. the expected DOL behaviour of wood
In this paper the observed unexpected phenomenon will only be explainedby means of qualitative argumentation.
The main mechanism of the effect may be described as a combination ofrelaxation effects with polar anisotropy within the transversal (radial-tangential)plane of wood. Results of recent studies have shown that effective off-axisstiffness is varying considerably in the cross-section of a board due to the so-called shear coupling effect [Aicher et al., 1996; Aicher et al., in press]. Theelastic compliance parallel to load direction is 4 to 5 times higher in the sectionswhere the angle between the annual rings and the load direction is about45 degrees (close to the board edges) as compared to sections where direction ofload and tangential on-axis direction (near board width) coincide. In the lastmentioned paper it is also proven, both numerically and empirically, that in the45°-sections the off-axis Poisson ratios reach values of about 0.9 to 1.
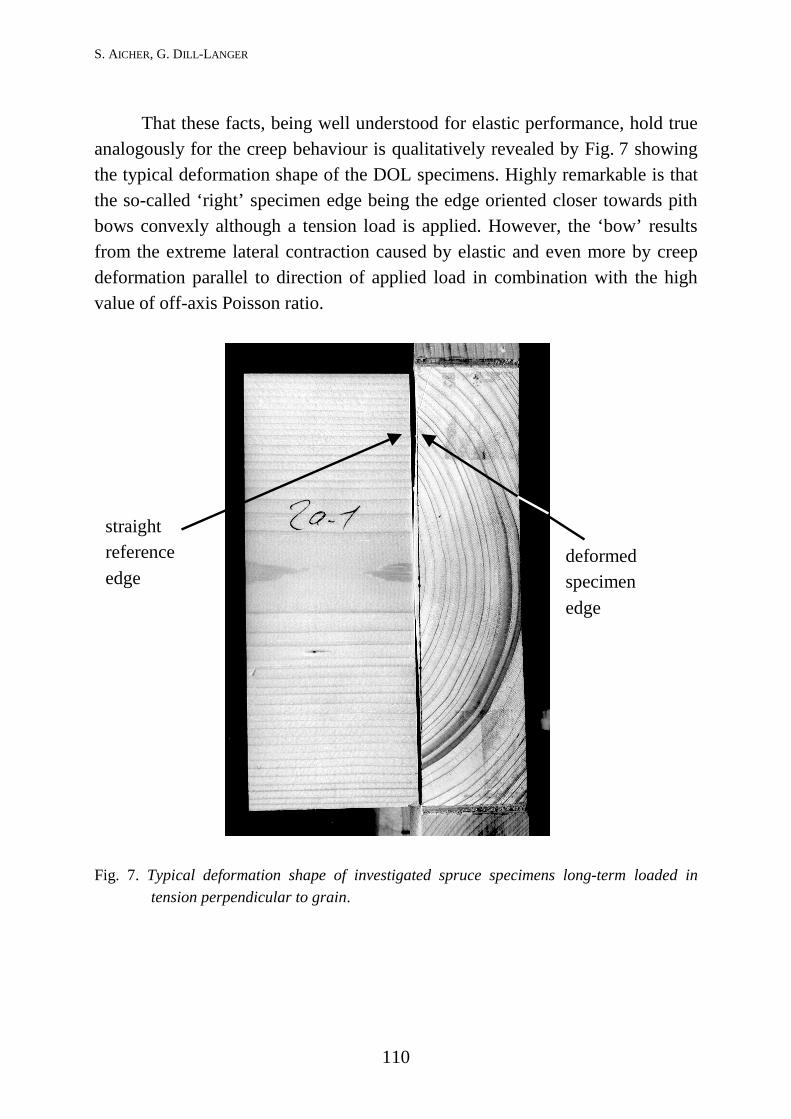
S. AICHER, G. DILL-LANGER
110
That these facts, being well understood for elastic performance, hold trueanalogously for the creep behaviour is qualitatively revealed by Fig. 7 showingthe typical deformation shape of the DOL specimens. Highly remarkable is thatthe so-called ‘right’ specimen edge being the edge oriented closer towards pithbows convexly although a tension load is applied. However, the ‘bow’ resultsfrom the extreme lateral contraction caused by elastic and even more by creepdeformation parallel to direction of applied load in combination with the highvalue of off-axis Poisson ratio.
Fig. 7. Typical deformation shape of investigated spruce specimens long-term loaded intension perpendicular to grain.
deformedspecimenedge
straightreferenceedge

Long term strength of spruce solid wood at transverse tension loading
Otto-Graf-Journal Vol. 10, 1999111
If the observed deformation shapes result from pronouncedly higher creepin the 45°-sections there is a considerable redistribution of stresses within thewhole cross-section leading to a more smooth and thereby less damaging stressdistribution. Thus stress relaxation and redistribution counteract the materialdegradation being responsible for strength loss due to sustained loading. Theresults of the presented work show that both processes seem to be in a balancefor the chosen time scale, specimen volume, species, boundary and climateconditions.
6. CONCLUSIONS
The performed duration of load (DOL) tests with spruce solid woodloaded in tension perpendicular to grain at constant climate conditions of 20°Cand 65% relative humidity forwarded an absolutely unexpected result: almost noduration of load effect was observed compared to a well matched ramp-load testseries. The explanation for this material-specimen behaviour consists in theeffect of cylindrical anisotropy and off-axis loading which results in apronounced stress redistribution within the specimen. The mentioned anisotropyis most pronounced for creep deformations resulting in a remarkable change ofthe rectangular specimen shape.
7. ACKNOWLEDGEMENTS
The financial support of the research by European Community (EU grantAIR2-CT94-1057) and of Deutsche Forschungsgemeinschaft (grant ofsubproject A8 of Sonderforschungsbereich 381) is gratefully acknowledged.Many thanks are indepted to our collegues in the Sonderforschungsbereich andin the finished European project. Special thanks are hence indepted toP. Galimard (LRBB, France), P. J. Gustafsson (Lund University, Sweden),A. Hanhijärvi (VTT, Finland), P. Hoffmeyer (DTU, Denmark), P. Morlier(LRBB, France), A. Ranta-Maunus (VTT, Finland) and G. Valentin (LRBB,France).

S. AICHER, G. DILL-LANGER
112
REFERENCES
AICHER, S.; DILL-LANGER, G.: Influence of cylindrical anisotropy of wood andloading conditions on off-axis stiffness and stresses of a board in tensionperpendicular to the grain. Otto-Graf-Journal, FMPA-Otto-Graf-Institute,Stuttgart, vol. 7, (1996), pp. 216-242
AICHER, S.; DILL-LANGER, G.; RANTA-MAUNUS, A.: Duration of load effect intension perpendicular to the grain in different climates.Holz Roh-Werkstoff 56, (1998), pp. 295-305
AICHER, S.; DILL-LANGER, G.; HÖFFLIN, L.: Effect of cylindrical anisotropy ofwood loaded perpendicular to grain. Journal of Materials in CivilEngineering, accepted for publication
BARRETT J. D.; FOSCHI R. O.: Duration of load and probability of failure inwood. Part I and II: Canadian J. Civil Eng. 5 (4),(1978), pp. 505-532
EHLBECK, J.; KÜRTH, J.: Ermittlung der Querzugfestigkeit von Voll- undBrettschichtholz; Entwicklung eines Prüfverfahrens.Versuchsanstalt für Stahl,Holz und Steine, Abteilung Holzbau, Universität Karlsruhe, (1994)
EN 1193: Timber structures; structural and glued laminated timber;Determination of additional physical and mechanical properties
MADSEN, B.: Structural behaviour of timber. Timber Engineering Ltd., NorthVancouver, B. C., Canada, (1992)
MORLIER, P., RANTA-MAUNUS, A.: DOL effect of different sized timber beams.Holz Roh- Werkstoff 56, (1998), pp. 279-284
WOOD, L. W.: Behaviour of wood under continued loading. Eng. News-Record,139(24), (1947), pp. 108-111

Otto-Graf-Journal Vol. 10, 1999113
DETERMINATION OF CONCRETE PORE STRUCTUREPARAMETERS FROM PENETRATION TESTS WITH N-DECANE
BESTIMMUNG VON PORENSTRUKTURPARAMETERN VON BETONANHAND DES EINDRINGVERHALTENS VON N-DECAN
DETERMINATION DE PARAMETRES DE LA STRUCTURE POREUSEDES BETONS SUR LA BASE DE LA PENETRATION DE DECANE
Arno Pfingstner
SUMMARY
With the measured values of suction and infiltration tests with n-decane,which does not chemically react with hardened cement paste, the poreparameters corresponding to two cylinder capillary models were calculated fordifferent concrete mixtures. With these experimental results, the same modelscan be used to predict the penetration behaviour of other liquids which do notreact with concrete.
ZUSAMMENFASSUNG
Mit den Meßwerten von Saug- und Infiltrationsversuchen mit n-Decan,das mit Zementstein nicht chemisch reagiert, wurden die Porenparameter vonBetonen unterschiedlicher Rezeptur nach zwei Zylinderkapillaren-Modellenberechnet. Diese experimentellen Werte ermöglichen es, mit den gleichenModellen Erwartungswerte für das Eindringverhalten anderer Flüssigkeiten, diemit dem Beton nicht reagieren, zu berechnen.
RESUME
Avec les résultats d'essais d'absorption capillaire et d'infiltration dedécane, fluide ne réagissant pas chimiquement avec la pâte de ciment durcie, lesparamètres de la structure poreuse de différents bétons ont été calculés selondeux modèles basés sur des capillaires cylindriques. Ces valeurs expérimentales

A. PFINGSTNER
114
permettent de prédire, à l'aide de ces mêmes modèles, la pénétration d'autresliquides ne réagissant également pas avec le béton.
KEYWORDS: fluid transport, capillary suction, infiltration, capillary model
1 INTRODUCTION
Liquids which do not chemically react with concrete, penetrate into theseaccording to the t1/2 law. The penetration behaviour can described with cylindercapillary models with a single pore radius or with distributed pore radii[Sosoro, 1995]. The latter comes closer to the actual pore structure. The porestructure of concrete is characterised by parameters which can easily bedetermined experimentally: pore radius r for the simpler, or residual porosity PR,mean pore radius r , and mean square of pore radii r 2 for the second model.With these parameters, a prediction of the penetration behaviour of a liquid,whose surface tension σ and dynamic viscosity η are known, is possible. Thepenetration behaviour of water deviates strongly from the t1/2 law, because waterreacts chemically with the hardened cement paste matrix of concrete.
The pore structure of concretes of different compositions should becharacterised by means of simple tests. From the results of measurements ofsuction tests (i. e. fluid absorption by capillary suction) and infiltration tests(i.e. with an additional external hydraulic pressure) with n-decane, whichdoesn't react with the hardened cement paste, the essential parameters of poreradius distribution were calculated: pore radius r or mean pore radius r andmean square of pore radii r 2 . The residual porosity PR was determined fromabsolute and bulk densities.

Determination of concrete pore structure parameters from penetration tests with n-decane
Otto-Graf-Journal Vol. 10, 1999115
2 METHODOLOGY
2.1 Testing program and experimental setupConcrete
The examined concretes differed by the quantities and types of cementused, the maximum aggregate size, the grading curve, the addition of silicafume and the water-cement ratio or water-binder ratio (Table 1).
Following cements were used: Portland cements CEM I 32.5 R andCEM I 42.5 R (Schwenk, Allmendingen) and blast-furnace cementCEM IIIB 32.5 NW/HS (Schwenk, Karlsruhe). The additives were fromWoermann (Darmstadt): the 50% silica slurry "ELKEM MIKROSILICA (SF)",retarder LENTAN VZ 31 (VZ), and plasticiser WOERMENT FM 30 (FM). Theaggregates were dried Rhine gravel and sand (Table 1).
The concretes were produced in a forced action mixer with a capacity of150 litres according to the following mixing sequence:
- slight moistening of mixer drum- short dry mixing of aggregates- addition of approx. 50% of additional water, mixing for approx. 30 s- addition of silica slurry, mixing for approx. 60 s- adding of cement, mixing for approx. 60 s- pouring in of remaining water during mixing- after 1 min: admixture of plasticiser and retarder- after 3 min: addition of plasticiser if needed to achieve required workability
The mixing time after adding the rest of the additional water was limitedto a maximum of 5 minutes. Concretes without silica fume or additives wereproduced without the corresponding steps of the mixing sequence. Thecharacteristics of fresh concretes are shown in Table 2.

A. PFINGSTNER
116
Table 1. Composition of concretesConcr. Aggregates Grading Cement Type Wadded Si (solid) Re Pl Wtot./(C+Si)
[kg/m3] [kg/m3] of cement [kg/m3] [kg/m3] [kg/m3] [kg/m3] -M-Rili 1905 AB 16 320 CEM I 32,5 R 160 0 0 2,50 0,50
M1 1822 AB 16 338 CEM I 32,5 R 186 0 0 0,80 0,55M2 1535 AB 2 467 CEM I 32,5 R 257 0 0 0 0,55M3 1882 AB 32 309 CEM I 32,5 R 170 0 0 0 0,55M4 1895 U 16 309 CEM I 32,5 R 170 0 0 0 0,55M5 1677 C 16 405 CEM I 32,5 R 223 0 0 0,50 0,55M6 1769 AB 16 485 CEM I 42,5 R 150 0 0 9,30 0,32M7 1762 AB 16 465 CEM I 42,5 R 126 20 0 7,00 0,31M8 1755 AB 16 445 CEM I 42,5 R 109 40 2,56 10,80 0,32M9 1748 AB 16 425 CEM I 42,5 R 89 60 2,56 12,00 0,32M10 1441 AB 2 615 CEM I 42,5 R 153 55 3,59 11,08 0,32M11 1813 AB 16 338 CEM III / B 186 0 0 0 0,55M12 1522 AB 2 467 CEM III / B 257 0 0 0 0,55
Si: silica fume Re: retarder Pl: plasticizer C: cement W: water
The composition of concrete MR corresponds to that of the referenceconcrete for liquid-tight concrete described in DAfStb guideline[DAfStb, 1996].
Table 2. Properties of fresh concretes and compressive strength after 28 daysMix PROPERTIES OF FRESH CONCRETE COMPRESSIVE STRENGTH AFTER 28 DAYS
workability1), density of air density of Compressive strengthflow fresh concrete content hard. concr.2) smallest value mean value class[cm] [kg/dm3] [%] [kg/dm3] [N/mm2] [N/mm2]
MR/1 41,8 2,34 1,8 2,35 52,3 53,8 B 45MR/2 44,8 2,33 1,2 2,36 51,5 53,2 B 45M1/1 46,5 - - 2,33 41,8 44,0 B 35M1/2 46,5 2,35 1,5 2,33 45,4 46,2 B 35M2 43,5 2,16 3,6 2,19 41,8 43,1 B 35
M3/1 44,5 2,39 0,9 2,37 42,5 43,6 B 35M3/2 46,5 2,39 0,4 2,35 42,2 43,0 B 35M4 46,5 2,40 0,3 2,38 47,5 49,0 B 35M5 43,8 2,28 1,8 2,18 38,2 38,8 B 25M6 43,0 2,40 1,75 2,39 75,2 77,2 B 65M7 48,3 2,37 1,4 2,41 80,9 84,3 B 75
M8/1 42,0 2,37 1,5 2,40 88,0 90,5 B 85M8/2 44,8 2,37 0,7 2,40 85,1 86,2 B 75M9 44,0 2,38 1,6 2,38 85,4 88,9 B 75M10 44,5 2,22 2,8 2,24 77,2 78,9 B 65
M11/1 47,5 2,36 0,55 2,35 40,9 43,0 B 35M11/2 46,5 2,35 0,45 2,34 45,5 46,0 B 35M12 51,0 2,36 1,4 2,19 33,8 35,6 B 25
1) workability: average diameter of the spread concrete body, determined by the german flow table test2) determimed on the cubes for the measurement of compressive strength
Determination of concrete pore structure parameters from penetration tests with n-decane
Otto-Graf-Journal Vol. 10, 1999117
Production of samples
Up to a maximum aggregate size of 16 mm, cylinders with a diameter of10 cm and a height of approx. 40 cm were cast for the penetration tests, andcubes with 10 cm edge length for the determination of compressive strength.For concrete M 3, due to the maximum aggregate size of 32 mm, cubes withedge lengths of 15 and 20 cm were cast for the determination of compressivestrength and for penetration tests respectively. After 24 h, cylinders and cubeswere stripped from the formwork.
The cubes for the measurement of compressive strength were thenstored in a climatic chamber with 20°C and 95% relative humidity for 6 days,and 20°C/65% r.h. for further 21 days. At the concrete age of 28 days,compressive strength was determined according to [DIN 1048, T.5] andconverted to the compressive strength ßW200 of a cube with 200 mm edge lengthaccording to the DAfStb guideline for high-strength concrete [DAfStb, 1995].The results of compressive strength tests are summarised in Table 2.
The samples for penetration tests were packed hermetically immediatelyafter stripping and stored at 20°C for 6 days. At the concrete age of 7 days, twocylindrical specimens with a height of 15 cm were sawed from each castcylinder. For concrete M3, cores with 10 cm diameter were drilled from the 20-cm cubes and 2.5 cm sawed off each end. All end faces were sawed in orderobtain even surfaces and ensure the same pore structure as inside the sample.
In order to dry concrete without damaging the crystalline structure, thesamples for the penetration tests were dried in an oven at 65°C until constantweight. The residual concrete moisture was determined by the density ofsamples dried at 105°C until constant weight was reached again.

A. PFINGSTNER
118
Preparation of specimens
The lateral surfaces of specimens for capillary suction tests were coatedseveral times with a transparent epoxy resin resistant to the test fluids in orderto prevent lateral evaporation and obtain unidimensional flow.
The samples for infiltration tests (i.e. with additional hydraulic pressure)were produced in accordance with DAfStb guideline [DAfStb, 1996]. Withepoxy resin, glass funnels were glued to the cylinders; afterwards cylinders andthe lower part of the funnels (approx. 3 cm) were coated several times with thesame resin.
Samples for both tests are shown schematically in Fig. 1.
Test fluids
Water and n-decane were used to perform both suction and infiltrationtests on each concrete. The test results for n-decane were used to determine theparameters r (pore radius), respectively r and r 2 (mean pore radius, meansquare of pore radii) of pore structure used in the considered model. Thephysical values governing the examined transport processes, surface tension σand dynamic viscosity η are given in Table 3. The values for cyclohexane arecontained in it too, as a few tests were performed with this fluid (Fig. 2).
Table 3. Physical values of fluids at 20°CFluid Formula Density
ρρρρ[kg/dm3]
Surfacetension
σσσσ[mN/m]
Dynamic viscosity
ηηηη[mN.s/m²]
(σ/ησ/ησ/ησ/η)0,5
[m0,5/s0,5]
Vapour pressure
pD[hPa]
n-decane C10H22 0,73 23,9 0,88 5,21 19water H2O 1,00 72,8 1,00 8,53 23cyclohexane C6H12 0,78 25,2 0,94 5,18 104

Determination of concrete pore structure parameters from penetration tests with n-decane
Otto-Graf-Journal Vol. 10, 1999119
Experimental procedure
For suction tests, specimens were placed into the test fluid. The samplesrested on glass rods to allow free access of the testing fluid to the inflowsurface. The fluid level was approx. 10 mm above the base of the specimen.Penetration occurred by capillary forces acting against gravity.
The experimental setup for infiltration tests described in DAfStbguideline [DAfStb, 1996] was slightly modified. Preliminary tests had proventhat the pressure head of 40 (+/- 5) cm specified there was too small to obtainmeasurable differences to capillary suction tests for high performance concretes.The required external pressure was estimated by calculation from the poreradius distributions of comparable concretes and fixed to 0,2 bar (20 kN/m2) forall infiltration tests. This pressure was produced by a nitrogen bottle connectedto the funnels on the samples by tubes.
100 mm
150
mm
Concrete cylinder
Glas funnel
Connecting tube,
Testing fluid
to nitrogen bottle
N2 - 0,2 bar
100 mm
Concrete cylinder
Epoxy resincoating
appr
ox.
10 m
m
Testing fluid
a) b)
Fig. 1. Experimental setups: a) suction test, b) infiltration test

A. PFINGSTNER
120
According to DAfStb guideline [DAfStb, 1996], the duration ofpenetration tests was fixed to 72 h and fluid absorption was determined byrecording the increase in weight of specimens. Penetration depth was recordedas a function of time, as far as it could be seen from outside through thetransparent epoxy resin coating. At the end of the tests, the specimens were splitand penetration depth was determined on the splitting surfaces.
2.1 Calculations
Capillary model with a single pore radius
In the model with a single, mean pore radius r [Sosoro, 1995], theprogression of penetration depth e as a function of time t is described by theformula:
et r
p ra= ⋅ +�
��
��� ⋅2
4
2σ θη
cos (1)
withe penetration deptht timer mean pore radiusσ surface tension of the fluidη dynamic viscosity of the fluidθ contact angle between fluid and concretepa additional external pressure
The pore radius r for this model can be calculated from test results byresolving the quotient of penetration depths with and without external pressure:
ree
tt p
p
p a
a
a
=�
��
�
�� ⋅ −
�
�
�
��⋅ ⋅
0
2
0 1 2σ θcos (2)
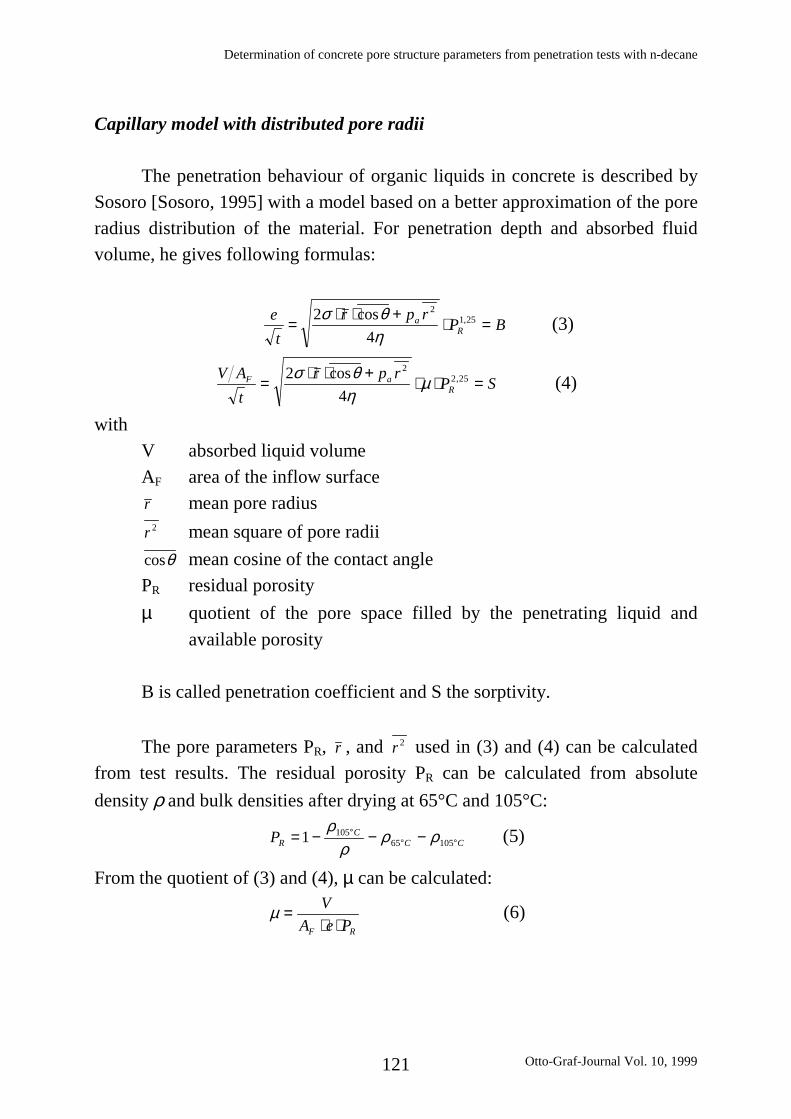
Determination of concrete pore structure parameters from penetration tests with n-decane
Otto-Graf-Journal Vol. 10, 1999121
Capillary model with distributed pore radii
The penetration behaviour of organic liquids in concrete is described bySosoro [Sosoro, 1995] with a model based on a better approximation of the poreradius distribution of the material. For penetration depth and absorbed fluidvolume, he gives following formulas:
et
r p r P BaR=
⋅ ⋅ +⋅ =
24
21 25σ θ
ηcos , (3)
V At
r p r P SF aR=
⋅ ⋅ +⋅ ⋅ =
24
22 25σ θ
ηµcos , (4)
withV absorbed liquid volumeAF area of the inflow surfacer mean pore radiusr 2 mean square of pore radiicosθ mean cosine of the contact anglePR residual porosityµ quotient of the pore space filled by the penetrating liquid and
available porosity
B is called penetration coefficient and S the sorptivity.
The pore parameters PR, r , and r 2 used in (3) and (4) can be calculatedfrom test results. The residual porosity PR can be calculated from absolutedensity ρ and bulk densities after drying at 65°C and 105°C:
CCC
RP °°° −−−= 10565
1051 ρρρ
ρ (5)
From the quotient of (3) and (4), µ can be calculated:
µ =⋅ ⋅V
A e PF R
(6)

A. PFINGSTNER
122
The mean pore radius r can be calculated with (3) or (4) from thepenetration coefficient or from sorptivity:
BP
r SPR Rσ η θ σ η µ θ⋅
�
���
�
��� ⋅ = =
⋅ ⋅
�
���
�
��� ⋅
1 25
2
2 25
22 2
, ,cos cos(7)
The value of the mean square of pore radii r 2 can be calculated from thequotient of penetration coefficients or sorptivities of both infiltration andsuction tests:
BB
rp
rSS
rp
pa
a
pa
a0
22
0
2
1 2 1 2�
��
�
�� −
�
�
�
��⋅ ⋅ ⋅ = =
�
��
�
�� −
�
�
�
��⋅ ⋅ ⋅σ θ σ θcos cos (8)
3 RESULTS
3.1 Test results
The results of suction and infiltration tests are summarised in Table 4, theprogression of fluid volume uptake is plotted in Figs. 3 to 6. The splittingsurfaces of several concretes after the 72-h-suction test with water are shown inFig. 2.
Table 4. Results of penetration tests after 72 hconcrete n-decane water
suction test infiltration test suction test infiltration testt V/AF e t V/AF e t V/AF e t V/AF e
[h] [l/m²] [mm] [h] [l/m²] [mm] [h] [l/m²] [mm] [h] [l/m²] [mm]MR 71,75 6,35 89 72,25 7,91 103 72 5,89 67 72 7,18 86M1 71,75 8,93 103 72,42 11,42 125 72 8,11 75 72 7,63 85M2 72 12,65 120 54,25 14,52 127 72 16,97 132 72,33 18,61 141M3 72 8,49 106 72 9,43 116 72 8,37 98 72,42 9,48 104M4 72 8,54 113 72,25 9,88 129 72 8,98 107 72,25 10,22 117M5 72 11,69 116 74 13,48 131 72,42 12,91 114 72 15,2 131M6 72 5,61 87 74 6,51 95 72 3,89 51 72 3,97 53M7 72 4,68 78 72,17 5,32 85 72,42 2,77 34 72 3,22 36M8 72 3,58 61 72,42 4,01 68 72 1,71 17 72,25 2,73 20M9 72 3,21 63 72 4,02 76 72,42 1,8 17 72 2,01 18
M10 72 5,59 69 73 6,46 76 72,42 3,13 24 72 3,41 24M11 72,25 9,94 115 72 11,59 129 72,25 7,01 56 72 10,88 72M12 72 11,09 101 54,17 16,52 136 72,42 9,68 55 72 10,1 55
t: duration of test V/AF: absorbed fluid volume per unit area e: penetration depth

Determination of concrete pore structure parameters from penetration tests with n-decane
Otto-Graf-Journal Vol. 10, 1999123
The infiltration tests with n-decane on M2 and M12 were aborted shortlyafter 54 hours, since the test liquid would have reached the rear side of thespecimens before the next measurement, which means the tests would havereached permeation, making the test unusable in the sense of theseinvestigations.
Fig. 6. Splitting surfaces of concretes M5, M7 and M9 and mortars M12 and M10:penetration depths of water after the 72-h-suction test
0
2
4
6
8
10
12
14
0 1 2 3 4 5 6 7 8 9
square root of time [h1/2]
abs. volume [l/m²]
MR-SDM1-SDM 2-SDM 3-SDM4-SDM5-SDM6-SDM7-SDM8-SDM9-SDM10-SDM11-SDM12-SDMR-SCM1-SCM8-SCM11-SC
89103
120106113116
8778
616369
11510110298
74115
0 50 100 150Penetration depth [mm]
Fig. 2. 72-h-suction tests with n-decane and cyclohexane: progression of absorption,penetration depths

A. PFINGSTNER
124
Fig. 3. 72-h-infiltration tests with n-decane: progression of absorption, penetration depths
0
2
4
6
8
10
12
14
16
18
0 1 2 3 4 5 6 7 8 9
square root of time [h1/2]
abs. volume [l/m²]
MR-SWM1-SWM2-SWM 3-SWM4-SWM5-SWM6-SWM7-SWM8-SWM9-SWM10-SWM11-SWM12-SW
67
75
132
98
107
114
51
34
17
17
24
56
56
0 50 100 150penetration depth [mm]
Fig. 4. 72-h-suction tests with water: progression of absorption, penetration depths
0
2
4
6
8
10
12
14
16
18
0 1 2 3 4 5 6 7 8 9 10
square root of time [h1/2]
abs. volume [l/m²]
MR-IDM1-IDM2-IDM 3-IDM4-IDM5-IDM6-IDM7-IDM8-IDM9-IDM10-IDM11-IDM12-ID
103125127
116129129
9485
687676
129136
0 50 100 150penetration depth [mm]

Determination of concrete pore structure parameters from penetration tests with n-decane
Otto-Graf-Journal Vol. 10, 1999125
0
2
4
6
8
10
12
14
16
18
20
0 1 2 3 4 5 6 7 8 9
square root of time [h1/2]
abs. volume [l/m²]
MR-IWM1-IWM2-IWM 3-IWM4-IWM5-IWM6-IWM7-IWM8-IWM9-IWM10-IWM11-IWM12-IW
8685
141104
117131
5336
201824
7255
0 50 100 150penetration depth [mm]
Fig. 5. 72-h-infiltration tests with water: progression of absorption, penetration depths
3.2 Results of calculations
The pore parameters calculated from the results of penetration tests withn-decane are given in Table 5. r is the pore parameter of the cylinder capillarymodel with a single pore radius, PR, r , and r 2 are those of the model withdistributed pore radii. 1 and 2/π therein limit the expected value for cosθ .
Table 5. Pore parameters calculated from test results with n-decaneconcrete sorptivity penetr. coeff. gross+pure densities
r SSD SID BSD BID ρ65 ρ105 ρR PR µSD µID rB rB2
[µm] [l/(m².h1/2] [mm/h1/2] [g/cm3] [%] [-] [µm] [m²]MR 0,79 0,50 0,750 0,931 10,5 12,1 2,271 2,257 2,595 11,6 0,613 0,660 0,49 0,61 3,858E-13 3,858E-13M1 1,10 0,70 1,054 1,342 12,2 14,7 2,272 2,263 2,583 11,4 0,758 0,798 0,68 0,85 7,490E-13 7,490E-13M2 1,16 0,74 1,491 1,971 14,1 17,2 2,066 2,049 2,533 17,4 0,606 0,657 0,32 0,40 3,767E-13 3,767E-13M3 0,47 0,30 1,001 1,111 12,5 13,7 2,271 2,266 2,584 11,8 0,681 0,691 0,67 0,84 3,178E-13 3,178E-13M4 0,71 0,45 1,006 1,162 13,3 15,2 2,282 2,273 2,593 11,5 0,660 0,668 0,82 1,02 5,830E-13 5,830E-13M5 0,58 0,37 1,378 1,567 13,7 15,2 2,107 2,096 2,570 17,3 0,582 0,595 0,31 0,38 1,767E-13 1,767E-13M6 0,38 0,24 0,661 0,757 10,3 11,0 2,321 2,306 2,616 10,4 0,622 0,661 0,62 0,77 2,379E-13 2,379E-13M7 0,44 0,28 0,552 0,626 9,2 10,0 2,278 2,311 2,588 14,0 0,428 0,446 0,23 0,29 1,036E-13 1,036E-13M8 0,56 0,36 0,422 0,471 7,2 8,0 2,294 2,284 2,561 9,8 0,596 0,599 0,35 0,43 1,958E-13 1,958E-13M9 1,09 0,69 0,378 0,474 7,4 9,0 2,273 2,260 2,515 8,9 0,573 0,595 0,48 0,59 5,197E-13 5,197E-13
M10 0,47 0,30 0,659 0,756 8,1 8,9 2,121 2,104 2,511 14,5 0,560 0,587 0,17 0,21 7,971E-14 7,971E-14M11 0,63 0,40 1,169 1,366 13,5 15,2 2,265 2,214 2,544 7,9 1,098 1,141 2,15 2,68 1,351E-12 1,351E-12M12 3,37 2,15 1,307 2,245 11,9 18,5 2,087 2,074 2,484 15,1 0,725 0,802 0,32 0,40 1,094E-12 1,094E-12
cos θ = 1 2/ π cos θ = 1 2/ π 1 2/ πindex: SD: suction test with n-decane; ID: Infiltration test with n-decane; B: calculated from the penetration coefficient B
A. PFINGSTNER
126
4 DISCUSSION OF RESULTS
From the curves for n-decane and water it follows that:
- n-decane penetrates in all examined concretes according to the t1/2 law;- the penetration behaviour of water deviates from the t1/2 law;- the deviations from the t1/2 law increase with the pore fineness of concrete
(see Table 5).
The deviation from the t1/2 law is mainly due to the dissolution of calciumhydroxide from pore walls by penetrating water [Sosoro, 1995, 1998]. Thedependence of deviation on the fineness of pore structure can be explained bythe fact that the ratio of the part of the pore cross section in which chemicalreactions occur and the entire pore cross section increases with decreasing poreradii. The undisturbed part of the pore cross section decreases accordingly.Further, the degree of hydration of high strength concrete is lower because ofthe low water/binder ratio of 0,32. Rehydration and wetting expansionprocesses are therefore far more extensive than in normal concrete andsuperimpose the solution processes [Sosoro, 1998].
A prediction of the penetration behaviour of liquids which don't reactwith concrete can be made with the parameters of pore structure (r or PR,r and r 2 ) determined experimentally from suction and infiltration testsperformed with n-decane (or another liquid also not reacting with hardenedcement paste) by placing the values for surface tension σ and dynamicviscosity η in equation (1) or equations (3) and (4). This is confirmed by suctiontests with cyclohexane on MR, M1, M8 and M11. As the σ η -values of n-decane and cyclohexane differ only slightly (Tab.3), equations (1), (3) and (4)predict an almost identical penetration process. The experimental resultsconfirm this forecast: the dashed curves for cyclohexane in Fig. 3 are almostcongruent with the corresponding curves for n-decane.
Determination of concrete pore structure parameters from penetration tests with n-decane
Otto-Graf-Journal Vol. 10, 1999127
REFERENCES
DEUTSCHER AUSSCHUSS FÜR STAHLBETON: DAfStb-Richtlinie für hochfestenBeton. (8/1995), Beuth Verlag, Berlin
DEUTSCHER AUSSCHUSS FÜR STAHLBETON: DAfStb-Richtlinie "Betonbau beimUmgang mit wassergefährdenden Stoffen". (9/1996), Beuth Verlag,Berlin
DIN 1048, T.5: Prüfverfahren für Beton. Festbeton, gesondert hergestellteProbekörper
SOSORO, M.: Modell zur Vorhersage des Eindringverhaltens von organischenFlüssigkeiten in Beton. DAfStb, (1995), H. 446, Beuth Verlag, Berlin
SOSORO, M.: Transport of organic fluids though concrete. Materials andStructures/Matériaux et Constructions, Vol.31, (4/1998), pp 162-169
Otto-Graf-Journal Vol. 10, 1999128
LONG-TERM PERFORMANCE TEST OF ECCENTRICALLYLOADED SANDWICH WALL ELEMENTS WITH WOOD-BASEDSKINS
EIN LANGZEITVERSUCH ZUR GEBRAUCHSTAUGLICHKEITEXZENTRISCH BELASTETER SANDWICH-WANDELEMENTE MITHOLZWERKSTOFFBEPLANKUNGEN
PERFORMANCE A LONG TERME SOUS CHARGE EXCENTREED'ELEMENTS DE MUR SANDWICH AVEC PEAUX A BASE DE BOIS
Simon Aicher, Lilian Höfflin
SUMMARY
The paper reports on background and realisation of a test set-up for along-term full-scale test with wood-based sandwich wall elements. In detail, theinvestigation is intended to study the time dependant superimposed effects ofhighly eccentric axial loading and building practise relevant differential climateconditions at the inner and outer surface of exterior walls. The pronounced sys-tematic eccentricity of the vertical load stems from the use of hangers for thefixation of floor beams.
For a realistic assessment of the mentioned issues a full-scale test cabinwith adjustable interior climate and rather deliberate ratios of vertical loadeccentricities was built-up in sheltered outdoor climate conditions. In future thetest set-up will also serve for investigations on effects of different exterior wallcladdings and related realistic damage scenarios.
ZUSAMMENFASSUNG
Der Aufsatz berichtet über Hintergründe und Realisierung eines Ver-suchsaufbaus für eine Langzeituntersuchung in Bauteilgröße an Sandwich-Wandelementen mit Holzwerkstoffbeplankungen. Im einzelnen sollen imRahmen der Untersuchung die überlagerten, zeitabhängigen Einflüsse einerstark exzentrischen Axialbelastung und baupraktisch relevanter Differenzklima-einwirkungen auf die innere und äußere Oberfläche von Außenwänden studiert

A long-term performance test of eccentrically loaded sandwich wall elements with wood-based skins
Otto-Graf-Journal Vol. 10, 1999129
werden. Die ausgeprägte Ausmittigkeit der Auflast resultiert aus derVerwendung von Balkenschuhen zum Anschluß von Deckenträgern.
Im Hinblick auf eine realistische Beurteilung der genannten Einflüssewurde eine voll-maßstäbliche Testkabine mit einstellbarem Innenklima undweitgehend beliebiger Lastausmittigkeit erstellt. Zukünftig soll der Ver-suchsaufbau auch zur Beurteilung der Auswirkungen unterschiedlicher Außen-wandverkleidungen und diesbezüglich realistischer Beschädigungsszenariosdienen.
RESUME
On décrit les principes et la réalisation d'un système d'essai de longuedurée sur des éléments de mur sandwich à base de bois en vraie grandeur.L'objectif était d'étudier les effets associés de la durée du chargement et del'excentricité de ce chargement correspondant à l'utilisation habituelle enconstruction de ces murs qui sont soumis à un environnement climatiquedifférent sur les surfaces extérieures et intérieures. L'excentricité importante etsystématique des charges verticales provient du système de fixation des poutressupportant le plancher.
Pour un contrôle réaliste des résultats mentionnés, on a construit une pièceen vraie grandeur dans laquelle on peut modifier le climat intérieur ainsi que lesrapports d'excentricité des charges verticales. Cette pièce est construite àl'extérieur mais à l'abri. Plus tard, ce système d'essai servira aussi pour desinvestigations sur différents systèmes d'assemblage du mur extérieur et leurinfluence sur des scénarios d'endommagements.
KEYWORDS: sandwich wall panel, wood-based skins, vertical load eccentricity,beam-column, differential indoor-outdoor climate, creep, moisture deformations

S. AICHER, L. HÖFFLIN
130
1. INTRODUCTION
In German building construction the use of sandwich panels with skinsmade of wood-based materials such as plywood, particleboard or OSB started inthe second half of the eighties. The first and until today sole German generalbuilding approval for an alike sandwich panel to be used for roofs and walls,Z-9.1-315, was issued in 1995. In the past years the constructions according toapproval Z-9.1-315, about 200 houses, have forwarded a very satisfactory fieldexperience.
The use of sandwich elements with wood-based skins as wall elements,especially for exterior walls however not directly exposed to weathering, neces-sitates awareness of the following potential areas of problems, being
– eccentricity of vertical load,– compression and shear creep of skin resp. core materials,– hygroscopicity of wood-based materials,– damage susceptibility of wood-based skins in case of extensive direct liquid
moisture contact.
Unavoidable eccentricities due to imperfections (initial curvature andbuilding site irregularities) are of minor importance in general, neverthelesshave to be considered in design. A considerably more serious issue evolves fromlarge systematic eccentricities induced for instance by the use of hangers. Incase the corresponding eccentricity moments are not counteracted by other con-structive means, the wall is subject to long-term bending moments additional tolong-term compression. This has to be seen in view of the pronounced creep be-haviour of both, wood-based skin and solid foam core materials. The skin mate-rial reveals mechano-sorptive compression creep and the core material showstemperature dependant shear creep under the effect of the bending momentinduced shear stresses (the effect of normal stresses in the core material can beassumed negligible).
Wood-based panels are highly hygroscopic. This results, especially inwinter conditions with fairly high relative humidity of the air, in a moisture
A long-term performance test of eccentrically loaded sandwich wall elements with wood-based skins
Otto-Graf-Journal Vol. 10, 1999131
increase of the exterior skin. Contrary thereto, the moisture content of theinterior skin, facing to the inside of the house, remains roughly constant ordecreases according to specific heating and ventilation parameters. Thesedifferences in moisture evolutions and hereby induced strains result in amoisture driven bow of the wall element convexly to the outside which adds insome way to the bow from the load eccentricity.
Finally, sandwich elements employed for exterior, however systematicallynot directly weathered walls, sometimes provoke critical questions related to theproblems assumed to occur in case of accidental direct liquid water contact ofthe skins. This scenario is bound to damaged facade systems enabling for in-stance water access in case of heavy rain/wind combinations.
The present version of the sandwich building approval Z-9.1-315 takescare of all above mentioned areas of potential problems by conservative pre-scriptions. In the frame of recently started investigations at FMPA – Otto-Graf-Institute – the basis of these prescriptions are studied in more detail as it is in-tended to use hangers for floor systems and a variety of facade systems. As theinteracting effects of load eccentricity, climate deformations and occasionaldirect weathering were regarded too complex to be handled purely theoretically,it was decided that the theoretical considerations should be calibrated/verified bya full-scale experimental test set-up. This paper gives a description of the real-ised test cabin and relevant background informations.
2. DETAILS OF THE SANDWICH BUILT-UP
The regarded sandwich construction consists of panels with a 3layeredsymmetric cross-section (Fig. 1a). The interior core consists of expanded solidpolyurethane foam and the two outer skins are made of particle board. Thethicknesses of the core and of the skins c, tD, are 110 and 16 mm, respectively.The glued connection between core and skins is achieved during the foam ex-pansion process where the expanding self-adhering foam forms a rigid bond tothe skins. The width of the elements is 1250 mm; the standard production lengthof the elements is between 6–9 m, whereof individual element lengths are cut.

S. AICHER, L. HÖFFLIN
132
pressure treated sill
bottom spline
foamsealant particle board
spline
ring shanknail 2.8x63
3040
b)
110 a)
16 16
4050
100
100
1250
particleboard
polyurethanefoam core
top spline
3040
50
150 150
ring shanknail 2.8x63
Fig. 1a, b. Built-up and dimensions of sandwich wall element and respectiveconnection of adjacent elements acc. to building approval Z-9.1-315(presently panel height is restricted to 2,75 m)

A long-term performance test of eccentrically loaded sandwich wall elements with wood-based skins
Otto-Graf-Journal Vol. 10, 1999133
The length of a standard wall element is 2,5–3 m. The final wall element con-tains at the top and bottom edge lumber splines with cross-sections of50 x 110 mm which are fitted into routed grooves and fixed to the skins bynailing at the building site.
At the building site the bottom beam is first bolted altogether with anunderneath pressure treated sill to the foundation; a similar procedure exists forthe wall attachments of the second floor. The lateral connection of adjacentstandard wall elements is performed by means of continuous bottom and topsplines; further, the vertical edges of adjacent elements are joined by means of atongue and groove system as shown in Fig. 1b.
Amongst many specific items regulated in the approval two issues areimportant in conjunction with the presented project. First, the eccentricity e ofthe total vertical force is restricted to a rather small quantity of 1/6 of the panelthickness D what prohibits implicitly in most cases the use of hangers forattachment of floor beams. Second, exterior walls must be covered with aspecially approved heat and moisture retention compound system which isprimarily meant to prevent direct accidental water access to the exterior skin.
3. INVESTIGATED LOADING SITUATION
It was decided to study the effect of pronounced load eccentricity on thetime and climate dependant long term performance of the discussed sandwichconstruction with a very unfavourable, however not unrealistic scenario withrespect to magnitude of loads and eccentricity. The investigated loadingsituation is related somehow to a 1 ½ storey house with a rather small centricvertical load q1 = 2,5 kN/m from the roof and a roughly 5times higher eccentricload q2 = 12 kN/m with an eccentricity of (D/2) + e2, see below, resulting fromthe floor fixation by hangers. The resultant eccentricity e of the vertical forceq = 14,5 kN/m (see Figs. 2a, b)
qM
qq)e/D(qe e=
++
=21
22 2 (1)

S. AICHER, L. HÖFFLIN
134
1 2q = q + q
a) D e 2
q 2
1 q
b) e
D
Fig. 2a, b. Eccentricity definitions of partial and total vertical loads
B+11430
2
b)
B = 60 mmT = 51 mm
302
OSB Performance Plus
a)
9.5TM
LVL Microllam38
58
R
B 7.5 T
57
Fig. 3a, b. Employed I-beams and hangersa) I-beam TJI®/PROTM350, approval Z-9.1-277b) hanger ITT3511.88, approval Z-9.1-302
depends to some extent on the specifically chosen hanger type, definingeccentricity dimension e2. Of course, hanger type and size depend on theemployed I-beam. For the specific load configuration a TJI® floor I-beam oftype TJI®/PROTM350, conforming to general building approval Z-9.1-277,company Trus Joist MacMillan, Boise, USA, was used (Fig. 3a). As suitablehanger for the given beam-load-configuration the hanger type ITT 3511.88according to general building approval Z-9.1-302, company BULLDOG-SIMPSON, Syke, was chosen (Fig. 3b). The permissible vertical load of the

A long-term performance test of eccentrically loaded sandwich wall elements with wood-based skins
Otto-Graf-Journal Vol. 10, 1999135
hanger is 5,4 kN (I-beam without reinforced web: V = 6,08 kN). Assuming thebearing resultant of the I-beam roughly at the center of the hanger shoe weobtain eccentricity e2 =T/2+7,5 mm = 33 mm and hence e = D/1,65 = 86 mmacc. to eq. (1). The stated eccentricity is about 3,6times higher than the presentlyapproved value. The eccentricity ratio, usually considered in beam columnanalysis, is extreme. Employing as core radius s according to sandwichmembrane theory s = Z/A = d/2 = 63 mm (where Z and A are section modulusand area of the skins, d = D - ts: distance of skin centroids, ts = skin thickness)we obtain for the eccentricity ratio ε = e/s = 1,37! The induced eccentricitymoment Me = 1,247 kNm/m represents 62% of the permissible moment. Thecentroid stress of the bending compression skin is
0716204502
,,,t
Mtq
s
e
sC,S =+=+=σ MN/m2
whereas permissible short term skin compression stress is 2,75 MN/m2.
The short term deflection of the posed beam-column situation can beevaluated from solutions given in [Aicher, 1989]. The bow due to uneven cross-sectional moisture distribution is given in [Aicher, 1987]. So, employing creeplimit values for the skin MOE and core shear modulus, and setting plausiblemoisture contents of the skins [Drewes, 1985], the range of the limitdeformations can be assessed. This and a transient analysis of the problem isrevealed in a seperate paper.
4. TEST SET-UP
4.1 Test cabin
The test cabin was built-up in a four-sided widely open test hall of TimberDivision at FMPA – Otto-Graf-Institute –, providing sheltered (no rain access)outdoor climate conditions, which in terms of Eurocode 5: Design of timberstructures, are referred to as service class 2 conditions. Side and top views of thetest cabin are shown in Figs. 4 and 5.

S. AICHER, L. HÖFFLIN
136
The actual test walls 1 and 2, each consisting of two standard panels of1,25 m width and 3 m height are loaded via six equally spaced (a = 0,42 m)single span (� = 2,5 m) I-beams fixed to the test walls by hangers. The sidewalls 3 and 4 (No 3 containing a door) are mounted completely detached fromthe load bearing walls 1 and 2. The roof element serving for climate relevantclosure of the cabin as well as for the transfer of the centrical vertical loads issupported exclusively by the walls 1 and 2.
All spaces between the load bearing and the not loaded walls and thosebetween walls and roof element are completely filled with in-situ foamed polyu-rethane. Further all spaces are covered from the outside by a diffusion tightsealing tape consisting of an interior self-adhering bituminous layer and an alu-minium foil on the outside. In order to reduce heat losses and possible conden-sation, the cabin was provided with a 70 mm thick floor layer made of LVLwhere again all spaces at the periphery were completely filled by in-situ appliedfoam.
The I-beams and hence the hangers were loaded by four dead load assembliesdelivering 14,5 kN each, in such a way that the force of one dead weightassembly was equally distributed on the top chords of 3 I-beams via six points(see Fig.5). Figure 6 shows the one-sided open test cabin after load applicationto the I-beams; Fig. 7 shows a top view – before installment of the roof element– and features the load distribution to the top chords of the I-beams. The roofelement was placed via intermediate teflon sheets on a LVL distance beamnecessary to bridge the height of the dead weight fixation (see Figs. 4 and 7).After the complete insulation work was done, the centrical vertical load,necessary additional to the weight of the roof element, was placed via steelplates at the edges of the roof element at mid-thickness of the wall elements.
Figure 8 shows the completely loaded test cabin revealing the moisture diffusionsealing tapes and the load plates on the upper side of the roof element.
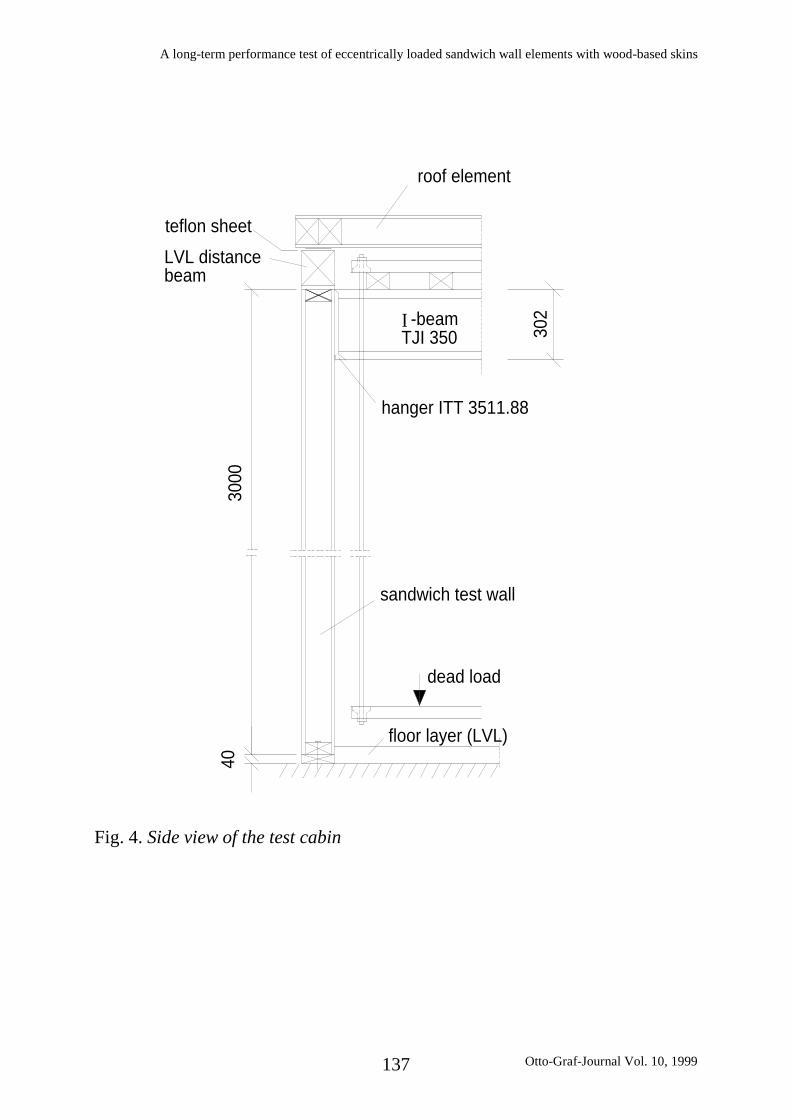
A long-term performance test of eccentrically loaded sandwich wall elements with wood-based skins
Otto-Graf-Journal Vol. 10, 1999137
3000
40
dead load
floor layer (LVL)
sandwich test wall
LVL distancebeam
teflon sheet
hanger ITT 3511.88
-beamTJI 350I 30
2
roof element
Fig. 4. Side view of the test cabin

S. AICHER, L. HÖFFLIN
138
1.45 kN
test wall 2
test wall 1
139 278
2500
door
wall 3
20
208
1250
417417 208
wall 4
Fig. 5. Top view of the test cabin without roof element including loadapplication at the top chords of the I-beams; the roof element is notindicated
4.2 Indoor climate control
The indoor climate target values, equal for winter and summer period werechosen according to the building physics design values in DIN 4108 as 20 °Cand 50 % relative humidity (RH). The constant temperature in autumn, winterand spring time is realised with an electric oven controlled by a temperaturesensor. The chosen system provides a constant temperature of 20 ± 0,3 °C.Before summer season a cooling device will be employed, too. The relative
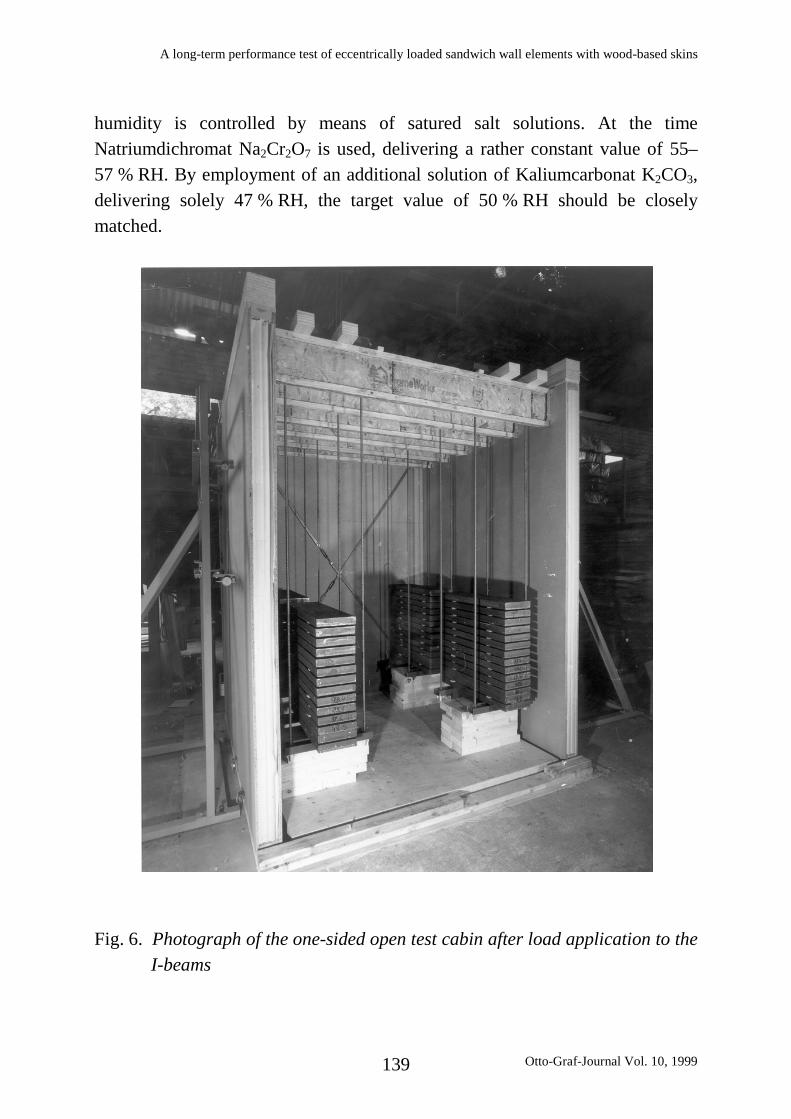
A long-term performance test of eccentrically loaded sandwich wall elements with wood-based skins
Otto-Graf-Journal Vol. 10, 1999139
humidity is controlled by means of satured salt solutions. At the timeNatriumdichromat Na2Cr2O7 is used, delivering a rather constant value of 55–57 % RH. By employment of an additional solution of Kaliumcarbonat K2CO3,delivering solely 47 % RH, the target value of 50 % RH should be closelymatched.
Fig. 6. Photograph of the one-sided open test cabin after load application to theI-beams

S. AICHER, L. HÖFFLIN
140
Fig. 7. Top view of the test cabin before installment of the roof element
4.3 Deformation, climate and moisture recording
The bending deformation of both test walls, each consisting of two panels,are measured at all 4 panels of walls 1 and 2 at two points along mid-width, oneat mid-length and one at quarter length distance from the top end. It was decidedto rely on mechanical dial gauges with visual reading as the tests shall last forsome years throughout possibly very unfavourable climate conditions in winter.The dial gauges are mounted on very stiff frames. Additionally the vertical

A long-term performance test of eccentrically loaded sandwich wall elements with wood-based skins
Otto-Graf-Journal Vol. 10, 1999141
compression deformation of the bottom sill is measured. Figure 8 reveals forwall No 1 the deformation recording set-up.
Temperature and relative humidity of indoor and outdoor climate are reg-istered continuously by capacitive humidity sensors and electrical resistancetemperature sensors with data storage on a PC. Mechanically driventhermographs are installed additionally.
The moisture evolutions of the skin and core materials are monitored in twoways. In order to obtain the average moisture content of the materials smallplates of particle board resp. cubes of solid foam are stored outside and inside ofthe cabin and weighed at regular intervals. In order to obtain insight into theactual moisture content of the wall cross-section subject to a heat and diffusiongradient, two cylindrical bore hole specimens (∅ 100 mm) were drilled out ofthe unloaded wall No 4. The bore hole specimens are carefully cut, along theglued interfaces, into the two skins and the core material; reassembled but noglued and diffusion tight sealed at the cylinder surface, the assembly fits tightinto the original hole; the cleavages at the skin
5. CONCLUDING REMARKS
The first measurment data of deformations at all four loaded elementsreveal that the realised built-up and loading of the test cabin is very symmetric.The initial deflections of the elements conform to expected values. The effect ofcreep and moisture of the recently started tests is qualitatively as anticipated.
Quantitative test and simulation results will be reported in future.
It should be stated that all non-standardised components of the test cabin,i.e. the I-beams, the hangers and the sandwich panels received their respectivegeneral building approval, issued by Deutsches Institut für Bautechnik, Berlin,on the basis of tests and expertises by Timber Division of Otto-Graf-Institute.

S. AICHER, L. HÖFFLIN
142
Fig. 8. Photograph of the completely closed test cabin with diffusion tightsealing tapes along the edges

A long-term performance test of eccentrically loaded sandwich wall elements with wood-based skins
Otto-Graf-Journal Vol. 10, 1999143
REFERENCES
AICHER, S.: Zum Einfluß des Randabschlusses bei Sandwichelementen unterFeuchtigkeits- und Temperaturbeanspruchung. Bauingenieur 62, pp. 263-272,(1987)
AICHER, S.: Berechnung und Bemessung axial gedrückter Sandwich-Wand-scheiben mit Holzwerkstoffbeplankungen. Bautechnik 66, pp. 159–168,(1989)
Z-9.1-315: Allgemeine bauaufsichtliche Zulassung “Sandwichelemente mit Be-plankungen aus Flachpreßplatten und einem Polyurethan-Hartschaumkernals Wand- und Dachbauteile”. Antragsteller: TEK Dach und Wand Bau-elemente GmbH, Klosterfelde
DREWES, H.: Ausgleichsfeuchten von Holzwerkstoffen für das Bauwesen. HolzRoh-Werkstoff 43, pp. 97–163, (1985)
Z-9.1-302: Allgemeine bauaufsichtliche Zulassung “Simpson-HWS-Formteileals Holzverbindungsmittel”. Antragsteller: BULLDOG-SIMPSON GMBH, SYKE
Z-9.1-277: TJI-Balken und -Stiele mit Doppel-T-Profil mit Gurten ausMicrollam® LVL und eingeleimtem Steg aus OSB-Flachpreßplatten. Antrag-steller: Trus Joist MacMillan, Boise, Idaho, USA

144
ULTRASONIC TESTING DEVICE FOR MORTAR
ULTRASCHALLMESSEINRICHTUNG FÜR MÖRTEL
DISPOSITIF DE TEST ULTRASONIQUE POUR MORTIER
Alexander T. Herb, Christian U. Grosse, Hans-W. Reinhardt
SUMMARY
The testing principle of our ultrasonic testing device for mortar is anultrasonic through-transition measurement with the evaluation of wave velocityand transmitted energy with the result of continuous monitoring of the settingand hardening process. Since the signals are recorded continuously in certainintervals, it is possible to observe the behaviour of the material at any time bythe changes in these parameters. This method is not only capable of identifyingdifferent mortar mixes, but also of controlling the effectiveness of concreteadmixtures.
ZUSAMMENFASSUNG
Das Ultraschallmessverfahren basiert auf dem Prinzip der Durchschal-lung. Ausgewertet werden die Ultraschallgeschwindigkeit und die übertrageneEnergie. Anhand der zeitlichen Änderung dieser Parameter kann das Material-verhalten beim Erstarrungs- und Erhärtungsprozeß genau verfolgt werden. DasVerfahren eignet sich nicht nur für die Untersuchung diverser Mörtelmischun-gen. Es kann auch die Wirksamkeit von Betonzusatzmitteln kontrolliert werden.
RESUME
Le test ultrasonique est basé sur la mesure continue des ondes parvenant àla face arrière de l'échantillon et l'évaluation de la vitesse de propagation et del'énergie transmise. La variation de ces paramètres permet de suivre l'évolutionde la prise et du durcissement du matériau. Ce procédé permet non seulementd'analyser différents mortiers, mais également de contrôler l'efficacitéd'adjuvants.
KEYWORDS: ultrasonic, testing device, mortar, setting, hardening, penetration
Ultrasonic testing device for mortar
Otto-Graf-Journal Vol. 10, 1999145
1. INTRODUCTION
Concrete is a construction material based on mineral binders and, formany years, the material is the most frequently used in the world. Its origins goback to cultures even before the roman architects when it was named opuscaementicium [Koch, 1994]. However, the material as applied today has little todo with the one used in the roman empire. In our days, we are talking of highperformance concretes, reaching strength values of steel. We are even capable ofmanufacturing concretes that do not require any compaction energy anymore.
Despite the progress in concrete technology we are using testingtechniques for quality control that were developed decades ago. Everybody istalking about quality management, but in no other engineering field, thetechnologies of materials and testing techniques are so far apart. With currenttesting methods, only some rather subjective parameters like initial and final setcan be determined. A continuous monitoring of the setting and hardeningprocess is not possible.
Scope of the research project presented here is the development of atesting method that is capable of replacing the old standardized methods byproviding reliable parameters for a state assessment of cementitious materials.
In the following paragraphs some standardized methods for testingcementitious materials are shown as well as the physical background of ourtesting device. Measuring results are given and will be discussed.
2. NECESSITY OF TESTING AND PHYSICAL BACKGROUND
Modern concrete technology faces several challenges. First, the designengineer asks for high-strength concrete, high-performance concrete or fibrereinforced concrete. Also the contractors are demanding for highly workableconcrete, self-levelling concrete, slip formed concrete and retarded mixes.

A. T. HERB, C. U. GROSSE, H.-W. REINHARDT
146
Another important point is the availability of less workmanship on theconstruction site. And last but not least, there is increasing quality required fordurable concrete structures in an aggressive environment.
The materials producers have a basket full of admixtures and additionswhich are deemed to affect the fresh or the hardened state of concrete in abeneficial way. The user is sometimes inclined to combine various products inorder to achieve the maximum success. However, not all mixtures lead to theexpected result.
An advanced process technology needs proper control by reliable and - asmuch as possible - objective measurements.
What can be achieved by the actual standard testing methods? Only a fewtechniques are able to give control of the setting and hardening process. TheVicat-needle test [Deutsches Institut für Normung, 1990] is suitable forexamining cement-water mixtures without any aggregates. An other testingprocedure is the penetrometer test [Bunke, 1991]. With the penetrometer it isalso possible to test concrete, i. e. mixtures with aggregates. However, theextracted material being tested is a mortar which is sieved out of a concrete!
With both methods the penetration resistance is measured and as a resultthe setting times (initial and final set) are defined. That means, not the truesetting and hardening properties can be observed with these testing procedures.
Merely the last mentioned method is able to catch a portion of the timedependent process, but only at the very early stage of the hardening process. Anexample of a testing result from such a penetrometer test is shown in Figure 1.
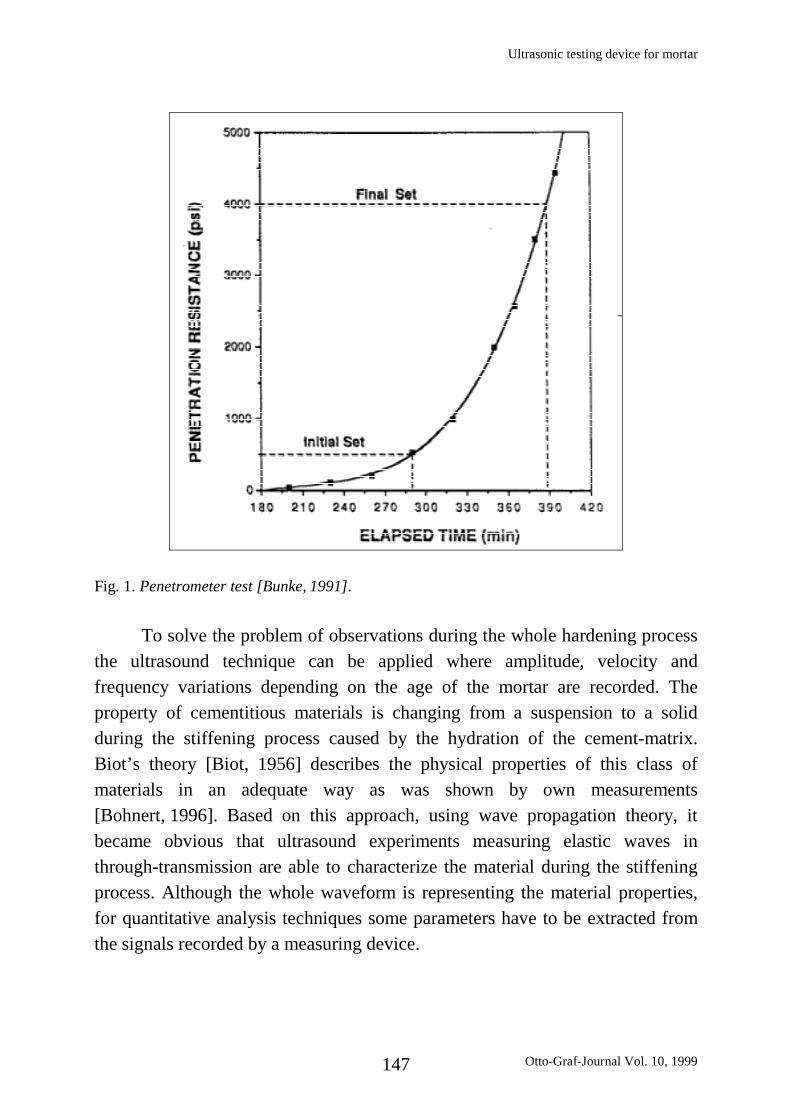
Ultrasonic testing device for mortar
Otto-Graf-Journal Vol. 10, 1999147
Fig. 1. Penetrometer test [Bunke, 1991].
To solve the problem of observations during the whole hardening processthe ultrasound technique can be applied where amplitude, velocity andfrequency variations depending on the age of the mortar are recorded. Theproperty of cementitious materials is changing from a suspension to a solidduring the stiffening process caused by the hydration of the cement-matrix.Biot’s theory [Biot, 1956] describes the physical properties of this class ofmaterials in an adequate way as was shown by own measurements[Bohnert, 1996]. Based on this approach, using wave propagation theory, itbecame obvious that ultrasound experiments measuring elastic waves inthrough-transmission are able to characterize the material during the stiffeningprocess. Although the whole waveform is representing the material properties,for quantitative analysis techniques some parameters have to be extracted fromthe signals recorded by a measuring device.

A. T. HERB, C. U. GROSSE, H.-W. REINHARDT
148
Parameters that are easy to determine are the velocity (from the onset time of thesignals knowing the travel path of the wave), the energy (calculating the integralof the wave amplitudes) and the frequency content (using Fast-Fourier-Transform techniques). One has to keep in mind that there are, of course, alsoseveral other parameters that can be used. Even though one single waveparameter could be sufficient to characterize the material, the reliability of themethod is increased by evaluating more than one.
In the following the application of the method is shown.
3. OPTIMIZATION FOR MORTAR MEASUREMENTS
The ultrasonic testing device freshmor 1 was developed at the Universityof Stuttgart, Institute of Construction Materials. It enables the observation of thesetting and hardening process of mortar by means of ultrasonic through-transmission. Ultrasonic velocity and transmitted energy are the parameters thatare evaluated. The testing device consists of a personal computer with an A-D-conversion card, an ultrasonic generator, a mould with an ultrasonicemitter/transducer pair and cables and connectors. Figure 2 shows the mouldwhich contains the testing material.
Since mortar does not contain aggregates being lager than 4 mm indiameter, the size of the mould could be reduced significantly compared toformer measurements on concrete materials [Reinhardt et al., 1999a]. Theadvantages are a better handling of the mould, especially the cleaning of thePMMA walls, a smaller amount of material lost during the measurement, as wellas less waste causing additional costs. Also the shape of the mould wasredesigned to be more robust for easy handling and fast replacement ofspecimen material. The suppression of interfering waves through the walls of thecontainer and the mounting for piezoelectric transducers with reproduciblecoupling to the tested material have been additional problems to be solved.

Ultrasonic testing device for mortar
Otto-Graf-Journal Vol. 10, 1999149
Fig. 2. Set-up for the mortar experiments showing the mould (rubber foam and PMMA walls)and the transducers.
An emitter-receiver pair of broadband conical transducers were chosenwhich are sensitive in a frequency range of 20 to 300 kHz. The conical shape ofthe transducers enables the possibility of point-to-point measurements.
The signals measured during the stiffening process are recorded by anA/D-conversion device consisting of a fast A/D transientrecorder PC cardcontrolled by an IBM compatible PC. On the emitting side, the signals areproduced by an US generator via the conical transducer in time intervals definedby the user.
Apart from the hardware, a lot of effort was made to bring the software ina user-friendly laboratory-suited state. The software consists of three partsincluding the control and monitor software used during the data acquisition, theextraction of wave parameters used for the material characterization and the dataanalysis software.
The patent specification [Reinhardt et al., 1999b] contains a more detaileddescription of the ultrasonic testing device freshmor 1.

A. T. HERB, C. U. GROSSE, H.-W. REINHARDT
150
4. EVALUATION OF THE US SIGNALS
To determine automatically the onset times of the compressional waves andtherefore the velocities with highest reliability, a special picking algorithm mustbe used. Well-known algorithms using the crossover of signals above a giventhreshold are not applicable in this case, because, for the given data, they weretested with high error rates in relation to the onset times. We have developed asoftware called FreshCon which uses a combined energy-frequency approachsolving this problem. The algorithm was extensively tested in numerousapplications and gives reasonable results even if the signal-to-noise ratio is low.An example is shown in Figure 3. A description of the software can be found in[Grosse et al., 1999].
Fig. 3. Example of an unfiltered US signal in FreshCon using the semiautomatic pickingmode.

Ultrasonic testing device for mortar
Otto-Graf-Journal Vol. 10, 1999151
For the final data analysis a commercially available software tool is used,which was considerably modified with import filters, templates, and macros. Inthis program the calculated compressional wave velocity and the transmittedenergy, both depending on the age of mortar, are plotted to get a suitablepresentation of the measurement results.
5. RESULTS FROM DIFFERENT MORTAR MIXTURES
Exemplary, the results of two different measurement series are shown inthe following. In the first one there is a mortar observed consisting of cementCEM I 42.5 and standard sand (German “Normsand”) under variation of thewater-cement ratio between 0.50 and 0.60. The second series differs only by thecement grade, namely a CEM I 52.5.
Both the standard sand and the mixing process are according toDIN EN 196-1, including a compaction time of two minutes. During thevibration of approximately 0.7 mm horizontal amplitude, the mould was slowlybe filled – we learned that the devaporation of the material is important forproper and reliable results. Due to the time necessary for compaction andconnection to the US device, the first data can be recorded after approximately10 minutes. Choosing standard settings for these test measurements, therepetitive data acquisition interval was set to 10 minutes.
In the early age of the mortar, the velocity of the US waves, shown in thetwo figures is very low and slowly increasing. After two or three hours thevelocity increases faster. In the later trend of the curves the increment of thevelocity drops again.

A. T. HERB, C. U. GROSSE, H.-W. REINHARDT
152
00:00 04:00 08:00 12:00 16:00 20:00 24:00500
1000
1500
2000
2500
3000
3500
4000
4500
CEM I 42.5; w/c = 0.50 CEM I 42.5; w/c = 0.55 CEM I 42.5; w/c = 0.60
velo
city
[m/s
]
age of the mortar [h]
Fig. 4. Velocity of the US wave depending on the age of a mortar with CEM I 42.5 withvariation of the water-cement ratio.
In both diagrams an effect can be observed depending on the water-cement ratio, i. e. the velocity develops differently. According to the stiffnessand the expected compressive strength, the curves are reaching a different valueof the velocity at a certain time. Having regard to this effect while comparingthe two diagrams, the higher absolute velocity from the curves shown inFigure 5 becomes acceptable, because the overall quality of the cement has aninfluence on the compressive strength of the mortar.
The test results presented should give an impression about the capabilitiesof this technique to investigate and classify a hardening material. Specialmixtures as well as newly designed admixtures are able to be characterized in anew and promising way.

Ultrasonic testing device for mortar
Otto-Graf-Journal Vol. 10, 1999153
00:00 04:00 08:00 12:00 16:00 20:00 24:00500
1000
1500
2000
2500
3000
3500
4000
4500
CEMI 52.5; w/c = 0.50 CEMI 52.5; w/c = 0.55 CEMI 52.5; w/c = 0.60
velo
city
[m/s
]
age of the mortar [h]
Fig. 5. Velocity of the US wave depending on the age of a mortar with CEM I 52.5 withvariation of the water-cement-ratio.
6. CONCLUSIONS AND OUTLOOK
The ultrasonic device presented in this article is able to extractautomatically certain parameters of US waves recorded continuously duringsetting and hardening of cementitious mortars. The resulting curves describe thematerial behaviour and are related closely to the hydration process of the mortar.These curves are linked to the elastic properties and give a comprehensivepicture of the stiffening process in a way that was not accessible before. Futureapplications in industrial laboratories will show what kind of benefits arebrought up by recording the material properties of suspensions duringhardening. Anyway, it is obvious that this technique gives a clearer and moredetailed insight into the material properties than the standard procedures that aremeasuring only one single parameter at a certain age.

A. T. HERB, C. U. GROSSE, H.-W. REINHARDT
154
It is expected that the industrial use of this method will fertilize the furtherimprovement of the technique presented. On the basis of these experiences, theexisting apparatus for concrete investigations will also be improved to enablemeasurements in-situ. It should be concluded that, apart from this, the US devicewill be modified for measurements on different other materials such aspolymers, ceramics or even starch.
7. ACKNOWLEDGEMENT
The presented work is the result of a co-operative research project. Theauthors like to thank Bernd Weiler, Günther Schmidt, Kai Höfler, JochenFischer [1991], Nicole Windisch [1996], Iris Kolb [1997], Jens Bohnert [1996]and Stephanie Köble [1999] for their contributions.
REFERENCES
BIOT, M. A.: Theory of propagation of elastic waves in a fluid saturated poroussolid. Low-frequency range. J. Acoust. Soc. Am. 28 (1956), p. 168-178,Higher-frequency range, pp 179 - 191.
BOHNERT, J.: Untersuchung der Ultraschallwellenausbreitung in Frischbeton.Diplomarbeit, Geophysikalisches Institut der Universität Karlsruhe, (11/1996)
BUNKE, N.: Prüfung von Beton, Empfehlungen und Hinweise als Ergänzung zuDIN 1048. DafStb, Bulletin No. 422, Beuth, Berlin, (1991)
DEUTSCHES INSTITUT FÜR NORMUNG: DIN EN 196 Teil 3: Prüfverfahren fürZement, Bestimmung der Erstarrungszeiten und der Raumbeständigkeit,Deutsche Fassung EN 196-3: 1987, (Vikat-Versuch), Beuth, Berlin, (1990)
FISCHER, J. C.: US-Messungen an Frischbeton. Diplomarbeit, Institut fürWerkstoffe im Bauwesen, Universität Stuttgart, (10/1991)

Ultrasonic testing device for mortar
Otto-Graf-Journal Vol. 10, 1999155
GROSSE, C. U., REINHARDT, H.-W.: Entwicklung eines Algorithmus zurautomatischen Lokalisierung von Schallemissionsquellen. Materialprüfung 41(1999), No. 9, pp 342 - 347.
HERB, A. T.: Frischbeton: Korrelation zwischen Ergebnissen klassischerKonsistenzmessungen und Ultraschall-Verfahren. Diplomarbeit, Institut fürWerkstoffe im Bauwesen, Universität Stuttgart, (10/1996)
KÖBLE, S.: Physikalisch-chemischer Hintergrund des Hydratationsvorgangs vonFrischmörtel im Hinblick auf Ultraschallmessungen. Diplomarbeit, Institutfür Werkstoffe im Bauwesen, Universität Stuttgart, (1999), in print.
KOCH, W.: Baustilkunde. Orbis Verlag, München, (1994), pp 468 - 469.
KOLB, I.: Faserbeton - Einfluß der Faserart und des Fasergehalts auf dieBetoneigenschaften und die Ultraschallmessungen. Diplomarbeit, Institut fürWerkstoffe im Bauwesen, Universität Stuttgart, (3/1997)
REINHARDT, H.-W., GROSSE, C. U., HERB, A. T.: KontinuierlicheUltraschallmessung während des Erstarrens und Erhärtens von Beton alsWerkzeug des Qualitätsmanagements. Deutscher Ausschuss für Stahlbeton,Bulletin No. 490, Beuth, Berlin, (1999a), pp 21 - 64.
REINHARDT, H.-W., GROSSE, C. U., HERB, A. T., WEILER, B., SCHMIDT, G.:Verfahren zur Untersuchung eines erstarrenden und/oder erhärtendenWerkstoffs mittels Ultraschall. Patentschrift, angemeldet unter Nr. 198 56259.4 beim Deutschen Patentamt, München, (1999b)
WINDISCH, N.: Untersuchung der Erhärtung von Beton - Hochfester Beton bzw.Fließbeton - mit Ultraschallwellen. Diplomarbeit, Institut für Werkstoffe imBauwesen, Universität Stuttgart, (09/1996)