Embed Size (px)
Citation preview

3. small Anim. Pract. (1976) 17, 2 19-230.
Some techniques used in clinical investigation of cardiovascular function in the dog
A. L. D E L A U N O I S , A. D E R I C K A N D D . M A T T H E E U W S
J. F. and C. Heymans Institute of Pharmacology, Faculty of Medicine and Department of Small Animal Medicine, Faculty of Veterinary Medicine, State University, Ghent, Belgium
A B S T R A C T
Five methods are described, which have proved to be useful in closed chest experimental and clinical cardiovascular research in small animals.
I N T R O D U C T I O N
Clinical diagnostic methods concerning the condition of the cardiovascular system are generally limited to the determination of the systemic blood pressure, the electrocardiogram and, sometimes, the intracardial pressures; the latter is usually performed together with angiocardiography.
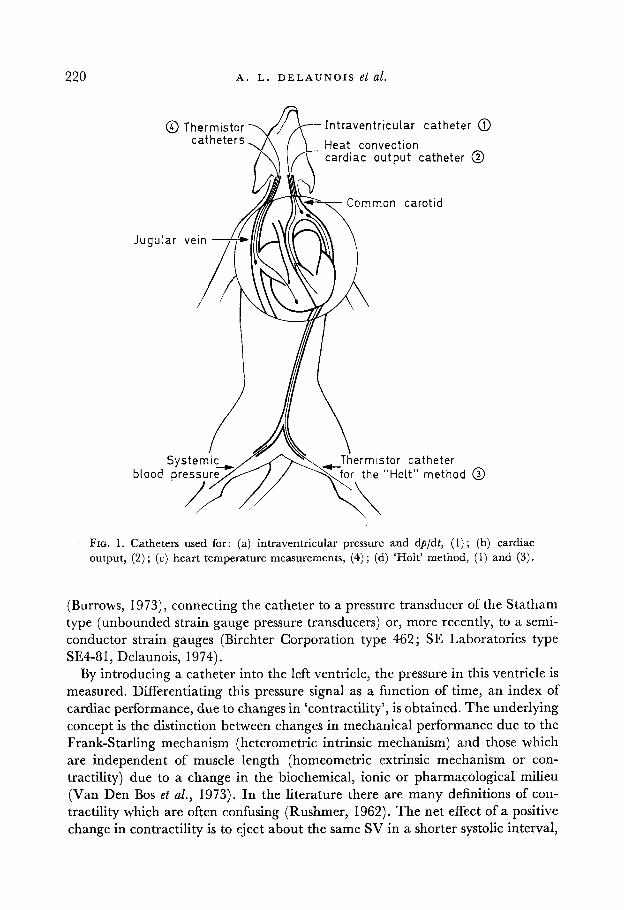
Although the results provide information about the heart condition, they are not sufficient to give a precise insight into the cardiovascular system of the animal. They give no information on cardiac output, peripheral resistance or compliance, pumping action of the heart and efficiency of myocardial contractions. As the authors have been involved in clinical investigation allied to cardiovascular research, they have tried out several known methods and elaborated some new ones for the determination of blood pressure (BP), cardiac output (CO), stroke volume (SV), end-diastolic volume (EDV), end-systolic volume (ESV) and heart efficiency. These parameters were measured continuously on ‘closed-chest’ animals to avoid changes in physiological conditions after opening the thorax and the pericardium (Rushmer, 1970a). Therefore most of the measurements were done by catheter-type transducers and have proved to produce reliable and reproducible results (Fig. 1).
( A ) B L O O D P R E S S U R E A N D M Y O C A R D I A L C O N T R A C T I L I T Y
Blood pressure is generally measured by catheterization of the femoral artery
219
220 A . L . D E L A U N O I S et al.
I n t raven t r i cu la r ca the te r @ Heat convect ion card iac o u t p u t catheter @
Common carot id
istor catheter “Holt” m e t h o d @
’ FIG. 1. Catheters used for: (a) intraventricular pressure and dpldt, ( 1 ) ; (b) cardiac output, (2) ; (c) heart temperature measurements, (4) ; (d) ‘HoIt’ method, (1) and (3).
(Burrows, 1973), connecting the catheter to a pressure transducer of the Statham type (unbounded strain gauge pressure transducers) or, more recently, to a semi- conductor strain gauges (Birchter Corporation type 462; SE Laboratories type SE4-81, Delaunois, 1974).
By introducing a catheter into the left ventricle, the pressure in this ventricle is measured. Differentiating this pressure signal as a function of time, an index of cardiac performance, due to changes in ‘contractility’, is obtained. The underlying concept is the distinction between changes in mechanical performance due to the Frank-Starling mechanism (heterometric intrinsic mechanism) and those which are independent of muscle length (homeometric extrinsic mechanism or con- tractility) due to a change in the biochemical, ionic or pharmacological milieu (Van Den Bos et al., 1973). In the literature there are many definitions of con- tractility which are often confusing (Rushmer, 1962). The net effect of a positive change in contractility is to eject about the same SV in a shorter systolic interval,
@ Thermistor - catheters.
I N V E S T I G A T I O N O F C A R D I O V A S C U L A R F U N C T I O N 22 1
permitting a faster heart rate without a decrease in stroke volume, and thus resulting in an increased CO (Rushmer, 1970b).
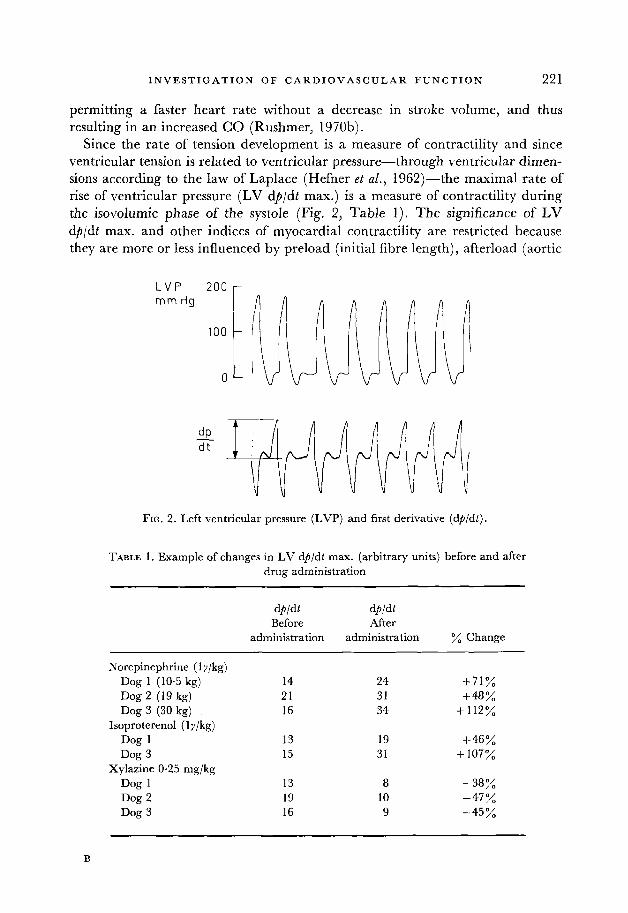
Since the rate of tension development is a measure of contractility and since ventricular tension is related to ventricular pressure-through ventricular dimen- sions according to the law of Laplace (Hefner et al., 1962)-the maximal rate of rise of ventricular pressure (LV dp/dt max.) is a measure of contractility during the isovolumic phase of the systole (Fig. 2, Table 1). The significance of LV dp/dt max. and other indices of myocardial contractility are restricted because they are more or less influenced by preload (initial fibre length), afterload (aortic
L V P 2 0 0 r
FIG. 2 . Left ventricular pressure (LVP) and first derivative (dpldt).
TABLE 1. Example of changes in LV dp/dt max. (arbitrary units) before and after drug administration
dbldt d@/dt Before After
administration administration % Change
Norepinephrine (1 y/kg) Dog 1 (10.5 kg) 14 24 +71% Dog 2 (19 kg) 21 31 +48% Dog 3 (30 kg) 16 34 +112%
Isoproterenol (1 y/kg) Dog 1 13 19 +46% Dog 3 15 31 + 107%
Xylazine 0.25 mg/kg Dog 1 13 8 -38% Dog 2 19 10 -47% Dog 3 16 9 -45%

222 A . L . D E L A U N O I S et at.
blood pressure), heart rate (Wallace, Skinner & Mitchell, 1963 ; Anderson, Manring &Johnson, 1973; Barnes et al., 1973; Van Den Bos et al., 1973; Davidson et al., 1974; Jouannot & Hatt, 1974; Nieuwenhuys et al., 1974) and probably also by the behaviour of the different myocardial muscle layers during the contractions (Rushrner & Thal, 1951 ; unpublished personal findings). Therefore, the LV d$/dt max. index is a directional indicator which ‘should be used only to demonstrate the effect of an intervention in a given animal. There is no evidence that the myocardial contractility of different animals can be compared by measuring such a variable’ (Van Den Bos et al., 1973).
( B ) C A R D I A C O U T P U T , E N D - D I A S T O L I C A N D E N D - S Y S T O L I C V O L U M E
Cardiac output (CO) provides important data when combined with other cardio- vascular parameters. It is common practice to express this value as unit l/min. The writers believe that it would be more convenient to use cm3/sec since CO is often derived from blood velocity (cmisec), multiplied by the section of the aorta (cm2) (Iberall, 1967). The CO, multiplied by the mean BP, gives us some in- formation on the energy released by the heart to the periphery. On the other hand, the BP divided by the CO is a measure of the magnitude of the peripheral resis- tance (dpldv), or compliance (duldp).
(1) Dye- and thermodilution methods The dye-dilution (Stewart, 1897; Wiggers, 1944; Hamilton, 1945) and thermo-
dilution (Fegler, 1957; Fronek & Ganz, 1960) techniques permit only single determinations, while other techniques such as the electromagnetic flowmeter (Katz & Kolin, 1938; Denison, Spencer & Green, 1955) and the thermocon- vection flowmeters (Khalil, 1968; Delaunois, 1973 ; etc.) produce continuous registration.
Injecting a quantity of dye (m) into the right ventricle and determining the concentration gradient (C) in the aorta, a dye-dilution curve can be drawn. The CO is then given by :
m CO = -
JC dz which is in fact, the amount of dye injected (m) divided by the average concen- tration (C) of dye within the time of the measurement t Z - z l (Fig. 3). In the thermodilution method cooled blood or saline is injected instead of a dye solution and the temperature variation is measured by means of thermistors, or thermo- couples, in the aorta. A record similar to that of Fig. 3 is obtained. Since negative calories do not accumulate, frequent determinations are possible while on the other hand, blood withdrawal and concentration determinations are excluded.
(2) Electromagnetic pow meter With the electromagnetic flowmeter, based on electromagnetic induction, con-

I N V E S T I G A T I O N O F C A R D I O V A S C U L A R F U N C T I O N 223
c 12
I
TO TI T2
FIG. 3. Dye-dilution curve (concentration in function of time). The registered curve (1 ) is extrapolated using the Kinsman method (2). The hatched area represents the mean
concentration (c) within the time r 2 -r l .
tinous CO measurements are possible. However, this device is not suitable for clinical purposes since thoracotomy is necessary.
(3) Thermoconvection method In a recent method (Delaunois, 1973) for continuous flow measurements,
electrically generated heat is dissipated by thermal convection into the blood stream through the mediation of a small silver convector, mounted on the tip of a catheter (Fig. 4). Continuous measurement of the temperature of this silver body by means of a thermistor T,, provides information on the blood velocity. Indeed, the heated body having a temperature tH, placed in a blood stream with velocity v and temperature tB will dissipate, mainly by convection, in a time z a quantity of heat H equal to :
H I = C.S.V.P. (tH-tB)z
in which C and p are respectively, the specific heat and the specific mass of blood, and S the exposed surface of the silver body. The heat produced electrically on the probe is given by:
H, = v.1 .E .~
with V the voltage, I the current and E the electrochemical equivalent. At equilibrium HI = H2 and v(tH-tp) = At = cte. Thermistor Thz compensates for gradual body temperature variations. An example of blood velocity registration in the aorta of a dog is shown in Fig. 5 and Table 2. The catheter can be intro- duced into the pulmonary artery or into the aorta, eliminating major trauma.

224 A . L . D E L A U N O I S et al.
Silver. surface S Catheter lemperoture t H
- temperoture tg
Heot dissipation by convection H = C . V s (tH-tg) T s.
FIG. 4. (See text.)
E.T
FIG. 5. Changes in heart rate, arterial blood pressure (BP), blood velocity in the aorta (BV) and temperature difference between superior vena cava and right ventricle (At)
after an intravenous administration of 20y isoproterenol.
I N V E S T I G A T I O N O F C A R D I O V A S C U L A R F U N C T I O N 225
TABLE 2. Example of blood pressure and aortic blood velocity measurements in a dog (18 kg body weight) during increasing doses of norepinephrine (N.E.) before
and after a single dose of ouabain
Systolic blood Aortic blood pressure (mm Hg) velocity (cmjsec)
( y i.v.) administration Change administration Change N.E. before and after % before and after %
10 20 40 80
160 Ouabain
10 20 40 80
(30ylkg)
160-240 160-260 170-200 176-210 176-210
1 76-2 12 180-216 180-2 12 170-280
+ 50 + 63 + 18 + 19 + 19
+ 20 + 20 + 18 + 65
18-29 19-28 19-30 19-29 19-28
13-16 15-19 10-1 9 1 0-2 3
+61 + 47 + 58 + 52 + 45
+ 28 -I- 27 + 90
+ 130
(4) Stroke volume, end-diastolic and end-systolic volume Knowing the CO and heart rate, it is easy to calculate the stroke volume (SV).
Since SV can remain unaltered although end-diastolic volume (EDV) or end- systolic volume (ESV) vary, these two parameters add important data on myo- cardial function (e.g. ejection fraction, cardiac enlargement).
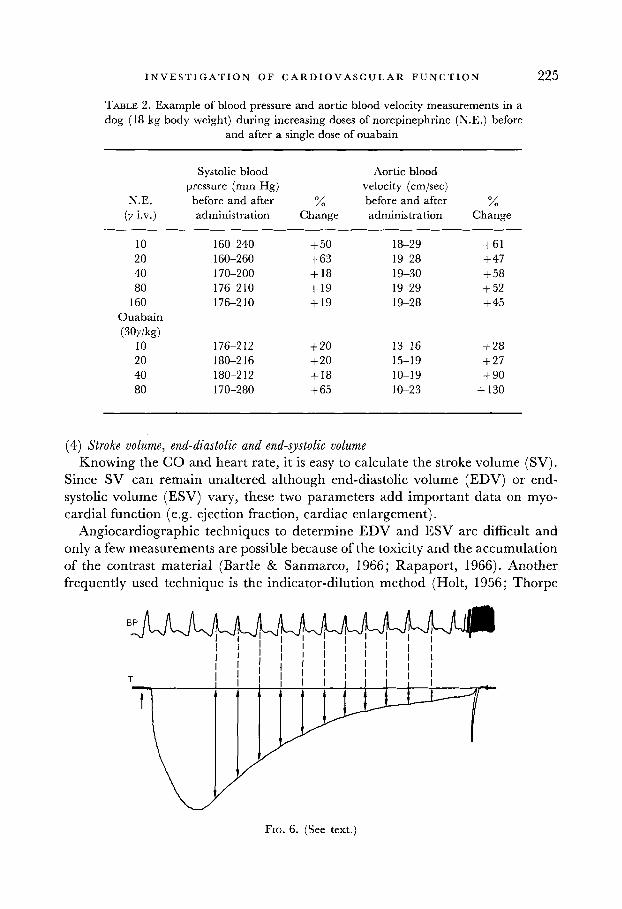
Angiocardiographic techniques to determine EDV and ESV are difficult and only a few measurements are possible because of the toxicity and the accumulation of the contrast material (Bartle & Sanmarco, 1966; Rapaport, 1966). Another frequently used technique is the indicator-dilution method (Holt, 1956; Thorpe
FIG. 6. (See text.)

226 A . L . D E L A U N O I S et al.
& Grodins, 1960; Rapaport, Wiegand & Bristow, 1962; Rapaport, 1966; Watson & Fleming, 1968). Either a dye or calories injected in the left ventricle produce in the aorta a curve with a step-like shape resulting after every heart beat. The ratio of the concentration (C,,) or temperature (t,,) at a given step and the con- centration (Cn- or temperature (tn- 1) at the foregoing step equals the ratio
ESV Cn - tn -
Cn-l tn-l EDV
The rapid blood sampling necessary to prevent curve distortion by the catheter system when using dye-dilution techniques (Rapaport, Wiegand & Bristow, 1962), is a major problem.
Similar determinations by injecting cold blood or saline into the left ventricle and by detecting the temperature curve with a thermistor catheter were per- formed. Instead of using the steps for the calculation of the ratio ESV/EDV, simultaneous records of temperature and BP in the aorta are made and the BP- peaks are transferred on the temperature curve (Fig. 6). This method is found to be a much easier procedure and more reliable than the step method in which it is often difficult to determine the right dye concentrations or temperature values. An example of values obtained before and after Xylazine administration is given in Table 3. Knowing the SV, EDV is calculated as given by:
sv . ESV
EDV =
1 - - EDV
The thermodilution values of EDV are consistently higher than the angio- graphic values in men as well as in dogs. Which of the methods more closely approximates actual EDV is not known (Barle & Sanmarco, 1966; Rapaport, 1966). The thermodilution technique has two important advantages : (1) the possibility of repeated injections in the same animal and (2) the non-toxicity of the injected solution. The angiographic methods on the other hand provide estimations at different times of ventricular systole and visualize other abnor- malities (e.g. insufficiency or stenosis of the valves).
(C) M Y O C A R D I A L H E A T P R O D U C T I O N
Although an intervention (e.g. the administration of a cardiotonic or cardioplegic agent) may give rise to the energy released by the heart to the periphery (external work), the cardiac efficiency is not necessarily improved.
The mechanical efficiency (q ) is given by the ratio of delivered external work to the total amount of energy used :
E"

I N V E S T I G A T I O N 0 F C A R D I 0 V A S C U L A R F U N C T I O N 227
TABLE 3. Example of ESV/EDV = t,/t,- determination in a dog before and after 0.25 mg/kg Xylazine i.v. (three injections). Thermodilution is used, injecting cold
saline in the left ventricle and measuring the temperature in the aorta
29.0 24.5 18-5 14.0 9.5 6-5
22.0 19.5 16.5 14.0 12.0
24.5 0.84 27.5 23.5 0.85 20.0 16.5 18.5 0.76 23.5 18.5 0.79 16.5 14.5 14.0 0.76 18.5 14.5 0.78 14.5 11.5 9.5 0.68 14.5 10.5 0.72 11.5 9.0 6.5 068 10.5 7.5 0.71 9.0 7.0 4.5 0.69
Mean value: 0.77 kO.06 (normal) 19.5 0.89 21.0 19.0 0.90 17.0 16.0 16.5 0.85 19.0 17.0 0.89 16.0 15.0 14.0 0.85 17.0 15.5 0.91 15.0 14.0 12.0 0.86 15.5 13.5 0.87 14.0 12.5 10.0 0.83 13.5 12.0 0-89 12.5 11.5
Mean value: 0.89 f 0.03 (after Xylazine administration)
0.83 0.88 0.79 0.78 0.78
0.94 0.94 0.93 0.89 0.92
Of the total energy available, a part is used for mechanical work in delivering potential (E,) and kinetic energy (mv2/2) to the blood leaving the left ventricle. The major amount of energy, however, is dissipated by the heart itself for mech- anical pumping action and is degraded into myocardial heat (EH). Neglecting the kinetic energy, and as E, is then equal to the blood pressure BP multiplied by the cardiac output (CO) , the efficiency (11) of the heart may be written as :
(GO. BP) ' = (CO.BP)+EH
The removal of the myocardial heat is done by: (1) the circulating blood in the coronary vascular bed, and (2) through the surfaces of the myocardium (endocardium, pericardium and lungs). Therefore an exact determination of E, is possible in the case of an isolated heart preparation (McDonald, 1971; Klaus et al., 1972), or in situ, when the ratio of total myocardial heat to heat drained through the coronary perfusion is known (Neil1 et al., 1961, 1963; Afonso et al., 1965a,b, 1966). One of us (Delaunois, Bernard & Dujardin, 1974) developed a method by which an estimation of E, can be obtained in closed-chest dogs. Indeed, by measuring differential temperatures between the superior vena cava and the right ventricle (At; see Fig. 5 and Table 4) it is possible to detect changes in the amount of heat (E,) produced in the myocardium and released partly through the coronary sinus and partly through the right ventricular endocardium. This amount of heat is equal to the CO multiplied by the specific heat of the blood (C)
228 A . L. D E L A U N O I S e t d.
TABLE 4. Example of blood pressure, aortic blood velocity and temperature measurements in a dog (15 kg body weight) during increasing doses of isoproterenol (iso.), before and after a single
dose of ouabain
Systolic blood Aortic blood pressure (mm Hg) velocity (cmjsec)
Iso. before and after % before and after % Temperature y i.v. administration Change administration Change increase
10 20 40 80
Ouabain
10 20 40 80
(30 ylkg)
150-100 150-84 150-60 150-64
136--80 124-80 120-60 10440
- 33 - 44 - 60 - 57
-41 - 35 - 50 -61
3 1-45 2 7-48 23-47 18-42
2 8 4 9 28-53 33-53 36-55
+ 7 1 + 78
+ 100 + 133
+ 75 + 89 + 60 + 53
+ 0.08 + 0.08 + 0.08 +0.10 +0.10
+ 0.056 + 0.056 + 0.056
and the temperature variation : E, = CO.C.At
Applying this formula, an estimation of q can be made and variations in efficiency before and after drug administration can be determined.
C O N C L U S I O N
The methods described can easily be performed in a clinical laboratory specializing in cardiovascular diseases. There are more sophisticated methods which may give other information on heart performance, but they are generally not applicable in clinical investigations and are often only used in physiological and pharmaco- logical research.
R E F E R E N C E S
AFONSO, S., ROWE, G.G., LUGO, J.E. & CRUMPTON, C.W. (19654 Left ventricle heat production in intact anesthetized dogs. Am. 3. Physiol. 208, 946.
AFONSO, S., MCKENNA, D.H., O’BRIEN, G.S., ROWE, G.G. & CRUMPTON, C.W. (1965b) Left ventricular heat production during induced tachycardia in the intact dog. Am. 3. Physiol. 209, 33.
AFONSO, S., O’BRIEN, G.S., JARAMILLO, C.V., MCKENNA, D.H. & ROWE, G.G. (1966) Left ventricular heat production after lowering left ventricular work. Am. 3. Physiol. 210, 553.
ANDERSON, P.A.W., MANRING, A. & JOHNSON, E.A. (1973) Force-frequency relationship. A basis for a new index of cardiac contractility? Circulation Res. 33,665.
BARNES, G.E., BISHOP, V.S., HORWITZ, L.D. & KASPAR, R.L. (1973) The maximum derivatives of left ventricular pressure and transverse internal diameter as indices of the inotropic state of the left ventricle in conscious dogs. 3. Physiol. Lond. 235, 57 1.
I N V E S T I G A T I O N O F C A R D I O V A S C U L A R F U N C T I O N 229
BARTLE, S.H. & SANMARCO, M.E. (1966) Comparison of angiocardiographic and thermal washout technics for left ventricular volume measurement. Am. 3. Cardiol. 18, 235.
BURROWS, C.F. (1973) Techniques and complications of intravenous and intraarterial catheteriza- tion in dogs and cats. 3. Am. vet. med. Ass. 163, 1357.
DAVIDSON, D.M., COVELL, J.W., MALLOCH, C.I. & Ross, J. (1974) Factors influencing indices of left ventricular contractility in the conscious dog. Cardiovasc. Res. 8, 299.
DELAUNOIS, A.L. ( 1973) Thermal method for continuous blood-velocity measurements in large blood vessels, and cardiac-output determination. Med. biol. Eng. 11, 201.
DELAUNOIS, A.L. (1974) Low-cost i.c. transducer for medical pressure measurements. Med. biol. Eng. 12, 364.
DELAUNOIS, A.L., BERNARD, P. J. & DUJARDIN, J.P. (1974) Influence of cardiotonic and cardio- plegic agents on the heat production of the heart. Arch int. Physiol. Biochim. 82, 229.
DENISON, A.B., SPENCER, M.P. & GREEN, H.O. (1955) A square-wave electromagnetic flowmeter for application to intact blood vessels. Circulation Res. 3, 39.
FEGLER, G. (1957) Reliability of the thermodilution method for determination of the cardiac output and the blood flow in central veins. Q.J. exp. Physiol. 42, 254.
FRONEK, A. & GANZ, V. (1960) Measurement of flow in single blood vessels including cardiac output by local thermodilution. Circulation Res. 8, 175.
HAMILTON, W.F. (1945) Notes on the development of the physiology of cardiac output. Fedn Proc. Fedn Am. SOCS exp. Biol. 4, 183.
HEFNER, L.L., SHEFFIELD, L.T., COBBS, G.C. & KLIP, W. (1962) Relation between mural force and pressure in the left ventricle of the dog. Circulation Res. 11, 654.
HOLT, J.P. (1956) Estimation of the residual volume of the ventricle of the dog's heart by two indicator dilution technics. Circulation Res. 4, 187.
IBERALL, A. (1967) Anatomy and steady flow characteristics of the arterial system with an introduction to its pulsatile characteristics. Math. Biosci. 1, 375.
JOUANNOT, P. & HATT, P.Y. (1974) Les facteurs de performance myocardique. Definitions et implications cliniques. Archs Mal. Coeur, 67, 413.
KATZ, L.N. & KOLIN, A. (1938) The flow of blood in the carotid artery of the dog under various circumstances as determined with the electromagnetic flowmeter. Am. J . Physiol. 122, 788.
KHALIL, H.H. (1968) Repeated or continual measurements of cardiac output in the squirrel monkey (Saimiri sciureus) by thermodilution. NAMI, publication 1032.
KLAUS, W., GUNTHER, K., THEISOHN, M. & THEISOHN-SCHWEDHELM, I. ( 1972) 5th Int. Congress on Pharmacology, Abstr. 126.
MCDONALD, R.H., JR (1971) Myocardial heat production: its relationship to tension develop- ment. Am. J . Physiol. 220, 894.
NEILL, W.A., LEVINE, H.J., WAGMAN, R.J., MESSER, J.V., KRASNOW, N. & GORLIN, R. (1961) Left ventricular heat production measured by coronary flow and temperature gradient. J . appl. Physiol. 16, 883.
NEILL, W.A., KRASNOW, N., LEVINE, H. J. & GORLIN, R. (1963) Myocardial anaerobic metabolism in intact dogs. Am. 3. Physiol. 204, 427.
NIEUWENHUYS, J.H.M., BOOM, H.B.K., DENIER VAN DER GON, J.J. & SCHIERECK, P. (1974) Assessment of myocardial contractility from intraventricular pressure recordings. Archs int. Physiol. Biochim., 82, 332.
RAPAPORT, E., WIEGAND, B.D. & BRISTOW, J.D. (1962) Estimation of left ventricular residual volume in the dog by a thermodilution method. Circulation Res. 11, 803.
RAPAPORT, E. (1966) Usefulness and limitations of thermal washout technics in ventricular volume measurement. Am. 3. Cardiol. 18, 226.
RUSHMER, R.F. & THAL, N. (1951) The mechanics of ventricular contraction: a cinefluorographic study. Circulation, 4, 2 19.
B*
230 A . L . D E L A U N O I S et al.
RUSHMER, R.F. (1962) Handbook of Physiology, Circulation. Vol. 1, p. 538. American Physiological
RUSHMER, R.F. (1970a) Cardiovascular Dynamics. Third Edn, p. 82. Saunders, Philadelphia. RUSHMER, R.F. (1970b) Cardiovascular Dynamics. Third Edn, p. 94. Saunders, Philadelphia. STEWART, G.N. (1897) Researches on the circulation time and on the influences which affect it.
THORPE, C.R. & GRODINS, F.S. (1960) Estimation of left ventricular volumes from thermodilution
VAN DEN Bos, G.C., ELZINGA, G. WESTERHOF, N. & NOBLE M.I.M. (1973) Problems in the use of
WALLACE, A.G., SKINNER, N.S. & MITCHELL, J.H. (1963) Hemodynamic determinants of the
WATSON, B.W. & FLEMING, J.S. (1968) Left ventricular volume estimation in man using a thermo-
WIGGERS, H.C. (1944) Cardiac output and total peripheral resistance measurements in experi-
Society, Washington.
3. Physiol. London, 22, 159.
curves. Fedn Proc. Fedn Am. SOCS exb. Biol. 19, 117.
indices of myocardial contractility. Cardiovasc. Res. 7, 834.
maximal rate of rise of left ventricular pressure. Am. 3. Physiol. 205, 30.
couple in the ascending aorta. Med. biol. Engng, 6, 399.
mental dogs. Am. 3. Physiol. 140, 519.