Embed Size (px)
Citation preview

Presented By
Date
Some facts about
European Journal of Operational Research2018
Roman Słowiński, Emanuele Borgonovo, Robert Dyson,
José-Fernando Oliveira, Steffen Rebennack, Ruud Teunter

2
EUROPEAN JOURNAL OF OPERATIONAL RESEARCH (EJOR)
Editors:
Roman Słowiński, PL (Co-ordinating Editor)
Emanuele Borgonovo, I
Robert Dyson, UK
José-Fernando Oliveira, P
Steffen Rebennack, D
Ruud Teunter, NL
Publisher: Simon Jones
Journal Manager: Caroline Muttram
Managing editor: Louise Tyler
Marketing Manager: Parveen Dhillon
Established in 1977, sponsored by EURO
Volume: ~ 9 000 pages/year, in 24 issues
Total cites: 43 505 in 2017 (1st of 83 OR & MS)
JCR 2-y Impact Factor 2017 = 3.428
JCR 5-y Impact Factor 2017 = 3.96
CiteScore (3y) = 4.08
Last issue published (status of July 6, 2018):
vol. 271, no.1, 16 November 2018
# of new submissions per year (2017): 3 466
www.elsevier.com/locate/ejor/

3

4

5
José-Fernando OliveiraImmanuel Bomze
Ruud Teunter
Robert Dyson
Emanuele Borgonovo
Roman Słowiński
THE EDITORS 2017
EUROPEAN JOURNAL OF OPERATIONAL RESEARCH (EJOR)

6
José-Fernando OliveiraSteffen Rebennack
Ruud Teunter
Robert Dyson
Emanuele Borgonovo
Roman Słowiński
THE EDITORS 2018
EUROPEAN JOURNAL OF OPERATIONAL RESEARCH (EJOR)

EDITORS & PUBLISHER
EUROPEAN JOURNAL OF OPERATIONAL RESEARCH (EJOR)
2018RomanSłowiński
RobertDyson
RuudTeunterEmanuele
Borgonovo
Steffen Rebennack
José-F. Oliveira
ImmanuelBomze

From Editorial Policy
The European Journal of Operational Research (EJOR)
publishes high quality, original papers that contribute to
the methodology of Operational Research (OR) and to
the practice of decision making.
The relation with ongoing research should be demonstrated
by providing proper reference to the recent OR literature.
With application papers, originality should be demonstrated by
applying OR to a problem with interesting new aspects or by
providing fresh insights leading to successful implementation.
8
EUROPEAN JOURNAL OF OPERATIONAL RESEARCH (EJOR)

From Editorial Policy
EJOR welcomes the following types of papers:
Invited Reviews, explaining to the general OR audience
the developments in an OR topic over the recent years
Innovative Applications of OR, describing novel ways
to solve real problems
Theory and Methodology Papers, presenting original
research results contributing to the methodology of OR
and to its theoretical foundations,
Short Communications, if they correct important defficiencies
of papers recently published in EJOR
9
EUROPEAN JOURNAL OF OPERATIONAL RESEARCH (EJOR)

HOW TO GET PUBLISHED AND CITED IN ACADEMIC JOURNALS | 10EJOR – the homepage
Metrics

HOW TO GET PUBLISHED AND CITED IN ACADEMIC JOURNALS | 11EJOR – the homepage
News
Journal’s Insights

HOW TO GET PUBLISHED AND CITED IN ACADEMIC JOURNALS | 12EJOR – the homepage
News

14

15
OPEN
ACCESS
gold OA (1950 US$)
green OA (embargo time – 24m)

Issue e-Alert for EJOR by Elsevier
16
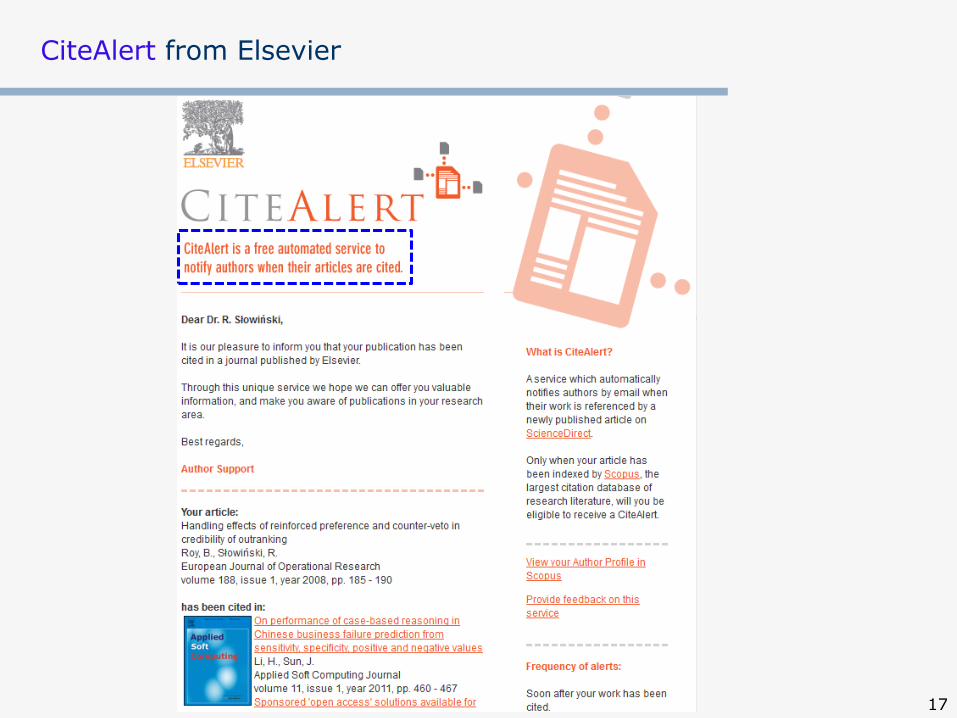
CiteAlert from Elsevier
17

My Research Dashboard – www.myresearchdashboard.com
A free service that replaces Usage Alerts and CiteAlerts, My Research
Dashboard is available exclusively to all Elsevier authors.
My Research Dashboard provides:
Early feedback about how papers are being downloaded, shared and cited
Data on where in the world and what discipline readers are in
Detailed information about how papers are being discovered
Powered by Scopus,
ScienceDirect & Mendeley,
the Dashboard captures
citation data for all of an
author’s articles published
in any journal, as well as
usage data for all the
articles they have published
in Elsevier journals.
18

EJOR – evolution of submissions and acceptances
19
3238 3279
36173466
1745
22152393 2482
2238
1113
629 718 723 710
327288 212 182334
233
0
500
1000
1500
2000
2500
3000
3500
4000
2014 2015 2016 2017 2018 YTD
Ma
nu
scrip
ts
Submitted Rejected Accepted Withdrawn or Removed
51%39% 37% 36% 37%
27%38% 40% 40% 40%
0%
20%
40%
60%
80%
100%
2014 2015 2016 2017 2018 YTD
Rejection Rate
Desk Reject Rate
Standard Reject Rate

Feature Clusters in EJOR
20
Articles Special Item Group Name Year Volume Issue
11 SI: Maritime Logistics 2014 235/2
20 SI: Routing and Logistics 2014 236/3
13 SI: Evolutionary Multiobjective Optimization 2015 243/2
7 SI: EURO/INFORMS 2013 2015 244/1
11 SI: Sustainable Scheduling 2015 248/3
5 SI: Stochastic Optimization 2015 249/1
14 SI: Credit Risk Modelling 2015 249/2
24 SI: Behavioural OR 2015 249/3
12 SI: Exact Multiobjective Optimization 2017 260/3
9 SI: MCDA Learning 2017 264/2
19 SI: OR in practice 2017 264/3
32 SI: Community OR 2018 268/3
29 SI: OR Approaches for Sustainability 2018 269/1
28 SI: Humanitarian Operations 2018 269/2
33 SI: EURO 2016 - Extending the OR Horizons 2018 270/3

EJOR – number of editors’ and reviewers’ tasks
21
Ratio of invited
to completed = 46.3% (43.5%)
In average (2017):
2.7 (2.5) reviewers/acc. article
5.3 (5.2) reviews/acc. article
Aceptance rate: 19%
in 2016
Peer Reviews per Accepted Article

22
Search in SCOPUS (All reviewers get 30-day free access to SCOPUS)

Awards for reviewers
23
EJOR R-index based on data from EES reviewer performance report
avg # days to respond (x1) – weight w1=1.0 – decreasing
avg # days to complete (x2) – weight w2=1.0 – decreasing
# times submitted on time (x3) – weight w3=2.0 – increasing
# times submitted late (x4) – weight w4=1.0 – increasing
# times terminated after acceptance (x5) – decreasing
weight w5=2.0 if #rem>1, 0 otherwise
avg utility score (50-100%) (x6) – weight w6=0.1 – increasing
The EJOR R-index for the generic reviewer:
665544332
2
1
1
11xwxwxwxw
x
w
x
wR
Reports that got less than 50% utility score were excluded

Awards for reviewers who did an outstanding job by submitting timely, unbiased and thoughtful reviews – started in 2010
24
Reviewers awarded in 2018 for their work in 2017:

Awards for reviewers who did an outstanding job by submitting timely, unbiased and thoughtful reviews – started in 2010
25

Average Editorial Speed for All Submitted Manuscripts
26
3,0 2,7 2,5
4,8 4,1
20,119,2
16,718,0 17,8
31,432,3 32,4
34,533,1
0,0
5,0
10,0
15,0
20,0
25,0
30,0
35,0
40,0
2014 2015 2016 2017 2018 YTD
Ave
rage
Wee
ks
Submission to First Decision (Desk)
Submission to First Decision (Standard)
Submission to Final Editoral Outcome (Standard)

Publication Speed
27
22,421,1
18,2 17,1 17,8
52,650,0
52,9 53,350,9
54,651,5
54,3 54,552,4
65,8
60,663,4
65,8 65,166,2
62,365,1
67,5 66,9
0,0
10,0
20,0
30,0
40,0
50,0
60,0
70,0
80,0
2014 2015 2016 2017 2018 YTD
Ave
rage
Wee
ks
Submission to First Decision Submission to Acceptance
Submission to First Online Submission to Publication VoR
Submission to Final Publication

Top 50 keyphrases by relevance over the period 2014-2017
Packing 0,26 -30,8
Local search 0,25 91,7
Multi-objective optimization 0,25 466,7
Queueing 0,25 160
Branch-and-cut 0,24 116,7
Mixed integer programming 0,24 57,1
Branch-and-price 0,24 300
Lot sizing 0,24 -8,3
Pricing 0,23 112,5
Portfolio optimization 0,23 1400
Revenue management 0,23 100
Global optimization 0,22 -16,7
Traveling salesman problem 0,22 140
Risk management 0,22 266,7
Mixed integer linear programming 0,21 420
Benders decomposition 0,21 233,3
Time windows 0,2 18,2
Facility location 0,2 -38,5
Heuristics 0,2 102
Investment analysis 0,2 200
Real options 0,2 800
Pickup and delivery 0,2 25
Assignment problem 0,19 42,9
Decision support systems 0,19 125
Inventory control 0,19 50
Keyphrase Relevance Growth %
Data envelopment analysis 1 -10,7
Supply chain management 1 12,1
Combinatorial optimization 0,67 119
Integer programming 0,63 66,7
Game theory 0,55 0
Decision analysis 0,54 100
Operational research 0,53 -35,7
Inventory 0,51 48,9
Routing 0,46 61,5
Supply chain 0,46 22,5
Column generation 0,41 142,9
Robust optimization 0,41 33,3
OR in energy 0,4 275
Vehicle routing 0,39 140
Metaheuristics 0,38 47,4
Scheduling 0,38 102,6
Vehicle routing problem 0,38 -40
Stochastic programming 0,38 66,7
Routing problem 0,36 0
Multiple criteria analysis 0,36 266,7
Multiple objective programming 0,35 42,9
Dynamic programming 0,31 13
Network design 0,3 0
Uncertainty modeling 0,27 0
Transportation 0,27 20

29
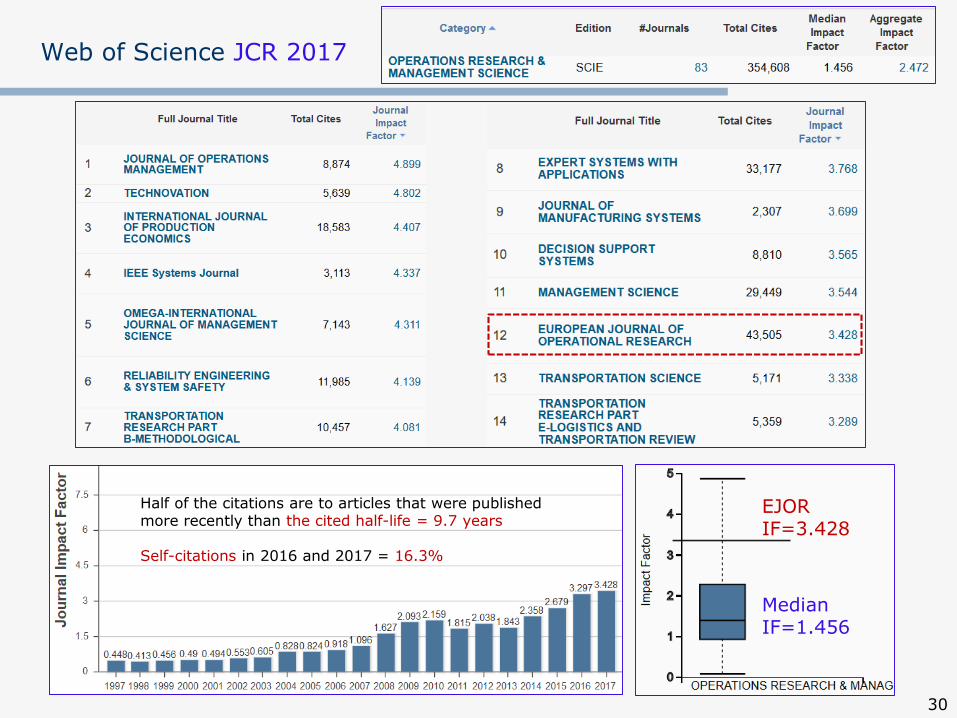
Web of Science JCR 2017
30
EJORIF=3.428
MedianIF=1.456
Half of the citations are to articles that were published more recently than the cited half-life = 9.7 years
Self-citations in 2016 and 2017 = 16.3%

Web of Science JCR 2017
31

Top twenty journals citing EJOR in 2017
32
Size of each arc is indicative of the relative citation relationship.
Thickness of chords connecting the arcs shows the strength of citation relationship.

Top twenty journals cited by EJOR in 2017
33
Size of each arc is indicative of the relative citation relationship.
Thickness of chords connecting the arcs shows the strength of citation relationship.

34
Journal ranking by H-index – SCIMAGO 2017
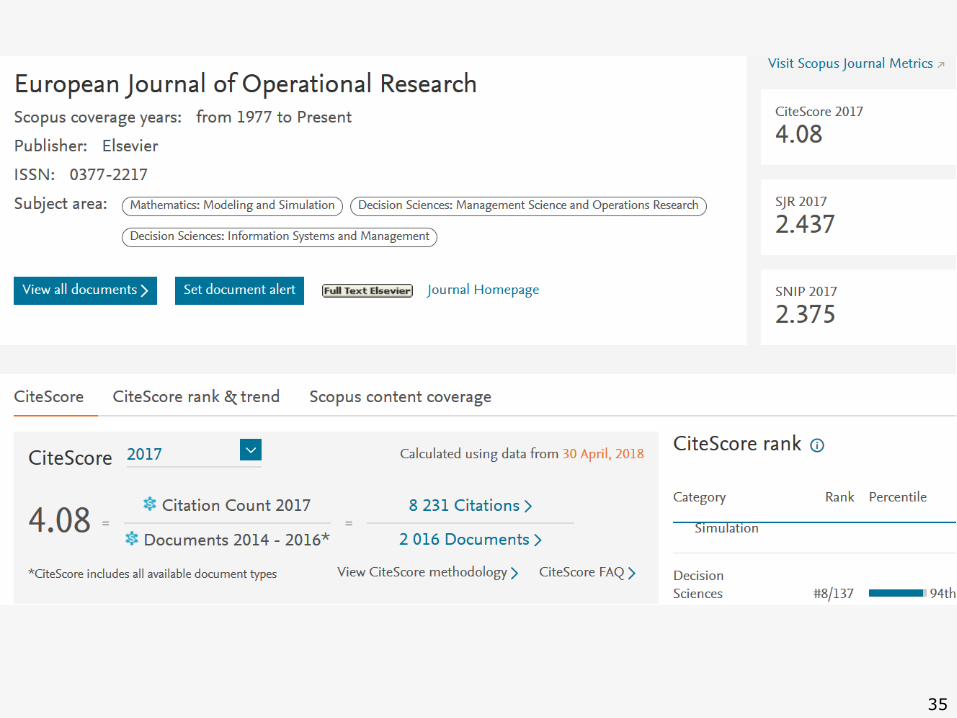
35

36

37
EJOR = 40.6%(2017)
SCIMAGO
The ratio of articles signed by authors from more than 1 country

Journal ranking by H-index –
https://scholar.google.com.au/citations?view_op=top_venues&hl=en&vq=eng_operationsresearch
2018

Journal ranking by Association of Business Schools in UK
40
2018
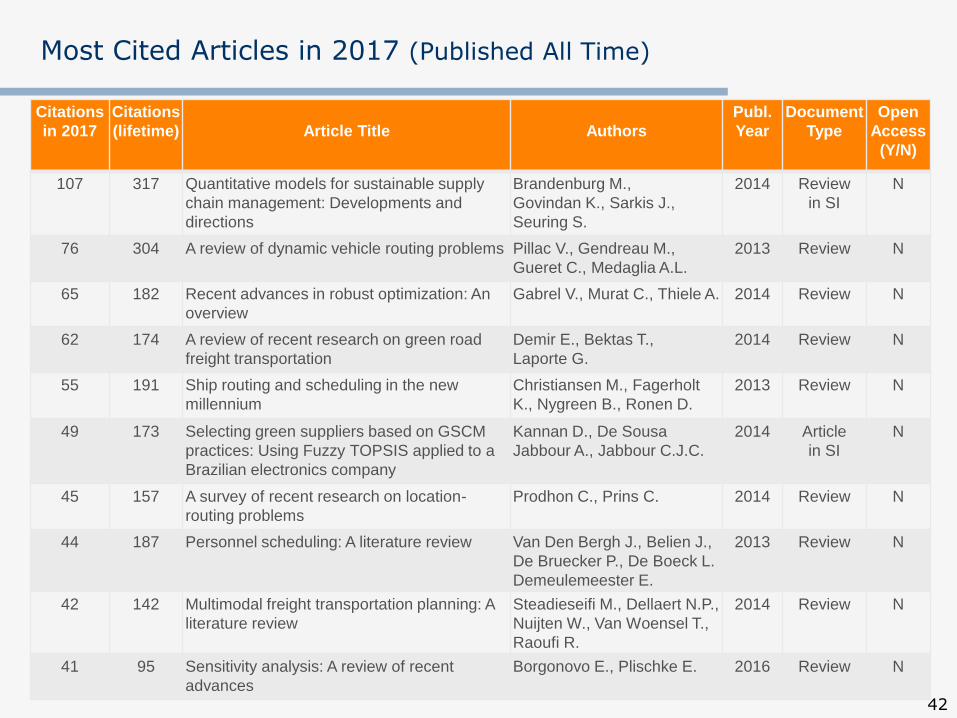
Most Cited Articles in 2017 (Published All Time)
42
Citations
in 2017
Citations
(lifetime) Article Title Authors
Publ.
Year
Document
Type
Open
Access
(Y/N)
107 317 Quantitative models for sustainable supply
chain management: Developments and
directions
Brandenburg M.,
Govindan K., Sarkis J.,
Seuring S.
2014 Review
in SI
N
76 304 A review of dynamic vehicle routing problems Pillac V., Gendreau M.,
Gueret C., Medaglia A.L.
2013 Review N
65 182 Recent advances in robust optimization: An
overview
Gabrel V., Murat C., Thiele A. 2014 Review N
62 174 A review of recent research on green road
freight transportation
Demir E., Bektas T.,
Laporte G.
2014 Review N
55 191 Ship routing and scheduling in the new
millennium
Christiansen M., Fagerholt
K., Nygreen B., Ronen D.
2013 Review N
49 173 Selecting green suppliers based on GSCM
practices: Using Fuzzy TOPSIS applied to a
Brazilian electronics company
Kannan D., De Sousa
Jabbour A., Jabbour C.J.C.
2014 Article
in SI
N
45 157 A survey of recent research on location-
routing problems
Prodhon C., Prins C. 2014 Review N
44 187 Personnel scheduling: A literature review Van Den Bergh J., Belien J.,
De Bruecker P., De Boeck L.
Demeulemeester E.
2013 Review N
42 142 Multimodal freight transportation planning: A
literature review
Steadieseifi M., Dellaert N.P.,
Nuijten W., Van Woensel T.,
Raoufi R.
2014 Review N
41 95 Sensitivity analysis: A review of recent
advances
Borgonovo E., Plischke E. 2016 Review N

Most Downloaded Articles From ScienceDirect in 2017 (Published All Time)
43
Downloads Downloads
(lifetime) Article Title Authors
Publ.
Year
Doc.
Type
Open
Access
(Y/N)
36,902 73,062 Risk assessment and risk management:
Review of recent advances on their
foundation
Aven T. 2016 Review Y
32,591 97,433 Reverse logistics and closed-loop supply
chain: A comprehensive review to explore
the future
Kannan Govindan, Hamed
Soleimani, Devika Kannan
2015 Review Y
10,808 28,221 The bullwhip effect: Progress, trends and
directions
Wang X., Disney S.M. 2016 Review Y
9,724 11,778 Incorporation of activity sensitivity
measures into buffer management to
manage project schedule risk
Hu X., Cui N.,
Demeulemeester E., Bie L.
2016 Article N
8,664 17,941 Exposure at default models with and
without the credit conversion factor
Tong E.N.C., Mues C.,Brown I.,
Thomas L.C.
2016 Article Y
8,346 13,574 Supply chain network design under
uncertainty: A comprehensive review and
future research directions
Govindan K., Fattahi M.,
Keyvanshokooh E.
2017 Article Y
8,206 32,895 Quantitative models for sustainable supply
chain management: Developments and
directions
Brandenburg M., Govindan K.,
Sarkis J., Seuring S.
2014 Article N
6,526 27,491 A review of dynamic vehicle routing
problems
Pillac V., Gendreau M.,
Gueret C., Medaglia A.L.
2013 Review N
6,249 8,555 Supply chain forecasting when information
is not shared
Ali M.M., Babai M.Z.,
Boylan J.E., Syntetos A.A.
2017 Article Y
5,239 12,690 Trends in transportation and logistics Grazia Speranza M. 2018 Article N
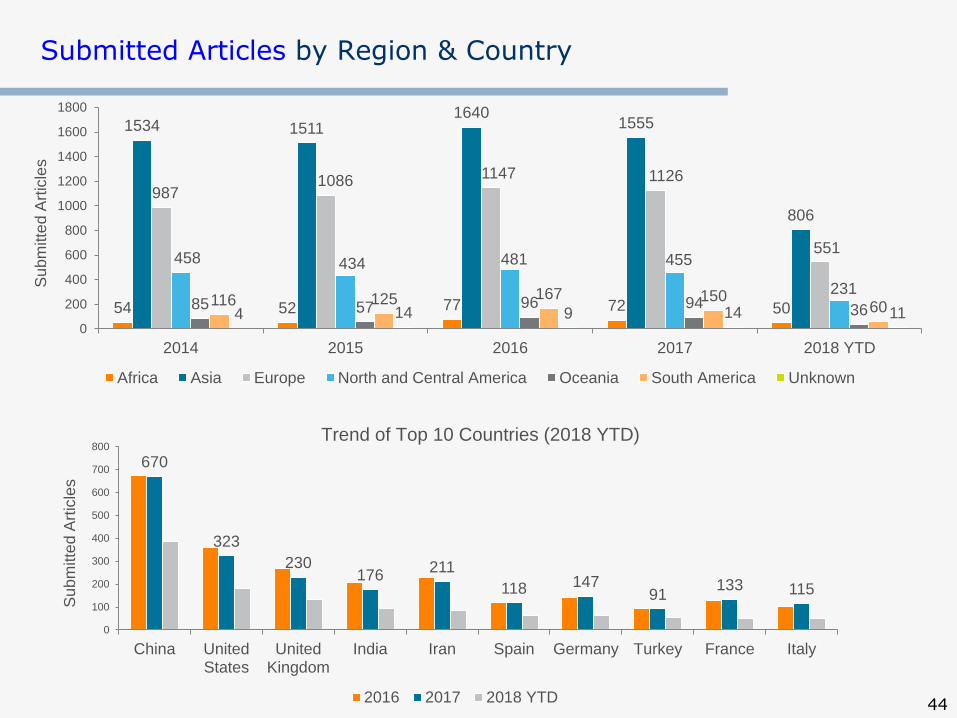
Submitted Articles by Region & Country
44
54 52 77 72 50
1534 15111640
1555
806
9871086
1147 1126
551458 434 481 455
23185 57 96 94 36
116 125 167 150604 14 9 14 11
0
200
400
600
800
1000
1200
1400
1600
1800
2014 2015 2016 2017 2018 YTD
Su
bm
itte
d A
rtic
les
Africa Asia Europe North and Central America Oceania South America Unknown
670
323
230176
211
118 14791
133 115
0
100
200
300
400
500
600
700
800
China UnitedStates
UnitedKingdom
India Iran Spain Germany Turkey France Italy
Su
bm
itte
d A
rtic
les
Trend of Top 10 Countries (2018 YTD)
2016 2017 2018 YTD

67
101
82
65
40
17
3023
42
13
88 91
73
54
39
22 23
12
32
21
36 32 29 28 27
15 14 12 12 10
0
20
40
60
80
100
120
UnitedKingdom
UnitedStates
China Germany France Netherlands Spain Brazil Canada Belgium
Acce
pte
d A
rtic
les
Trend of Top 10 Countries (2018 YTD)
2016 2017 2018 YTD
Accepted Articles by Region & Country
45
5 4 3 2 2
166178 171 163
68
300
351 348
379
183
118 127143
125
45
16 24 21 208
22 32 3321 19
2 2 4 0 20
50
100
150
200
250
300
350
400
2014 2015 2016 2017 2018 YTD
Acce
pte
d A
rtic
les
Africa Asia Europe North and Central America Oceania South America Unknown

Downloads of Full-Text Articles (FTA) from ScienceDirect
46
2016: 2 844 5402017: 2 894 319
Articles on line ~ 16 500User Accounts ~ 8 000
0 k
500 k
1 000 k
1 500 k
2 000 k
2 500 k
3 000 k
2012 2013 2014 2015 2016 2017 2018 YTD
Fu
ll T
ext U
sage
China United States United Kingdom Germany India
Turkey Australia Netherlands Taiwan Rest of World