Embed Size (px)
Citation preview

1
SOLVING THE MYSTERY OF JOURNAL ARTICLES:
THE WORKSHEET*
To really understand how consumers behave, it’s important to learn how to read and critique
academic journal articles. This worksheet is a quick and fun introduction to deciphering
complicated journal articles.
Handwrite 2 well thought-out sentences to answer each question. Doing this will give you a
crash course introduction to experimental design, measurement, and analysis.
This worksheet is appropriate for advanced undergraduates, 1st year graduate students, and
anyone else who has an interest or curiosity of the science that goes on behind headlines.
This worksheet is based on a short, fun article about eating movie popcorn. It’s citation is: Brian
Wansink and SeaBum Park (2001), “At the Movies: How External Cues and Perceived Taste
Impact Consumption Volume,” Food Quality and Preference, 12:1 (January), 69-74. The article
is widely available on the internet (www.FoodPsychology.Cornell.edu), or we can email you a
pdf if you send a note to [email protected].
1. Visualizing Key Results-------------------------------------------------------------------------
1.1. The primary dependent variable in this paper was
And the two primary independent variables1 were &
1.2. Use the graph to draw a rough sketch of what was found.
* Developed by Dr. Brian Wansink, © 2006 (www.FoodPsychology.Cornell.edu)1 (You know why they’re called dependent and independent variables, right?)
Popcorn
Consumption

2
2. “How Well Do You Know It?” The Party Test -------------------------------------
2.1. Suppose someone at a party asks you what research you’re working on. In only
two punchy sentences, how would you explain these findings in a way that
wouldn’t bore them?
2.2. What is the purpose of using the Party Test when thinking about planning your
research?
2.3. What is the purpose of using the Party Test when thinking about the results of
your research?
3. Running Experiments ------------------------------------------------------------------------
3.1 On the 2nd page of the article (p. 70), it says this is a “2x2 between subjects design.”
a) What does “2x2” mean?
b) What does “between subjects design” mean?
3.2. Manipulate vs. Measure. If you want to have two versions of an independent
variable (medium vs. large popcorn tubs; good-tasting vs. bad-tasting popcorn),
there are two ways this can be done. You can manipulate the variable (such as
medium vs. large popcorn) or you can measure the variable (such as good-tasting
vs. bad-tasting popcorn) and put people into groups based on their ratings. What
is the drawback about measuring the “favorability” of popcorn?
3
3.3. What is the drawback of manipulating the favorability of popcorn? Could you
devise a manipulation that gets around this? (The “Bad Popcorn” reference noted
at the end of this worksheet shows one approach to this).
3.4. This study was conducted in a field study (i.e., in the real world) instead of a lab
in a basement room using undergraduates. Was it necessary to do this study in the
field?
4. Deciphering the Language --------------------------------------------------------------------
4.1. The world “external cues” is mentioned in the title and throughout the paper.
Why talk about “external cues” instead of “container size.” (The answer is not,
“It sounds more scientific.”)
4.2. In consumer research, we always talk about main effects and interactions. In
Figure 1, one main effect, that of on popcorn
consumption is significant. Which main effect is not significant?
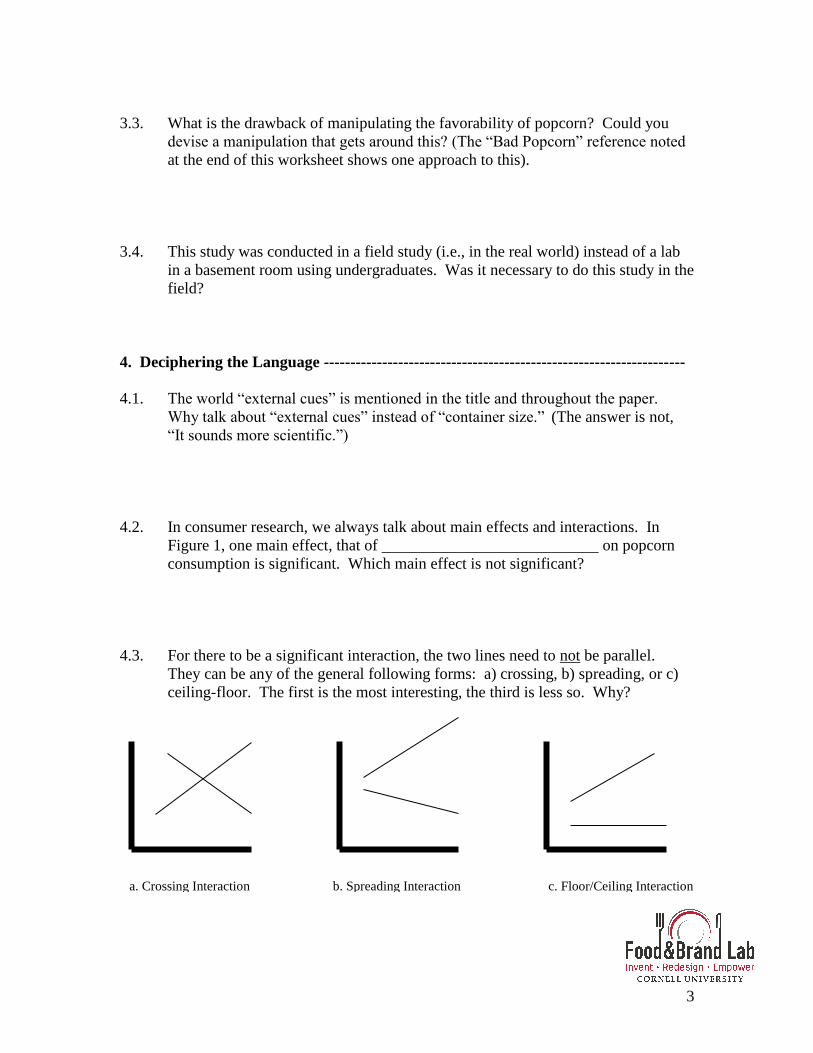
4.3. For there to be a significant interaction, the two lines need to not be parallel.
They can be any of the general following forms: a) crossing, b) spreading, or c)
ceiling-floor. The first is the most interesting, the third is less so. Why?
a. Crossing Interaction b. Spreading Interaction c. Floor/Ceiling Interaction
© Dr. Brian Wansink
4
4.4. When I was a 1st year Ph.D. student, a big-time researcher said to me, “When it
comes to understanding consumers, most main effects aren’t interesting, only the
interactions are.” What in the world does this mean?
5. Using Data to Solve the Mystery ------------------------------------------------------------
Two of the most common analyses in consumer research involve ANOVA and multiple
regression. ANOVA (analysis of variance) compares the differences between means, and
multiple regression shows how two different variables are related (do they both increase
together). ANOVAs are like a more complex version of a simple t-test. Regression is
like a glorified version of a correlation. Table 1 shows the means and ANOVA results,
and Table 2 shows regression coefficients.
5.1. Ron’s girlfriend wants to catch a 5:30 movie tonight. When she goes alone, she
eats popcorn instead of dinner. Will Ron have to buy her dinner tonight after the
movie and what does this depend?
5.2. In Table 2, attention is significant for those moviegoers who don’t like the taste,
but attention doesn’t influence those moviegoers who do like the popcorn. Your
roommate is trying to lose weight. Based on this, what would you tell her before
she leaves for the movies (other than to take a date)?
5.3. Just before giving your roommate your advice, you happen to look at the finding.
How are you going to modify the advice you giver her?

© Dr. Brian Wansink
5
The Sherlock Holmes Level
Bonus Round Question
5.4. Sherlock Holmes’ arch-enemy, Professor Moriarty, was completing his research
presentation on movie popcorn at the Food Mystery Conference in London.
Following this, Holmes was to critique Moriarty’s research.
Sherlock carefully studied Table 1 as he puffed on his pipe. As the thunderous
applause for Moriarty’s presentation died down, the spotlight made a creaking
noise as it slowly moved its aim to Sherlock Holmes. He put pipe down, paused,
and said, “To the contrary, Professor Moriarty, there is another story I would like
to tell.”
What is the other story Sherlock Holmes could tell us about the popcorn results?
Follow-up References
Wansink, Brian and SeaBum Park (2001), “At the Movies: How External Cues and
Perceived Taste Impact Consumption Volume,” Food Quality and Preference, 12:1
(January), 69-74.
Wansink, Brian and Junyong Kim (2005), “Bad Popcorn in Big Buckets: Portion Size
Can Influence Intake as Much as Taste, “ Journal of Nutrition Education and
Behavior, 37:5 (Sept-Oct), 242-5.
Wansink, Brian (2006), Mindless Eating – Why We Eat More Than We Think,
New York: Bantam-Dell.
Wansink, Brian (2004), “Environmental Factors that Increase the Food Intake and
Consumption Volume of Unknowing Consumers,” Annual Review of Nutrition,
Volume 24, 455-479.