Embed Size (px)
Citation preview

FEDERAL RESERVE BANK OF ST. LOUIS AUGUST/SEPTEMBER 1987
Solving the 1980s’ Velocity Puzzle:A Progress ReportCourtenay C. Stone and Daniel L. Thornton
HE velocity of money measures the relationshipbetween nominal income and the money stock. In itssimplest for-m, the quantity theory of money statesthat nomtiinal income is equal to the money stockmultiplied by its velocity. If velocity is reasonablystable, changes in the money stock have predictableconsequences on nominal income; if the money stockis controllable as well, the quantity theory has usefulimnplications for’ economic policy. The relationshipbetween money growth and inflation can he derivedfrom the quantity theory framework by “breaking LII)”nominal income into its two components — the pr-icelevel and r’eal output. Thus, the stability of the money-price link, holding real output constant, is also relatedclosely to the stability of velocity.
For over’ a third of a centtuy — from 1946 to 1981 —
the growth of the velocity of money, measured as theratio of gross national product GNP) to the narrow
money stock MU, was stable. Its stability contributed
Courtenay C. Stone is a senior economist and Daniel L. Thornton is aresearch officer at the Federal Reserve Bankot St. Louis. Rosemarie VMueller provided research assistance. The authors would also like tothank Michael Darby for helpful suggestions on an earlier draft.‘The money stock need not be perfectly controllable; neither, for thatmatter, must velocity be constant. Movements in velocity (or itsgrowth), however, must be explainable by the behavior of thevariables that influence it. This idea, fundamental to macroeconomicpolicy, was developed by Friedman (1956). See Thornton (1983) fora discussion of the role of velocity for policy purposes.
to the rise of mnonetarism and the adoption of mone—tan’ aggregate tar-gets by the Federal Reserve and othercentral banks around the world. Its stability also re-sulted in two empirically based r’ules of thumb thatcame to be used fair’ly successfully as guides to moneygrowth’s effects on income and inflation. Now, how-ever’, analysts believe that these rules have failed toexplain the course of income and inflation during the1980s, due to a relatively sudden and unanticipateddrop in velocity.
Given the important role that velocity plays in eco-nomic and policy analysis, it is not surprising thatconsiderable effor’t has been devoted to solving thisvelocity puzzle. tinfortunately, these efforts have pro-
duced a welter’ of competing and occasionally confus-ing explanations. To bring some or’der to this disarr’av,this article highlights the problemns that have resulted
from the puzzling behavior of velocity in recent yearsand examines the more pronhinent explanations of thevelocity puzzle.
Because the concept of velocity stems dir’ectl fr’omthe theory of the demand for money, anything thataffects velocity can be related to some aspect of thedemand for money. See shaded insert on the follow-ing page.) Because the demand-for-money approachis likely to be less intuitive to the general reader,however’, we will discuss the various explanations ofthe velocity puzzle in terms of velocity itself.
5

FEDERAL RESERVE BANK OF ST. LOUIS AUGUST/SEPTEMBER 1987
:~~1~>
/ /“~ ,\. ~ \
~ ., -.
~ 0 ~ / ,~ ~
, ,./ , >\~ ~\.. , / ~ ,c ~
~ ~ , ~/r ~‘
, , ~v~t_ ~&-
ir
A.
A.’
4*y \ A.~A ~ ‘
A’
A”” ‘A A , A A , A
A.,
A’ AA ‘A.
, // : A’ ~
A’,
A ‘ )K AA/A!AA’A.
Aft ,, A’A’ ‘
I ‘A. ~
~A. ~ A.
—, A V , A ‘A
A.A. , \
A A.A
,‘A / AA.
‘ A’ ‘A’ ,
A” ~ ,
A’ ‘ ‘A’A” A” A’
A \ A’
‘ ~A’A’~A eAA’A~t’ A. ~ A
4*~c.~~kv4’4S/~A., /
A : ~~ ~‘A’ A , ~/P~’A’A”A~” ‘~ 4~ ~ !S~A’~Z~C”$~’
~ A’: ~4~,iCS~A3L~~~r ~ A
6
FEDERAL RESERVE BANK OF ST. LOUIS AUGUST/SEPTEMBER 1987
WHAT WENT WRONG AND WHEN?
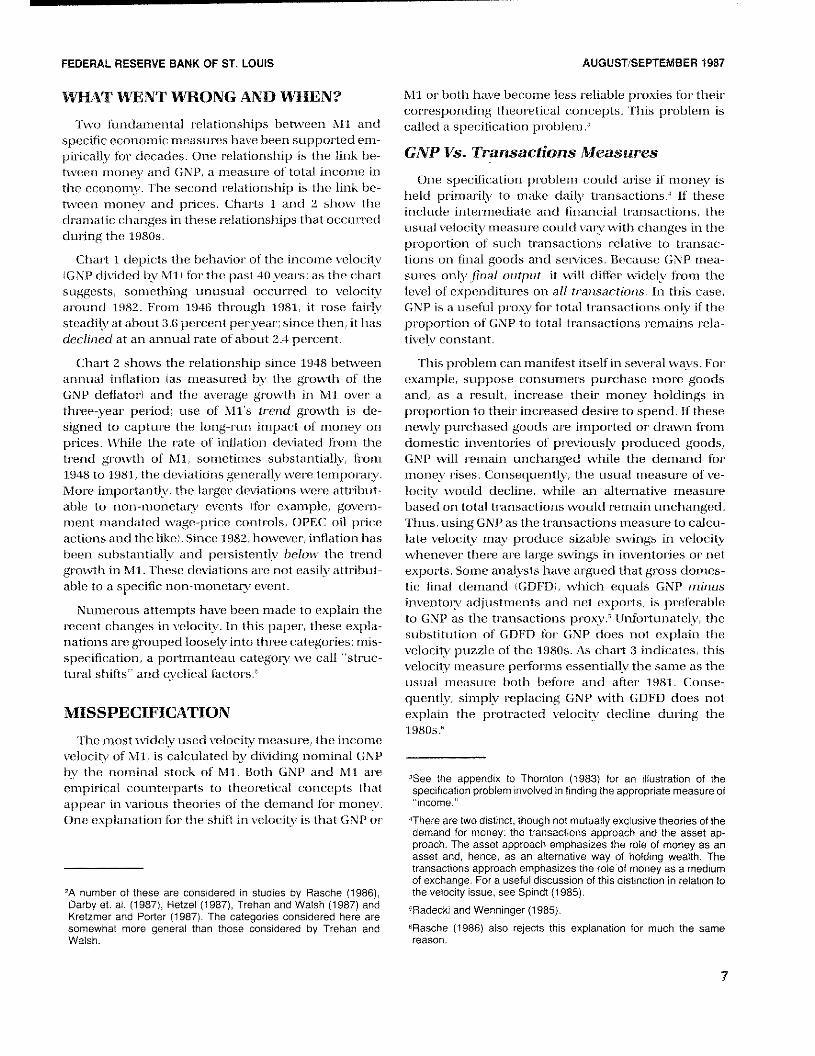
‘Two fundamental r’elationships between Ml andspecific economic measures have been suppom’ted em—pim’icallv for’ decades. One r’elationship is the link be-tween mnoney and GNP, a measur-e of total income inthe economy. The second relationship is the link be-tween money and pr’ices. Charts 1 and 2 show thedramatic changes in these relationships that occurredduring the 1980s.
Chart 1 depicts the behavior of the income velocityGNP divided by Ni 1 I for the past 40 years; as the chart
suggests, something unusual occurred to velocity
around 1982. From 1946 through 1981, it rose fairlysteadih’ at about 3.6 percent pervear; since then, it hasdeclined at an annual rate of about 2.4 percent.
Chart 2 shows Ihe r’elationship since 1948 betweenannual inflation (as measured by the growth of theGNP deflator’) and the average growth in Nil over a
three—year’ per’iod; use of Ml’s trend growth is de-signed to capture the long-run impact of money onprices. While the rate of inflation deviated from thetrend growth of Ml, sometimes substantially, from
1948 to 1981, the deviations generally wer’e ternporan’.More importantly, the lar’ger deviations were attritiut—able to non-monetary events for example, govern—
nient mandated wage—price controls, OPEC oil pr’iceactions and the like;. Since 1982, however’, inflation hasbeen substantially and per’sistentlv below the trend
growth in Ml. ‘I’hese deviations are not easily attribut-able to a specific non—monetai event.
Numerous attempts have been made to explain ther’ecent changes in velocity. In this paper’, these expla-nations are gmnuped loosely into three categor-ies: mis-specification, a portmanteau categon’ we call ‘‘str-uc—tural shifts’’ and cyclical factors.’
MISSPECIFICATION
The most widely used velocity measure, the incomevelocity of Ml, is calculated by dividing nominal GNPby the nominal stock of Ml. Both GNP and Nil areempirical counterpar1s to theoretical concepts thatappear’ in various theories of the demand for money.One explanation for’ the shift in velocity is that GNP or
‘.A number of these are considered in studies by Rasche (1986),Darby et, al, (1987). Hetzel (1987), Trehan and Walsh (1987) andKretzmer and Porter (1987). The categories considered here aresomewhat more general than those considered by Trehan andWalsh.
Nil or’ tioth have become less reliable pr’oxies for their-cor’r’esponding theor’etical concepts. This protilem iscalled a specification problem
GIVP Vs. Transactions Measures
One specification problem could arise if money isfield pr’irnam’ilv to make daily ti’ansactions.’ if theseinclude intermediate and financial tr’ansactions. theusual velocity measure could vary with changes in thepropor’tion of such transactions relative to transac—tions on final goods and services. Because GNP mea-sures onl final output, it will differ widely from the
level of expenditur’es on all tran.saclrorrs, In this case,GNP is a useful proxy for total tr’ansactions only if thepropor’tion of GNP to total tr’ansactions remains rela—tiyely constant.
This protilem can manifest itself in sever’al ways. F’or’example, suppose consumers purchase mor-e goodsand, as a result, imIcr-ease their money holdings inproportion to their incr’eased desire to spend. If these
newl purchased goods are impor’ted or’ dr’awn fromdomestic inventories of preyiriusly produced goods,GNP will remain unchanged while the demand for’
money rises. Consequentl~ the usual measur’e of ve-locity would decline, while an alternative measurebased on total transactions would r’emain unchanged.Thus, using GNti as the transactions measure to calcu-late velocity may pr-ociuce sizable swings in velocit~’whenever ther’e are large swings in inventories or’ net
exprir’ts. Some analysts have argued that gr’oss domes-tic final demand IGDFDI, which equals GNP TTdJIUS
inventory adjustments and net exports, is preferable
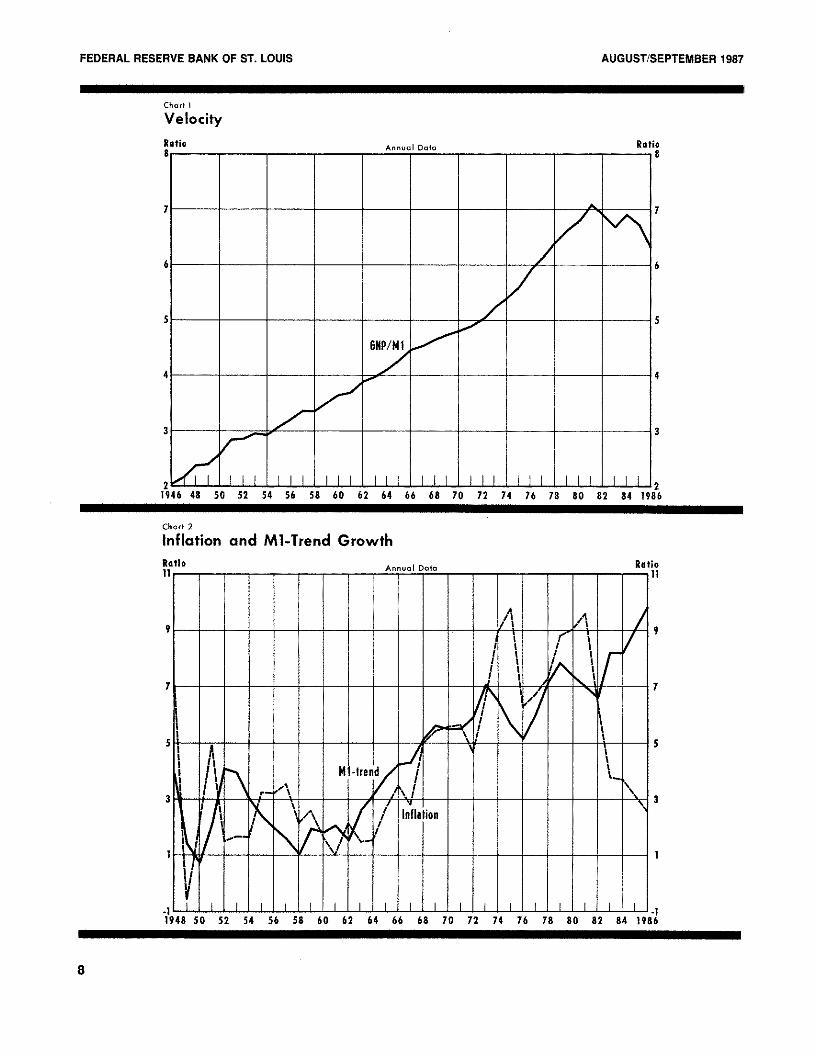
to GNP as the transactions proxy.’ t,Jnforftrnately, thesubstitution of GDFD for- GNP does not explain the
velocity ptlzzle of the l980s. As chart 3 indicates, thisvelocity measure performs essentially the same as theusual mneasur’e both before arid after 1981. Conse-
quently, siriiply replacing GNP with GDFD does notexplain the protracted velocity decline dur’ing thel980s.”
‘See the appendix to Thornton (1983) for an illustration of thespecification problem involved in tinding the appropriate measure of“income.”
‘There are Iwo distinct, though not mutually exclusive theories of thedemand for money: the transactions approach and the asset ap-proach. The asset approach emphasizes the role of money as anasset and, hence, as an alternative way of holding wealth. Thetransactions approach emphasizes the role of money as a mediumof exchange. For a useful discussion of this distinction in relation tothe velocity issue, see Spindt (1985).‘Radecki and Wenninger (1985).6flasche (1986) also relects this explanation for much the samereason.
7
FEDERAL RESERVE BANK OF ST. LOUIS AUGUST/SEPTEMBER 1987
chart I
VelocityRatio Annual Data Ratio
8
/‘
y/
,___G$P/Hl
-y~,r
3
I III Ill III III III III II
1
6
S
4
3
2 21946 48 50 52 54 56 58 60 62 64 66 68 70 72 74 16 78 80 82 84 1986
chart 2
Inflation and Mi-Trend Growth
1
RatioII
9
1
5
—l —1194850 52 54 56 58 60 62 64 66 68 10 72 74 16 78 80 82 84 1Q86
8
FEDERAL RESERVE BANK OF ST. LOUIS AUGUST/SEPTEMBER 1987
chart 3
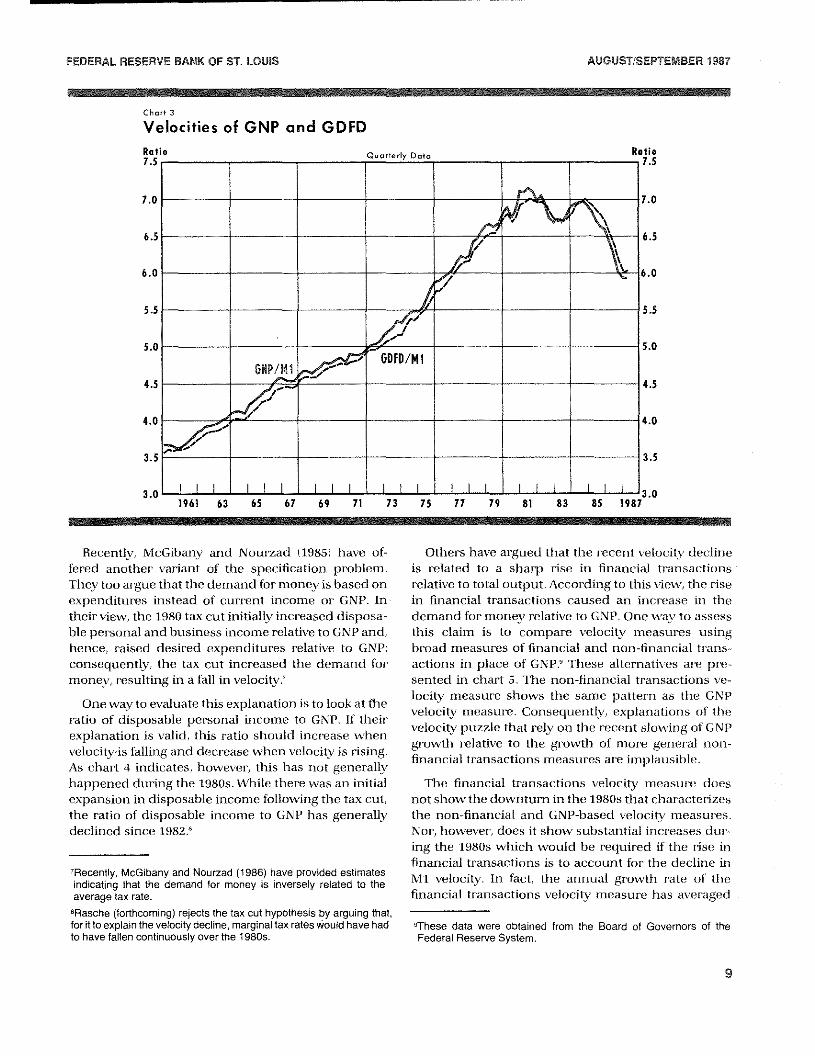
Velocities of GNP and GDFDRatio
1.5
1.0
6.5
6.0
5.5
5.0
4.5
4.0
3.5
3.0196% 63 65 67 69 11 73 75 71 19 81 83 85 1981
Recently, McGibany and Nourzad 1985) have of-
fered another variant of the specification problem.They too argue that the demand for mone is based onexpenditures instead of current income or CNP. in
their view, the 1980 tax cut initially increased disposa-ble personal and business income relative to GNPand,hence, raised desired expenditures relatiye to GNP;consequently, the tax cut increased the demand formoney, resulting in a fall in velocity.’
One way to evaluate this explanation is to look at theratio of disposable personal income to GNP. if their’explanation is valid, this r-atio should incr’ease whenvelocity-is falling and decrease when velocity is rising.As char-t 4 indicates, however, this has riot gener-ally
happened during the l980s. While there was an initialexpansion in disposable income following the tax cut,the ratio of disposable income to GNP has generallydeclined since 1982.s
‘Recently. McGibany and Nourzad (1986) have provided estimatesindicating that the demand for money is inversely related to theaverage tax rate.tRasche (forthcoming) rejects the tax cut hypothesis by arguing that,for it to explain the velocity decline, marginal tax rates ~ouldhave hadto have fallen continuously over the 1 980s.
Others have argued that the recent velocity declineis related to a sharp rise in financial transactionsr’elative to total output. According to this view, the Iise
in financial transactions caused an increase in the
demand for- money relative to GNP. One way to assessthis claim is to compare velocity measures usingbroad measures of financial and non-financial trans-actions in place of GNP? These alternatives ar-c pre-sented in chart 5. The non-financial transactions ve-locity measur’e shows the same pattern as the GNPvelocity measur’e. Consequently, explanations of thevelocity puzzle that rely on the recent slowing of GNPgrowth relative to the growth of more general non-financial tr’ansactions measures at-c implausible.
The financial transactions velocity measur’e doesnot show the downturn in the 1980s that char-acterizesthe non-financial and GNP-based velocity measures.Nor’, however, does it show substantial incr’eases dur-ing the 1980s which would be required if the rse infinancial transactions is to account for the decline inMl velocity. tn fact, the annual growth rate of thefinancial transactions velocity measure has averaged
~Thesedata were obtained from the Board of Governors of theFederal Reserve System.
9

FEDUNAL RESERVE BNIK CYST. LOUS AUGUST,~,SPIN 1957
chart
Ratios of GNP/Mi and Disposable Income/GNP
chart
1’
,k I
Velocities of financial and Nonfinancial Transaction Debits
Quarterly Data
Nonfinancial transaction debfs/M1253 ________ 5CALE~
p.-’/ ,‘I
220 — ~‘-.----
,rn/1
190
I
lee
130 -,
// ‘~
—100—
~
70 ‘~‘
transaction deWs/Mt4scutn
I I I
“
‘
/1
-~--~z-——--~—‘
%\—\--—-.—
‘
\\
•
I I I
Re tie7.5 —
Quarterly Data Ratio— .74
7.0
6.3
6.0
5-c
4.5
r 4_~.
f~I’
IIIi
—~ 11171I~
IiI-~ 3k(V~
f\I ~. 1 II’. S 1 .._...iL.4.._...4
[ Vi’,’1% J
I
vj’\ I V
.73
.12
.71
.70
.69
I
-7/ti
4 Disposable incoine/GNP5cALE$
I I I I I ~1961 63 65 67 69 71 73 75
.68
.67
.66
I I I I I I I 6517 19 81 83 85 1981
I I I
Relic230
Ratio
23.0
21.5
20.0
18.5
17.0
15.5
14.0
12.5
11.01910 11 12 73 74 15 76 77 78 19 80 81 82 83 84 85 86 1987
10

FEDERAL RESERVE BANK OF ST. LOUIS AUGUST/SEPTEMBER 1987
about 10 percent since 1981, somewhat below its 12percent annual gr-owth rate fn’om 1970 to 1981. if thismeasure accurately represents total financial transac-tions, its velocity movement does not support the vtew
that the velocity problem resulted from a shift fi-omnon-financial transactions to financial transactions.
A somewhat different way to assess whether a tise in
financial transactions produced the fall in velocity isshown in chart 6; it compares the movement of veloc-ity with that of the annual ratio of the value of shares
sold on the New York Stock Exchange (NYSEI to GNPsince 1926.” While the ratio of NYSE sales to GNP hasrisen somewhat during the 1980s, there has been no
consistent relationship between this ratio and velocityover the past 60 year’s.
GNP Vs. Wealth
Another potential specification problem arises fromthe use of GNP to calculate velocit instead of using a
loll has been argued that the recent decline in velocity can beexplained by the rise in stock market transactions, see MorganGuarantee (1986).
Ratio1.50
rrteasure of ‘‘permanent income’’ or u’ealth. The per’—manent incorlie theor of consumer demand suggeststhat individuals primarily base their consumption de-cisions on their- permanent incorire or wealth, ratherthan on cur-rent income. Analogously, the demand formoney may’ be rnor-e closely related to permanentincome or wealth.’ Panel A in figure 1 illustrates thetheor-elical r-elationship between permanent incomearid measured income during cyclical fluctuations. Ifthe demand for monr-w depends upon pet-manentincome, it will fluctuate less than will current incorireover the business cycle. Thus, measured velocity willrise (fall) as measured income increases )decreases~r-elative to permanent income because the amount ofmoney held will change less than tneasured income.
Chan’t 7 displays both the usual velocity nleasw-eand one based on permanent income estimates.”Once again, it does not appear that the velocity de-cline in the l9SOs is explained by movements in cur-—
IlFor example, see Friedman and Schwartz (1982, p. 38).
“The measure of permanent income used here was suggested byDarby (1972).
chart o
Ratios of GNP/M1 and NYSE/GNP~et~ — Annu& Data
6
A
A
‘1--------------
4’L11~
I1117
L1
éA—A~/\ GNP/Mi
$scAtr._A~_L
At/‘
2I/
1.25
1.00
.75
.50
.25_1 ~
C Ill Ill1926 30 34 38 42 46 50 54
H’r4
NYSE sales/GNPsc.AmrlL—~---
— F11,11,111,1 tlt
‘~N.__~
111.111
J~
III II!
58 62 66 10 74 78.00
82 1986
11

FEDERAL RESERVE SANK Cf St LOUIS AUGUSTIUFTEMPIR 1957
Figure
Cyclical Movement in Actual GNP and Measured Velocityand the Effect of a One-Time Increase in Permanent Income
Real ClIP
~rmanent?NP~
to 1 timeI Actual
OMP velocity t
chart 7
to(A~
time
Velocity
I GNP
‘ I time
PermanentI I ONP velocity
~flelocity
(6)time
Velocities of GNP/M1 and Permanent Income/MiRatio1.5 —
Quarterly Data ____________ .
y
‘C
—.—-
SWM1
/,————‘ Perman income/Mi
‘,—‘
7
III III III III ~flJ~JII III1961 63 65 61 69 11 73 75 11 19 81 83 85 1987
Real GNP
Velocity
Permanent OMP
1.0
6.5
6.0
5.5
5.0
4.5
4.0
3.5
3.0
1.0
6.5
6.0
5.5
5.0
4.5
4.0
3.5
3.0
12
FEDERAL RESERVE BANK OF ST. LOUIS AUGUST/SEPTEMBER 1987
rent relative to permanent income. Although thedowntur-ns in the permanent income velocity mnea-sur’e are less pronounced than those in the currentincome velocity measure, the general downwat-d shiftin velocity during the 1980s shows up clearly in thepermanent income v’elocitv measure.
‘l’her’e is an explanation consistent with the per-ma-nent income or wealth approach to the demand formoney and the observed decline in the income veloc—
its’ of money in recent years. Suppose that a rise inper-manent income or wealth relative to current in-come produced a sharp rise in the demand formoney.” In this event, depicted in panel B in figure 1,ther’e would be am! associated drop in current incomevelocity.
Because wealth is the present value of the expectedfuture net income, it will incr’ease either’ if expectedincome increases or the expected real interest rateused to discount futur’eincome declines. If ther’ewas arise in expected income withotit a cor-r-esponding in-crease in measured income during the 198Os, velocitywould have fallen as the demand for- money increasedrelative to GNP. Eventually, mneasur’ed income will riseor expected income will decline as individuals realizethat their expectations will be unfulfilled.” Conse-quently, after sufficient time has elapsed, velocity willreturn to its fornier’ path.
If the r-ise in wealth is dire solely to a sharp fall insociet)”s preference for’ current relative to future con-sumption, however, the path of measured incomewould he unaffected and the level of velocity would be
permanently below its former path. This possibilityseems unlikely, because it implies a per-nmnent fail inthe real interest rate.”
“Rasche (1986). Santoni (1987) and Kopcke (1986) also considerthe wealth explanation. Though their approaches are different, bothRasche and Santoni relect the wealth explanation for the velocitypuzzle. Kopcke, on the other hand, finds evidence to support it. Hiswealth measure, however, includes financial assets that have off-setting liabilities; consequently, at best, it represents a proxy forfinancial transactions.
“Since wealth is the discounted present value of the stream ofexpected future income, an exogenous increase in wealth relative tocurrent income can result only from a tall in the “real” interest rate oran increase in the expected future income stream. If these latterexpectations are correct, measured income will eventually increase,and velocity will eventually return to its long~runlevel as either thenominal money stock expands or the price level falls. If the expecta-tions prove to be wrong, this too will be discovered and velocity willrise subsequently.
“The permanent tall in the real interest rate necessary to explain thefall in velocity is inconsistent with recent estimates of the ex ante realinterest rates during the 1980s. See Holland (1984).
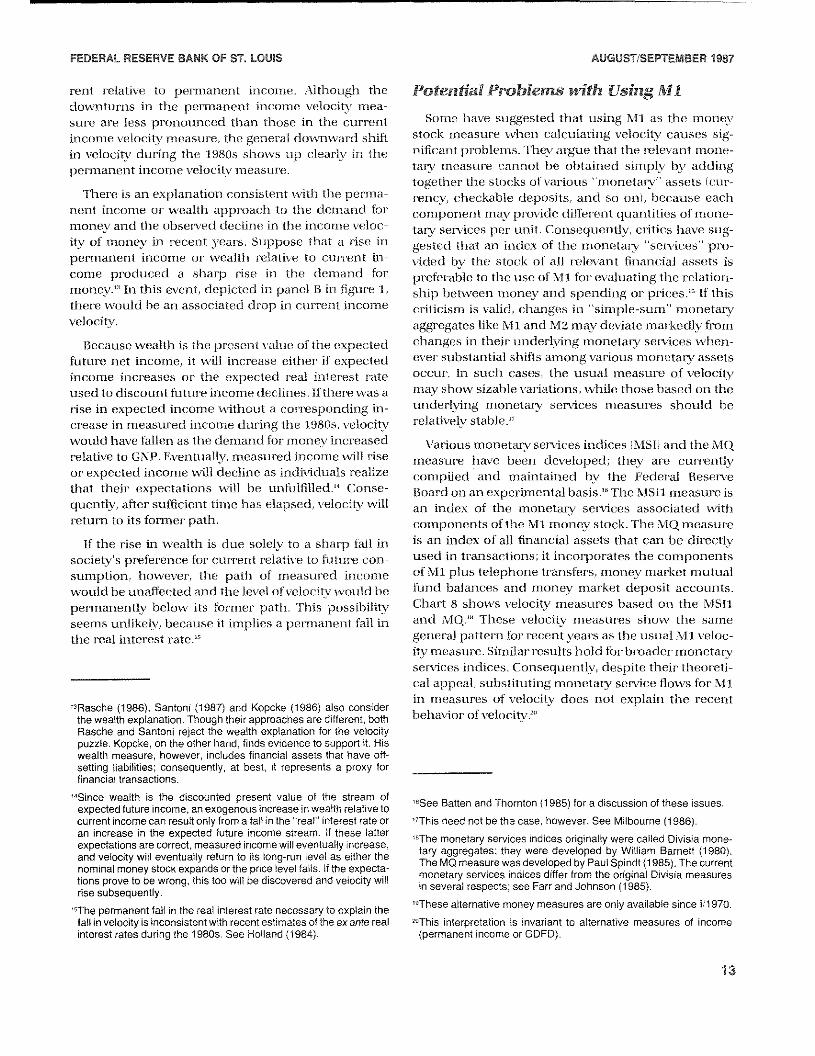
Potential Problems with UsingMl
Some have suggested that using Ml as the monostock measure when calculating velocity causes sig-nificant pr’oblems. ‘t’hev ar-gue that the relevant mone—tan’ measur’e cannot lie obtained simply by addingtogether’ the stocks of var-ious ‘monetar’ assets cur’—r’ency, checkable deposits, and so on), because eachcomponent may pr’ovidie differ’ent quantities of rnone-tan’ services per unit. Consequently, cr’itics have sug-gested that an index of the monetary ‘‘services’’ pro-vided by the stock of all relevant financial assets ispi-eferable to the use of Ml for evaluating the relation-ship between money and spending or- pr’ices.” If thisci-iticism is valid, changes in ‘‘simple—sum’’ monet~u’yaggregates like Ml and M2 may deviate markedly fi’omchanges in their underlying monetary services when-ever’ substantial shifts among various monetary assetsoccur’. In such cases, the usual measure of velocitymay show sizable variations, while those based on theunderlying monetary services measures should berelatively stable.”
Various monetary services indices )MSI) and the MO,measirr-e have been developed; the)’ are cur’r’entlycompiled and maintained by the Federal Reserve
Board on an experimental basis.” The MSI1 measure isan index of the monetary services associated withcomponents of the Ml money stock. The MQ measur-eis an index of all financial assets that can be directlyused in transactions; it incorporates the componentsof Ml plus telephone tr’ansfer’s, money market mutualbind balances arid money mar’ket deposit accounts.Chart 8 shows velocity measures based on the MSI1and MQ.” These velocity measur-es show the samegeneral pattern for recent years as the usual Ml veloc-ity measure. Sinular’ results hold forliroadermonetaryservices indices. Consequently, despite their theoreti-cal appeal, substituting monetary service tlows for Mlin measures of velocity does not explain the recentbehavior of velocity.”
“See Batten and Thornton (1985) for a discussion of these issues.“This need not be the case, however, See Milbourne (1986).“The monetary services indices originally were called Divisia mone-tary aggregates; they were developed by William Barnett (1980).The MO measure was developed by Paul Spindt (1985). The currentmonetary services indices differ from the original Divisia measuresin several respects; see Farm and Johnson (1985).
“These alternative money measures are only available since 1/1970.
“This interpretation is invariant to alternative measures of income(permanent income or GDFD).
13

FEDERAL RESERVE BANK OF ST. LOUIS AUGUST/SEPTEMBER 1967
dhart 8
Velocities
Ratio1.7
1.6
1.5
1.4
1.3
1.2
1.1
1.0
.9
of Monetary Indexes MO, MSI 1 and Ml
STRUCTURAL SHIFTS AND THEVELOCITY PUZZLE
Some analysts have suggested that there have beenone on’ mor’e sttttctural shifts in the money/incomer’elationslup. tJnlike the specification pr’ohlems previ-ously discussed, this explanation presumes that thefundamental r’elationship hetween money and in-come has changed even if the demand for money iscorrectly specified in terms of Ml and CNP.” For a
“One structural shift argument not considered explicitly in the textwas presented recently byRoley (1985). He suggested that thevelocity puzzle of the 1980s was actually caused by the well-documented, albeit still unexplained, structural shift in the demandfor money that took place in 1974. He argues that the downwardshift in velocity in the 1982—83 period is consistent with the behaviorof Ml velocity from 1974 through 1981; it is inconsistent, however,with Ml velocity before 1974. Roley’s observation does not solvethe velocity puzzle—although about 13 years have passed, we stilldon’t know why money demand shifted in the mid-1970s.
Furthermore, if his suggestion were valid, the mid-l970s’ velocityincrease should have been as dramatic as its drop in the 1980s. Aglance at chart 1 shows that this is not the case. Moreover, Roley’sMl series was derived from the flow of funds accounts, Whenconventional money stock and money demand equations are usedinstead, his results are not confirmed.
different structural shift argument, see shaded inser’ton the opposite page.
Financial Innovation and Deregulation
Several analysts have suggested that the introduc-tion of NO%’Vs, Super- NOWs and money market depositaccounts )MMDAs) and the removal of regulation Qinterest rate ceilings in recent years have pr’oduced a
shift in the relationships between Ml and both spend-ing and inflation. In particular, the redefinition of Mlto include interest-bearing checkable deposits (NOWsand Super- NOW5I as well as non-interest-bearing de-
mand deposits and currency is alleged to have alteredsignificantly its “moneyness;” now Ml is presumed toinclude a significant amount of savings balances,”Consequently, changes in Ml resulting from changesin these savings balances are likely to have a smaller
“The reader should note the similarity between this and the specifica-tion problem. The argument here is that savings balances are noweffectively hidden among transactions balances so that a given levelof interest-bearing checking account balances effectively can repre-sent different amounts of “transactions money.” This is a specifica’tion problem, and results from a fundamental change in the institu-tional structure.
Quarnerly Oata Rotio1.7
1.6
1.5
‘.4
1.3
1.2
1.1
1.0
.91970 71 12 13 74 75 76 77 18 79 80 81 82 83 84 85 86 1981NOTE, Data normalized n
1-,t quarter 1970=1.
14

FEDERAL RESERVE BANK OF ST. LOUIS AUGUST/SEPTEMBER 1987
impact on output and prices than previously.” Specifi-cally, then’e maybe extended pen-iodswhen significantincr-eases in Ml produce little or no associated growthin spending or- inflation; on these occasions, velocitywould decline substantially.” Moreover, if the savingsportion of Ml is related to GNP differently than its
“From another perspective, the growth rate of old M2 velocity had atrend growth rate of zero; see Ott (1982). Some have argued thatnew Ml is close to old M2 — old Ml plus time and savings deposits,so perhaps the trend growth rate of its velocity, too, will be aboutzero. While the period since 1981 is too short to establish a trend,the growth rate of the new Ml velocity over this period has beenabout —2.4 percent.
“While the experimental monetary aggregates should reduce oreliminate such problems, this does not seem to be the case. SeeBatten and Thornton (1985, pp. 32—33) for a discussion of this point.
transaction components, the relationship betweenthe growth n’ates of Ml and GNP may be permanentlyaltered.
These savings balances appear only in the “other
checkable deposits” (00)1 component of Ml. Thus,the validity of this explanation can be examined bycomparing the behavior of velocity measures usingMM (which consists of curnency and non-interest-hearing checkable depositsi Or’ currency alone withthat of the Ml velocity measure during the lYSOs. By
increasing the cost of holding currency and demanddeposits, the intn-oduction of interest-bearing checka-ble deposits 1NOWs and Super NOWsI should haveinduced a relative shift fiom demand deposits andcurrency into these new accounts; this, in turn,should produce a significant rise in currency and MMvelocity measures. Once individuals’ portfolios are
15
FEDERAL RESERVE BANK OF ST. LOUIS AUGUST/SEPTEMBER 1987
chart 9
Velocities of GNP/M1 and GNP/M1A
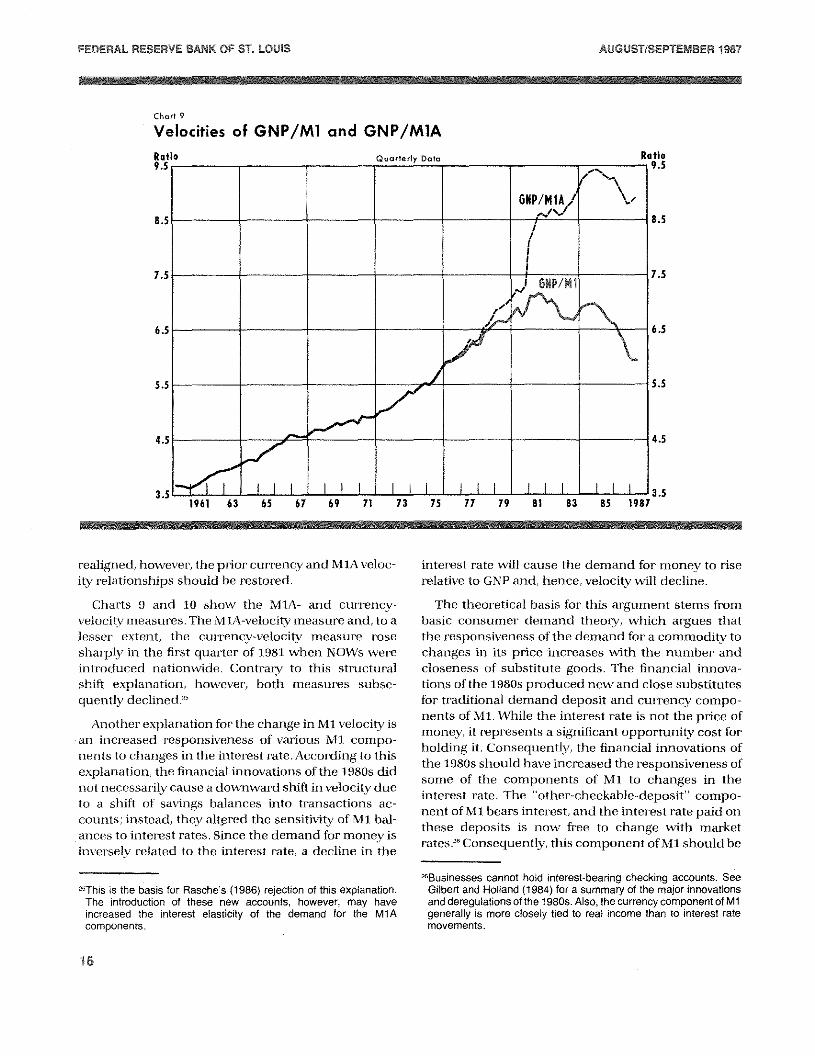
realigned, however, the prior’ currency and MM veloc-ity relationships should be restored.
Charts 9 and 10 show the MM- and currency-velocit measures. The MIA-velocity measure and, to alesser extent, the cur’rency-velocitv measure rosesharply in the first quarter of 1981 when NOWs were
introduced nationwide. Contrary to this structuralshift explanation, however’, both measures subse-quently declined.”
Another explanation for the change in Ml velocity isan increased r-esponsiveness of various Ml compo-
nents to changes in the interest rate. According to thisexplanation, the financial innovations of the 1980s didnot necessarily cause adownward shift in velocity dueto a shift of savings balances into transactions ac-counts; instead, they altpred the sensitivity of Ml bal-ances to interest rates. Since the demand for money isinversely related to the interest rate, a decline in the
“This is the basis for Rasche’s (1986) rejection of this explanation.The introduction of these new accounts, however, may haveincreased the interest elasticity of the demand for the M1Acomponents.
interest r’ate will cause the demand for money to riserelative to GNP and, hence, velocity will decline.
The theoretical basis for this argument stems frombasic consumer’ demand theory, which argues that
the responsiveness of the demand for a commodity tochanges in its price increases with the number and
closeness of substitute goods. The financial innova-tions of the 1980s produced new and close substitutesfor traditional demand deposit and cur-rency compo-nents of Ml. While the interest rate is not the price of
money, it represents a significant opportunity cost forholding it. Consequently, the financial innovations ofthe l980s should have increased the responsiveness of
some of the components of Ml to changes in theinterest rate, The “other-checkable-deposit” compo-nent ofMl bears inter’est, and the interest rate paid onthese deposits is now free to change with marketrates.” Consequently, this component of Ml should be
2eBusinesses cannot hold interest-bearing checking accounts. SeeGilbert and Holland (1984) for a summaryof the major innovationsand deregulations of the I 980s, Also, the currency component of Mlgenerally is more closely tied to real income than to interest matemovements,
Ratio
9.5
8.5
7.5
6.5
5.5
4.5
3.51961 63 65 67 69 11 13 75 77 19 81 83 85 1987
16

FEDERAL RESERVE BANK OF ST. LOUIS AUGUST/SEPTEMBER 1987
chart roVelocities of GNP/M1 and GNP/Currency
relatively unresponsive to interest rate movements.This could be mitigated by the fact that r’ates on thesedeposits appear to have been slow to adjust tochanges in other market interest rates.
This view suggests that the relationship betweenvelocit and interest rates should have strengthenedsince the financial innovations of the 1980s. Indeed,this pattern is reflected in Chart 11, which shows Mlvelocity and the three-month Treasury bill rate. Priorto 1981, velocity appears to be unrelated to move-ments in the T-bill r’ate. Since 1981, however, the two
have similar patterns. This is consistent with a nutn-ber of studies which report an increased interest sen-sitivity of Ml balances during the 1980s.” (Additional
analysis is provided in the appendix.) It remains to beseen whether the apparent change in Ml’s interestsensitivity alone can account for the aberrant behaviorof Ml velocity.
“For example, Hetzel (1987), Trehan and Walsh (1987) and Rasche(1986). Rasche reports mixed results and concludes that this argu-ment needs further study and analysis.
CYCLICAL EXPLANATIONS OF THEVELOCITY PUZZLE
Until now, we have assumed implicitly that thesupply of money passively expands to meet society’sdemand. Another interpretation argues that substan-tial exogenous changes in the supply ofMl can inducecyclical swings in measured velocity because of theirlagged effect on the economy. Forexample, an accelen’-ation in the gr-owth rate of Ml initially may produce aless than proportionate rise in the level of nominalGNP, and, thus, an initial decline in velocity. Eventu-ally, however, when the monetary change has workedits way thr’oughout the economy fully, the longer-runrelationship between Ml growth and the rate ofspending is reestablished, and velocity returns to its
long-run path.
This analysis can explain a continuous fall in veloc-
ity relative to its underlying trend only if Ml growth iscontinuously accelerating. The “ever-and-ever-fasterMl growth” explanation for the velocity decline in the
Ratio26
25
24
23
22
21
20
19
18
171961 63 65 61 69 71 13 75 77 79 81 83 85 1987
17

FEDERAL RESERVE BANK OF ST. LOUIS AUGUST/SEPTEMBER 1987
chart niVelocity of GNP/M1 and the Three-Month Treasury Bill Rate
ouarterry Data
7.0
6.5
6.0
5-5
5.0
4,5
4,0
3,51961 63 65 67 69 71 73 75 11 79 81 83 85 1981
14
12
10
8
6
4
2
0
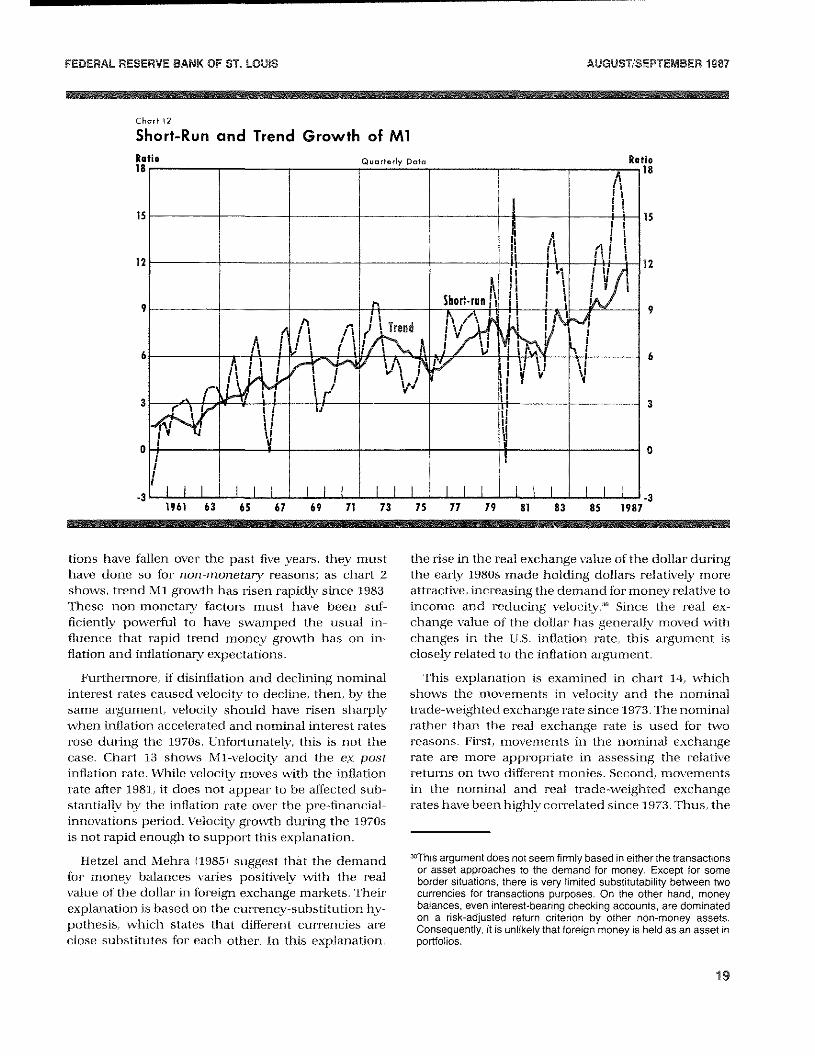
1980s is examined in chart 12. Although money growthhas been rapid since 1982, it does not appear to havebeen accelerating fast enough relative to previousyears to produce the recent sharp decline in velocity?
Expected Inflation and Velocity
Another explanation is that velocity’s recent behav-ior results from changes in the public’s expectations ofinflation. According to this view, the demand formoney is inversely related to the expected rate of
~eThereis a 4 percentage point spread between peak trend-MIgrowth in the 1980s and the late 1 970s. Hence, even if there were nonominal output response to the more rapid Ml growth overthe entireperiod, the acceleration in Ml growth, at most, could account for a 4percentage point decline in trend velocity growth; that is, from about3 percent to about — I percent. In addition, this explanation implies asignificant lengthening in the estimated lag on money growth in theSt. Louis equation during the 1980s, which has not been confirmed.
Another cyclical explanation not considered explicitly in the texthas been suggested by Friedman (1983), Mascaro and Meltzer(1983) and Tatom (1983a, i983b); in their view, an importantinfluence on the demand for money is monetary uncertainty. Sup-pose that people increase their money holdings relative to theircurrent income when they become more uncertain about their futureincomes. If monetary uncertainty increased sufficiently in recentyears, this could explain the velocity puzzle,
inflation. Thus, when inflation (and presumably in-flationarv expectations as welL is declining, the de-mand for money should rise, and the velocity ofmoney should fall. Since the nominal interest rate canbe thought of as composed of the real r’ate plus a
pr’emium for the expected rate of inflation, this expla-nation is closely aligned to the interest sensitivity
argument. The principal difference between them isthat pr-oponents of the expected-inflation explanationdo not argue that the relationship has undergone astructural change.” Judd (19831, Tatom i1983a, l983h1and Friedman (19831 have argued that the decline invelocity in the 1981—83 period can he attributed pri-manly to disinflation and the associated decline inmarket interest rates that substantially lowered theopportunity costs of holding money relative to GNP.
In one sense, this explanation is specious or, at thevery least, suspicious if extended to velocity move-ments in more recent yeans. If inflationary expecta-
“The expected rate of inflation also could have an independent effecton the demand for money, e.g., m’ f (i, “1’ where trr is theexpected rate of inflation. This issue has not been resolved.
Re tie7,5
Rate16
II /I
----
‘4
r’ \ /
,~_s/r
t\
till \I
$sCA’E
—II’ I•~1o.A1I
~
4II/
1’
GNP/
— •)
II~I,
I‘III
~,~A____
\1\\.11J It
II IIif iI
\p~j1-Bill role
sCAtE~
:\
I‘I‘‘~
~II
‘I
\/
4.
~C Ill Ill Ill Ifl III Ifl
18
FEDERAL RESERVE BANK OF ST. LOUIS AUGUST/SEPTEMBER 1987
tions have fallen over’ the past five years, they musthave done so for non-monetary reasons; as char-t 2
shows, trend Ml growth has risen rapidly since 1983.These non-monetary factors must have been suf-ficiently powerful to have swamped the usual in-fluence that rapid trend money growth has on in-flation and imeflationary expectations.
Furthermore, if disinflation and declining nominalinterest rates caused velocity to decline, then, by thesame argument, velocity should have risen shar’plywhen inflation accelerated and nominal interest n’atesrose during the 1970s. Unfortunately, this is not thecase. Chart 13 shows MI-velocity and the e~postinflation rate. While velocity moves with the inflationrate after 1981, it does not appear to be affected sub-stantially by the inflation rate over the pre-financial-innovations period. Velocity growth during the 1970sis not rapid enough to support this explanation.
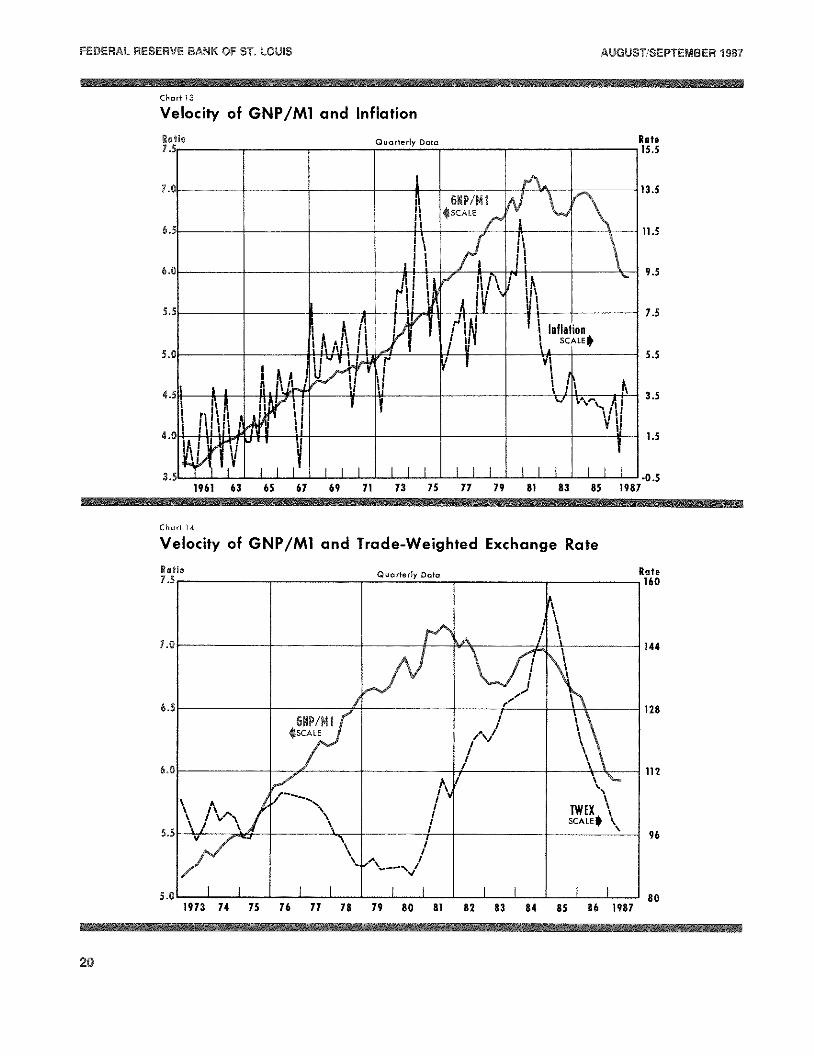
Hetzel and Mehra 1l985i suggest that the demand
for money balances varies positively with the realvalue of the dollar in foreign exchange markets. Their’explanation is based on the currency-substitution hy-
pothesis, which states that different currencies areclose substitutes for each other. In this explanation,
the rise in the real exchange value of the dollar duringthe early 1980s made holding dollars relatively more
attractive, increasing the demand for money relative toincome and reducing velocity.” Since the real ex-change value of the dollar has generally moved withchanges in the U.S. inflation rate, this argument isclosely related to the inflation am’gument.
This explanation is examined in chart 14, whichshows the movements in velocity and the nominaltrade-weighted exchange rate since 1973. The nominalrather than the real exchange rate is used for tworeasons. First, movements in the nominal exchangerate are more appropriate in assessing the relativereturns on two different monies. Second, movementsin the nominal and real trade-weighted exchangerates have been highly correlated since 1973. Thus, the
“Thisargument does not seem firmly based in either the transactionsor asset approaches to the demand for money. Except for someborder situations, there is very limited substitutability between twocurrencies for transactions purposes. On the other hand, moneybalances, even interest-bearing checking accounts, are dominatedon a risk-adjusted return criterion by other non-money assets.Consequently, it is unlikely that foreign money is held as an asset inportfolios.
Chart 12
Short-Run and Trend Growth of MlRatio Quarterly Data18 — 4
ItIII IIn15
12
9
6
3
0
‘.3
r~,.çNt~t’
S
lii,
‘~4:III
V
P1 ~ill it
I I (II I / I,1 ‘~
I,IrII~‘
,‘
:1!llremrd
‘/~‘
1~~~~~Il~n ~I
I
~ III II
II IShort-run J\ ~
~~‘2\~vt~~~/2~L
V~j
IIII~jIII
II
NIII IelIrini
‘pII
‘~I~I
~vi
II
t
I
I .!_I~ !II !I~ lit tI~, I,t[
Ratio
— 18
15
12
9
6
3
0
-31961 63 65 67 69 71 73 75 77 79 81 83 85 1987
19
FEDERAL RESERVE BAtIK CF sr. LOUIS AUOUSTISEPTEMSIR 1957
Chart IS
Velocity of GNP/M1 and Inflation
Quarterly Data
Chart 4
Velocity of GNP/Ml and Trade-Weighted Exchange Rate
Ratio7
Rote
15.5
13.5
11.5
9-5
7.5
5.5
3.5
1.5
-0.51961 63 65 67 69 71 73 75 77 79 81 83 85 1987
Ratio7 Quarterly Data
Rote
160
144
128
112
96
801973 74 75 76 77 78 79 80 81 82 83 84 85 86 1987
20

FEDERAL RESERVE BANK OF ST. LOUIS AUGUST/SEPTEMBER 1987
Chart 5
Velocities of GNP/M~Aand Permanent Income/M1A
general pattern of exchange rate movements is thesame whether the nominal or real exchange rate is
used.
Chart 14 shows that the exchange rate explanationdoes not provide a satisfactory answer to the velocitypuzzle. From 1973 to 1981, exchange rate movementsappear to have no influence on velocity. While velocitydid decline from 1981 to 1983, when the exchange ratewas rising, it also fell sharply in 1985 and 1986 whenthe exchange rate was plummeting.
TWO EXPLANATIONS MAY BE BE1TERTHAN ONE
Darby, Mascaro and Marlow 1987) have recentlysuggested that the velocity puzzle of the l980s is aproduct of financial innovation and cyclical effects inmeasured velocity. Incorporating both effectsr chart 15compares the usual velocity measure with a measurederived by dividing permanent income by MM. Thereis a sharp rise in the permanent income/MIA velocitymeasure beginning with the nationwide introductionof NOW accounts, The movement in this measure
following that event is consistent with a gradual ad-justment to the initial and subsequent innovations
that increased the cost of holding M1A, such as theintroduction of Super NOWs in January 1984 and thereduction of the minimum balance requirements on
these accounts in January 1985.
The permnanent income/M1A velocity measure, un-like virtually all velocity measures shown in the pre-vious charts, does not decline during the bulk of the1980s. This measure does not decline until the lastthree quarters of 1986; however, it turns up againduring the first half of 1987. Darby, Mascaro andMarlow suggest that the 1986 decline can be explainedby the extremely rapid MIA growth during the lastthree quarters of the year. Consequently, a combina-tion of the effects of financial innovations, cyclicalmovements in GNP and sharp acceleration in M1Agrowth could account for much of the velocity puzzleof the 1980s.
SUMMARY AND CONCLUSIONS
This article reviews a number of suggested explana-tions of the puzzling downturn in Ml velocity during
Ratio10
RatioQuarterly Data 10
9
8
7
6
5
4
31961 63 65 67 69 71 13 75 11 19 81 83 35 1987
21

FEDERAL RESERVE BANK OF ST. LOUIS AUGUST/SEPTEMBER 1987
the 1980s and attempts to assess the credibility ofeach. Alone, none of these explanations can accountfor the behavior of Ml velocity. Perhaps, instead, ~sev-eral influences have combined to produce theanomalous velocity behavior that has puzzled manyresearchers.
If there are several influences at work, financial
innovations and cyclical variations in measured in-come seem to be among the best candidates. Thiscombination works well in explaining the velocitypuzzle through the first quarter- of 1986. when com-
bined with cyclical variation in velocity induced byrapid money growth, it may explain the behavior ofvelocity through last year. Another explanation thatdeserves further scrutiny is the possible increasedinterest sensitivity of Ml balances as a result of mone-tary innovations during the 1980s.
REFERENCES
Barnett, William A. “Economic Monetary Aggregation: An Applica-tion of index Number and Aggregation Theory,” Journal ofEcono-metrics (September 1980), pp. 11-48.
Batten, Dallas S., and Daniel L. Thornton. “Are Weighted MonetaryAggregates Better Than Simple-Sum Ml?” this Review (June/July1985), pp. 29—40.
Darby, Michael R. “The Allocation of Transitory Income AmongConsumers’ Assets,” American Economic Review (December1972), pp. 92&—41.
Darby, Michael R., Angelo R. Mascaro, and Michael L. Marlow,“The Empirical Reliability of Monetary Aggregates as Indicators:1983—1986,” U.S. Department of Treasury Research Paper No,8701 (1987).
Darby, Michael Fl., William Poole, David E. Lindsey, Milton Friedman,and Michael J. Bazdarich, “Recent Behavior of the Velocity ofMoney,” Contemporary Policy Issues (January 1987), pp. 1—33.
Farr, Helen T., and Deborah Johnson. “Revisions in the MonetaryServices (Divisia) Indexes of Monetary Aggregates,” mimeo,Board of Governors of the Federal Reserve System (1985).
Friedman, Milton. “Why a Surge in Inflation is Likely Next Year,”Wall Street Journal (September 1, 1983).
________ “The Quantity Theory of Money — A Restatement,” inStudies in the Quantity Theory ofMoney (The University of ChicagoPress, 1956), pp.3—21.
Friedman, Milton, and Anna J. Schwartz. Monetary Trends in theUnited States and the United Kingdom, 1867—I 975 (University ofChicago Press. 1982).
Gilbert, R. Alton, and A. Steven Holland. “Has the Deregulation ofDeposit Interest Rates Raised Mortgage Rates?” this Review(May 1984), pp. 5—15.
Haraf, William S. “The Recent Behavior of Velocity: Implications forAlternative Policy Rules,” manuscript (1986).
Hetzel, Robert L. “Will Recent High Growth Rates of Money ReviveInflation?” Contemporary Policy Issues (January 1987), pp. 41—53.
Hetzel, Robert L., and Yash Mehra. “U.S. Inflation and the RealExchange Rate,” manuscript, July 1985.
Holland, A. Steven, “Real Interest Rates: What Accounts for TheirRecent Rise?” this Review (December 1984), pp. 18—29.
Judd, John P. “The Recent Decline in Velocity: Instability in theDemand for Money or Inflation?” Federal Reserve Bank of SanFrancisco Economic Review (Summer1983), pp. 12—19.
Kopcke, Richard W. “How Erratic is Money Growth?” Federal Re’serve Bank of Boston New England Economic Review (May/June1986), pp. 3—20.
Kretzmer, Peter E., and Richard D. Porter. “Total Transaction Mea-sures and Ml Growth,” Contemporary Policy Issues (January1987). pp. 64—75.
Mascaro, Angelo, and Allan H. Meltzer. “Long- and Short-TermInterest Rates in a Risky World,” Journal of Monetary Economics(November1983), pp. 485—518.
McCalfum, Bennett T. “On ‘Real’ and ‘Sticky-Price’ Theories of theBusiness Cycle,” Journal ofMoney, Creditand Banking (November1986), pp. 397—414.
McGibany, James M., and Farrokh Nourzad. “Interest Rate Volatil-ity and the Demand for Money,” The Quarterly Review of Eco-nomics and Business (Autumn 1986), pp. 73—83.
“Income Taxes and the Income Velocity of Money: AnEmpirical Analysis,” Journal of Macroeconomics (FaIl 1985). pp.523—35.
Milbourne, Ross. “Financial Innovations and the Demand for LiquidAssets,” Journal ofMoney, Credit and Banking (November 1986),pp. 506—11.
Morgan Guarantee. “Demystifying Money’s Explosive Growth,”Morgan Economic Quarterly (March 1986), pp. 10—13.
Nelson, Charles, and Charles Plosser. “Trends and Random Walksin Macroeconomic Time Series: Some Evidence and Implica-tions,” Journal of Monetary Economics (September 1982), pp.139—62.
Ott, Mack. “Money, Credit and Velocity,” this Review (May 1982),pp. 21—34.
Radecki, Lawrence J., and John Wenninger. “Recent Instability inMl’s Velocity,” Federal Reserve Bank of New York QuarterlyReview (Autumn 1985), pp.16—22.
Rasche, Robert H. “Ml -Velocity and Money Demand Functions: DoStable Relationships Exist?”, Journal of Monetary Economics(forthcoming).
“Velocity and the Choice of Policy Regimes,” The CatoJournal (FaIl 1986), pp. 663—66.
Roley, Vance V. “The Demand for Ml by Households: An Evalua-tion of Its Stability,” Federal Reserve Bank of Kansas City Eco-nomic Review (April1985), pp. 17—27.
Santoni, G. J. “Changes in Wealth and the Velocity of Money,” thisReview (March 1987), pp. 16—26.
Spindt, Paul A. “Money is What Money Does: Monetary Aggrega-tion and the Equation of Exchange,” Journal of Political Economy(February 1985), pp. 175—204.
Tatom, John A. “Was the 1982 Velocity Decline Unusual?” thisReview (August/September I 983a), pp. 5—15.
________ “Alternative Explanations of the 1982—83 Decline inVelocity,” in Monetary Targeting and Velocity, Conference Pro-ceedings, Federal Reserve Bank of San Francisco, I 983b, pp.22—56.
Thornton, Daniel L. “Why Does Velocity Matfer?” this Review (De-cember 1963), pp. S—i 3.
Thornton, Daniel L., and Dallas S. Batten. “Lag Length Selectionand Tests of Granger Causality Between Money and Income,”Journal of Money, Credit and Banking (May 1985), pp. 164-78.
Trehan, Bharat, and Carl B. Walsh. “Portfolio Substitution andRecent Mi Behavior,” Contemporary Policy Issues (January1987), pp. 54—63.
22

FEDERAL RESERVE BANK OF ST. LOUIS AUGUST/SEPTEMBER 1987
Appendix
‘ro examine whether velocity has become more interestsensitive in the 1980s, the growth rate of Ml velocity wasregressed on distnhuted lags of its own past growth rateand changes in the three-month Treasury bill rate for threealternative periods from 1/1960 to 11/1987. The results ar-cpresented in table 1. ‘t’he lag length was determined sepa-rately for each period using the final prediction error crite-rion; see Thornton and Batten 1985). The maximum laglength considered was 12 for the two longer periods andfour for the shorter’ one. The pre-1980 results indicate thatneither its own past growth nor that of short-term interestrates significantly influenced Ml velocity growth. The laglengths selected were zero for velocity growth and thecontemporaneous and first lag for the change in the Trea-sury bill i-ate. However, even though the lag coefficient onthe change in the T-hill rate is both positive as expected andstatistically significant at the S percent level, the hypothesisthat the contemporaneous and lag coefficients are jointlyinsignificant cannot be rejected at the S percent level.
sion is extended to include the 1980s. The lag-length selec-tion piocedure now chose a sixth-order lag for’ velocitygi-owth and a fourth-order lag for the change in the T-billrate. Moreover, the hypothesis that these coefficients arejointly insignificant is rejected at the 5 percent level; con-temporaneous and past changes in the Treasury bill rateexert a significant influence on current Ml velocity growth.
When the equation is estimated only for the period of the1980s, there is again evidence of a statistically significanteffect of interest rates on Ml velocity. Indeed, thesum of thedistributed lag coefficients on the Treasury-bill i-ate is posi-tive and significant, indicating a longer-run positive rela-tionship between Ml velocity and interest rates that doesnot appear to have existed in the prior’ period. Hence, theseresults are consistent with the hypothesis that the interestsensitivity of Ml balances changed significantly followingthe monetary deregulation and financial innovations of the1980s. It will take more research, however, to determinehow much of the velocity puzzle can be attributed to thisfactor.A considerably different result emerges when the r-egres-
23