Embed Size (px)
Citation preview

SOLVING BRAND SUITABILITYMachine Learning Propelled By Brand Preferences

2
MACHINE LEARNING IS ONLY AS GOOD AS ITS SIGNALS.
ESPECIALLY WHEN IT COMES TO VAST AMOUNTS OF VIDEOS, WHERE EACH AND EVERY VIDEO HAS COUNTLESS NUANCES

3
WHAT HAPPENS WHEN BRAND SIGNALS ARE USED TO FUEL MACHINE LEARNING?

BRAND
SUITABILITY Brand Suitability is the alignment of an individual brand’s
advertising with content that makes sense for their image,
customer base, and business objectives
BRAND
PREFERENCESBrand Preferences are signals brands communicate about
what content is best for them. Examples include
inclusions lists, exclusion lists, content descriptions, and
preferences about individual pieces of content.
HUMAN IN THE
LOOPHuman in the Loop (HIL) is a process of guiding machine
learning with human supervision. People review content
with brands' preferences as guides in order to train
machine learning algorithms, creating a cycle that
consistently improves its models.
4
GLOSSARYImportant Terms To Know

5
1
2
3
RESEARCH QUESTIONS What are consumer attitudes
toward video ad and content
alignment?
How does “human in the loop”
machine learning perform compared
to traditional targeting methods?
Can “human in the loop” machine
learning prevent ad/content
misalignments?

RECRUIT
Recruited YouTube users
for participation
n=3,858
VIDEO INTERESTS
Participants selected online
video topics based on personal
interests; those not interested
screened out to ensure natural
audience
RANDOMIZATION
Randomization into test and
control groups
• Test = Brand Ad (15s)
• Control = Public Service
Announcement
YOUTUBE EXPERIENCE
Participants visit YouTube
testing page, where participants
select and play video content
based on their interests
BRAND KPIS
Post-exposure survey to
measure traditional branding
metrics and perceptions of
advertising
6
METHODOLOGYRigorous Testing Through Experimental Design

7
WHAT WE MEASUREDIsolating Targeting Effects
DEMO CHANNEL KEYWORD “HUMAN IN THE LOOP”
Reflects typical demographic buy on
YouTube
Who: Brand’s demographic target
What: Popular content on YouTube
Reflects typical channel buy
on YouTube
Who: General YouTube audience
What: YouTube content based on
channels the brand typically targets
Reflects typical keyword buy
on YouTube
Who: General YouTube audience
What: YouTube content based on
keywords the brand typically targets
Reflects buy on YouTube based on
brand-determined suitability signals
Who: General YouTube audience
What: YouTube content selected via
machine learning + human review
based on brand-determined signals
for suitability

8
WE ALSO MEASUREDIsolating the Impact of Content Quality
LOW QUALITY CONTENT
Reflects what happens when ads appear next to what are
traditionally considered low quality videos
Who: General YouTube audience
What: YouTube content identified via machine learning + human
review based on what is traditionally considered low quality content
Reflects what happens when ads appear
next to what are traditionally considered high quality videos
Who: General YouTube audience
What: YouTube content identified via machine learning + human
review based on what is traditionally considered high quality content
HIGH QUALITY CONTENT
ADAD

VIDEO SELECTION FOR TESTING”Human In The Loop” Curated Videos
9
3,858 consumers selected content
based on their interestsVideos segmented
by targeting type
Videos randomly
selected for testing
Human review guided the machine learning to
identify preferences
The marketer provided signals for the best
types of content for the brand to appear next to
Machine learning identified brand
suitable and/or high quality videos
Zefr scanned 3.5
billion videos on
YouTube

10
BRANDS WE INCLUDED
Three Industry Verticals

BRANDS ON YOUTUBETHROUGH THE EYES OF CONSUMERS
Q: Now thinking more specifically about the ads that are played before or during the videos you watch on YouTube, which of the following statements do you believe is true? Select one.General Population n=2,40112
CONSUMERS UNDERSTAND THAT YOUTUBE AD PLACEMENTS ARE INTENTIONAL
Perceived Method for Video Targeting on YouTube
Believe ad placement is _______
Intentional (net score)
Random

BUT, JUST 25% THINK BRANDS ARE DOING A GOOD JOB
Consumer Scorecard For Brand Performance In Ad Placement
25% GOOD JOB (8-10)
59% MODERATE JOB (4-7)
16% BAD JOB (1-3)
Q: In fact, brands have a hand in deciding which videos their ads are placed with on YouTube. Knowing this and thinking about your past experiences on YouTube, do you think brands are doing a good job with selecting videos to place their ads with? Drag the slider to a point on the scale (e.g. 1: Very bad job, 10: Very good job)General Population n=2,40113

HOW SHOULD MARKETERS IMPROVE AD EXPERIENCES ON YOUTUBE?

Informative (3.3)
Tells A Story (4.2)
Entertaining (2.5)
Must Appear Next To High Quality Videos (4.8)
Relevant To The Video I’m Watching (3.6)
Relevant To Me And My Interests (2.6)
Q: What do you most want out of video ads on YouTube? Please rank from most important to least important General Population n=2,40115
WE’VE HEARD IT BEFORE…CONSUMERS WANT RELEVANT ADS. IT’S AS IMPORTANT AS BEING ENTERTAINED
Expectations of Video Ads on YouTube | Average Ranking (1–6)
1 2 3 4 5 6
Media AgencyCreative Agency
Top Ranking Bottom Ranking

Q: What do you most want out of video ads on YouTube? Please rank from most important to least importantQ: Which of the following statements describe your typical experience with video ads on YouTube? Select all that apply.General Population n=2,401
16
HOWEVER, BRANDS HAVE BEEN LEAST SUCCESSFUL MEETING RELEVANCE EXPECTATIONS
Success at Meeting Top Ad Expectation Based on Typical YouTube Experience
Relevant to me/interestsInformative Tells a story Entertaining Relevant to video I’m watching
57%
46%
35%
29%
18%
% Whose Top Ad Expectation Was Met
Of those who want relevance between the ad
and the content the most, only 18% has that
expectation met

TARGETING RELEVANCY WITH BRANDDRIVEN CONTENT PREFERENCES

Within demo target: Demo targeting n=592, Channel targeting n=370, Keyword targeting n=392, Human in the Loop n=393A/B/C/D =statistically significant difference between A/B/C/D at 90% confidence18
REACHING IN-MARKET CONSUMERS IS “BUILT-IN” WHEN BRAND-DRIVEN SIGNALS FUEL MACHINE LEARNING
Targeting Effectiveness Among Demo Target | % In-Market for Advertised Product
DEMO (A)
CHANNEL (B)
KEYWORD (C)
“HUMAN IN THE LOOP”(D)
By targeting the most suitable content
for the brand, ads are naturally
reaching a more relevant audience
75%

Within demo target: Demo targeting n=592, Channel targeting n=370, Keyword targeting n=392, Human in the Loop n=393A/B/C/D =statistically significant difference between A/B/C/D at 90% confidence19
BECAUSE MORE OF THE RIGHT CONSUMERS ARE REACHED, ADS ARE MORE RELEVANT
Ad Was “Relevant to Me and My Interests”
Among Demo Target | % Strongly or
Somewhat Agree
52%
46%
41%
64%ABC
Demo Targeting (A)
Channel Targeting (B)
Keyword Targeting (C)
“Human in the Loop” (D)
Brand suitability
targeting is 23% more
effective than demo and
45% more effective
than keyword targeting
at delivering on ad
relevance
Ad Was Relevant to Me And My Interests
64% ABC
52%
48%
44%

Demo targeting n=297, Channel targeting n=316, Keyword targeting n=330, Human in the Loop n=312A/B/C/D =statistically significant difference between A/B/C/D at 90% confidence20
…WHICH MEANS THE SAME CREATIVE LEADS TO A BETTER AD EXPERIENCE
74%
54%
48%
69%
44%
45%
69%
50%
45%
83% ABC
64% ABC
57% BC
HIGH QUALITY
AUTHENTIC
INNOVATIVE
Impact of Targeting on Ad Opinions | % Strongly or
Somewhat Agree
Demo Targeting (A)
Channel Targeting (B)
Keyword Targeting (C)
“Human in the Loop” (D)

Demo targeting n=297, Channel targeting n=316, Keyword targeting n=330, Human in the Loop n=312A/B/C/D =statistically significant difference between A/B/C/D at 90% confidence21
THE SAME BRAND MESSAGE COMES ACROSS MORE POSITIVELY
52% C
68% C
72%
43%
62%
65%
39%
59%
64%
58% BC
77% ABC
81% ABC
AD MESSAGE RESONATED WITH ME
AD MESSAGE WAS CREDIBLE
AD MESSAGE WAS POSITIVE
Impact of Targeting on Ad Message Perceptions | % Strongly
or Somewhat Agree
Demo Targeting (A)
Channel Targeting (B)
Keyword Targeting (C)
“Human in the Loop” (D)

Demo targeting n=592, Channel targeting n=649, Keyword targeting n=674, Human in the Loop n=636∆ =statistically significant difference between test and control groups at 90% confidence22
THE SAME AD FOSTERS MORE POSITIVE OPINIONS OF THE BRAND
+5%
0%
+4%
-1%
+3%
+7%+7%
+9%
BRAND IS SAVVY BRAND IS THOUGHTFUL
Impact of Targeting on Brand Attributes
| Delta (Test – Control)
Demo Targeting
Channel Targeting
Keyword Targeting
“Human in the Loop”

THE SAME AD DRIVES GREATER IMPACT IN PURCHASE INTENT
23
Impact of Targeting on Purchase Intent |
Delta (Test – Control)
Demo Targeting
Channel Targeting
Keyword Targeting
“Human in the Loop”
Demo targeting n=592, Channel targeting n=649, Keyword targeting n=674, Human in the Loop n=636∆ =statistically significant difference between test and control groups at 90% confidence
+1% +1%
+6%
+11%

THE DANGERS OF MISALIGNMENT

Not Aligned n=1,082, Aligned n=709∆ =statistically significant difference between perceived aligned/not aligned at 90% confidence25
MISALIGNMENT MAY RUN THE RISK OF HURTING BRAND PERCEPTIONS
Brand Perceptions by Perceived Alignment Between Ad and Content | % Strongly or Somewhat Agree
51%
40%
25%
55%
42%
77%
70%
62%
81%
76%
Not alignedAd was _________ with content Aligned
INNOVATIVE SAVVY I WOULD PAY MORE FOR
HAS A GOOD REPUTATION
I TRUST

26
MISALIGNMENT IS PREVENTED WHEN BRAND SIGNALS ARE USED FOR TARGETING
41% C
31%
26%
72% ABC
Ad/Content Perceived as Aligned | % Strongly or
Somewhat Agree
Demo Targeting (A)
Channel Targeting (B)
Keyword Targeting (C)
“Human in the Loop” (D)
Demo targeting n=297, Channel targeting n=296, Keyword targeting n=301, Human in the Loop n=300A/B/C/D =statistically significant difference between A/B/C/D at 90% confidence

Q: How aligned was the ad above with the video titled [content title] that followed? (e.g. the mood of the ad was well aligned with the video)Not Aligned n=1,082, Aligned n=709∆ =statistically significant difference between perceived aligned/not aligned at 90% confidence27
CONTENT AND AD ALIGNMENT CREATES MORE MEMORABLE BRAND EXPERIENCES
Aided Ad Recall by Perceived Alignment Between Ad and Content | % Who Recalled
AD WAS NOT ALIGNED
WITH CONTENT
AD WAS ALIGNED WITH
CONTENT
+65%+59%

Not Relevant n=1,147, Relevant n=644
∆ =statistically significant difference between low perceived relevance and high perceived relevance groups at 90% confidence28
HIGHER RELEVANCE = MORE POSITIVE OPINIONS OF THE AD
Ad Opinions By Perceived Relevance Between Ad And Content | % Strongly or Somewhat Agree
52%
46%
40%
34%38%
28%
85%
71%
75%
73%76%
74%
ENTERTAINING ORIGINAL AUTHENTIC INNOVATIVE RELEVANT TO METELLS ANINTERESTING STORY
Not relevantAd was _________ to the content Relevant

IDENTIFYING THE NUANCES OF CONTENT QUALITY IN VIDEO

Q: How would you rate the video you watched earlier, titled ___, on the following attributes? Drag the slider to a point on the scale (e.g. 1: Very low, 10: Very high).Low Quality 1-4; Medium Quality 5-6; High Quality 7-10Machine Identified “High Quality” Content n=59330
MACHINES WERE SUCCESSFULLY TRAINED TO IDENTIFY CONTENT TRADITIONALLY SEEN AS “HIGH QUALITY”
Consumer Ratings of Content
Machine Identified as “High Quality”
Consumer Rated As Low Quality Content
Consumer Rated As Medium Quality Content
Consumer Rated As High Quality Content
84%
4%
12%

Machine Identified “Low Quality” Content n=603, Machine Identified “High Quality” Content n=593∆ =statistically significant difference between test and control groups at 90% confidence31
LEVERAGING MACHINES TRAINED TO IDENTIFY QUALITY
CONTENT DRIVES KPISImpact of Machine Identified Content | Delta (Test - Control)
Machine Identified As Low Quality Content Machine Identified As High Quality Content
+3%
+5% +5%
+8% +8% +8%
PURCHASE INTENT BRAND IS THOUGHTFULBRAND IS SAVVY

Q: How would you rate the video you watched earlier, titled ___, on the following attributes? Drag the slider to a point on the scale (e.g. 1: Very low, 10: Very high).Machine Identified “Low Quality” Content n=603, Machine Identified “High Quality” Content n=59332
WHILE THERE IS CONSENSUS ON WHAT TRADITIONALLY CONSTITUTES HIGH QUALITY, PERCEPTIONS OF LOW ARE FAR MORE NUANCED
Consumer Perceptions of Content Quality by Machine Identification
Machine Identified As Low Quality Content
0%
20%
40%
10 9 8 7 6 5 4 3 2 110 9 8 7 6 5 4 3 2 1
QUALITY LEVEL PERCEIVED BY CONSUMERSHighest Quality Lowest Quality
Machine Identified As High Quality Content
33
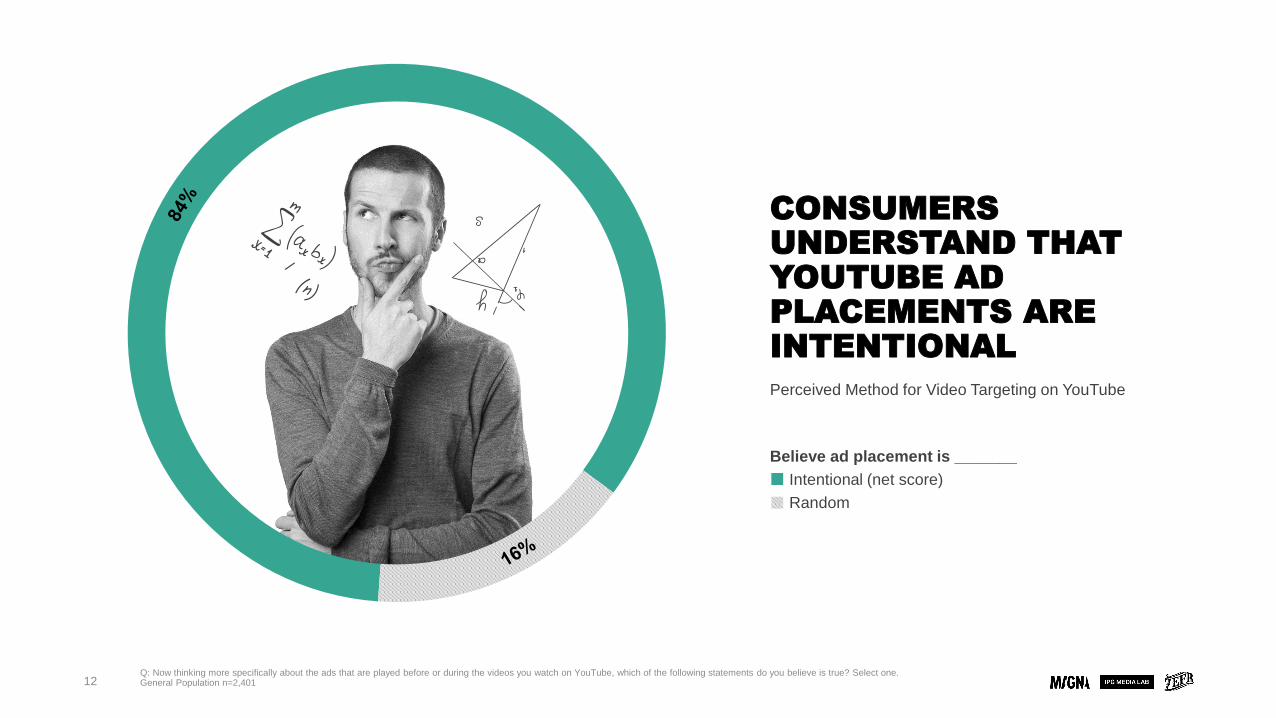
QUALITY IS IN THE EYE OF THE BEHOLDER
There’s an opportunity to expand definitions of what is traditionally considered “Low Quality” content to include videos thatover index on enjoyment and entertainment
Of Machine Identified “Low Quality” Content, Content Rated as High Quality by
Consumers Tends To Be More “Enjoyable” And “Interesting” Than Content Rated
As Low Quality by Consumers
Perceptions Of Machine Identified Low Quality Content
Indexed Delta (Consumer Rated High – Consumer Rated Low)
No way!
Of consumers have a broader definition
of content quality than what is traditionally
considered high quality
55%
But it’s great
though!
Tailored To MeEnjoyable Interesting Would Watch
Again
InformativeUseful
94
81 81
124118
102
INDEXED
to avg. across
all attributes
% Of Content That Machines Identified As Low Quality,
But Consumers Rated As High Quality
Q: How much do you agree or disagree with the following statements about the video titled ____? (% Strongly or Somewhat Agree)Machine Identified “Low Quality” Content n=603

Machine Identified “Low Quality” Content: Consumer rated Low Quality Content n=138, Consumer rated High Quality Content n=334∆ =statistically significant difference between test and control groups at 90% confidence34
CONSUMER POV ON QUALITY IS WHAT MATTERS MOST
When Consumers Define Content More Broadly Than Machines | Delta (Test - Control)
2%
-2%
-7%
+6%
+3%
+8%
PURCHASE INTENT BRAND I WOULD PAY MORE FORBRAND I PREFER
Consumers Rated as Low QualityMachine Identified as Low Quality; _______ Consumers Rated as High Quality To extend reach, brands should
consider broadening their perspective on
content quality

35
IMPLICATIONS
2. Brands know best
When brands determine the signals used to
identify content that makes the most sense for
them, misalignment between content and ad is
curbed and each ad works to its full potential.
1. Relevancy, a work in progress
The industry needs to continue innovating in
order to live up to consumer demands for more
relevant ad experiences. “Human in the Loop”
is a big step in the right direction as it offers
benefits for both consumers and brands.
3. Quality is in the eye of the beholder
Marketers have an opportunity to extend reach
by rethinking what constitutes content as “high
quality”. Low production quality does not equal
low quality in the eyes of consumers – especially
when the content is enjoyable and interesting.

THANK YOU