Embed Size (px)
Citation preview

Your Partner in Insurance
Solvency and
Financial Condition
Report Ageas Insurance Limited
Company Registration Number: 354568
For the year ending 31st December 2016

Solvency Financial Condition Report
2
CONTENTS
SUMMARY 3
A BUSINESS AND PERFORMANCE 6
1 General description and strategy of Ageas Insurance Limited 7
2 Developments and results 8
3 Qualitative and quantitative information about our investment performance as shown in our financial statements
9
B SYSTEM OF GOVERNANCE 11
1 Information on our governance requirements 12
2 Senior insurance management functions (SIMF), control functions (CF) and key function holders (KFH)
14
3 Description of our fit and proper policy 16
4 Information about our risk management system 16
5 Information on the internal control system 24
6 Information about the internal audit function 29
7 Information about the actuarial function 32
8 Information about outsourcing 33
C RISK PROFILE 34
1 Description of the definition, identification, assessment, management and monitoring for each individual category of risk
35
2 Description of any other material information regarding the risk profile 52
D VALUATION FOR SOLVENCY PURPOSES 53
1 Valuation of assets 54
2 Valuation of technical provisions 58
3 Valuation of other liabilities 68
4 Any other material information 71
5 Description of alternative valuation methods 72
6 Quantitative material differences between SII basis and IFRS 73
E CAPITAL MANANAGEMENT 75
1 Information on Capital Management regarding own funds 76
2 Information on SCR and MCR 79
3 Information on internal models used for calculation for SCR and MCR 82
4 The risk of non-compliance with the MCR or SCR and plans to ensure compliance 84
5 Any other material information regarding Capital Management 84
F VALIDATION & AUTHORISATION BY BOARD 85
G APPENDICES 86

Solvency Financial Condition Report SUMMARY
3
SUMMARY
Solvency II came into force with effect from 1 January 2016. The regime has new reporting and public disclosure
requirements and this is the first Solvency and Financial Condition Report required to be published by Ageas
Insurance Limited (AIL, the Company).
1 Business & Performance
AIL is a UK insurance company offering general insurance products to retail and business customers. AIL’s
immediate parent undertaking is Ageas (UK) Limited (AUK). The ultimate holding company of AIL is Ageas SA/NV, a
company incorporated in Belgium.
The Company’s results for the year were adversely affected by the decision to change the personal injury discount
rate (Ogden rate) from 2.5% to minus 0.75% with effect from 20 March 2017. The Lord Chancellor’s decision was
announced on 27 February 2017 and has resulted in an additional cost to claims as at 31 December 2016 affecting
the overall net pre-tax underwriting performance by £140m and reducing the Solvency II ratio to 91%. On 31 March
2017 the Board approved immediate actions to improve the solvency ratio by 25% after discussions with the PRA.
These actions included the issuance of an additional £50m of share capital on 7 April and the purchase of a whole
account stop loss treaty with effect from 1 April. The underlying business remains strong and the Company is
confident in restoring profitability in 2017 through pricing and ongoing underwriting actions.
Gross Written Premiums increased 1.9% compared to 2015 driven by growth in Motor Vehicle Liability Insurance and
Fire and Other Damage to Property Insurance offset by a decline in Assistance and Miscellaneous Financial Loss.
Net underwriting performance was negatively impacted by the recognition of the change in Ogden rate. Excluding
Ogden, Motor lines of business have improved year on year due to improved current year attritional claims
performance. Additionally Fire and Other Damage to Property Insurance has improved reflecting the growth in new
schemes and the absence of any major weather events, which was the main driver for 2015 poor performance.
Decreases in both Miscellaneous Financial Loss and General Liability Insurance were mainly driven by the poor
performance of a Managing General Agent which has led to the recognition of further losses, and the loss of a key
scheme in Assistance has also fed through to the underwriting performance.
Investment income performance (including finance costs) is adverse to prior year primarily due to the impact of lower
market yields on reinvested funds and the impact of higher finance costs resulting from an increase in subordinated
debt. These factors have been partially offset by favourable realised gains arising from trades executed as part of the
Strategic Asset Allocation Review, as well as increased property fund income.
2 System of Governance
During 2016 a combined board and management structure was established and operated by the Ageas UK
businesses. The Combined OpCo Board provides entrepreneurial leadership of the business within a framework of
prudent and effective controls, setting the strategy, ensuring the direction and performance of the business is aligned
to AUK’s objectives and is managed competently and prudently and in accordance with legal and regulatory
expectations.

Solvency Financial Condition Report SUMMARY
4
The Combined OpCo Board has delegated authority to key governance committees in order that they may monitor
and oversee specific aspects without further reference to the Board. The Committees are accountable to the Board
and responsibility rests with the Board.
The Ageas UK Boards have delegated authority and responsibility for key activities to designated senior managers
across Ageas UK, with the allocation of significant responsibilities documented and maintained within the
Governance Map of the Ageas UK business, a copy of which is provided to the regulator on a regular basis.
The Company employs a ‘three lines of defence’ governance model to provide management with reasonable
assurance that the company is run in a proper way. Management and staff within each Ageas function have the
primary responsibility for owning and managing risks (first Line of Defence). Oversight of the effective operation of
the internal control framework is supported by the Risk Management and Compliance functions (second Line of
Defence). The third Line of Defence is provided via independent verification and challenge of the adequacy and
effectiveness of the internal risk and control management framework by Ageas Audit UK.
3 Risk Profile
The Company's primary activity, the acceptance of risk of loss from individuals or businesses, exposes it to a number
of risks which may adversely affect the Company's ability to meet its business objectives. The most significant risks
that the Company is exposed to are non-life insurance liability risks, market risk and credit risk.
The key risks faced by AIL are reviewed quarterly by the Prudential and Conduct Risk Committee and subsequently
by the Board Risk Committee. The monitoring of these risks as assessed by the business (first line) is facilitated by
the quarterly Control and Risk Self Assessment process, focusing on the underlying functional level risks and
controls.
Risks are managed through a combination of policies, processes and reports. Key policies are as follows:
Underwriting Policy
Pricing Policy
Reserving Policy
Reinsurance Policy
Counterparty Default Policy.
The management of Non-life risk at AIL is in conformity with AIL and Ageas SA/NV underwriting and risk taking
management guidance. This includes, amongst other things, risk acceptance rules, claims management guidance on
claim assessment, reinsurance taking activity and management. Financial risks are managed through various
processes & reports (including Risk Appetite Monitoring) and Market and Credit risks are assessed via the Standard
Formula.
A regular review of the counterparty exposure is undertaken within the Credit Risk Committee and actions taken to
deal with any existing and potential breaches. Reinsurance counterparty exposure is monitored quarterly through the
Reinsurance Committee. Counterparty limits relating to investments operation are monitored and reported monthly to
the Investment Committee.
4 Valuation for Solvency Purposes
The valuation of assets and liabilities for Solvency II purposes is the same as IFRS except for:

Solvency Financial Condition Report SUMMARY
5
differences in the valuation of technical provisions and associated reinsurance recoverables;
inclusion of acquisition costs in the valuation of Solvency II technical provisions, whereas under IFRS it is
separately valued according to period of earnings;
fair value adjustments for loans and receivables (measured under IFRS at amortised cost, using the
effective interest method less impairment).
These differences are summarised below:
in GBP million Actual
2016
IFRS Shareholders’ Equity 388.9
Net removal of DACs (145.9)
Net discounting to PV of insurance assets 63.6
Net best estimate of liabilities 60.4
Fair value subordinated debt 2.0
Fair value debt > 3 months (0.2)
Fair value loans to brokers (0.1)
Subordinated liabilities 136.8
SII Own Funds 505.5
5 Capital Management
AIL uses a Partial Internal Model (PIM) to calculate its SCR, approval for which was given by the PRA in December
2015.
The announcement to reduce the Ogden rate from 2.5% to minus 0.75% resulted in the recognition of an additional
cost to current claims at year end 2016. The impact of this additional cost resulted in the SCR coverage falling to
91% and requiring immediate notification to the PRA.
The fall in SCR coverage triggered the Company’s capital contingency plan and plans to improve solvency by 25%
were approved by the Board on 31st March 2017 after discussions with the PRA (see sections E.4 and E.5 for further
details).
The key principle of the Company’s capital management procedures is to ensure that adequate own funds are
maintained to cover the SCR. The Board sets the AIL Target Capital Level allowing for a solvency buffer and AIL will
not pay a dividend that takes its solvency below this level.
The Company uses subordinated debt as a way of optimising the capital structure and ROE of the Company. On 30
September 2016 a further issue of £38.7m subordinated debt was made by the Company to Ageas Insurance
International N.V., the Company’s intermediate parent. The subordinated debt incurs interest at 3.85% above LIBOR,
with the LIBOR rate being reviewed quarterly. From 2026 the interest rate will increase to 4.85% above LIBOR and
will remain at this rate until maturity. Accrued interest is also payable quarterly. The subordinated debt is dated with a
maturity date of 5 November 2046.
Solvency Financial Condition Report BUSINESS & PERFORMANCE
6
A
BUSINESS AND
PERFORMANCE
(Unaudited)

Solvency Financial Condition Report BUSINESS & PERFORMANCE
7
1 Information about our business
Ageas Insurance Limited (AIL, the Company) is a UK general insurance company which is supervised by the
Prudential Regulation Authority (PRA) and the Financial Conduct Authority (FCA), London, UK. The external auditor
of the company is KPMG LLP, Canary Wharf, 15 Canada Square, London, E14 5GL.
1.1 Group structure and ownership
Ageas Insurance Limited legal structure
AIL is a UK insurance company offering general insurance products to retail and business customers. AIL’s
immediate parent undertaking is Ageas (UK) Limited (AUK). AIL is a wholly owned subsidiary of AUK. The ultimate
holding company is ageas SA/NV, a company incorporated in Belgium and which is supervised by the Belgian
regulator, the National Bank of Belgium (NBB).
The legal structure of AIL is as follows:
1.2 Description of our material lines of business (LoB) and material geographical areas where we write business
The material products that are sold by AIL are:
Motor related insurance;
Property related insurance;
General liability insurance; and
Travel and special risks insurance
The majority of AIL’s business is written in the UK with a small proportion written in Ireland.
Ageas (UK) Limited
1093301
100% owned
Ageas Insurance Limited
00354568
51% owned
HCP (Estate Mangement) Limited
08331719
100% owned
Bishopsgate Head Office Limited
00519288
50% joint venture
Brokers Educational Supply Teachers Claims Limited
04176973

Solvency Financial Condition Report BUSINESS & PERFORMANCE
8
1.3 Significant business or other events that have occurred over the reporting period that have had a material impact on the company
On 27 February 2017 the Lord Chancellor announced that the personal injury discount rate (Ogden rate) would
reduce from 2.5% to minus 0.75% with effect from 20 March 2017. The reduction in the discount rate will have the
effect of increasing the cost of personal injury claims, also increasing the ultimate loss ratio for business written up to
the effective date. The immediate effect of this on AIL was an additional cost to claims reserves as at 31 December
2016, impacting the overall net pre-tax underwriting performance by £140m and reducing the Solvency II ratio to
91%. On 31 March 2017 the Board approved immediate actions to improve the solvency ratio by 25% after
discussions with the PRA (see section E.5 for further detail). Further actions will be developed in line with our capital
contingency plan (see section E.4). The underlying business remains strong and the Company is confident in
restoring profitability in 2017 through pricing and ongoing underwriting actions.
On 23 June 2016, the United Kingdom voted to leave the European Union (commonly referred to as Brexit). The
immediate aftermath of the referendum was a sharp decline in the stock market and the value of the pound against
major currencies. The Company was largely immune to these shocks given the investment strategy to predominantly
invest in investment grade bonds and the currency forward contract that is in place to hedge against currency
mismatches. In the longer term the effect continues to be seen in lower gilt yields, negatively affecting reinvestment
yields.
2 Developments and results
Gross Written Premiums
Gross Written Premiums (GWP) in 2016 were £1,409.3m, a 1.9% increase on 2015 (£1,382.6m). The increase on
prior year has been largely driven by growth in Motor Vehicle Liability Insurance and Fire and Other Damage to
Property Insurance offset by a decline in Assistance and Miscellaneous Financial Loss. Motor Vehicle Liability and
Other Motor Insurance has increased as a result of strong retention, rate hardening in the UK market and new
scheme business. New scheme business also contributed to the growth in Fire and Other Damage to Property
Insurance and General Liability Insurance GWP, offset by a declining back book. The decrease in both Assistance
and Miscellaneous Financial Loss was due to the loss of key schemes during the year.
Underlying Net Underwriting Performance
The table below shows the Company’s premiums, claims and expenses for the period ended 31 December 2016. An
analysis by Solvency II lines of business can be found in QRTs S.05.01 (Non-Life and Life) in section G.
£’m 2016 2015 Var
Gross Premiums Earned 1,400.5 1,361.5 39.0
Reinsurers' share of premiums (90.7) (90.6) (0.1)
Gross Claims (1,318.8) (909.8) (408.9)
Reinsurers' share of claims 247.8 29.6 218.1
Expenses (424.7) (429.4) 4.6
Net underwriting performance (185.9) (38.6) (147.3)
These numbers include the effect of the change in Ogden rate which is discussed in section 1.3., above.

Solvency Financial Condition Report BUSINESS & PERFORMANCE
9
Excluding Ogden, Motor lines of business have improved year on year due to current year attritional claims
performance. Additionally, Fire and Other Damage to Property Insurance improved, reflecting the growth in new
schemes and the absence of major weather events.
The overall decrease in underlying net underwriting profitability (excluding Ogden) is mainly driven by the poor
performance of a Managing General Agent relationship which has now been terminated
The underlying COR (excluding Ogden) for 2016 was 103.2% (2015: 102.2%). Including Ogden the COR for the year
was 113.9%.
Employees 2016 – Full Time Equivalent
The total number of employees working for AIL as at 31 December 2016 was 2,178 (2015: 2,238).
3 Qualitative and quantitative information about our investment performance as shown in our financial statements
3.1 Information about the investment performance
Investment income performance (net of finance costs) declined due to the impact of lower market yields on
reinvested funds and the impact of higher finance costs resulting from an increase in subordinated debt. These
factors have been partially offset by higher realised gains and income arising from trades executed as part of a
Strategic Asset Allocation (“SAA”) review.
The total value of financial assets held on the balance sheet increased in the year. This is primarily due to an
increase in unrealised gains driven by a reduction in gilt yields combined with net purchases in the year. The
Company continued to invest in property funds in the year and the investment in these was a significant part of the
net purchases.
3.2 Analysis of our overall investment performance split by relevant class
The following details income and expenses arising from investments by asset class.
Total
Government bonds 9.3
Corporate bonds 51.1
Mortgages and loans 1.4
Property 1.3
Other investments 3.1
Forwards (0.5)
Subordinated debt interest (4.8)
Investment management expenses
(1.6)
Property fund expenses (2.0)
Total 57.3

Solvency Financial Condition Report BUSINESS & PERFORMANCE
10
3.3 Gains and losses recognised directly in equity
Assets available-for-sale
Unrealised Gains 87.5
Unrealised Losses (5.0)
Total 82.5

Solvency Financial Condition Report SYSTEM OF GOVERNANCE
11
B SYSTEM
OF GOVERNANCE
(Unaudited)

Solvency Financial Condition Report SYSTEM OF GOVERNANCE
12
1 Information on our governance requirements
1.1 General Information on our system of governance/ delegation of responsibility and description of the structure of our administrative, management or supervisory bodies
Ageas UK believes that a strong culture of corporate governance and ethical behaviour is fundamental to the way we
do business, and therefore a governance framework, based upon the high level principles as set out within the
Prudential Regulation Authority (PRA) Rulebook, the Financial Conduct Authority (FCA) Handbook, the UK
Corporate Governance Code (where relevant), together with the Ageas Principles of Business Conduct has been
adopted by the Ageas UK Boards.
An Ageas UK Corporate Governance Manual has been established which incorporates these principles and explains
how they are reflected in the organisation and operations of the Ageas UK businesses. The Corporate Governance
Framework operates through individuals fulfilling their responsibilities, and these are outlined within specific job
descriptions, the Ageas UK Governance Map (where applicable), together with other policies, procedures and
processes which record delegated authority.
The decision making framework within Ageas UK is defined by the Ageas UK Boards against high-level parameters
agreed with Ageas Group. It reflects the principle of delegated authority based on competence and appropriate
mechanisms and triggers for escalation. The framework is a tiered approach with ultimate authority in the UK resting
with Ageas (UK) Limited. In summary the key responsibilities are:
Ageas Group
Sets and monitor the overall strategic objectives for Ageas’ operations in the UK.
Ageas (UK)
Ensures the direction and performance of the business is aligned to Ageas Group objectives, overseeing and
approving the Ageas UK strategy, Multi Year Budget (MYB), and major investments.
Combined OpCo Board (inc. AIL)
Provides entrepreneurial leadership of the business within a framework of prudent and effective controls, setting the
strategy, ensuring the direction and performance of the business is aligned to Ageas (UK)’s objectives and is
managed competently and prudently and in accordance with legal and regulatory expectations.
The Board has delegated authority to key governance committees in order that they may monitor and oversee
specific aspects without further reference to the Board. The Committees are accountable to the Board, and
responsibility rests with the Board. The key Committees are:
1.1.1 Audit Committee
Assists the Board in fulfilling its responsibility for oversight of the adequacy and effectiveness of internal controls,
including internal control over financial reporting.
1.1.2 Board Risk Committee
Assists the Board in fulfilling its responsibility for oversight of the adequacy and effectiveness of risk governance and
its capital models, in particular the risk profile relative to the risk appetite determined by the Board.

Solvency Financial Condition Report SYSTEM OF GOVERNANCE
13
1.1.3 Remuneration Committee
Considers and ensures the framework and arrangements that govern the remuneration of the Executive and Senior
Management are appropriate and are aligned with Ageas UK’s long term business strategy, risk appetite and values.
1.1.4 UK Executive Team
Manages Ageas’ UK business, developing and leading the delivery of the strategy and reviewing performance in
keeping with the values, strategies, policies, plans and budgets endorsed by the Ageas UK and Combined OpCo
Boards.
1.1.5 Model Control Board
Assists the Board Risk Committee and in turn the AIL Board in fulfilling its responsibilities in respect of appropriate
model governance, design and operation, providing assurance to the Board and the Board Risk Committee on the
appropriateness and effectiveness of the models included on the Model Register.
1.1.6 Investment Committee
Identifies, develops, and recommends appropriate investment strategies to the Board, and ensures approved
investment strategies are implemented and adhered to by the investment advisers.
1.1.7 Reinsurance Committee
The Board of AIL has delegated the implementation of reinsurance strategy to the Reinsurance Committee. The
Committee identifies reinsurance needs in the context of the overall business strategy, detailing reinsurance
requirements, reviewing the appointment of placing brokers, negotiating policy terms and monitoring treaty
placement.
The Ageas UK Boards have delegated authority and responsibility for key activities to designated senior managers
across Ageas UK, with the allocation of significant responsibilities documented and maintained within the
Governance Map of the Ageas UK business, a copy of which is provided to the regulator on a regular basis.

Solvency Financial Condition Report SYSTEM OF GOVERNANCE
14
2 Senior insurance management functions (SIMF), control functions (CF) and key function holders (KFH)
Core Function Role Holder
Ageas (UK) Board Chairman J De Mey (Parent INED)
Ageas Group C Boizard (Ageas Group CFO)
Ageas Group A Cano (Ageas Group COO)
Ageas UK Audit Committee Chairman D Watson (INED)
Ageas UK Risk Committee Chairman M Urmston (INED)
Ageas UK Remuneration Committee Chairman J Furse (INED)
Ageas UK CEO Andy Watson (UK CEO)
CEO, Insurance F-X Boisseau (CEO, Insurance)
CEO, Retail A Middle (CEO, Direct & Partnerships)
Ageas UK Finance F Dyson (CFO)
Ageas Insurance & Ageas Retail Board Chairman M Winlow (INED)
Internal Audit D Simpson (Director of Audit)
Ageas UK Risk Management R Peters (Director of Risk)
Underwriting N Shah (Director of Underwriting)
Actuarial T Quirke (Chief Actuary)
Claims R Smale (Claims Director)
HR L Nicholls (HR Director)
IT & Infrastructure M Thomas (Strategy & Planning Director)
Compliance, Legal & Secretariat R Smith (Compliance Officer & Company Secretary)
2.1 Description of our remuneration entitlements over the reporting period and total amounts of remuneration per member
Ageas UK have established a Remuneration Policy, oversight of which is provided by the Ageas UK Remuneration
Committee of Independent Non-Executive Directors, who consider and ensure the framework and arrangements that
govern the remuneration of the Executive and Senior Management are appropriate and are aligned to Ageas UK’s
long term business strategy, risk appetite and values, and that the remuneration structure meets statutory and
regulatory requirements.
Details of Directors’ Emoluments that are applicable to AIL have been included within the notes to the 2016 financial
statements of the company (note 34 Related Party Transactions).
The Remuneration Policy describes the following objectives:
To be able to attract, retain and motivate our Executives to deliver to the required standards of
performance

Solvency Financial Condition Report SYSTEM OF GOVERNANCE
15
Differentiate reward by performance and recognise individual performance as well as seeking to reinforce
personal behaviours that deliver on our values
Reward contribution to achievement of performance against pre-agreed, objective goals at the corporate
and operating company levels that support long-term value creation in line with shareholders’ interests
Provide a competitive remuneration package, which is fair and reasonable compared to the market, and in
the context of the wider employee population.
The approach is to provide a combination of fixed and variable pay, consistent with UK market practices. The
standard arrangements are linked to Work Level, and provide a higher level of pay for more senior roles. All
employees in Work Levels 1-6 currently have a bonus which consists of 3 elements – two thirds based on business
KPIs and one third based on individual performance. Employees within the Executive population are eligible to
participate in the Executive Bonus Scheme which also includes Ageas performance, Combined ratio and Strategic
projects within the metrics. The Executive Scheme includes an element of deferral for any bonus payment over
£75,000, and a further deferral if any Executive receives payment in excess of £500,000 in any one year. The rules
for both Schemes are described and circulated to eligible employees each year.
Employees in Work Level 6 and above are invited to participate in the Ageas Group Share Scheme.
All employees in the UK are eligible to join a Group Personal Pension Scheme.

Solvency Financial Condition Report SYSTEM OF GOVERNANCE
16
3 Description of our fit and proper policy
Ageas has put in place policies and procedures that provide evidence of fitness and propriety for Directors, Senior
Managers and those responsible for discharging a key function. Supporting documentation is collated prior to
appointment, and in conjunction with the recruitment and appointment processes, which provides information on the
individual’s skills and experience and includes, but is not limited to:
detail of their personal characteristics (including being of good repute and integrity);
their level of competence, knowledge and experience;
their qualifications; and
confirmation that they have undergone or are undergoing all training.
Where applicable this information is submitted to the PRA/FCA in support of their SIMF/controlled function
applications.
The obligation to be fit and proper continues for as long as the individual remains an approved person or a key
function holder (KFH). Ageas have therefore established a regular cycle of appraisals and performance reviews,
training and an annual self-certification exercise, which together provide evidence of continued fitness and propriety.
4 Information about our risk management system
By its nature of business, Ageas’ insurance activities face risks that, whether internal or external, may affect Ageas’
operations, its earnings and solvency, the value of its investments or the sale of certain products and services. The
fundamental principle underlying the Risk Strategy of Ageas is to maximise shareholder value taking into account the
protection of policyholders. To this end, the risk exposures of Ageas are directed towards business that provides
attractive risk-adjusted returns.
4.1 Risk Management Framework
Ageas UK is active and strongly present in the UK market as a non-life insurance provider. As part of Ageas UK, AIL
pursues a risk taking strategy aimed at optimising its operations, earnings, and the value of its investments, within
the context of the Capital Management Framework. In order to achieve this, AIL’s Risk Management Framework is
articulated around a solid risk aware culture, and a comprehensive risk cycle where identification and measurement
of risks help to meet the business objectives and risk strategy within tolerable limits and risk appetite.
Ageas UK defines risk as the deviation from its business objectives including an impact on its capital, earnings,
customers, reputation or future business opportunities. AIL’s risk profile stems from its exposure to external or
internal risk factors in conducting its business activities. AIL seeks to take on only risks that:
it understands well;
can be adequately managed either at the individual or at the overall portfolio level;
it can afford (i.e. within the company’s risk appetite); and
have an acceptable risk/reward trade-off.
The goal of Ageas UK’s approach to risk management is to ensure that all material risks are understood and
effectively managed through a well-designed Risk Management Framework. The objective of this framework is to
add value to the business as well as ensure adequate control by:
Solvency Financial Condition Report SYSTEM OF GOVERNANCE
17
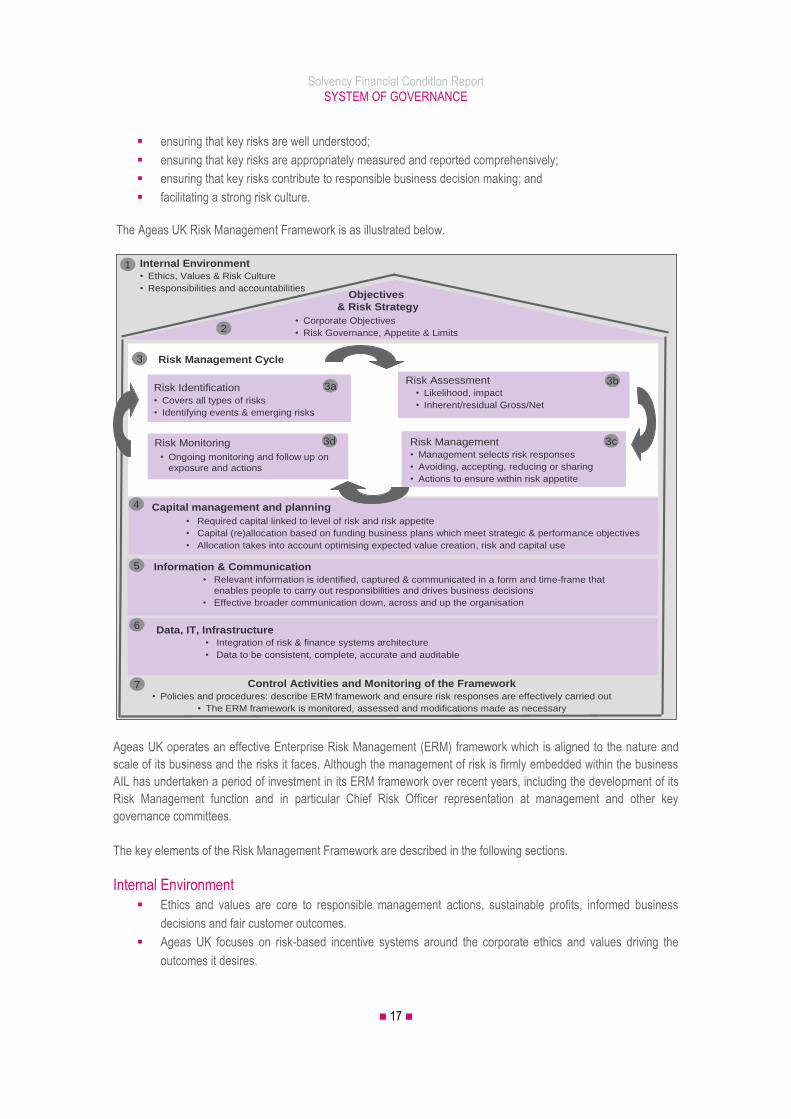
ensuring that key risks are well understood;
ensuring that key risks are appropriately measured and reported comprehensively;
ensuring that key risks contribute to responsible business decision making; and
facilitating a strong risk culture.
The Ageas UK Risk Management Framework is as illustrated below.
Ageas UK operates an effective Enterprise Risk Management (ERM) framework which is aligned to the nature and
scale of its business and the risks it faces. Although the management of risk is firmly embedded within the business
AIL has undertaken a period of investment in its ERM framework over recent years, including the development of its
Risk Management function and in particular Chief Risk Officer representation at management and other key
governance committees.
The key elements of the Risk Management Framework are described in the following sections.
Internal Environment
Ethics and values are core to responsible management actions, sustainable profits, informed business
decisions and fair customer outcomes.
Ageas UK focuses on risk-based incentive systems around the corporate ethics and values driving the
outcomes it desires.
Objectives
& Risk Strategy
• Corporate Objectives
• Risk Governance, Appetite & Limits
Information & Communication
• Relevant information is identified, captured & communicated in a form and time-frame that
enables people to carry out responsibilities and drives business decisions
• Effective broader communication down, across and up the organisation
1
Control Activities and Monitoring of the Framework
• Policies and procedures: describe ERM framework and ensure risk responses are effectively carried out
• The ERM framework is monitored, assessed and modifications made as necessary
• Required capital linked to level of risk and risk appetite
• Capital (re)allocation based on funding business plans which meet strategic & performance objectives
• Allocation takes into account optimising expected value creation, risk and capital use
2
4
Data, IT, Infrastructure
• Integration of risk & finance systems architecture
• Data to be consistent, complete, accurate and auditable
5
Capital management and planning
Internal Environment
• Ethics, Values & Risk Culture
• Responsibilities and accountabilities
6
7
Risk AssessmentRisk Identification
• Covers all types of risks
• Identifying events & emerging risks
• Likelihood, impact
• Inherent/residual Gross/Net
3
Risk Management
• Management selects risk responses
• Avoiding, accepting, reducing or sharing
• Actions to ensure within risk appetite
Risk Monitoring
• Ongoing monitoring and follow up on
exposure and actions
Risk Management Cycle
3a
3d
3b
3c

Solvency Financial Condition Report SYSTEM OF GOVERNANCE
18
Risk Objectives and Strategy AIL, as part of Ageas UK, is a professional risk taker and this is intrinsic to how AIL creates value for its stakeholders.
AIL avoids undesired concentrations of exposure to either an individual risk or highly dependent risk factors, and
exposure to undesired risk. This is achieved by having a limit system in place and policies for all risk categories. The
overall strategy approved by the Board includes guidance on risk taking (e.g. areas of risk to seek or avoid) as
formalised in the Risk Appetite Policy. This risk appetite, together with the derived limits or mandates, forms the
boundaries for the risk strategy for Ageas UK.
The Risk Appetite Policy is intended to ensure that AIL sets clear and formal boundaries for risk taking and, most
importantly of all, is both willing and able to afford the risks it takes. The risk appetite sets maximum boundaries – it
does not determine the optimal exposure, nor does it deal directly with how the detailed limits are implemented. It is
not intended to imply that taking risks to the maximum level allowed by the policy is appropriate from a risk/return or
any other business point of view, only that it is affordable. It also is not intended to imply that there is automatic
permission to increase risks to the maximum allowable level set by the appetite. Controls are set within other policies
(e.g. Market Risk Policy) and through additional constraints on risk taking. Capital needed to support risk taking also
needs to earn sufficient returns from a value creation point of view. Ageas UK sets limits on the acceptable deviation
of various criteria, such as solvency, earnings and customers.
AIL is required to define its Minimum Acceptable Capital level, a Target Solvency Level and a Target Operating
Capital Level in accordance with the Capital Management Policy and to comply with the following Risk Appetite
Statement:
exposures must be managed to ensure that, at Target Solvency Capital, available capital remains above
Minimum Acceptable Capital after applying predefined stress events calibrated to a ‘1 in 5’ year event; and
exposures must be managed to ensure that, at Target Operating Capital, available capital remains above
Minimum Acceptable Capital after predefined stress events calibrated to a ‘1 in 30’ year event.
Risk Management Cycle
Risk Identification
To ensure risks are well understood, a bottom-up risk assessment allows individual risk identification for example
through Control and Risk Self-Assessment, taking into account business objectives, as well as risk incident reporting.
Individual assessment of risks supports the identification of trends, weaknesses and emerging trends.
In order to identify risks, there are four questions to consider:
What are our objectives?
What are the risks of not meeting the objectives?
What controls are in place and how do they mitigate the risks?
What actions are needed to improve or create controls, or are risks accepted?
A wide range of internal and external sources are used in the identification of the key risks.
Risk Assessment
Risk assessment within Ageas UK follows a risk taxonomy and risks are measured based on likelihood and impact
leading to a Level of Concern rating ranging from 1 to the highest risk category 5. This principle applies to all relevant
risk types and applies pre-set criteria. This process is known as the Key Risk Reporting (KRR) process. Risks are
reviewed quarterly by the Board Risk Committee.

Solvency Financial Condition Report SYSTEM OF GOVERNANCE
19
Risk Management and Monitoring
The KRR process supports the risk organisation by ensuring oversight and continuous monitoring of all significant
risks and ensures that these risks and related controls are periodically identified, reviewed, managed and monitored
against risk appetite with management actions formulated when required.
Capital Management and Planning
Capital Management and planning takes into account all risks related to meeting strategic and performance
objectives. Where required returns on capital cannot be met, a review of capital consumption including the level of
risk being taken, pricing, product mix, cost and other variables is undertaken, such that appropriate actions to
improve returns can be identified.
Under Solvency II, Ageas uses a Partial Internal Model (PIM) to measure its Solvency Capital Requirement.
Information & Communication
Ageas UK considers effective communication across business functions, especially in relation to risk
management, as important.
Relevant information is identified, captured, and communicated in a form and timeframe that enables
people to carry out their responsibilities.
Data, IT, Infrastructure
Ageas UK considers the availability of relevant management data including risk information, its quality, and
integrity as key factors for good management.
Data, IT and other aspects of the infrastructure are designed to deliver the required analysis reliably and
efficiently and cope with issues, such as data security.
Control Activities and Monitoring of the Framework
Policies and procedures describe the ERM framework and risk management approaches and ensure risk
responses are effectively carried out.
The entirety of ERM is monitored and modifications made as necessary. Monitoring is accomplished
through ongoing management activities, separate evaluations, or both.

Solvency Financial Condition Report SYSTEM OF GOVERNANCE
20
4.2 Risk taxonomy
AIL is exposed to a range of risks. The risk taxonomy is aligned with Ageas Group scope and methodology, and with
the objective of ensuring an effective and comprehensive approach to risk identification, assessment, management
and monitoring of all risks within AIL.
4.3 Risk management organisation and governance
The risk framework emphasises the importance of ensuring clear responsibilities for efficient risk management within
a three lines of defence model.
The mission of the Risk Management function is to ensure that risks that affect the achievement of objectives
(strategic, operational, financial, etc.) are promptly identified, assessed, managed and monitored. The Risk
Management function is designed to ensure:
clear responsibility and accountability for risk management;
independence of the Risk Management function; and
knowledge and best practice sharing, and high standards of risk management.
The Risk Management function is structured as illustrated below with core activities organised as described in the
following sections. The Risk Management function places wider reliance on other functions within the Ageas Group,
which directly contribute to risk governance. This includes internal model validation and development.
A Risk Co-ordinator Model is applied. This model relies on Risk Co-ordinators who are first line employees
supporting risk management activities. This model allows good business understanding, ownership of risk
requirements and a pragmatic attitude towards risk processes through direct business involvement, as well as an
independent risk function, in order to achieve the risk strategy.
Solvency Financial Condition Report SYSTEM OF GOVERNANCE
21
4.3.1 Enterprise Risk Management
Enterprise Risk Management provides oversight of Operational and Strategic risks and Internal Control support with
key tasks comprising:
ERM framework activities, including Control and Risk Self Assessments (CRSA) review and challenge,
policy attestations, BCM readiness, incident oversight
Co-ordination of incident reporting
Risk crystallisation reporting including scenario analysis
Management Control Statement co-ordination
4.3.2 Project Risk Management
Project Risk Management is built around similar principles to the ERM activities, however as opposed to focusing on
business as usual activities, it specifically provides oversight of risks related to the change agenda and project
control support with key tasks comprising:
The review of risk governance around project activity
Support of project completion within budget and timescale
Identification of common risks and related dependencies across different projects.
Assurance to management and the Board around project risks through comprehensive project risk
reporting and opinion.
4.3.3 Capital Assurance
Capital Assurance ensures oversight of Financial and Underwriting risks and the assurance of capital adequacy with
key tasks comprising:
Risk Appetite and limit setting
Solvency Adequacy and Capital Management control, together with assurance from the Actuarial Function
Co-ordination of the Model Control Board (MCB)
Stress and scenario testing
A key element of the Capital Assurance activity is in Model Control Governance, where more comprehensive
standards of governance over capital models have been introduced. An MCB has been established to oversee the
Model Register and ensure adherence to minimum standards of control as set out in the Model Governance Policy.
Detailed model ‘self-assessments’ are carried out by Model Managers.
4.3.4 Risk Governance
Risk Governance activities ensure the co-ordination, preparation and oversight of risk reporting requirements. Its key
tasks include:
Oversight and co-ordination of governance and reporting requirements
Organisation of Internal risk reporting for committees

Solvency Financial Condition Report SYSTEM OF GOVERNANCE
22
4.4 Risk management processes
The risk framework facilitates day to day reporting of first line risks which, on a quarterly basis, are reviewed and
challenged by the Conduct Risk Committee and the Prudential Risk Committee and subsequently reported to the
Board Risk Committee.
The risk management function provides second line risk views through the ERM report and Own Risk and Solvency
Assessment (ORSA) and by way of discrete risk opinions on specific topics.
4.4.1 Own Risk and Solvency Assessment (ORSA)
The main purpose of the ORSA is to ensure that all the risks inherent to the business are assessed and the
corresponding capital management needs determined. The ORSA aims to describe:
The business strategy and objectives
The risks that may prevent AIL meeting its objectives.
The overall capital needs of the Company taking into account its risk appetite and derived limits
The ORSA is forward-looking and covers a medium to long term perspective, incorporating the MYB planning period
of 3 years and longer where the risks associated to the strategy could be material. This is documented in the ORSA
report.
The annual ORSA report is linked to the strategic MYB exercise and takes into account the risk profile and the overall
solvency requirement relative to the capital position. The ORSA is reviewed on a quarterly basis.
Coverage
The ORSA report covers the following key areas:
Risk Appetite & Management Actions, including limits adherence, specifically for Underwriting,
Investments, Reinsurance and Counterparty exposure
Capital Management and Solvency adequacy
Stress testing, scenario testing and reverse stress testing
Appropriateness of models and controls.
Risk Appetite & Management Actions
The ORSA is performed in compliance with and in consideration of the principles and rules set out within the Risk
Appetite Policy. If risk appetite is breached action is taken by the Board to remedy the situation. Potential actions
include reducing exposure to certain risks, adjusting the strategy, explicitly accepting deviation and taking further
mitigating actions (e.g. hedging or re-insurance).
The risk appetite framework is updated periodically with changes in strategy, the environment and market
expectations. In order to meet overall Risk Appetite the business develops mandates and limits for business lines.
These mandates and limits are governed by the Prudential and Conduct Risk Committees and are periodically
reviewed, at least on an annual basis as part of the MYB process and ORSA. The review process can result in:
adding or deleting one of the appetite statements to/from the risk appetite framework;
a change of one or more of the appetite statements, mandates or limits;
a change in the set of stress events to be applied; or
confirmation of the existing risk appetite framework.

Solvency Financial Condition Report SYSTEM OF GOVERNANCE
23
Capital Management and Solvency adequacy
The Board decides whether the risk profile, the approved risk appetite framework and the overall solvency needs are
appropriate. The Board may define certain capital management actions if appropriate. Urgent action may be taken
depending on how strongly Solvency risk appetite has been breached as formalised in the capital contingency plan.
Solvency adequacy and related capital management actions are monitored on a quarterly basis. This incorporates
the adequacy of the Market Consistent Balance Sheet, including reserves and related liability adequacy tests (LAT).
Stress Testing, scenario testing and reverse stress testing
A series of stress tests are documented in the ORSA and include reverse stress tests and scenario analyses in order
to provide an adequate basis for the assessment of overall solvency needs.
Roles and Responsibilities
The Board owns the ORSA and reviews its assessments and scope, challenges its results and concludes on the
outcome. Operationally, the report is prepared by the Risk Function in co-operation with the Finance, Actuarial and
Strategy and Planning Functions.
The annual ORSA process utilises the strategic objectives defined by the Board and incorporated within the MYB. As
such, the annual ORSA and MYB processes are closely aligned.
Once the ORSA is validated by the Board it is sent to Ageas Group and the regulator. Any actions arising from the
ORSA are monitored by the Board Risk Committee on a quarterly basis.
ORSA monitoring of compliance with regulatory capital requirements (SCR, MCR and QRTs) and Risk Appetite and
Capital Management Frameworks is performed on a quarterly basis.
Non-regular ORSA triggers are also in place to ensure that solvency assessments are performed if the situation
warrants it outside the regular ORSA process. The following non-exhaustive list of triggers is used as a reference:
A significant change in the risk profile;
A significant change in the composition of own funds or in capital management / budget assumptions and
forecasts
An acquisition (or divestment) that significantly changes business, risk or solvency profile;
A significant change to the strategy, affecting budget assumptions in material ways;
A significant change in the external business environment that has a large impact on the asset-portfolio;
A significant change in the liability portfolio;
A significant deviation from the Risk Appetite indicators (solvency, liquidity, earnings); and
A (significant) change in regulation.
The non-regular ORSA must explain the expected changes in the risk profile and/or financial situation, the impact on
the overall solvency needs and the link to the available own funds and SCR.
4.4.2 Enterprise Risk Management (ERM)
The main purpose of the ERM report is to ensure a second line view of the risks and controls inherent to the
business and a view of its processes and strategic direction. The ERM report summarises:
The first line risk assessment and controls framework
The resilience of business processes and business continuity
Risk incidents and related trends
The position relative to best practices, and identified weaknesses

Solvency Financial Condition Report SYSTEM OF GOVERNANCE
24
ERM activities give assurance on the overall culture, infrastructure and process, governance, controls and
completeness of information which are essential to the effectiveness of the risk management framework and a strong
control framework. The information contained in ERM reports is consistent with the information found in other reports
provided to the Board, Board Committees, Group and the PRA.
The ORSA report covers the following key areas:
CRSA and Control evaluation
Risk Incident reporting
Policy attestation
BCM
Management Control Statement
Whilst the reporting, review and challenge of the risk assessment through Key Risk Reporting establishes a sound
ownership of the business risks and controls, the Management Control Statement (MCS) is a formal and explicit sign-
off of the process of ongoing risk and control identification and monitoring within the business and support
departments.
For both the KRR and the MCS, there is an escalation and approval process allowing information to be streamed
upwards in the organisation to the Risk Management function and the Board.
5 Information on the internal control system
5.1 Description of the internal control system
The objective of the internal control framework is to provide management with reasonable assurance that the
company is run in a proper way. Ageas utilises the “Three Lines of Defence” model of operation consistent with that
established across the Ageas Group. Management and staff within each Ageas function have the primary
responsibility for owning and managing risks (first Line of Defence). Oversight of the effective operation of the
internal control framework is supported by the Risk Management and Compliance functions (second Line of
Defence). The third Line of Defence is provided via independent verification and challenge of the adequacy and
effectiveness of the internal risk and control management framework by the Internal Audit Function.
Ageas is committed to embedding a compliance culture where the ownership of compliance processes is clearly
defined and followed appropriately at all levels. Compliance is not just good business practice; it is about observing
high standards of integrity, fair dealing with customers and acting with due care and diligence at all times.
Compliance standards are measured through monitoring and risk management processes.
All staff are made aware of their Compliance responsibilities and how Compliance fits in with business requirements.
Compliance is not a ‘stand alone’ function. It is an integral part of the business. Directors and senior managers
promote a compliance culture, and encourage staff to do likewise.
5.1.1 Control Domains and their Objectives
The overall objectives of the framework are specified according to the following three domains: Operations,
Compliance and Financial Reporting.
Operations
Operations include the objectives of appropriate functioning and proper management of operations.

Solvency Financial Condition Report SYSTEM OF GOVERNANCE
25
Compliance
Compliance aims to provide reasonable assurance that the company and its employees comply with laws,
regulations, internal rules and ethical standards.
Financial Reporting
The objective is that adequate and appropriate information is internally (and externally) reported and when relevant
disclosed in a proper way.
5.1.2 Control Components
The Internal Control Components are the elements that need to be assessed and reported for every business
function. These components are defined as follows:
Control Environment
Ageas believes that its people are at the core of the business. Their individual attributes including integrity, ethical
values and competence and the environment in which they operate is vital to the success of Ageas.
The way Ageas interprets the control environment relates to the policies that are in place regarding specific activities.
These policies define the governance, key principles, and management vision regarding that particular activity which
provides the “tone from the top”.
Risk Assessment
Risks to which the Company is exposed, from external and internal sources, are assessed relative to the Company’s
objectives. The objectives are based on the risk appetite framework and translated into tolerances.
Because economic, industry, regulatory and operating conditions will continue to change, mechanisms are in place to
identify and deal with risks associated with change.
The purpose of this component is to identify the key risks that are faced when carrying out the business activities
related to a process/function.
Control Activities
Control activities are defined by the policies and procedures that ensure management directives are carried out.
They ensure that necessary actions are taken to address risks to achievement of the Company’s objectives.
Control activities occur throughout the organisation, at all levels and in all functions. They include a range of activities
including approvals, authorisations, verifications, reconciliations, reviews of operating performance, security of assets
and segregation of duties.
Information & Communication
Information systems produce reports containing operational, financial and compliance-related information to facilitate
the running and control of the business. They deal with internally generated data and information on external events,
activities and conditions necessary to inform business decision-making and external reporting.
Effective communication also occurs in a broader sense, flowing down, across and up the organisation. Personnel
understand their role in the internal control system and how their individual activities relate to the work of others.
There are also communication processes with external parties, particularly customers, suppliers, regulators and
shareholders.
Solvency Financial Condition Report SYSTEM OF GOVERNANCE
26
Monitoring
Internal control systems are monitored and processes are in place to assess the quality of internal control systems
performance over time.
This is accomplished through ongoing monitoring activities and separate evaluations. Ongoing monitoring includes
regular management and supervisory activities. The scope and frequency of separate evaluations depends primarily
on an assessment of risks and the effectiveness of ongoing monitoring procedures.
Internal control deficiencies are reported upstream, with serious matters reported to Executive Management and the
Board.
5.2 Information about key procedures in the internal control system
The key internal control processes are related to Finance (reporting and performance management), Risk
(framework and policy setting, quantified monitoring), Compliance and Audit.
All five control components (Control Environment, Risk Assessment, Control Activities, Information &
Communication, and Monitoring) are assessed per business function detailing the key processes, risks, controls and
actions.
The Internal Control Policy requires the key processes to be documented together with the key operational risks and
related key controls in place. To facilitate the documentation of such processes and the centralisation of controls
across the Company, a ‘Risk and Control Register’ is maintained and contains the processes, risks and controls
related to each business function.
The actions to be taken to set up controls and/or improve existing ones are identified and monitored throughout the
year. Time constraints are defined depending on the rating of the risk.
The internal control framework is based on the self-assessment performed by the respective process owners.
Coordination of this self-assessment process, the subsequent aggregation, and conclusions are managed by the
Risk function.
Internal Audit performs an independent assessment of the adequacy of the internal control framework as well as of
the control environment within the business functions.
5.3 Description of how the compliance function is implemented
The Ageas UK Compliance Framework is aligned to the Ageas Group Compliance Policy and describes the
objectives of Compliance, the fulfilment of the function (as an independent second Line of Defence control function),
the organisation of compliance within Ageas UK, reporting, and reporting lines. This is, in part, managed via an
annual Compliance Strategy and Plan. This annual Compliance Strategy and Plan includes a compliance assurance
programme that is devised and followed (subject to appropriate review and sign-off within Ageas UK) to ensure that
those areas covered within the Compliance Universe are appropriately reviewed, on a risk-based approach. The
Management, Risk and Audit Committees are given reasonable assurance of compliance and kept up to date
through regular reporting on regulatory risk incidents, monitoring activities, legal & regulatory changes and other
relevant Compliance-related matters with opportunities at the Committee meetings to discuss any matters of interest.

Solvency Financial Condition Report SYSTEM OF GOVERNANCE
27
The Compliance function is an independent function within Ageas which aims to provide reasonable assurance that
the Company and its employees comply with laws, regulations, internal rules and ethical standards. The Compliance
team are dedicated to ensuring that Ageas acts in a compliant way and meets its obligations in relation to regulatory
requirements, including but not limited to PRA and FCA requirements. Compliance assists the business in delivering
its objectives and strategic plans by ensuring that regulatory standards are achieved and maintained.
Compliance are responsible for assessing the compliance standards within Ageas, including ensuring:
Appropriate systems, procedures and records are in place;
Adequate monitoring programmes are applied in order to gain assurance on Ageas compliance;
Assistance is given to adequately and appropriately train the business in compliance matters, and
Guidance and advice is given to the business on compliance matters.
Compliance acts as a point of contact for business areas on key issues relating to regulatory risk. In addition,
Compliance maintains regular contact with management and staff in order to reinforce compliance culture.
Compliance has a regulatory duty to prevent and report breaches of PRA and FCA rules to the relevant regulator as
notifiable events. Directors have a personal responsibility to ensure that Ageas is compliant with applicable
regulations.
Compliance has a reporting line to the Ageas UK Director of Compliance, who is responsible for compliance across
the Ageas UK Group. Independence is an important element of Compliance’s approach, facilitating impartiality, which
is essential to the review and monitoring of compliance arrangements within Ageas.
5.3.1 Role
The role of the Compliance senior management ensures:
reasonable assurance that the company and its employees comply with all laws, regulations, internal rules
and ethical standards, that are relevant to its integrity and reputation, such as duty of care, sales standards,
conduct risk management, treating customers fairly etc;
a confident relationship and mutual understanding is developed with the regulators with respect to
compliance matters, coordinated with/through the Ageas UK Director of Compliance/Company Secretary
who reports to the Board;
appropriate policies, standards and guidance that mitigate compliance risk; and
effective reporting arrangements.
The Compliance function will review areas such as:
Corruption and Anti-Bribery;
Duty of care, product suitability and adequate information to customers, market practices and consumer
protection (“Treating Customers Fairly”);
Third Party and Counterparty Risk;
Corporate Governance, Fit & Proper Rules, Remuneration Policy, Code of Ethics and Conflicts of Interest;
Fair competition;
Privacy protection and
Any other topics as requested by the business or relevant regulators.
In order to deliver the required reasonable assurance, all topics are assessed at least on a triennial basis (in addition
to those topics, laws or regulations which are required to be tackled every year or on an ongoing basis). The
activities of the Compliance function are detailed in the Compliance strategy and plan for the coming year and
approved by the Audit Committee.
Solvency Financial Condition Report SYSTEM OF GOVERNANCE
28
5.3.2 Laws and Regulations linked
An overview of the ever changing regulatory environment is maintained and regular ‘Legal and Regulatory updates’
issued that encompasses the major laws and regulations that might affect Ageas’ way of doing business.
As follow up, Compliance (at least on a quarterly basis) provides regular updates to the Risk Committees to give
assurance that there has been adequate follow-up of these laws and rules across the different departments.
5.3.3 Codes of Conduct and Policies
The UK Compliance Director is responsible for the follow-up of the Codes of Conduct and internal policies.
Therefore, they:
Ensure that there are adequate checks in place to verify if the policies are up-to-date, published, validated
by the adequate level of decision; and
Ensure that the Head of Compliance Assurance has set up an appropriate compliance monitoring
programme upon the execution of the imposed rules.
The applied risk-based approach consists of identifying and assessing the compliance risks and ensuring that every
reasonable measure (including instructions, procedures, I.T. programs, monitoring methods, awareness and training
actions, objective setting, incentives, deterrent measures and sanctions) is taken in order to avoid or reduce the
occurrence of the thus identified compliance risks and to minimise the damages, should one of these risks
nevertheless occur. Corrective actions are monitored as well.
5.3.4 Compliance Risk Assessment
The Compliance Risk Assessment Methodology (chain of actions) in this context can be represented as follows:
The Compliance function will identify possible consequences (the inherent risk), weight the likelihood and impact of
occurrence, check the controls in place and determine the level of concern (the residual risk). It will issue specific
recommendations and follow up the actions and corrective measures set up by the involved departments, until
complete implementation.
Compliance senior management is also involved at the earliest possible stage in all major changes in processes,
new policies, projects and issues. They will each time act as a catalyst in compliance awareness, showing the
possible compliance risks and helping in the mitigation of them. They, or their team, will formulate advice (which on
some occasions may be a formal Go/No Go decision) for management in order to allow them to make decisions
knowing the real state of affairs.
Compliance senior management will be responsible for all compliance linked information to all Ageas staff members;
this may be set up through, for instance, distribution of an e-alert, publication of bulletins or screens savers, face to
face training/presentations about information or specific guidelines, as well as the setting up of an intranet
compliance corner.
Furthermore, within Ageas the UK Compliance Director (also the Company Secretary) and/or the Director/Head of
Compliance receives papers/minutes for, attends and participates in all appropriate governance committees.
The UK Compliance Director has to be informed of and, if appropriate, involved in:

Solvency Financial Condition Report SYSTEM OF GOVERNANCE
29
Any significant project and, more in particular, cross-border projects, projects of outsourcing, M&A projects,
projects which may have an impact on the relations with customers or the protection of privacy,
The preparation and launching of any new significant product or commercial campaign,
The deliberations on changes to the corporate structure,
All relevant policies and Codes of Conduct.
Moreover the UK Compliance Director has to be informed of:
All material incidents of a compliance nature,
All requests from the Regulators / Control authorities with respect to any domain of compliance, and, in
particular any investigation or audit,
All audit reports pertaining, totally or partially, to compliance issues.
Training courses / informative sessions are provided as Ageas Compliance operates as a central point for all
compliance related questions.
Communication is therefore a cornerstone in the approach of the Ageas UK Compliance team.
As compliance is a core accountability of all AIL employees, and has a key role in supporting the Executive
Management in the promotion of a compliant culture within their business, Compliance will also determine and
undertake an appropriate level of independent monitoring of business practices and procedures. This is based on an
assessment of the compliance risks. Compliance will exercise judgement in determining the level and intensity of
monitoring activity, with due regard to both the probability and the impact of compliance failure. Such monitoring
activity is intended to provide independent assurance of compliance, and does not diminish the responsibilities of the
business to ensure that working practices are compliant.
The Head of Compliance can also set up, upon their own initiative or on the specific request of a management team
member, an enquiry or investigation in order to check, confirm or counter any suspicion of compliance breaches or
even fraud. In this case; they will not give any advice but will be restricted to facts and figures, so as to allow the
management, the UK Compliance Director and Chief Executive Officer or appropriate Director, to decide objectively
and to take the adequate measures and / or sanctions.
The Head of Compliance has to escalate immediately to the UK Compliance Director all events of facts that might
affect the Group or the parent company. The UK Compliance Director will make the decision as to whether the matter
needs to be referred to the Group Compliance Officer.
The escalation report is to be issued immediately when a major fact occurred or could occur.
6 Information about the internal audit function
6.1 Description of how the internal audit function is implemented
6.1.1 Governance of the Internal Audit function
The Internal Audit function at Ageas UK is governed by a charter that defines its role, mission, positioning,
deliverables, duties and operational structure, including its role in the Group. The charter is reviewed every 2 years,
the most recent being approved by the Ageas UK Audit Committee in October 2016. No significant changes were
made in this revision.

Solvency Financial Condition Report SYSTEM OF GOVERNANCE
30
This charter complies with the UK regulation on internal control and internal audit and with Solvency II regulation and
is part of the Ageas governance.
The Ageas UK Board endorses Internal Audit with a status that preserves its autonomy and functional independence,
objectivity and authority necessary to fulfil its role and mission.
The Audit function also has a professional duty to preserve its objectivity and impartiality. Therefore, Audit staff
cannot be involved in operational activities or in implementing any organisational or internal control measure,
including executing control monitoring.
Audit operates within the International Professional Practices Framework established by the Institute of Internal
Auditors (IIA) and within the basic guidelines set by (inter)national regulatory authorities. It also operates in full
accordance with the UK standards in respect of Internal Audit within Financial Services, as specified by the
Chartered Institute of Internal Auditors (CIIA).
The Ageas UK Director of Audit monitors the Audit function within the UK group as governed by the principles,
limitations and conditions described in the charter and has an obligation to inform the CEO and the Audit Committee,
of any material issue (action, event, decision, blocking factor, lack of resources etc.) that limits, or could limit the
scope of Internal Audit.
6.1.2 Objectives of the Internal Audit function
Internal Audit’s role is based on the following main objectives:
Through independent and professional audit assignments, enable Ageas to achieve its long-term objectives
by:
providing effective and responsive control assurance,
fostering a robust control culture,
promoting cross-entity knowledge sharing.
To be a trusted guardian on internal control for the Audit Committee and executive management.
Within Ageas UK, Internal Audit assists the Audit Committee, the Executive Committee and other management
committees in the effective discharge of their duties, through delivering reasonable assurance about the quality of
governance, risk management and control processes, which include management’s reporting on internal control and
management’s annual statements on the effectiveness of internal control.
Recommendations are issued to optimise internal control in its broadest sense.
6.2 Description of the audit plan
Internal Audit documents its priorities in a formal yearly audit plan, based on a comprehensive risk assessment of
processes and functions, using materiality, risk and control related data and input from management and other
control functions.
Process relevance, strategic initiatives, regulatory changes, time since last audit, industry and audit trends are
additional priority indicators.
The audit plan is submitted to the Ageas UK Audit Committee for the final and formal endorsement after approval by
the Ageas UK CEO.

Solvency Financial Condition Report SYSTEM OF GOVERNANCE
31
6.2.1 Audit assignments
Internal Audit prepares and executes the audit plan and appropriately reports on the findings, conclusions and
recommendations to the CEO and provides summaries to the Audit Committee via a quarterly Management Report.
Recommendations are followed up and their status is reported.
In each of its audit assignments Internal Audit focuses on the proper design, operation and effectiveness of:
governance processes & principles;
strategy and objective setting, accountability, ethics and integrity, transparency and adequate
competencies;
risk identification and assessment;
controls as part of risk mitigations; and
information and communication.
6.2.2 Management Report
Quarterly detailed management reports are provided in order to inform the Audit Committee and Executive
Committee on the status of the planning, recent reports issued, staff resources and recommendations.

Solvency Financial Condition Report SYSTEM OF GOVERNANCE
32
7 Information about the actuarial function
The objectives of the Actuarial Function within Ageas are formulated as follows:
The Actuarial Function coordinates the calculation of the technical provisions and acts independently from model
managers, implementation managers and model users in order to issue an opinion about the reliability and adequacy
of the technical provisions. It also issues an opinion on the appropriateness of the underwriting practices and the
reinsurance arrangements.
The AIL Chief Actuary is the Actuarial Function holder and is responsible for reserving and setting capital
requirements. The Chief Actuary produces an annual Actuarial Function Report which is reviewed and challenged by
the Capital Assurance team of the risk management function. The Actuarial Function Report formulates views on and
recommendations for:
the reliability and adequacy of technical provisions in International Financial Reporting Standards (IFRS)
and Solvency II based on the assessments of methodologies, models, data quality and assumptions, and
the consistent calculation of technical provision calculations;
the appropriateness of underwriting practices when offering insurance products through assessment of
the profitability of the portfolio, product pricing (risk/return) and acceptation rules, and benchmarking these
to the applicable underwriting policy;
the appropriateness of the reinsurance arrangements by assessing (i) the adequacy of the reinsurance
policy and (ii) the alignment of the reinsurance arrangements with the applicable reinsurance policy.
The Actuarial Function is expected to coordinate the calculation of technical provisions and assure a level of
consistency throughout the group as set out in the Group Best Estimate Manual (Non-Life), the Reserving Policy Life
and Group Methodology for Risk Margin.
Furthermore, the Financial and Risk Data Management Policy set the data management and quality standards and
governance by which Ageas manages its financial and risk data. Of particular relevance to the Internal Model, the
Policy sets out how AIL manages the accuracy, completeness and appropriateness of the Internal Model data using
a combination of quantitative and qualitative assessments.
In addition, a model governance policy sets out the expectations in respect of controlling key Actuarial models.
Governance of model data is owned by the MCB with the Head of Capital, Risk Officer and Chief Actuary reviewing
inputs prior to formal sign-off by the MCB. Given the data feeding the Model is largely from accredited sources (e.g.
audited IFRS balance sheet, signed-off business plan etc.), it is deemed to be sufficiently accurate and complete.
For data used within AIL’s Internal Model, the AIL internal model documentation (B3) document lists the data inputs
and has a ‘data dictionary’ giving more detail on the source, characteristics and usage of the relevant data used.

Solvency Financial Condition Report SYSTEM OF GOVERNANCE
33
8 Information about outsourcing
8.1 Description of why we outsource critical or important operational functions or activities and how we have appropriate oversight and safeguards in place
Ageas UK will only enter into an outsourced arrangement where there is an agreed sound business rationale for
doing so and with a provider that is competent (i.e. has the required operational and technical capability, resources
and quality standards), is financially sound and has good relevant knowledge and experience of the service it is
required to supply. Any decision to outsource activities remains the responsibility of Ageas UK management, based
upon the agreed strategy. Decisions and core management responsibilities concerning strategy or risk management
will not be outsourced.
Ageas UK remains responsible for all activities that are outsourced and requires that robust governance
arrangements are in place in relation to the selection, management and oversight of all outsourced
arrangements. Ageas UK will ensure that outsourcing of critical or important operational functions or activities will
not
unduly increase operational risk; or
breach applicable legal or regulatory requirements; or
materially impair the quality of the system of governance or the ability of its regulators to monitor Ageas
UK’s compliance with its obligations; or
undermine continuous and satisfactory service to policyholders.
The processes to be followed in negotiating, implementing, managing and overseeing critical and important third
party provider relationships are set out within the Ageas UK Outsourcing and Third Party Supplier Manual. Board
approval is required for any proposed outsourcing arrangement, or to serve notice of variation or termination on any
existing outsourcing arrangement, above certain defined thresholds.
Oversight arrangements include satisfactory due diligence, robust contractual documentation, allocated business
responsibility for oversight of the relationship and performance, supported by appropriate Compliance and Internal
Audit monitoring.
Nature of relationship Jurisdiction
Delegated Underwriting Authority – Motor and Household insurance EEA
Outsourcing of legal expenses insurance EEA
Outsourcing of the administration, claims handling and accounting for the company's
London market run-off portfolio EEA
Managing General Agent EEA
Solvency Financial Condition Report RISK PROFILE
34
C RISK
PROFILE
(Unaudited)

Solvency Financial Condition Report RISK PROFILE
35
1 Description of the definition, identification, assessment, management and monitoring for each individual category of risk
The following sections explain AIL’s various risk exposures in more detail.
1.1 Financial risk
Financial risk encompasses all risks relating to the value and performance of assets and liabilities that may affect
solvency, earnings and liquidity due to changes in financial circumstances. These include:
Market risk;
Default risk;
Liquidity risk.
The most material risk to AIL, after non-life underwriting risks, is Market risk (contributing 26% of SCR at Q4’16),
particularly spread risk (17% of SCR at Q4’16).
Default risk represents 12% of AIL’s SCR at Q4’16, driven by type 2 exposures such as receivables from brokers and
policyholders. Type 1 exposure including reinsurance receivables is relatively low given the high quality credit rating
of AIL’s reinsurers of A+ on average.
Financial risks are managed through various processes & reports (including Risk Appetite Monitoring). Market and
Default risks are assessed via the Standard Formula.
A regular review of the counterparty exposure is undertaken within the Credit Risk Committee and actions taken to
deal with any existing and potential breaches.
Reinsurance counterparty exposure is monitored quarterly through the Reinsurance Committee.
Counterparty limits relating to investment operations are monitored and reported monthly to the Investment
Committee.
1.1.1 Market risk
Market risk arises from adverse change in the financial situation resulting, directly or indirectly, from fluctuations in
the level and in the volatility of market prices of assets and liabilities. It is composed of the following sub-risks:
a. interest rate risk;
b. equity risk;
c. spread risk.
d. currency risk;
e. property risk;
f. market concentration risk.
In accordance with Article 132 of Directive 2009/138/EC the company has invested all its assets in accordance with
the ‘prudent person principle.’
With respect to the whole portfolio of assets, the company has only invested in assets whose risks can be properly
identified, measured, monitored, managed, controlled and reported.

Solvency Financial Condition Report RISK PROFILE
36
All assets, in particular those covering the Minimum Capital Requirement and the Solvency Capital Requirement, are
invested to ensure the security, quality, liquidity and profitability of the portfolio as a whole.
Assets held to cover the technical provisions are also invested in a manner appropriate to the nature and duration of
the insurance and reinsurance liabilities and in the best interest of policy holders and beneficiaries.
The company has opted to invest in derivative instruments to reduce risks and facilitate efficient portfolio
management. Assets have been diversified in such a way as to avoid excessive reliance on any particular asset,
issuer or group of undertakings, or geographical area.
A. INTEREST RATE RISK
AIL’s exposure to changes in interest rates is primarily concentrated in its investment portfolio. To mitigate changes
in interest rates AIL holds a material proportion of its investments in fixed and floating rate debt securities. It will
normally hold these securities to their maturity. This reduces the variation in future cash flows and provides security
over future income and redemption values. The market value of fixed interest securities is inversely correlated to
movements in interest rates i.e. the market value of fixed interest securities rise if interest rates fall and vice versa.
AIL regularly monitors its investment strategy to minimise the risk of a fall in the portfolio’s market value which could
affect the amount of business that the company is able to underwrite or its ability to settle claims as they fall due. AIL
is not materially exposed to interest rate risk on the subordinated debt it has issued, as the interest rate is based on
LIBOR.
Most insurance contract liabilities are not directly sensitive to the level of market interest rates as they are
undiscounted and contractually non-interest bearing. PPOs take account of likely increases in payments due to, for
example, inflation, and are discounted using a rate of interest based on the related indexing factors.
The Solvency II curve as provided by EIOPA is used as the risk-free rate curve for valuation purposes.
B. EQUITY RISK
Equity risk is limited to the exposure the company has on its pension benefit surplus/obligation. Changes in the level
or volatility of market prices for equities or their yield can impact the value of the surplus/obligation. The pension
benefit surplus/obligation is calculated in line with EIOPA technical specifications.
This risk is controlled through limit setting based on the risk appetite and by investment policies that require a range
of controls to be in place including the action that will be taken in the event of significant decreases in value.
C. SPREAD RISK
Spread risk results from the sensitivity of the value of assets to changes in the level or in the volatility of credit
spreads over the risk-free interest rate term structure.
The company generally aims to hold credit assets to maturity. This limits the long-term impact of spread risk.
Although short-term volatility can be important, it is highly unlikely that the company would be forced to sell at
distressed prices, but it can choose to sell if it considers this to be the best course of action in light of potential future
default risk.
Solvency Financial Condition Report RISK PROFILE
37
D. CURRENCY RISK
Currency risk arises from the sensitivity of assets and liabilities to changes in the level of currency exchange rates
when there is a mismatch between the relevant currency of the assets and liabilities.
AIL has US Dollar ('USD') liabilities in respect of the run off of its former Marine and City business. These liabilities
are matched on a half-yearly basis with currency assets. The company is also exposed to current travel policy claims
that require settlement in mainly USD and Euros. These are normally settled in a short period from notification of the
loss.
AIL invests in USD denominated bonds and so has foreign currency risk exposure on those assets. The company
mitigates this risk by putting in place matching currency forward derivative contracts. When a USD bond is purchased
a spot trade and a forward are executed and these are rolled forward every three months. The spot trade buys USD
and sells GBP (originally to fund the USD bond purchase but now to close out the forward contract) and a new
forward contract is then executed to sell USD and buy GBP creating a USD liability that matches the investment.
The contracts are rebased monthly.
E. PROPERTY RISK
Property risk arises as a result of sensitivity of assets and liabilities to the level or volatility of market prices of
property or their yield. AIL invests in property as a means to diversify its investment strategy away from holding only
fixed interest assets.
To mitigate this risk the company has invested in both property funds and direct property investment. Property funds
allow investors to achieve diversification across multiple types of property and location with smaller investments and
to gain access to the expertise of specialist managers.
F. MARKET CONCENTRATION RISK
Market concentration risk refers to risks stemming either from lack of diversification in the asset portfolio or from large
exposure to default risk by a single issuer of securities or a group of related issuers.
Concentration risk can arise due to large aggregate exposures to single counterparties or an aggregate of exposures
to a number of positively correlated counterparties (i.e. tendency to default under similar circumstances) with the
potential to produce a significant amount of impairments due to a bankruptcy or failure to pay.
Avoidance of concentration is therefore fundamental to AIL’s credit risk strategy of maintaining granular, liquid and
diversified portfolios. AIL sets counterparty limits which consider its particular situation and requirements set by the
Group. The company also commits to continuous monitoring and periodically report to Group so that the overall
position can be assessed in line with other Group companies.
To manage the concentration of credit risk, AIL’s investment limits aim to spread the credit risk across different
sectors and countries. AIL monitors its largest exposures to individual entities, groups of companies and other
potential concentrations such as sectors and geographic areas to ensure adequate diversification and identification
of significant concentration risk.
1.1.2 Default risk
The company has a Credit Risk Committee that monitors the different exposure, rating and accumulation risks. It will
make recommendations on amendments to policies to reduce risk. The maximum exposure is equal to the carrying
amount of those assets.

Solvency Financial Condition Report RISK PROFILE
38
Default risk is composed of two sub-risks:
a. investment default risk;
b. counterparty default risk.
The output from the above, together with detailed other credit risk information, is presented quarterly in a
summarised basis to the Credit Risk Committee and any key areas of concern are flagged in subsequent reporting to
Risk for input into the Prudential Risk Committee and the Board Risk Committee.
A. INVESTMENT DEFAULT RISK
The investment default risk includes the risk of actual default of AIL’s investments as well as the potential for indirect
losses that may arise from a default event on investment assets.
This risk is managed through limits which take into account the type of credit quality and maturity through regular
monitoring and early warning systems.
B. COUNTERPARTY DEFAULT RISK
The counterparty default risk reflects possible losses due to unexpected default or deterioration in the credit standing
of counterparties and debtors. The scope of the counterparty default risk category includes:
a. Type 1 exposures – these are risk-mitigating contracts, such as reinsurance arrangements, derivatives and
cash.
b. Type 2 exposures – these are receivables from intermediaries and other credit exposure not elsewhere
covered (guarantees, policyholders, etc.).
For Type 1 exposures, which principally apply to Reinsurers, S&P is used as the main source for credit ratings, with
A M Best used where no S&P rating is available. Any exceptions to this Policy are approved by AIL’s Reinsurance
Committee. The use of second best ratings is not considered appropriate for reinsurance purchasing. Where no
external rating is available (i.e. generally historical exposures), an internal review of additional security information is
undertaken and an internal rating is proposed, which is subsequently reviewed and approved by the Credit Risk
Committee.
For Type 2 exposures, which principally apply to Brokers, Experian is used as the main source for credit ratings,
complemented by a review of their latest financial information. The Agency appointment process includes financial
and credit assessments, including approval by the Financial Operations Manager, and ongoing protection is provided
by our TOBA terms. On an ongoing basis, a monthly aged debt review of all material brokers and schemes takes
place. For our material brokers, key accounts are reviewed monthly via our Key Account Risk Register (including an
assessment of Inherent and Residual risk, taking into account any mitigating controls) and a rolling cycle of Broker
risk assessments takes place. These reviews include a review of Experian information and their latest financial
information.
Within AIL, this risk is mitigated through the application of AIL’s Counterparty Default Policy and close monitoring of
outstanding counterparty default credit positions. Diversification and avoidance of low rated exposures are key
elements in the mitigation of this risk.
Impairment for specific credit risk is established if there is objective evidence that AIL will not be able to collect all
amounts due in accordance with contractual terms.

Solvency Financial Condition Report RISK PROFILE
39
1.1.3 Liquidity risk
Liquidity risk arises when AIL is unable to realise investments and other assets in order to settle its financial
obligations when they fall due. For example, this is the risk that expected and unexpected cash demands of
policyholders and other contract holders cannot be met without suffering losses or without endangering the business
franchise due to constraints on liquidating assets. These constraints may be structural or due to market disruption.
Liquidity risk also covers the risk that any assumed liquidity premium, used to value illiquid liabilities, will not
materialise.
The financial commitments of AIL are mainly short to medium term. Claims and other outflows can be unpredictable
and may differ significantly from expected amounts. If liquid resources are not available to meet a financial
commitment as it falls due, liquid funds will need to be borrowed and/or illiquid assets sold (which may trigger a loss
in value) in order to meet the commitment. Losses would arise from the interest on borrowings and from any
discount that would need to be offered to liquidate assets.
Causes of liquidity risk can be split into elements that can create a sudden increase in the need for cash and
elements that can reduce unexpectedly the availability of expected resources to cover cash needs. Types of liquidity
risk are the following:
funding liquidity risk is the risk that AIL will not be able to obtain sufficient outside funding in the case of an
unexpected event due to having illiquid assets;
market liquidity risk is the risk that the process of selling in itself results in losses due to market conditions
or high concentrations.
AIL ensures it can meet all liquidity requirements by identifying and monitoring liquidity risk, so that the
circumstances under which liquidity issues are possible are known and understood (i.e. expected liability run-off
profile, mass lapse event, slowdown in new business, change in rating etc.), as well as the business’s ability to
respond to such issues (i.e. liquidity of assets in a crisis).
Management of liquidity risk is performed through a limit framework. Limits are in place and provide for indication of
the net liquidity position.
Due to local specificities, the monitoring of liquidity risk is aligned to the Group Framework. Liquidity risk is monitored
through the use of management information which may include but not be limited to:
Cash flow forecasts;
Asset allocation and maturity profile;
Maturity profile of available credit facilities (where appropriate); and
Results of scenario testing.
AIL has established and maintains a system of management reporting which provides clear, concise, timely and
accurate liquidity risk reports to relevant functions. These reports alert management when businesses approach, or
breach, predefined thresholds or limits.
On a quarterly basis, a comprehensive liquidity report is provided to Group Risk. It clearly states the current liquidity
position and how it has evolved over the past reporting period, whether limit breaches have occurred and which risk
mitigating actions were taken to reduce them. In case of repeated limit breaches, Group Risk can request to adopt
more restrictive measures to reduce the liquidity risk exposure.
As at 31 December 2016 the expected profit included in future premiums; as calculated in accordance with Article
260(2) of the Commission Delegated Regulation (EU) 2015/35 of 10 October 2014; is -£1.7m. The expected profit in

Solvency Financial Condition Report RISK PROFILE
40
future premium can be found in QRT S23.01. The above negative profit (loss) is a result of the change in Ogden
rates. For a full explanation of the impact of a change in Ogden rates see section E (Capital Management).
1.2 Insurance Liability risks
Insurance liability risk refers to the risk of claims deviating from our expectations in both their timings and amounts.
This risk includes claims expenses and policy lapses.
Non-life risks include reserve risk, premium risks and catastrophe risks. Reserve risk relates to uncertainty around
outstanding claims, while premium risk relates to uncertainty around future claims. Premium risk includes attritional
losses and large losses, but excludes catastrophe losses. Catastrophe risk is related to claims arising from
catastrophic events: either natural disasters or man-made events.
AIL manages insurance risks through a combination of Underwriting Policy, Pricing Policy, Reserving Policy and
Reinsurance Policy.
Underwriting policies are adopted as part of the overall management of insurance risk, and are revised on an annual
basis by the relevant underwriting team.
Underwriting policies are adopted as part of the overall management of insurance risk and are revised by the
applicable underwriting teams. A range of indicators and statistical analysis tools are employed to refine underwriting
standards in order to improve loss experience and/or ensure pricing is adjusted appropriately.
Insurance premiums are set at a level that will ensure that premiums received plus the investment income earned on
them exceed total claims, costs of handling those claims and the cost of managing the business. The
appropriateness of pricing is tested using a range of techniques and key performance indicators appropriate to a
particular portfolio/line of business.
The factors taken into consideration when pricing insurance vary by product according to the cover offered. In
general they include:
timing and amounts of expected claims;
the level and nature of the volatility around the expected claims. This includes analysis of claims statistics
as well as consideration of the evolution of jurisprudence, the economic climate and demographic trends;
other costs of producing the relevant product, such as distribution, marketing, policy administration, and
claim handling costs;
discounting to reflect the time value of money;
solvency capital requirements;
target combined ratios;
target return on equity;
insurance market conditions, notably competitor pricing of similar products.
In its exposures to the above-mentioned risks, AIL benefits from diversification across geographical regions, product
lines and even across insurance sub-risks. This reduces AIL’s exposure to significant concentrations of insurance
risks. Moreover, AIL has built in specific mitigation measures in order to minimise its risk exposures. The main
example of risk mitigation is the annual reinsurance cover.

Solvency Financial Condition Report RISK PROFILE
41
1.2.1 Non-life underwriting risks
Underwriting risks predominantly arise from either new business exposure (either catastrophe risks affecting mainly
Household, or Premium risk on Motor and Household) or prior year reserves deterioration (reserving risk, particularly
on long term liabilities such as Motor TPL).
In terms of pricing and underwriting, changes in the pricing assumptions and loss ratios are monitored through the
Long Term Pricing (LTP) Committee. The Risk Management team also monitors the product development processes,
including the assessment of existing products.
Catastrophe risks, particularly those arising from Flood and Storms are also monitored on a regular basis via the
Model Control Board and the Reinsurance Committee to ensure that reinsurance mitigation remains adequate to the
risk profile of Ageas.
Regarding reserving, a quarterly review of the Liability Adequacy Testing (LAT) results is performed to monitor the
adequacy of the IFRS reserves. On an annual basis, an external reserve review is conducted for Private Motor
business.
Stress and Scenario Test (SSTs) are performed to assess the adequacy of capital to withstand various adverse
events.
The Model Control Board provides oversight of underwriting risk assessed by the PIM on a quarterly basis.
Non-life underwriting risks are mainly composed of reserve, premium, catastrophe and lapse risks. This section will
first describe these risks (sub-sections A to D). It will then provide an overview of their management within AIL (sub-
section E).
A. RESERVE RISK
Reserve risk is related to outstanding claims and represents the risk of adverse change in the value of insurance
liabilities resulting from fluctuations in the timing and amount of claim settlements and claims expenses.
B. PREMIUM RISK
Non-life premium risk is the risk that the premium will not be sufficient to cover all liabilities including claims and
expenses resulting from fluctuations in frequency, severity of claims, timing of claim settlements, or adverse changes
in expenses.
Claims losses can differ from the expected outcome for a range of reasons.
Analysis of claims groups short and long-tail claims separately.
Short-tail claims, such as motor damage and property damage claims, are generally reported within a few
days or weeks and are settled soon afterwards.
Long-tail claims such as bodily injury or liability claims, can take years to settle. In the case of long-tail
claims, information concerning the event, such as medical diagnosis and treatment required, may, due to
its uncertain nature, not be readily obtainable. Analysis of long-tail losses is also more difficult, requires
more detailed work and is subject to greater uncertainties around the timings and amounts of cashflows,
and other factors such as discounting.
AIL groups together risks with similar historical trends such as reserving patterns, exposure growth, loss payments,
pending levels of unpaid claims, as well as court decisions and economic conditions.

Solvency Financial Condition Report RISK PROFILE
42
To mitigate the claims risk, AIL adopts selection and underwriting policies based on their historical claims experience
and modelling. It does this by client segment and class of business based on knowledge or expectations of future
movements in claims frequency and severity. AIL also benefits from diversification effects by engaging in a range of
Non-life insurance classes and geographies. This does not reduce average claims, although it does significantly
reduce the variation in the total claims book and therefore the risk. The risk of unexpectedly large claims is contained
by policy limits, concentration risk management and reinsurance.
C. CATASTROPHE RISK
Catastrophe risk is related to claims generated by catastrophic events, natural disasters such as storms, floods,
earthquakes, freezes, or man-made events such as terrorist attacks, explosions or train accidents.
D. LAPSE RISK
Lapse risk is related to future premiums included in the premium provision where an expected profit is foreseen.
Lapse risk is the risk that more lapses will occur than the expected ones, generating less profit than foreseen.
E. MANAGEMENT OF NON-LIFE RISKS AT AIL
The management of Non-life risk at AIL is in conformity with AIL and Ageas SA/NV underwriting and risk taking
management guidance. This includes, amongst other things, risk acceptance rules, claims management guidance on
claim assessment, reinsurance taking activity and management.
At Ageas SA/NV level a number of reporting schemes related to the above are in place e.g. Solvency reports,
provisions reports.
1.2.2 Reinsurance
Where appropriate, AIL enters into reinsurance contracts to limit its exposure to underwriting losses. This
reinsurance can be written on the following bases:
Policy-by-policy basis (per risk);
Portfolio basis (per event), i.e.; where an unacceptable risk of accumulation of claims exists. These events
are mostly weather related or man-made.
Reinsurance companies are selected based primarily on pricing and counterparty default risk considerations. The
placement, monitoring and management of reinsurance risk is covered by the reinsurance committee.
The use of reinsurance enables AIL to:
Mitigate against catastrophic events (natural and man-made);
Mitigate against large losses;
Mitigate against loss accumulations;
Reduce capital requirements; and
Protect the AIL income statement.
1.3 Operational risks
AIL is exposed – like any other financial institution – to operational risks, understood as the risks of losses arising
from inadequate or failed internal processes, personnel or systems, or from external events.
To operate effectively AIL needs to have in place a framework to manage operational risk. This framework is an
integral part of the overall risk management framework. The Operational Risk Policy is one of the risk-specific
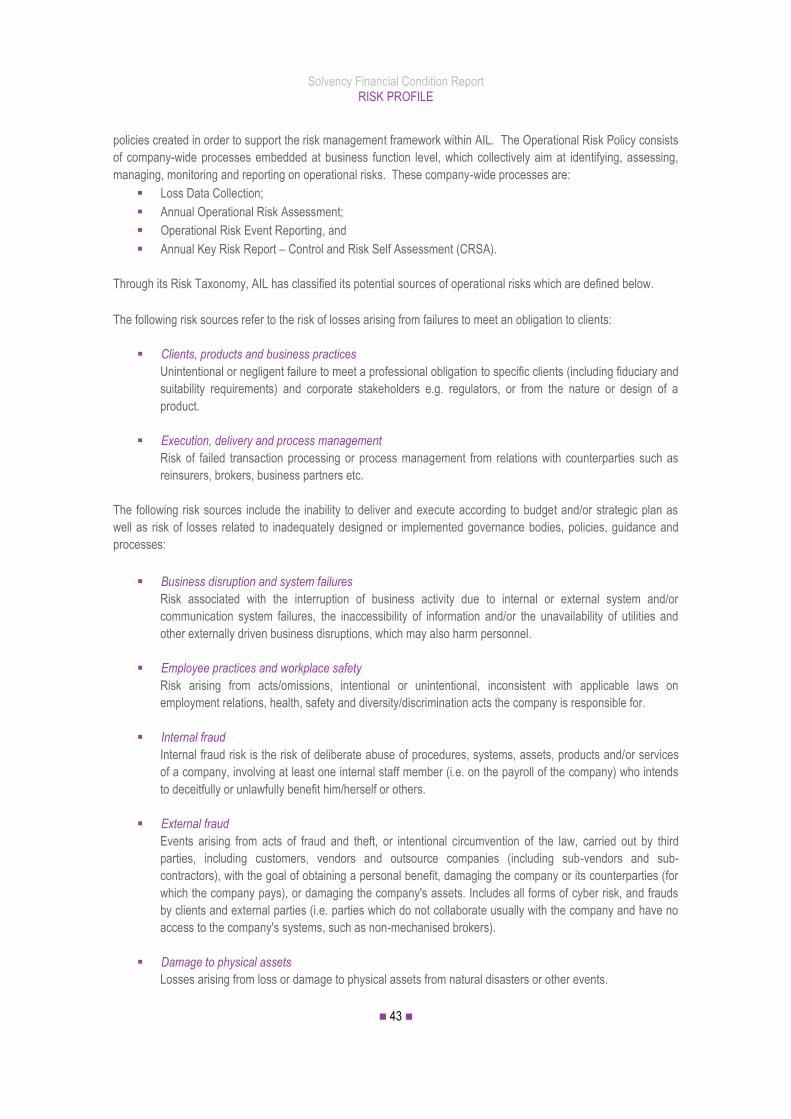
Solvency Financial Condition Report RISK PROFILE
43
policies created in order to support the risk management framework within AIL. The Operational Risk Policy consists
of company-wide processes embedded at business function level, which collectively aim at identifying, assessing,
managing, monitoring and reporting on operational risks. These company-wide processes are:
Loss Data Collection;
Annual Operational Risk Assessment;
Operational Risk Event Reporting, and
Annual Key Risk Report – Control and Risk Self Assessment (CRSA).
Through its Risk Taxonomy, AIL has classified its potential sources of operational risks which are defined below.
The following risk sources refer to the risk of losses arising from failures to meet an obligation to clients:
Clients, products and business practices
Unintentional or negligent failure to meet a professional obligation to specific clients (including fiduciary and
suitability requirements) and corporate stakeholders e.g. regulators, or from the nature or design of a
product.
Execution, delivery and process management
Risk of failed transaction processing or process management from relations with counterparties such as
reinsurers, brokers, business partners etc.
The following risk sources include the inability to deliver and execute according to budget and/or strategic plan as
well as risk of losses related to inadequately designed or implemented governance bodies, policies, guidance and
processes:
Business disruption and system failures
Risk associated with the interruption of business activity due to internal or external system and/or
communication system failures, the inaccessibility of information and/or the unavailability of utilities and
other externally driven business disruptions, which may also harm personnel.
Employee practices and workplace safety
Risk arising from acts/omissions, intentional or unintentional, inconsistent with applicable laws on
employment relations, health, safety and diversity/discrimination acts the company is responsible for.
Internal fraud
Internal fraud risk is the risk of deliberate abuse of procedures, systems, assets, products and/or services
of a company, involving at least one internal staff member (i.e. on the payroll of the company) who intends
to deceitfully or unlawfully benefit him/herself or others.
External fraud
Events arising from acts of fraud and theft, or intentional circumvention of the law, carried out by third
parties, including customers, vendors and outsource companies (including sub-vendors and sub-
contractors), with the goal of obtaining a personal benefit, damaging the company or its counterparties (for
which the company pays), or damaging the company's assets. Includes all forms of cyber risk, and frauds
by clients and external parties (i.e. parties which do not collaborate usually with the company and have no
access to the company's systems, such as non-mechanised brokers).
Damage to physical assets
Losses arising from loss or damage to physical assets from natural disasters or other events.

Solvency Financial Condition Report RISK PROFILE
44
AIL aims to keep the above operational risks at appropriate levels by maintaining sound and well-controlled
environments in light of the characteristics of its business, the markets and the regulatory environments in which it
operates. While these control measures mitigate operational risks, they can never completely eliminate them.
The AIL CRSA is completed quarterly. AIL risk evaluation/monitoring is planned annually. These items feed into an
annual Management Control Statement which is issued by the AIL CEO who expresses confidence in AIL control
frameworks.
1.4. Other risks
Other risks cover all the other external and internal factors that can impact AIL’s ability to meet its current business
plan and objectives.
The identification of strategic risks takes place annually, through the Strategic Planning Process, and more frequently
as part of the Key Risk Reporting process. The annual process considers, at a high level, those changes in the
operating environment which may substantively affect the achievement of AIL’s long term business growth plan. This
annual process is enhanced by more regular reviews, aligned to the quarterly Risk Committee cycle, which ensure
that emerging risks or changes to the planning assumptions are adequately captured and reflected in the ‘Top Risk’
profile.
Within AIL taxonomy, these are considered to be the following:
Regulatory change risk
The risk that changes in regulation, with regard to allowable product features, conduct of business, underwriting
practices, reserving and solvency, could affect the volume or quality of new sales or the profitability of a business
line.
Competitor risk
Competitor risks arise due to changes in competitor landscape or market position.
Distribution risk
This is the risk of a loss due to distribution plans deviating adversely from expectations. This type of strategic risk has
been singled out for particular attention due to the importance of distribution in AIL’s business model and our reliance
on external parties and partners for this distribution. Distribution risk can arise due to a number of causes including
lack of alignment of incentives, poor relationship management or lack of sufficient bargaining power in the
relationship.
Reputational risk
This is the risk of loss resulting from damages to the company’s reputation, in lost revenue; increased operating,
capital or regulatory costs; or destruction of shareholder value.
Country risk
Country risk refers to the risk of investing in a country which may adversely affect operating profits or the value of
assets in a specific country. For example, financial factors such as currency controls, devaluation, regulatory
changes, stability factors such as mass riots, civil war and other potential events that contribute to companies’
strategic risks (e.g. Eurozone break-up). Country risk only refers to risks affecting all companies operating within a
particular country.

Solvency Financial Condition Report RISK PROFILE
45
Economic environment risk
General economic environment risk refers to economic environment factors change and the impact this can have on
the general business environment, customer behaviour, etc. A key example is inflation risk, which represents the
sensitivity of the value of assets and liabilities to changes in inflation expectations.
Other environmental risks
Environmental risk covers a range of changes to the external environment not already covered by the categories
above, including:
technology shifts such as the application of internet technology and the impact this can have on customer
buying behaviour and the need to develop appropriate IT strategies;
other emerging risks are those major scale events or circumstances beyond one’s direct capacity to
control, which would impact in ways difficult to imagine today, such as potential claims due to
nanotechnology or changing weather patterns;
contagion risks – an extreme form of concentration risk that arises when usually unrelated risk factors
affect each other and become highly correlated – linked to the greater levels of connectivity across the
world and therefore our markets and risk types.
Concentration risk
Concentration risk further refers to all risk exposures, with a loss potential that is large enough to threaten the
solvency or the financial position of AIL.
1.5. Risk exposure
1.5.1 Key Risks
The key risks faced by Ageas UK are reviewed quarterly by the Prudential and Conduct Risk Committee and
subsequently by the Board Risk Committee. The monitoring of these risks as assessed by the business (first line) is
facilitated by the quarterly CRSA process, focusing on the underlying functional level risks and controls. Ageas UK’s
methodology for assessing the internal control framework is documented in the Enterprise Risk Management
documentation, and also externally through the RSR (to Regulator) and SFCR (to Investors) documents.
The Prudential Risk Committee focuses on risks with a financial and solvency impact and which relate predominantly
to AIL. Risks contained in this section reflect the latest assessments performed by the business as per Q4 2016 and
with a Level of Concern (LOC) of 4 and 5, which are the two highest categories.
A number of risks with the highest level of concern 5 relate directly to the Ogden rate change impacting the increase
of outstanding claims (claims inflation) and the subsequent impact on the ability to price correctly in a dislocated
market post Ogden (Underwriting and Pricing Risk and Deteriorated Market Environment). Other key risks are
associated with the uncontrolled run-off of a managing general agent, which include counterparty default risk and
underwriting risk in terms of unfavourable loss ratios, as well as cyber risk.

Solvency Financial Condition Report RISK PROFILE
46
1.5.2 Risk Profile
The table below depicts the risk profile of AIL, in line with its risk taxonomy, and those risks’ contribution to SCR.
£’m 2016
Market Risk 145.7
Counterparty Default Risk 67.4
Non-life Underwriting Risk 393.7
Operational Risk 69.7
Diversification effect (116.0)
Loss Absorbing Capacity of Deferred Taxes (5.3)
SII - SCR PIM (Pillar 1) 555.2
The most material risk to AIL arises from underwriting risk (71% of year end 2016 SCR PIM), which is assessed
using the internal model. All other risks (including diversification) are assessed using Standard Formula.
Capital requirements (SCR PIM) have increased by £57m to £555m primarily driven by the impact of Ogden rate
changes (£44m) in Q4 2016, underwriting risk calibration updates during Q1 (+£16m), and approved major model
changes (+£6m due to change to Nat Cat modeling from RMS v13 to v15 and modelling of large loss dependencies).
Market risk reduced by £2m mainly driven by a transfer of equity holdings to property (with a lower capital charge),
offset by £9m increase in counterparty default risk mainly due to higher broker exposures (receivables from broker
advance deposits) and knock on impact of Ogden rate changes. Operational risk increased £14m in line with
increases in technical provisions (particularly driven by the Ogden rate change impact on technical provisions).
Level of Concern
1-No Concern
2-Tolerable Concern
3-Some Concern
4-Of Concern
5-Highly Concerning
Impact Likelihood
<£5m >12mth
>£5m <12mth
>£15m <6mth
>£35m <3mth
>£70m <1mth
Risk
ID Risk Name
Like
lihoo
d
Cus
tom
er Im
pact
Fin
anci
al Im
pact
Leve
l of C
once
rn
R-54 Claims inflation risk / Ogden 4 - 5 5
R-55 Run-off of an MGA 4 - 4 5
R-57 Underwriting & Pricing Risk 3 - 5 5
R-52 Deteriorating market environment 3 - 5 5
R-10 Cyber risk 4 4 4 5
R-53 Losses arising from a weather event 3 - 4 4
R-31 External claims fraud risk 3 - 4 4
R-43 Investment risk 3 - 4 4
R-06 Systems performance risk 5 3 3 4

Solvency Financial Condition Report RISK PROFILE
47
1.5.3 Risk Mitigation
Reinsurance
Reinsurance is a key risk management tool used by Ageas to control underwriting risk, and to optimise it in line with
Ageas’ return targets and risk appetite.
As stated in the Reinsurance Policy, reinsurance is purchased primarily to cover against significant adverse events, a
large volume of claims from the same incident and large individual losses, which would seriously impact the AIL profit
and loss account and/or balance sheet strength in any one year. AIL only purchases reinsurance that will accomplish
genuine risk transfer.
AIL’s approach to reinsurance is to structure an annual programme so as to manage solvency within risk appetite, as
well as minimise the volatility that would otherwise arise from adverse deviation from business plan claims costs, as
a result of large individual claims or events as specified above.
The main elements of the reinsurance programme are the Motor and Property treaties, which combined represent c.
93% of the expected reinsurance spend.
1.6. Stress and Scenario Testing
1.6.1 Overview
The 2016 SST exercise was carried out in line with UK Harmonised Approach to Stress and Scenario Testing, which
outlines the process and governance for SST exercises.
A number of tests were carried out in 2016 to provide a robust challenge to the Ageas UK control framework:
MYB/ORSA exercise (Group and Local) - The purpose of these tests is to assess the resilience of the
MYB and capital solvency to situations with adverse impact to the business
Standard Formula Appropriateness Review - The aim is to assess the appropriateness of the SF
(market wide calibrated) parameters to capture the Ageas operational risk profile; a number of scenarios
are assessed to test their relation (individually and combined) to the overall operational risk charge
2016 Investors relations reporting - The purpose of these tests is to assess the impact (as at Q4'15) of
anticipated changes to economic market conditions (e.g. Interest rates) and regulation (e.g. Ultimate
Forward Rate proposed changes by EIOPA), as well as provide timely information about business
resilience to investors (the results of the tests were disclosed to investors during 2016)
A number of other stress and sensitivity tests were also carried out as part of quarterly reporting (e.g. LAT tests,
parameter sensitivity for SCR capital modelling, risk appetite solvency and liquidity monitoring, etc.).
The SST analyses are designed to assess the key volatilities, risks and adverse evolutions. They are specified in the table below.
SST1 is an extreme severity test reflecting 9 weather events over a 3 year period with each event corresponding to a
‘1 in 7’ loss with each individual loss being below the reinsurance attachment. Despite these losses, a ratio of just
over 100% SCR was forecast at the end of the MYB period. The 9 weather events over 3 years total a c. £400m net
loss. For comparative purposes, this loss is approximately 2/3 of the amount of a 1 in 200 year Cat loss impact
(gross of RI) on the SCR.

Solvency Financial Condition Report RISK PROFILE
48
SST5 relates to existing bodily injury
large loss reserves running-off
adversely with a +20 percent point
reserve movement and increased loss
ratios of +5 percent point. This
scenario would be broadly equivalent
to a 1 in 30 impact on capital solvency.
SST42 is a Reverse Stress test of a
major Natural Catastrophe event
resulting in a breach of regulatory
minimum of 100% SCR PIM in 2016
although recovering over the MYB.
This scenario is extremely remote and
would require a Gross Cat event of c.
£600m or approximately 1 in 200 year
return period, and is substantially
mitigated through reinsurance.
The table below summarises the impact that each stress test would have on the YE’16 position.
YE'16 2017 2018 2019
Base 91%
Solvency impact of test (incremental)
SST1 -12% -30% -23% 4%
SST2 0% -14% -7% -6%
SST3 -14% -10% 1% 2%
SST4 -4% -8% 1% 2%
SST5 0% -27% -19% -17%
SST6 0% -14% 1% 2%
SST7 0% -15% 1% 2%
SST22 0% -11% -7% 0%
SST23 0% -7% 0% 2%
SST24 0% -8% 0% 3%
SST42 -20% -10% 2% 2%
SST1 (Multiple weather events) and SST5 (Motor Large Loss) are assessed as having the most adverse impact to
solvency.
The results of the Group and Local tests have been analysed pre and post dividend (as per MYB base case planned
dividend). Further capital contingency actions could be taken after the stress event, in line with the Capital
Management and dividend policy.
The capital contingency plan summarises the actions to be taken should the Solvency Ratio of AIL be at certain
levels and with a specific focus on the different means at AIL’s disposal to manage the solvency ratio. Broadly
speaking, capital optimisation takes place as part of the MYB. Should the Solvency Ratio drop below Target then
various actions are proposed with the actions becoming more severe as the Solvency Ratio gets lower. The severity
of the actions also impact the efficiency of the balance sheet restructuring. The key areas covered in the capital
contingency plan include:
SST ID Test name
SST.1 Multiple weather events
SST.2 Soft Market - Motor Attritional loss experience
SST.3 PPO shock #1 - Change in legislation & Cessation of
Motor Reinsurance Market
SST.4 PPO shock #2 - Change in life expectancy & economic
assumptions
SST.5 Adverse Motor Large loss experience
SST.6 Sudden (and unanticipated) rise in UK interest rates
SST.7 Downgrade of investment counterparties
SST.22 Group Scenario - Global Economic Downturn
SST.23 Group sensitivity - low rates viability
SST.24 Group sensitivity - increasing rates viability
SST.42 Major Cat Event

Solvency Financial Condition Report RISK PROFILE
49
Capital demand options: include actions reducing, for example underwriting and market risks and their
respective capital charges required.
Capital supply options: including equity, dividend retention and subordinated debt issuance in the context
of maintaining/improving solvency and optimising capital structure and ROE.
1.6.2 MYB/ORSA exercise (Group and Local tests)
These tests aim to assess the consequences of adverse events over the MYB period. Via these tests, AIL verifies
whether the realisation of an adverse event would lead to breaches in risk appetite as described previously and if so,
what management actions would be needed to address it.
During 2016 Ageas performed a range of Stress and Scenario Tests (SSTs), with input from key personnel
throughout the business (Underwriting, Reserving, Finance, Capital, and Risk), which aimed to identify a range of
tests anticipated to cause:
adverse movements in capital solvency compared to plan (stress tests)
the business plan to become unviable (reverse stress tests).
Risk Management sought the input of the Board Risk Committee to help challenge the appropriateness of the tests.
Subject matter experts from various areas of the business quantified the tests and provided their conclusions to the
Risk Management team. The outcome was documented and agreed.
A list of the Group Tests carried out in 2016 is presented below:
SST ID Test name Risk
source
High level overview of assumptions
SST.22 Group Scenario
- Global
Economic
Downturn
Market
risk
Global Market uncertainty (including UK and Europe) over the 2016 to 2019 MYB
period.
Interest rates – BoE pushing GBP 1 year rate to ‘0’ and staying at this level after
2017. ECB also pushing rates down consecutively 2017-2019 (with 0-rates for 10
year maturity in 2019)
Currency - Sterling to go down against the Euro (1£ = 1€) for 2017-2019.
Equities - UK and Eurozone equity to go down by -10% (’17), -40% (’18), -10%
(’19).
Credit spreads - UK credit spreads to go up over 2017-2018 period [~+100bps for
AAA, ... , +200bps for BBB,... +300 bps for B...] for non-financials – this
calibration considers the highest observed spread levels (2008) delta to current
levels; and 150% of this for financials spreads, aligned to EIOPA 2016 test.
SST.23 Group sensitivity
- low rates
viability
Market
risk
Swap rates remain at -30bps forever, UFR drops with 20bps a year
Sovereign & corporate credit spreads drop to ‘0’%, VA as well.
Solvency II lapse down scenario materialises, clients remain in loss making
products.
SST.24 Group sensitivity
- increasing
rates viability
Market
risk
Swap rates increasing over 3 years to level of 4.2%, UFR remains flat at 4.2%
with inflation increasing to level of 2%,
Sovereign & corporate credit spreads also gradually increase,
Lapse up /Mass lapse scenario materialises, clients leave products with low
guarantees / returns.
SST.25 Group RST -
default of most
material
Credit
risk
This scenario is a Reverse Stress Test to Group, but expected to represent a
Stress test for the UK OpCos
A default of the most material corporate counterparty.

Solvency Financial Condition Report RISK PROFILE
50
Corporate
SST.26 Group RST -
default of most
material
Sovereign
Credit
risk
This scenario is a Reverse Stress Test to Group, but expected to represent a
Stress test for the UK OpCos
A default of the most material (home) sovereign counterparty.
A list of Local UK Tests carried out in 2016 is presented below:
SST ID Test name Risk source High level overview of assumptions
SST.1 Multiple weather
events
Insurance
risk
Multiple UK flood/storms in each year-end; 2016 (2 events), 2017 (3),
2018 (4), each event with severity 1 in 7 just below RI cover (£40m
each)
SST.2 Soft Market - Motor
Attritional loss
experience
Insurance
risk
Business follows motor market down to maintain case count with Motor
GWP 10% lower than budget in 2016/2017/2018 and Motor Loss ratio
3pp deterioration year on year
SST.3 PPO shock #1
Change in legislation
& Cessation of Motor
Reinsurance Market
Insurance
risk
Propensity shock whereas 90% of unsettled claims above £1m (with
less than 50% paid) are settled as PPOs; Settled claims shock where
historic claims settled since Jan 2008 are reopened and claimants are
compensated for the gap between PPO and lump sum settlement
SST.4 PPO shock #2
Change in life
expectancy &
economic
assumptions
Insurance
risk
Discount rate shock where -1% real discount rate is applied to existing
and IBNR PPOs; Age impairment shock where age impairments are no
longer allowed for in reserve calculations
SST.5 Adverse Motor Large
loss experience
Insurance
risk
Existing Bodily Injury large loss reserves run-off adversely (+20pp
reserve movement); Future Pricing based on under-estimated reserves
is too low resulting in increased loss ratios (+5pp)
SST.6 Sudden (and
unanticipated) rise in
UK interest rates
Market risk Instantaneous 100bps increase up to 7 year maturity, and keeping yield
curve after 7 year point (expected to align to 1 in 30)
SST.7 Downgrade of
investment
counterparties
Credit risk 1 credit grade notch downgrade on all investment counterparties
SST.9 Strategic dependence
on distribution
partners
Strategic risk Assess the negative impact that a partial or complete loss of distribution
could have on the business plans and strategy.
SST.10 Retention sensitivities Strategic risk 1 pp reduction in retention rates impact on loss of income and policy
count for Motor and HH (inclusive of lost add-on commission income
and lost APR income) for Direct and Partnerships
SST.11 New business
sensitivities
Strategic risk 1pp reduction in new business impact on loss of income and policy
count for Motor and HH (inclusive of lost add-on commission income
and lost APR income) for Direct and Partnerships
SST.12 Add-on sensitivities -
linked to Plevin Case
Strategic risk Capping core product and add-on commission at 50% of total premium
payable; 10% reduction in add-on income
SST.13 Cost per acquisition
sensitivity
Strategic risk 25% increase in Cost per Acquisition (CPAs) over MYB (includes Direct
Marketing/Operations costs)

Solvency Financial Condition Report RISK PROFILE
51
SST.14 Budgeted Change
benefits
Strategic risk 50% reduction in budgeted benefits over MYB
SST.15 Differential Pricing Insurance
Risk
Direct and Partnership reduction to 20% retention level; Same volume
of premium is maintained through new business volume increase
(reduced profitability)
SST.16 Volume change Strategic risk 40% reduction in take up of Back Me Up (BMU) to planned numbers in
Year 1; 50% increase in loss ratio in each MYB year.
SST.42 Major Cat Event Insurance
risk
Local Reverse Stress test: Gross Nat Cat loss event (flood/storm) in the
UK
SST.44 Financial
Misstatement
(e.g. RSA Ireland)
Operational
risk
Local Reverse Stress test: Collusion with Senior Management team
results in financial accounts being mis-stated over an extended period
of time. This is only discovered after a number of years and results in a
significant under-representation of the case reserves and IBNR in the
Balance Sheet, as well as a number of P&L items that have been
treated incorrectly.
SST.1, 2, 3 and 4 represent an update to the tests carried out as part of the 2015 ORSA exercise as the underlying
risks remain relevant for AIL. A number of other tests (e.g. SST.9 to SST.16) were added to reflect the UK strategic
risks and a total UK view of capital (i.e. AIL, Retail and Other).
The Reverse Stress Tests above assume a scenario where solvency would be approximately at the breakeven point
of 100% SCR (i.e. wipe-out of the existing risk appetite buffer above regulatory solvency).
Solvency Financial Condition Report RISK PROFILE
52
2 Description of any other material information regarding the risk profile
The key risks faced by AIL are reviewed quarterly by the Prudential and Conduct Risk Committee and subsequently
by the Board Risk Committee. The monitoring of these risks as assessed by the business (first line) is facilitated by
the quarterly CRSA process, focusing on the underlying functional level risks and controls. Ageas UK’s methodology
for assessing the internal control framework is documented in the Enterprise Risk Management documentation, and
also externally through the RSR (to Regulator) and SFCR (to Investors) documents.
Risks for which a Solvency Capital Requirement is measured using the PRA approved model (SCR PIM) are
considered Pillar 1 risks.
Risks that are not covered under the SCR PIM are considered under Pillar 2. Risks not covered under the SCR
calculation are outlined in the ORSA report, and briefly described below:
To-Ultimate volatility: the capital requirement calculated under SCR reflects a one-year view of risk against
1 in 200 year events; this does not allow for potential adverse movement / volatility that may arise after one
year (full run-off of the exposure).
Pension scheme longevity and inflation risks: longevity risk (liabilities only) and inflation risk (assets and
liabilities) are not included in the SCR PIM.
Risks not covered by the SCR are captured in the quarterly CRSA process, and ORSA.

Solvency Financial Condition Report VALUATION FOR SOLVENCY PURPOSES
53
D
VALUATION FOR
SOLVENCY PURPOSES
This chapter should be read in conjunction with the market
consistent balance sheet (MCBS) of Solvency II
as reported in the Quantitative Reporting Template S. 02.01.
Audited (with the exception of section 2.8)

Solvency Financial Condition Report VALUATION FOR SOLVENCY PURPOSES
54
1 Valuation of assets
1.1 Valuation of assets
The table below summarises per material class of asset the basis, methods and main assumptions used for the
valuation of assets. For the data, we refer to the Quantitative Reporting Template (S.02.01.b).
Asset class Basis, methods and main assumptions used
Deferred acquisition costs Valued at nil.
Deferred tax assets Value based on the difference between the value of the underlying assets and
liabilities in the MCBS and the tax base balance sheet. The measurement
principles of IAS 12 are applied in valuing deferred tax assets.
A net deferred tax asset is only recognised to the extent that it is probable that
future taxable profit will be available against which the unused tax losses and
unused tax credits can be utilised. See section 1.3 for further details.
Property, plant and equipment
(PPE) held for own use
PPE held for own use consists of buildings, IT equipment, other equipment and
motor vehicles.
The value of a property is assessed using different valuation methods. These
include external valuations, whose timing is at management discretion and
discounted cash flows. The discount rate will be based on property yields for
the surrounding location of the building and previous or estimated rental
values.
For other categories of PPE, the IFRS valuation is used due to the assessment
that there are immaterial differences between the IFRS value and fair value.
Property (other than for own
use)
The investment property is reported at cost less accumulated depreciation for
IFRS. An adjustment is included in the MCBS to fair value this asset.
The value of a property is assessed using different valuation methods. These
include external valuations, whose timing is at management discretion and
discounted cash flows. The discount rate will be based on property yields for
the surrounding location of the building and current rental values.
Participations The Company has determined that there is no adjustment required to the value
of its participations as it is already held at the fair value of the investment.
Government and Corporate
Bonds
The company uses mark to market based on quoted prices in active markets
that are sourced independently (level 1). Where the assets are less liquid and
no readily available market exists then observable data in active markets (level
2) is used. Prices are sourced from external asset manager.
Accrued interest in relation to Government and Corporate Bonds is also
reclassified from ‘Any other assets, not elsewhere shown’ and included in the
value of Government and Corporate Bonds, to ensure the Solvency II value is
reported.

Solvency Financial Condition Report VALUATION FOR SOLVENCY PURPOSES
55
Asset class Basis, methods and main assumptions used
Collective Investments
Undertakings
The assets are less liquid and no readily available market exists so observable
data in active markets (level 2) is used. Prices are sourced from external fund
managers.
Deposits other than cash
equivalents
Under Solvency II all ‘Cash and cash equivalents’ must be readily convertible
on demand, without penalty. This definition is different to IFRS. Hence, some
items have been restated as ‘Deposits other than cash equivalents’ to meet the
Solvency II definition.
Other Loans & mortgages Loans to brokers are marked to market through the use of discounted cash
flow methodology (using market discount rates) to reflect market value.
Discount rate used is sourced from the Bank of England and is based on loan
interest rates for similar durations.
Reinsurance recoverables The reinsurance technical provisions are recalculated under Solvency II. Key
aspects in calculating the adjustment required include: allowing for the best‐
estimate of default in future recoveries associated with past claims, allowing for
the reinsurance premium and recoveries associated with excess‐of‐loss
treaties on unearned exposure, allowing for the profit or loss associated with
quota share reinsurance on unearned exposure, allowing for the reinsurance
share of provisions relating to binary events, allowing for appropriate amounts
in respect of legally‐obliged business and, transforming all reinsurance
amounts to cash flows and discounting to give the provision.
Insurance & intermediaries
receivables
All receivables included in this category of assets are reported at fair value
under IFRS excluding two items for which there are fair value adjustments.
Aged debt over three months is valued at nil due to the low probability of its
recoverability.
Further, receivables from salvage and subrogation are deducted from this
category of assets and included as a negative liability to reduce the technical
provisions.
Reinsurance receivables IFRS value is used because of immaterial differences between IFRS value and
fair value.
Receivables (trade, not
insurance)
IFRS value is used because of immaterial differences between IFRS value and
fair value.
Cash and cash equivalents IFRS value is used because of immaterial differences between IFRS value and
fair value.
Any other assets, not
elsewhere shown
Any other assets not elsewhere shown consist of:
Current tax assets: valued based on the applicable national tax regime. The
IFRS valuation is used due to the assessment that there are immaterial
differences between the IFRS value and fair value;
Deferred other charges: Using IFRS valuation due to the assessment that
there are immaterial differences between the IFRS value and fair value.

Solvency Financial Condition Report VALUATION FOR SOLVENCY PURPOSES
56
1.2 Material differences between SII basis and IFRS
The table below summarises per material class of asset the material differences between the valuation for Solvency
II purposes and the IFRS valuation. For the data we refer to the Quantitative Reporting Template (S.02.01.b).
Asset class Different basis, methods and main assumptions used for financial
reporting
Deferred acquisitions costs Under SII acquisition costs are included in the valuation of technical provisions.
Under IFRS they are separately valued according to period of future earnings.
Deferred tax assets The valuation under MCBS is based on the difference between the value of the
underlying assets and liabilities in the MCBS and the tax base balance sheet.
Government and corporate
bonds
Under IFRS government bonds and corporate bonds are reported excluding
accrued interest while under SII these are reported including accrued interest.
Hence, accrued interest is reclassified to reflect this.
Deposits other than cash
equivalents
Some items have been restated as ‘Deposits other than cash equivalents’ from
‘Cash and cash equivalents’ to ensure this better meets the Solvency II
definition of being readily available cash.
Loans & mortgages to
individuals
Under IFRS loans and receivables are measured at amortised cost, using the
effective interest method (EIR) less impairment while under SII, these are fair
valued.
Reinsurance recoverables Reinsurance recoverables are transformed to cash flows and discounted to
give the provision under SII ruling.
Insurance & intermediaries
receivables
A dilapidation provision adjustment is included based on a discounted cash
flow methodology. In addition, aged debt over three months is valued at nil
due to the low probability of its recoverability. Receivables from salvage and
subrogation are deducted from this category of assets and included as a
negative liability to reduce the technical provisions.
Cash & cash equivalents Some items have been restated as ‘Deposits other than cash equivalents’ from
‘Cash and cash equivalents’ to meet the Solvency II definition.
Any other assets, not
elsewhere shown
Accrued interest receivable is reclassified from this class of assets to financial
assets to ensure they are reported at their Solvency II value.
1.3 Explanation of calculation of future taxable profits and identified amount and expected time horizons for reversal of temporary differences (only in case of material recognised deferred tax assets)
AIL has unutilised tax losses which it acquired from Groupama Insurance Company Limited (‘GICL’) (now called
GICL 2013 Limited) under the Part VII Scheme of the Financial Services and Markets Act 2000 on 1 October 2013.
These can be carried forward to offset an agreed percentage of income tax liabilities arising on future taxable profits
of the combined business. These losses were supplemented in 2016 by an additional loss due to the change in the
Ogden discount rate. AIL must judge the extent that future taxable profits will arise such that any deferred tax asset is
based on profits that are more likely to arise than not based on tax rates that have been substantively enacted at the
Solvency Financial Condition Report VALUATION FOR SOLVENCY PURPOSES
57
balance sheet date. AIL has calculated the deferred tax asset based on the budget and forecasts, adjusting for any
material known tax differences that will arise in that period.
Deferred tax is recognised in full based on the latest board approved MYB and management’s confidence of
recovery of tax losses. The calculation is based on the expected effective tax rates in future years, being 20%
(effective from 1 April 2015), 19% (effective from 1 April 2017) and 17% (effective 1 April 2020).
A deferred tax asset is only recognised to the extent that it is probable that future profits will be available against
which the asset can be utilised. Deferred tax assets are reviewed at each reporting date and are reduced to the
extent that it is no longer probable that the related tax benefit will be realised.
In addition, deferred tax is provided on the unrealised gains/losses following the change in legislation from 1 Jan
2016. This is calculated as being the effective tax rate, being 20% in 2016, multiplied by the unrealised gain or loss
position as at the reporting date.
Other temporary differences include the unwinding of the claims equalisation provision, capital allowances and the
unwind of unrealised gains prior to the change in legislation.
There are no unused tax losses or tax credits for which no deferred tax is recognised on the balance sheet.
The IFRS deferred tax value is taken as the basis for the SII deferred tax asset. Deferred tax is then calculated on
the difference between the value of the underlying assets and liabilities in the MCBS and the tax base balance sheet
and layered on top of the IFRS tax value to get the SII deferred tax asset, net of deferred tax liabilities.

Solvency Financial Condition Report VALUATION FOR SOLVENCY PURPOSES
58
2 Valuation of technical provisions
2.1 Technical provisions by line of business
The table below shows the technical provisions at 31 December 2016 by line of business:
in GBP million
Direct business and accepted proportional reinsurance
Accepted non-
proportional reinsurance
Total Non-Life
obligation (per
S.17.01)
Annuities stemming
from non-life insurance contracts
and relating to insurance
obligation other than
health insurance
obligations (per S.12.01)
Income protection insurance
Motor vehicle liability
insurance
Other motor
insurance
Fire and other
damage to property
insurance
General liability
insurance Assistance
Misc financial
loss
Non-proportional
marine, aviation and
transport reinsurance
Premium provisions 2.0 294.7 76.9 104.5 15.0 3.6 53.9 0.0 550.6
Claims provisions 2.0 1,213.7 4.3 151.5 124.8 4.9 29.5 27.6 1,558.3
Total best estimate - gross 4.1 1,508.4 81.2 256.0 139.8 8.5 83.4 27.6 2,109.0 213.6
Risk margin 0.1 33.6 2.7 8.6 4.7 0.3 2.8 0.9 53.8 24.3
Technical provisions - total 4.2 1,542.0 83.9 264.6 144.5 8.8 86.2 28.5 2,162.8 237.9
Total recoverable from reinsurance (0.0) (260.7) (7.9) (6.7) (16.4) (0.4) (13.2) (2.7) (308.0) (154.2)
Technical provisions - net of RI 4.2 1,281.2 76.0 257.9 128.1 8.4 73.0 25.8 1,854.7 83.7
Valuation of our material classes of liabilities and a description of the bases, methods and assumptions used for Solvency II MCBS purposes
2.2 Generic items
2.2.1 Time horizon for cash-flow projections
The time horizon used in the calculation of the best estimate is the full lifetime of the existing (re)insurance liabilities
on the date of valuation. The determination of the lifetime of the (re)insurance portfolio is based on up-to-date and
credible information and realistic assumptions about when the existing liabilities will be fully run-off, cancelled or

Solvency Financial Condition Report VALUATION FOR SOLVENCY PURPOSES
59
expired. The cashflow projection used in the calculation of the best estimate takes into account all AIL cash inflows
and outflows. All cash-flows incurred in meeting liabilities are identified and valued.
2.2.2 Discounting
Discounting is performed for all relevant cash inflows and outflows, e.g. premiums, claims payments. As a
simplification, cashflows are expected to emerge at mid-year. Discounting is performed quarterly on annualised data.
All calculations performed at a time of different granularity from 1 year is first aggregated to annualised amounts
before being discounted at the appropriate discount rates. Discounting is performed using the quarterly GBP zero-
coupon interest rate curves (risk-free curve with volatility adjustment) as communicated by Ageas SA/NV Risk
Valuation. The cashflows are discounted back to the quarterly reporting date (t=0). The best estimate technical
provisions are then the sum of the discounted cashflows.
2.2.3 Granularity
The calculation of the best estimate technical provisions is based on a number of economic and non-economic
assumptions. AIL’s businesses are managed in a more granular way than at SII Lines of Business level, so the
assumptions are also set at a more granular level.
2.2.4 The level of uncertainty in the amount of technical provisions
Due to the uncertainty of future events, any modelling of future cash flows (implicitly or explicitly contained in the
valuation methodology) will necessarily be imperfect, leading to a certain degree of inaccuracy and imprecision in the
measurement (or model error).
For Non-Life business, the main input assumptions feeding the Best Estimate model are taken from the multi-year
budget and are revised on an annual basis. These assumptions (e.g.; loss ratios, expense ratios) are rolled forward
on a quarterly basis. The rolled forward assumptions are re-visited by the AIL capital team on a quarterly basis via
discussion with AIL Reserving Heads and AIL Finance Managers to ensure their ongoing appropriateness. The input
budget assumptions are revised in cases where there is a valid business reason to revise them.
2.2.5 Expenses
All expenses to be incurred in servicing insurance and reinsurance obligations are taken into account. Expenses are
direct operating expenses, local business overhead expenses as well as allocated central head-office expenses.
AIL expenses are categorised as Upfront Expenses (such as commission), Ongoing Expenses (such as operating
expenses and overhead), or Claims Handling Expenses (CHE).
Expenses associated with reinsurance contracts are included in the best estimate provisions calculation.
The cashflows include an appropriate allowance for claims inflation. The inflation rate is term dependent and set
relative to inflation instruments. Inflation rates are justifiable relative to external sources of information such as
Consumer or Retail Price Indices.
For AIL, inflation (where appropriate) is allowed for in the IFRS reserving process, the output of which feeds into the
AIL SII Best Estimate Technical Provisions model.
2.2.6 Commissions
For AIL, commission assumptions are taken from the AIL budget.
Upfront expenses feed into the AIL Best Estimate model. Upfront expenses include gross commissions, acquisition
expenses, overrider commission, net marketing fund, fulfilment costs.
Solvency Financial Condition Report VALUATION FOR SOLVENCY PURPOSES
60
2.2.7 Contract Boundaries
The allowance for future premiums within the AIL Best Estimate Model depends on the ‘boundary of the contract’.
The boundary of the contract is defined in the EIOPA’s technical specifications (Level 2 Implementing measures,
Article 13 TP2: contract boundaries) and the Group Best Estimate Manual as follows:
(a) Where the insurance or reinsurance undertaking has a unilateral right to terminate the contract, a unilateral right
to reject the premiums payable under the contract or an unlimited ability to amend the premiums or the benefits
payable under the contract at some point in the future, any obligations which relate to insurance or reinsurance
cover which would have been provided by the insurance or reinsurance undertaking after that date do not
belong to the existing contract;
(b) Where the undertaking’s unilateral right to terminate the contract or to unilaterally reject the premiums or its
unlimited ability to amend the premiums or the benefits relates only to a part of the contract, the same principle
as defined above should be applied to this part;
(c) All other obligations relating to the terms and conditions of the contract belong to the contract.
Inputs into contract boundary provisions may include:
Tacit renewals, where a legal obligation exists;
New business quotes (as issuing a quote will often implicitly mean that the insurer has already initiated and
agreed to the contract);
Options and guarantees (which may lead to further provisions if they are applied); and
Multi-year contracts. The SII premium provision should allow for the expected claims costs though the
whole remaining term of the contract and also the associated premiums and expenses.
Practically, for AIL, tacit renewals mean setting up a negative provision for renewals (where a renewal is deemed to
be those instances in which a renewal letter has gone out, but the policy has not incepted at the reporting date). The
provision is negative, as the policies are expected to be profitable.
AIL does not write any options and guarantees. AIL also has a small number of multi-year contracts, which are not
allowed for in the AIL Best Estimate Model. The allowance for these contracts would lead to the setting up of a small
negative provision and hence this approach gives us a result which is on the prudent side of the SII Best Estimate.
The Expected Profit In Future Premium represents a small part of AIL’s overall policies.
The provision for bound but not incepted business is for the profit or loss from these bound but not incepted policies.
This means that the ‘Expected Profit in Future Premium’ provision will only be significant if the business is expected
to run at a combined operating ratio which differs markedly from 100% (e.g.; if the business is expected to be very
profitable).
The method for calculating the provision is as follows:
Head of Underwriting provides Actuarial with information regarding the number of days in renewal notices
are sent out and what the take-up rate of renewals might be.
The amount of business (premium) can then be expressed as a percentage of the future year’s gross
earned premiums (GEP) by the expression:
Legally-obliged factor: Advance Days / 365 * Take-up Rate
Evaluating this is kept deliberately prudent by taking the lowest of the responses across all classes of business,
which happens to be in respect of Motor classes for the current year. The advance day assumption for all lines of
business is 30 days, the take-up rate assumption applied for all lines of business is 60%.

Solvency Financial Condition Report VALUATION FOR SOLVENCY PURPOSES
61
Claims and expenses in association with future premiums are then modelled in line with the methodology
outlined in section 2.1.4 and 2.1.5.
2.2.8 Testing
Testing is an integral part of the actuarial control cycle associated with the reserving process. It provides the
necessary feedback loop to the actuary, it provides the empirical evidence as to the inherent level of estimation error
associated with its forecast and should provide the formal assurance that the actuary is using adequate methods
within the framework and circumstances of which he has been commissioned to perform the necessary
assessments.
AIL best estimate provisions are subject to a number of tests, which predominantly focus on backtesting. The AIL
reserving teams backtest IFRS reserves, which are major driver of SII Best Estimate provisions.
2.3 Non-life
Non-life provisions consist of:
Claims provisions: cash flow projections relate to claim events having occurred before or at the valuation
date – whether the claims arising from these events have been reported or not (i.e. all incurred but not
settled claims);
Premium provisions: the cash flows relate to claims and expenses occurring in the future related to
policies in force according to contract boundaries defined above at 2.1.7 and below at 2.2.5.
2.3.1 Granularity
In additional to the generic description for granularity, additional requirements are in place for non-life.
The best estimate of claims provision and premium provision are calculated separately with a split between gross
insurance cash flows and reinsurance related cash flows.
The minimum level of segmentation is at homogeneous risk group level with a minimum level being the Solvency II
lines of business (LOBs). All the assumptions used for the calculation of the claims provision need to be consistent
with the assumptions used for the calculation of the premium provision and vice versa.
Claims must be split into four categories: attritional claims (claims with a cost under a predefined threshold), large
claims, claims arising from natural catastrophe events and claims arising from binary events.
AIL produce quarterly results at Best Estimate Model line of business and SII line of business level. AIL have 11
Best Estimate model lines of business.
2.3.2 Cash flow projection for claims provisions
The cash flow projection used in the calculation of the best estimate takes into account all cash in- and outflows
required to settle the insurance obligations over their lifetime. Therefore all cash flows incurred in meeting liabilities
are identified and valued.
The scope for Claims provision includes:
Outward cash flows
Claims payments payable to policyholders or beneficiaries;
Expenses incurred in servicing insurance obligations;
Reinstatement premiums; and

Solvency Financial Condition Report VALUATION FOR SOLVENCY PURPOSES
62
Binary events provision.
Inward cash flows
Recoverables from reinsurance contracts and special purpose vehicles (AIL do not have SPVs);
Recoverables for salvage and subrogation.
For AIL, the Booked IFRS reserves are the starting point (and major input into) the Best Estimate Claims Provision
model.
The scope for Premium provision includes:
Outward cash flows
Claims payments payable to policyholders or beneficiaries from claims occurred since the valuation date
until the term of the contract;
Commissions to be paid since the valuation date until the term of the contract;
Reinsurance premium or reinstatement premiums;
Expenses incurred in servicing (re)insurance obligations;
Expenses necessary to handle claims until settlement;
Expenses necessary to administer contracts during the valuation period;
Acquisition expenses (other than commissions);
Investment expenses necessary to administer the assets representing the liabilities related to contracts
during the valuation period; and
Binary events provision.
For AIL, the IFRS unearned premium reserve (UPR) is the starting point (and major input into) the Best Estimate
Premium Provision model. Our forward looking (budget) assumptions are then applied to this UPR (net of deferred
acquisition costs (DAC)) in order to derive our SII Best Estimate Premium Provisions.
Inward cash flows
Premiums to be written until the term of the contract (future premiums);
Recoverables from reinsurance contracts;
Recoverables for salvage and subrogation.
2.3.3 Claims payments
Claims are split into four categories: attritional claims (claims with a cost under a predefined threshold), large claims
(claims with a cost above a predefined threshold excluding catastrophe claims), claims arising from natural
catastrophe events and claims arising from binary events (restricted to events with very low frequency-high severity
(which could be one large claim or an accumulation of attritional claims)).
Methods to value attritional claims and large losses are aggregate methods where claims are grouped per accident
year and where payments are grouped by accounting year to form a claims triangle.
The main reason for isolating Large and Catastrophe claims from others is that, in many cases, large claims require
a dedicated valuation technique, as the claims characteristics are different. Furthermore, AIL (along with all
companies in the market) do not have adequate internal catastrophe data, as catastrophe events by definition are
low frequency, high severity. Furthermore, non-proportional reinsurance will be selected by considering large loss
and catastrophe losses separately and therefore it makes sense to produce our AIL numbers on a consistent basis.
As a consequence, isolating large and catastrophe losses from other losses is deemed appropriate and is in line with
market practice.

Solvency Financial Condition Report VALUATION FOR SOLVENCY PURPOSES
63
Tail Factor
When assessing the size of the reserves, it is necessary for some long-tail lines of business (such as Motor Liability)
to allow for a tail factor. Long-tail lines of business do not proceed to final settlement until several years beyond the
policy expiration. This long-tail nature leads to further volatility around our best estimate provisions, which leads to
the application of a tail factor (and hence further provisions) for some longer tail lines of business. Assessments,
based on the available triangle data, may lead AIL to consider a tail factor that estimates the development beyond
the last stage of known historical developments.
2.3.4 Reinsurance recoveries
Recoverables from reinsurance contracts are shown separately on the asset side of the balance sheet as
“recoverables from reinsurance contracts”.
AIL cedes reinsurance in the normal course of business for the purpose of limiting its net loss potential through the
diversification of its risks. The reinsurance programme is across all lines of business with the exception of the income
protection insurance business. Reinsurance recoveries include balances due from reinsurance companies for
reinsurance claims. Amounts recoverable from reinsurers are estimated in a manner consistent with the outstanding
claims provision or settled claims associated with the reinsured policy.
The time value of money is taken into account in the calculation of reinsurance recoveries. Furthermore reinsurance
recoveries are adjusted for the expected losses due to the default of the counterparty (Counterparty default
adjustment is negligible on current AIL recoveries).
Counterparty defaults are derived by reference to the credit quality and term of AIL reinsurance cashflows.
Expenses related to the internal processes for reinsurance are allowed for in the expenses forming part of the gross
best estimate.
2.3.5 Expenses
Expenses assumptions are based on experience over the last year or another recent period. Any trends observed or
unusual events such as catastrophes are analysed on their propensity to be included in future projection valuations.
In this respect the past one-off expenses may be excluded from consideration (if justifiable).
Expenses are calculated on a going concern basis.
2.3.5.1 Commissions
Future commission assumptions are only considered for the part of the premium provisions related to premiums not
already written. These commission assumptions are generally expressed as a percentage of written premiums.
2.3.5.2 Acquisition Expenses
Future acquisition costs are valued when regarding cashflows related to premium provisions and considered
differently depending on whether the premium has already been written or not. For the part of provision constituted
by premium already written, no acquisition cost is projected since all expenses are considered as having been paid
at the drawing up of the contract. For renewals, acquisition cost is projected since these expenses have not yet been
paid.
2.3.5.3 Administration and Operating costs
Expenses connected with ongoing administration of in-force policies and operational businesses (including
reinsurance costs) are allocated to premium provisions.

Solvency Financial Condition Report VALUATION FOR SOLVENCY PURPOSES
64
2.3.5.4 Claims Expenses
Claim management expenses which are related to claims that have occurred before the valuation date are
considered for the cash flows related to claims provisions.
Expenses related to claims that will occur in the period covered by the in-force premiums are considered when
regarding cash flows related to premium provisions.
2.3.6 Binary events – Man-made Catastrophe events
The definition of “Man-made Catastrophe/binary events” is restricted to those events with very low frequency-high
severity (which could be one large claim or an accumulation of attritional claims). AIL makes a distinction between
the claims arising from natural catastrophe events classified as Natural Catastrophe claims and Man-made
catastrophe (called Binary events under SII terminology).
Typical Natural Catastrophe events are Earthquakes, Floods, Windstorms, Tsunamis, etc.
Examples of binary events are large explosions, latent claims e.g. asbestos; legislative changes e.g.
Ogden table changes, etc.
Binary events are explicitly considered in premium provisions and claims provisions, in a consistent way. Natural
catastrophe events are explicitly considered in premium provisions.
Not all lines of business will be affected to the same extent by binary events and natural catastrophe events. Longer
tailed classes of business are more affected by binary events.
Binary events are allowed for in the Best Estimate Model by considering the ratio of expected man-made
catastrophe losses from the internal model to the GEP at line of business level and setting up a
corresponding provision.
For Claims Provisions, the only line of business which has a binary events provision is cancelled business,
which is a long-tail US business line no longer written which has exposure to Asbestos, Pollution and Health
(APH).
2.3.7 Inflation
Solvency II explicitly requires inflation to be taken into account in the calculation of technical provisions. Furthermore
inflation is considered on the claims and the expenses side.
Inflation is to be considered when projecting future cashflows: the cashflows that are potentially impacted by inflation
are:
Claims costs;
Expenses: the biggest part of expenses are salaries that will evolve over time;
Inflation that applies to claims, called “claims inflation”.
Claims inflation is one of the key assumptions used by non-life actuaries. The assumptions used for valuation are
consistent with other areas in which claims inflation assumptions have been applied.
Future claims inflation is highly difficult to estimate. It is typically only material for longer-tail lines of business, such
as Motor Liability. The impact of claims inflation on Motor Liability is exacerbated by the existence of PPOs for this
line of business.
2.3.8 Contract boundaries
In addition to the generic definition additional requirements are set out below.

Solvency Financial Condition Report VALUATION FOR SOLVENCY PURPOSES
65
The definition and issues arising from contract boundaries are fairly inconsequential when considering the claims
provision. It is the premium provision that is affected by the issues arising from this topic.
"Unincepted business" is those contracts that contribute to the Solvency II provisions and not to accounting reporting
(IFRS reporting). Inputs into this area include tacit renewals where a legal obligation exists and multi-year contracts.
The premium provision should allow for the expected claims cost throughout the whole remaining term of the
contract, as well as associated premiums and expenses.
It is possible for unincepted business to either increase or decrease the premium provision. If unincepted business is
expected to be profitable then a reduction in premium provision would be expected, however if unprofitable business
is expected, then this would cause an increase in the premium provision (all other things being equal).
2.3.9 Options and guarantees/Policyholder behaviour
As AIL does not include options and/or guarantees in its non-life book of business, these two subjects are stated
notionally. If AIL sells non-life insurance products with options and/or guarantees in the future, AIL will request
guidance from Ageas SA/NV on modelling.
2.3.10 Management action
AIL does not currently need to consider any management action for the valuation of their non-life best estimate
provisions. In particular, policies currently written by AIL do not include any discretionary features. Note that action in
relation to reinsurance, such as consideration of reinstatement premiums, is not considered as management action
and is dealt with in the section on "Reinsurance recoveries”.
2.3.11 Treatment of taxes when calculating the best-estimate liabilities
Taxes are not included in non-life best-estimate liabilities:
Taxes on profit are not relevant in Non-Life technical provisions;
Future premiums that are included in the computation of the best estimate are always net of taxes. AIL
collect premiums that include taxes and pay back the taxes to the taxation authorities. Any mismatch in
timing between the moment of tax collection and the moment of payment to HMRC can be assumed to be
negligible.
2.3.12 Uncertainty
Due to the uncertainty of future events, any modelling of future cash flows (implicitly or explicitly contained in the
valuation methodology) will necessarily be imperfect, leading to a certain degree of inaccuracy and imprecision in the
measurement (or model error).
Various types of errors can be observed when developing a model:
The process error which is intrinsic to the natural randomness of the process that we try to model;
The model error which comes from the choice of the model, which can be erroneous;
The parameter error (or estimation error) which comes from uncertainties in the value of the parameters of
the model.
AIL do not estimate process error, model error or parameter error for their Best Estimate provisions model.
2.3.13 Expert Judgement
Expert judgement/assessment is when the selection of a particular adjustment, methodology or parameter within the
best estimate model is based not just on scientific analysis but on the expertise of persons with relevant knowledge,
experience and understanding of the risks inherent in the insurance or reinsurance business.

Solvency Financial Condition Report VALUATION FOR SOLVENCY PURPOSES
66
A distinction is made between expert judgement and expert assessment. When the reserving actuary uses his
expertise in his daily work, the decision/choice will be classified as an expert assessment. When the decision is
outside of his normal work, this could lead to an expert judgement with high materiality or uncertainty.
The use of expert judgement must respect AIL’s governance: expert judgement should be justified, explained and
validated, the impact of expert judgement should be assessed and should be properly documented and subject to
testing.
Typical areas in non-life where expert judgement is applied are:
Tail factor
Because the tail factor linearly affects the whole claims portfolio contained in a triangle, it can be a material
item;
Loss ratios
The loss ratio of the current year is a key driver of premium provision and is thus highly material;
Impact of legislative changes.
2.4 Material changes in the level of technical provisions since the last reporting period, including reasons for material changes, especially material changes in assumptions
For the output of Non-Life SII Provisions, we refer to the Quantitative Reporting Templates S.17.01 and S.12.01.
The main drivers for the material changes to technical provisions since the last reporting period are the change in the
personal injury (Ogden) discount rate and the poor performance of a MGA (see section A – Business & Performance
for more details).
2.5 Details of the homogeneous risk groups used to calculate the technical provisions
Homogeneous Risk Groups (HRGs) are groupings per risk characteristic and these usually are equivalent at model
point level. For AIL, the SII Technical Provisions are calculated at Best Estimate/Internal Model line of business.
2.6 Details of the Economic Scenario Generator, including an explanation of how
consistency to the risk free rate has been achieved and which volatility assumptions have been chosen
AIL do not currently use an Economic Scenario Generator (ESG).
2.7 Impact of the reduction of the volatility adjustment to zero
As a long term investor, AIL is in principle not economically exposed to short term spread volatility. Solvency II
acknowledges this principle and defined the volatility adjustment (VA) to account for illiquidity of insurance liabilities
in the Own Funds. Valuing the balance sheet under the assumption that any assumed illiquidity premium (volatility
adjustment, VA), used to value illiquid liabilities, will not materialise allows us to have a view on the impact of this
illiquidity on AIL Technical Provisions. For YE 2016, the possible effect of a decrease of the volatility adjustment to
zero has been tested and implied a reduction in Solvency Ratio of <3%age points.

Solvency Financial Condition Report VALUATION FOR SOLVENCY PURPOSES
67
Although the VA is a good starting point, VA might not be appropriate for the specific situation of each individual
insurance company. Given the volatility adjuster disclosed by EIOPA is calibrated on a European based insurer
profile, AIL and Ageas SA/NV are convinced that a more appropriate volatility adjuster can be determined based on
AIL’s own assets and the specific characteristics of the liabilities. This is why Ageas SA/NV (in cooperation with AIL
and other Operating companies) is working on the development of a company specific volatility adjustment, which will
more accurately reflect AIL spreads on the AIL bond portfolio.
2.8 Risk Margin
The methodology for calculation of the risk margin involves the run-off of the basic SCR and operational SCR in line
with selected risk drivers. For Premium and Reserve risk, the risk drivers are at line of business level; other SCR
sub-risks are at AIL level. A cost of capital rate of 6% as defined by EIOPA is then be applied on the net present
value of the future non-hedgeable SCR.
The calculation is completed using a bottom up approach. The AIL risk margin is refreshed every quarter and feeds
into the MCBS technical provisions.
2.9 Explanation of material differences between the basis, methods and assumptions used for Solvency II MCBS compared to IFRS
The technical reserves mentioned in Solvency II MCBS are not the same as those required by local accounting
regulations or reserves as defined under IFRS.
The SII approach requires the calculation of Best Estimate Technical Provisions, which consist of Claims Provisions,
Premium Provisions and a Risk Margin. Booked IFRS reserves are an input into the AIL SII Best Estimate Model. A
Risk Margin is then calculated and added to the SII Best Estimate claims and premium provisions. The following
differences between IFRS and SII should also be noted:
Premium Provisions
Under SII, Premium Provisions are net of DAC
Under SII, we recognise profits in our UPR (which is not the case under IFRS)
Under SII, we allow for Binary Events in our provisions
Under SII, cash flows are discounted using a risk-free rate based on EIOPA guidance.
Claim Provisions
Under SII, we remove the Additional Risk Margin (ARM) from the Booked IFRS Reserves and calculate an
SII Risk Margin, calculated in line with section 2.9 of this report.
Under SII, an allowance is made for Binary Events.
Under SII, cash flows are discounted using a risk-free rate based on EIOPA guidance.
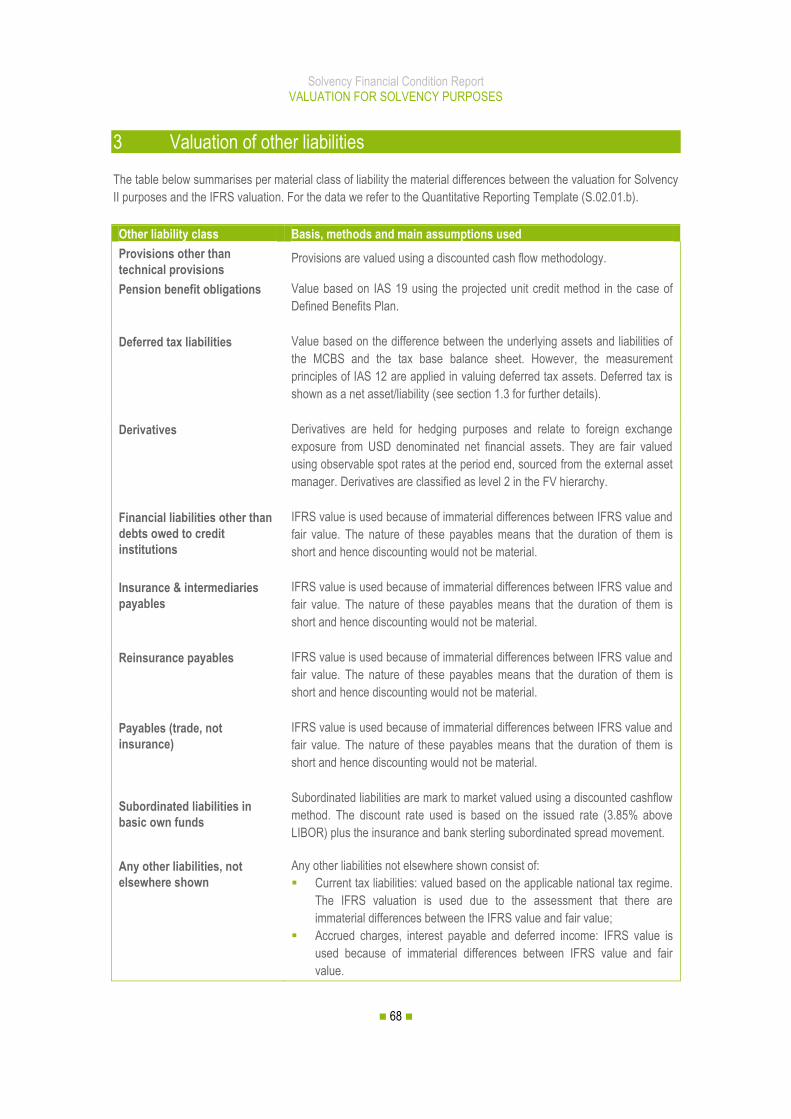
Solvency Financial Condition Report VALUATION FOR SOLVENCY PURPOSES
68
3 Valuation of other liabilities
The table below summarises per material class of liability the material differences between the valuation for Solvency
II purposes and the IFRS valuation. For the data we refer to the Quantitative Reporting Template (S.02.01.b).
Other liability class Basis, methods and main assumptions used
Provisions other than
technical provisions Provisions are valued using a discounted cash flow methodology.
Pension benefit obligations Value based on IAS 19 using the projected unit credit method in the case of
Defined Benefits Plan.
Deferred tax liabilities Value based on the difference between the underlying assets and liabilities of
the MCBS and the tax base balance sheet. However, the measurement
principles of IAS 12 are applied in valuing deferred tax assets. Deferred tax is
shown as a net asset/liability (see section 1.3 for further details).
Derivatives Derivatives are held for hedging purposes and relate to foreign exchange
exposure from USD denominated net financial assets. They are fair valued
using observable spot rates at the period end, sourced from the external asset
manager. Derivatives are classified as level 2 in the FV hierarchy.
Financial liabilities other than
debts owed to credit
institutions
IFRS value is used because of immaterial differences between IFRS value and
fair value. The nature of these payables means that the duration of them is
short and hence discounting would not be material.
Insurance & intermediaries
payables
IFRS value is used because of immaterial differences between IFRS value and
fair value. The nature of these payables means that the duration of them is
short and hence discounting would not be material.
Reinsurance payables IFRS value is used because of immaterial differences between IFRS value and
fair value. The nature of these payables means that the duration of them is
short and hence discounting would not be material.
Payables (trade, not
insurance)
IFRS value is used because of immaterial differences between IFRS value and
fair value. The nature of these payables means that the duration of them is
short and hence discounting would not be material.
Subordinated liabilities in
basic own funds
Subordinated liabilities are mark to market valued using a discounted cashflow
method. The discount rate used is based on the issued rate (3.85% above
LIBOR) plus the insurance and bank sterling subordinated spread movement.
Any other liabilities, not
elsewhere shown
Any other liabilities not elsewhere shown consist of:
Current tax liabilities: valued based on the applicable national tax regime.
The IFRS valuation is used due to the assessment that there are
immaterial differences between the IFRS value and fair value;
Accrued charges, interest payable and deferred income: IFRS value is
used because of immaterial differences between IFRS value and fair
value.
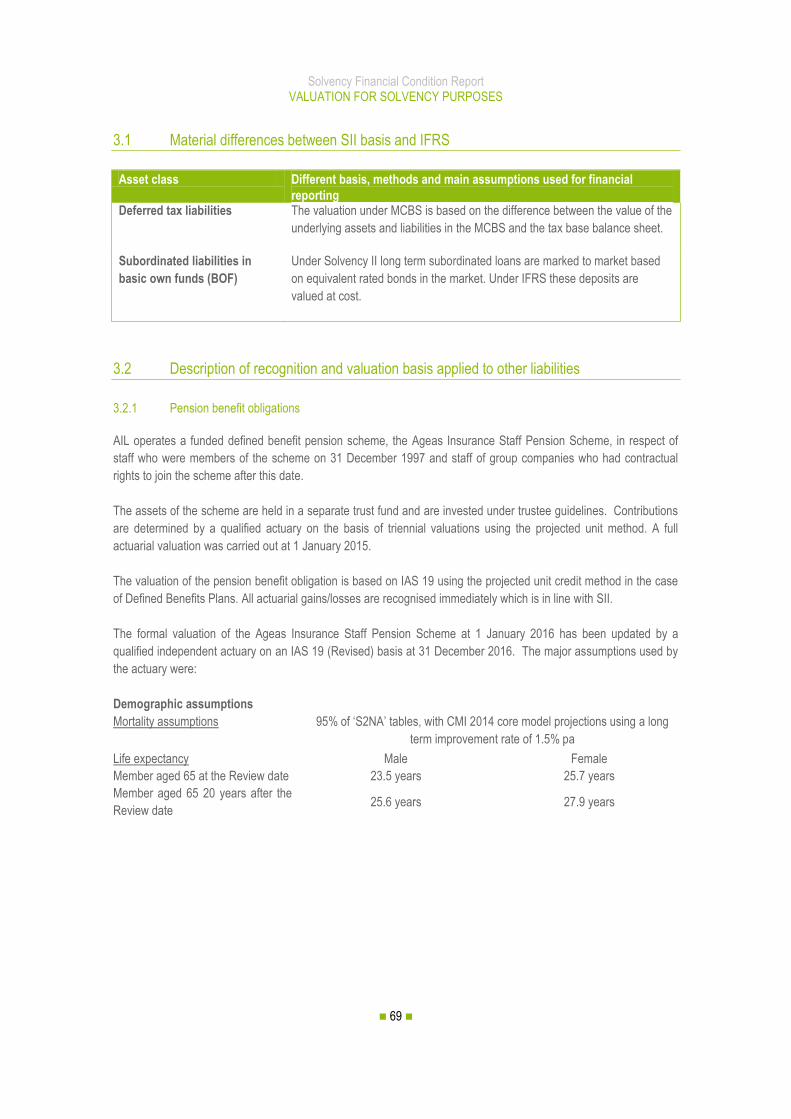
Solvency Financial Condition Report VALUATION FOR SOLVENCY PURPOSES
69
3.1 Material differences between SII basis and IFRS
Asset class Different basis, methods and main assumptions used for financial
reporting Deferred tax liabilities The valuation under MCBS is based on the difference between the value of the
underlying assets and liabilities in the MCBS and the tax base balance sheet.
Subordinated liabilities in
basic own funds (BOF)
Under Solvency II long term subordinated loans are marked to market based
on equivalent rated bonds in the market. Under IFRS these deposits are
valued at cost.
3.2 Description of recognition and valuation basis applied to other liabilities
3.2.1 Pension benefit obligations
AIL operates a funded defined benefit pension scheme, the Ageas Insurance Staff Pension Scheme, in respect of
staff who were members of the scheme on 31 December 1997 and staff of group companies who had contractual
rights to join the scheme after this date.
The assets of the scheme are held in a separate trust fund and are invested under trustee guidelines. Contributions
are determined by a qualified actuary on the basis of triennial valuations using the projected unit method. A full
actuarial valuation was carried out at 1 January 2015.
The valuation of the pension benefit obligation is based on IAS 19 using the projected unit credit method in the case
of Defined Benefits Plans. All actuarial gains/losses are recognised immediately which is in line with SII.
The formal valuation of the Ageas Insurance Staff Pension Scheme at 1 January 2016 has been updated by a
qualified independent actuary on an IAS 19 (Revised) basis at 31 December 2016. The major assumptions used by
the actuary were:
Demographic assumptions
Mortality assumptions 95% of ‘S2NA’ tables, with CMI 2014 core model projections using a long
term improvement rate of 1.5% pa
Life expectancy Male Female
Member aged 65 at the Review date 23.5 years 25.7 years
Member aged 65 20 years after the
Review date 25.6 years 27.9 years

Solvency Financial Condition Report VALUATION FOR SOLVENCY PURPOSES
70
Financial assumptions 2016
Valuation method Projected unit %
Rate of increase in salaries 3.75
Pensions accrued before 1 October 2012 rate of increase:
- Post 1988 Non GMP (ex Bishopsgate members) 5.00
- Post 1988 Non GMP (ex Northern Star members) 3.55
Pensions accrued from 1 October 2012 rate of increase 2.05
Discount rate 3.05
RPI inflation assumption 3.75
During 2016 the decision was taken to diversify the investment portfolio of the pension scheme, reallocating funds
from equities to property. The plan’s assets at year end 2016 were as follows:
3.2.2 Description of assumptions and judgements including those about the future and other major sources of
estimation uncertainty
The assumptions used in the pension benefit obligations are described above. There are no major assumptions or
areas of uncertainty in the valuation of the remaining other liabilities.
Asset mix of scheme assets 2016
Equity securities 40.1
Debt securities 73.5
Real estate 32.1
Other 32.9
Fair value of scheme assets at 31 December 178.6

Solvency Financial Condition Report VALUATION FOR SOLVENCY PURPOSES
71
4 Any other material information
AIL does not allow for any management actions in the assessment of their Technical Provisions. However, if AIL did
in the future allow for management actions, then AIL would be required to demonstrate how its assumptions on future
management actions are used in the calculations of technical provisions.
Assumptions on future management actions used should be determined in an objective manner. For this purpose AIL
shall establish a comprehensive future management actions plan, approved by the PRA, which covers at least the
following areas:
(a) identification of future management actions which are relevant to the valuation of technical provisions;
(b) identification of the specific circumstances in which AIL would reasonably expect to carry out all of the future
management action identified in point (a);
(c) identification of the specific circumstances in which AIL might not be able to carry out all of the future
management actions identified in point (a), and a description of how these circumstances are considered in the
calculation of technical provisions;
(d) the order in which future management actions would be carried out and the governance requirements applicable
to these future management actions;
(e) a description of any ongoing work required to ensure AIL is in a position to carry out each of the future
management actions identified in point (a);
(f) a description of how future management actions have been reflected in the calculation of the best estimate; AIL
shall assess the quantitative impact on the best estimate of future management action implemented in its
calculation;
(g) a description of the applicable internal reporting procedures that cover future management actions implemented
in the calculation of the best estimate; the reporting procedures shall include at least an annual communication
to the administrative, supervisory or management body.
Assumed future management actions shall be realistic and consistent with AIL’s current business practice and
business strategy, including the use of risk mitigation techniques. If there is sufficient current evidence AIL will
change its practices or strategy to be consistent with the changed practices or strategy.
Assumed future management actions shall be consistent. Assumptions about future management actions shall take
account of the time needed to implement the management actions and any expense they cause.
AIL should be able to verify that assumptions about future management action are realistic through:
(a) a comparison of assumed future management action with management action taken previously;
(b) a comparison of future management action taking into account current and past calculations of the best
estimate.
4.1 Relevant assumptions about policy holders' behaviour
The likelihood that policy holders will exercise contractual options, including lapses and surrenders, shall be based
on a prospective view of expected policy holder behaviour that makes appropriate and justified assumptions.

Solvency Financial Condition Report VALUATION FOR SOLVENCY PURPOSES
72
5 Description of alternative valuation methods
5.1 Justification and assumptions of applying alternative valuation methods as identified in the tables for assets and liabilities
The best evidence for the fair value of an asset held or a liability to be issued is a quoted market price or value based
on an active market. Where this is not possible then alternative valuation methods can be used. AIL uses alternative
valuation methods for the following categories of assets and liabilities:
Property held for own use and Property (other than for own use) The nature of property (both for own use and other than own use) is that it is unusual for identical assets to be traded
regularly, meaning that quoted market prices in an active market for an identical instrument are not available. In the
absence of an external market valuation (whose timings are at management discretion) properties are valued using
observable property yield curves for the surrounding location of the building and current, previous or estimated rental
values. Estimated rental values will be based on market data on properties available for rent of a similar size and in a
similar location. Management believe that this is the most appropriate method of valuing these assets in the absence
of a formal valuation.
Government & Corporate Bonds The majority of bonds held are held in companies or institutions that are not readily traded, i.e. there is not an active
market. This means that quoted market prices in an active market for an identical instrument are not available. These
assets are valued using observable data in active markets and prices are sourced from the external asset manager.
This is appropriate for this asset class due to the illiquidity of these bonds.
Collective Investments Undertakings The nature of these collective investment undertakings are property funds which are not readily traded and are
illiquid. This means that quoted market prices in an active market for an identical instrument are not available. These
assets are valued using observable data in active markets and prices are sourced from the external fund managers.
This is appropriate for this asset class due to the illiquidity of these funds.
Derivatives
The market for derivatives is not an active market. This means that quoted market prices in an active market for an
identical instrument are not available. They are fair valued using observable spot rates at the period end, sourced
from the external asset manager. This is appropriate for this asset class due to nature of these liabilities.

Solvency Financial Condition Report VALUATION FOR SOLVENCY PURPOSES
73
6 Quantitative material differences between basis SII and IFRS
A reconciliation between Statutory values (IFRS) and Solvency II values is shown below:
in GBP million
Statutory accounts
value (IFRS)
Valuation adjustment technical
provisions
Valuation adjustment reinsurance recoverables
Valuation adjustment
deferred acquisitions
costs
Valuation adjustment
other items
Solvency II value MCBS
Assets
Deferred acquisition costs 180.6 (180.6) -
Deferred tax assets 36.8 5.2 42.0
Property, plant & equipment held for own use 45.4 45.4
Investments (other than assets held for index-linked and unit-linked contracts) 1,967.6 28.0 1,995.6
Property (other than for own use) 20.8 20.8
Holdings in related undertakings, including participations
0.0 0.0
Bonds 1,891.8 25.9 1,917.7
Government Bonds 343.6 6.0 349.6
Corporate Bonds 1,548.2 19.9 1,568.1
Collective Investments Undertakings 55.0 55.0
Deposits other than cash equivalents - 2.1 2.1
Loans and mortgages 20.2 (0.1) 20.1
Other loans and mortgages 20.2 (0.1) 20.1
Reinsurance recoverables from: 383.5 78.8 462.2
Non-life excluding health 383.5 78.8 462.2
Health similar to non-life - 0.0 0.0
Insurance and intermediaries receivables 316.3 (26.5) (0.2) 289.6
Reinsurance receivables 2.9 2.9
Receivables (trade, not insurance) 37.1 37.1
Cash and cash equivalents 100.9 (2.1) 98.8
Any other assets, not elsewhere shown 43.7 (25.9) 17.9
Total assets 3,135.1 (26.5) 78.8 (180.6) 4.9 3,011.6

Solvency Financial Condition Report VALUATION FOR SOLVENCY PURPOSES
74
in GBP million
Statutory accounts
value (IFRS)
Valuation adjustment technical
provisions
Valuation adjustment reinsurance recoverables
Valuation adjustment
deferred acquisitions
costs
Valuation adjustment
other items
Solvency II value MCBS
Liabilities
Technical provisions - non-life 2,502.0 (101.3) 2,400.7
Technical provisions - non-life (excluding health) 2,502.0 (105.6) 2,396.4
Best Estimate 2,318.5 2,318.5
Risk margin 77.9 77.9
Technical provisions - health (similar to non-life) 4.2 4.2
Best Estimate 4.1 4.1
Risk margin 0.1 0.1
Provisions other than technical provisions 3.2 3.2
Pension benefit obligations 2.3 2.3
Derivatives 3.0 3.0
Financial liabilities other than debts owed to credit institutions 0.5 0.5
Insurance & intermediaries payables 25.6 25.6
Reinsurance payables 9.8 9.8
Payables (trade, not insurance) 41.3 41.3
Subordinated liabilities 138.7 (2.0) 136.8
Subordinated liabilities in BOF 138.7 (2.0) 136.8
Any other liabilities, not elsewhere shown 19.7 (0.1) 19.6
Total liabilities 2,746.2 (101.3) - - (2.0) 2,642.8
Excess of assets over liabilities 388.9 74.8 78.8 (180.6) 6.9 368.7
SII Own funds differ to the excess of assets over liabilities shown above by the inclusion of subordinated liabilities in basic own funds:
in GBP million Actual
2016
IFRS Shareholders’ Equity 388.9
Net removal of DACs (145.9)
Net discounting to PV of insurance assets 63.6
Net best estimate of liabilities 60.4
Fair value subordinated debt 2.0
Fair value debt > 3 months (0.2)
Fair value loans to brokers (0.1)
Subordinated liabilities 136.8
SII Own Funds 505.5

Solvency Financial Condition Report CAPITAL MANAGEMENT
75
E CAPITAL
MANAGEMENT
Audited (with the exception of sections 2 & 3)

Solvency Financial Condition Report CAPITAL MANAGEMENT
76
1 Information on Capital Management regarding own funds
1.1 Description of our objectives, policies and processes employed for managing own funds
AIL develops an Operating Business Plan, which is a key component of the Ageas (UK) Strategic Plan, and is
reviewed and revised each year and then formally approved by the Company’s Board. A key factor in the formulation
of the Strategic Plan is the assessment of the capital required to support the business objectives (i.e. growth and
profit targets) and the appropriateness of the supporting capital structure. The time horizon over which the MYB is
planned is a period of 3 years.
Overall capital requirements and structure are assessed taking account of the following:
capital required to support the planned growth in new business and renewal premiums and profit targets;
the required rate of return on capital employed;
the required dividend;
Solvency II capital requirements; and
capital required to support the desired credit rating.
For pricing/underwriting purposes, capital is allocated to different classes of business using a risk-based
methodology. Where product lines do not have the potential to achieve the required return on capital within the plan
period the Company will consider divestment.
1.2 Description per tier of the amount, structure and quality of our own funds
Below is a summary of the makeup of AIL’s Basic own funds as at 31 December 2016:
Basic Own Funds (in GBP m) 2016
TOTAL 2016 Tier 1
unrestricted
2016 Tier 1 restricted
2016 Tier 2
2016 Tier 3
Ordinary share capital (gross of own shares)
227.8 227.8 - - -
Share premium account related to ordinary share capital
3.9 3.9 - - -
Reconciliation reserve 95.0 95.0 - - -
Subordinated liabilities 136.8 - - 136.8 -
An amount equal to the value of net deferred tax assets
42.0 - - - 42.0
Total basic own funds after adjustment 505.5 326.7 - 136.8 42.0
AIL’s own funds are categorised into tiers as specified by the Delegated Regulation (EU) 2015/35.
Ordinary share capital: Share capital is fully subordinated and has permanent availability, therefore is included in
Tier 1.
Share premium: Share premium is fully subordinated and has permanent availability, therefore is included in Tier 1.
Reconciliation reserve: The reconciliation reserve equals the total excess of assets over liabilities reduced by
ordinary share capital, share premium and value of net deferred tax asset. This item is available to fully absorb
losses both on a going concern basis and in the case of winding up. The item also satisfies the criteria in Delegated
Regulation (EU) 2015/35 and therefore is included in Tier 1. There are no items that are foreseen to reduce the
reconciliation reserve such as foreseeable dividends and own shares held.

Solvency Financial Condition Report CAPITAL MANAGEMENT
77
Subordinated liabilities: The subordinated debt within the IFRS balance sheet classified as subordinated liabilities
has been reclassified from liabilities to own funds in line with SII requirements. Each of the eligibility criteria required
for the subordinated debt to qualify as Tier 2 capital, as set out in Article 73 of Delegated Regulation (EU) 2015/35
have been met. The debt is fully subordinated in the event of a winding up, with the claims of the holder of the debt
subordinated to the claims of the senior creditors (including policyholders and non-subordinated creditors). The
subordinate debt is fully available to absorb losses and is free from encumbrances.
Net deferred tax asset: Deferred tax is explicitly included in the list of Tier 3 capital items. For deferred tax assets
(“DTA”) the only criteria required for it to be classified as Tier 3 is the absence of features causing or accelerating
insolvency. The DTA does not include any features that would cause or accelerate insolvency; therefore it is
classified as Tier 3.
Differences between equity in the IFRS financial statements and the excess over liabilities as calculated for Solvency
II purposes mainly stem from the revaluation of technical provisions, reclassification of subordinated liabilities and
deferred acquisition costs.
Liabilities arising from insurance contracts also need to be recognised at market consistent values. The value of
technical provisions under Solvency II is equal to the sum of the best estimate of the liabilities and the risk margin. To
calculate the best estimate of the liabilities a deterministic approach is taken, whereas the risk margin represents the
capital costs of the non-hedgeable risks included in the best estimate.
1.2.1 Subordinated debt
On 30 September 2016 an issue of £38.7m subordinated debt was made by the Company to Ageas Insurance
International N.V., the Company’s intermediate parent.
The subordinated debt incurs interest at 3.85% above LIBOR, with the LIBOR rate being reviewed quarterly. From
2026 the interest rate will increase to 4.85% above LIBOR and will remain at this rate until maturity. Accrued interest
is also payable quarterly. The subordinated debt is dated with a maturity date of 5 November 2046.
1.2.2 Reconciliation Reserve
The reconciliation reserve (£95.0m) equals:
in GBP millions 2016
Excess of assets over liabilities (per QRT S.02.01.02) 368.7
Less:
Share capital (227.8)
Share premium (3.9)
Net deferred tax asset (42.0)
95.0

Solvency Financial Condition Report CAPITAL MANAGEMENT
78
1.3 Eligible amount of own funds to cover the Solvency Capital Requirement classified by tiers
Total Tier 1 Tier 2 Tier 3
Total eligible own funds to meet the SCR 505.5 326.7 136.8 42.0
1.4 Eligible amount of basic own funds to cover the Minimal Capital Requirement classified by tiers
Total Tier 1 Tier 2 Tier 3
Total eligible own funds to meet the MCR 376.7 326.7 50.0 0.0
Eligible own funds to cover the Minimum Capital Requirement (MCR) are limited for Tiers 2 and below. Tier 2 items
are subject to the following quantitative limits:
a) the eligible amount of Tier 1 items shall be at least 80 % of the Minimum Capital Requirement;
b) the eligible amounts of Tier 2 items shall not exceed 20 % of the Minimum Capital Requirement
Tier 3 items are not available to be used to cover the MCR.
1.5 Equity as shown in the undertaking's financial statements and the excess of assets over liabilities as calculated for solvency purposes:
RECONCILIATION IFRS EQUITY TO OWN FUNDS in GBP million Actual
2016
IFRS Shareholders’ Equity 388.9
Net removal of DACs (145.9)
Net discounting to PV of insurance assets 63.6
Net best estimate of liabilities 60.4
Fair value subordinated debt 2.0
Fair value debt > 3 months (0.2)
Fair value loans to brokers (0.1)
Subordinated liabilities 136.8
SII Own Funds 505.5

Solvency Financial Condition Report CAPITAL MANAGEMENT
79
2 Information on SCR and MCR
2.1 Quantitative information of SCR split by risk modules where standard formula is used and by risk category where an internal model is applied
The composition of the capital solvency requirements can be summarised as follows:
2016
Market Risk 145.7
Counterparty Default Risk 67.4
Non-life Underwriting Risk 393.7
Operational Risk 69.7
Diversification effect (116.0)
Loss-Absorption through Deferred Taxes (5.3)
Capital Solvency Requirements under the SII PIM 555.2
The non-life underwriting risk component is calculated on an internal model basis. For the remainder AIL applies
standard formula.
2.1.1 Introduction
With the official implementation of Solvency II as of 1 January 2016, the focus of monitoring capital adequacy has
shifted from ICG to Solvency II, which is now used within AIL to determine targets and requirements.
Within AIL, under Solvency II capital adequacy a number of items are monitored by AIL and the PRA:
The Minimum Capital Requirement (MCR) - The MCR is the capital level representing the final threshold
that triggers ultimate supervisory intervention (withdrawal of license to underwriting new business) in the
event this limit is breached. Under the Partial Internal Model (PIM), the MCR is a linear approach combined
with a cap of 45% and a floor of 25% of the Solvency capital requirements (SCR).
SCR Partial Internal Model (PIM) - SCR PIM is the amount of capital to be held by an insurer to meet its
capital requirements calculated using an Internal Model for Non-life risks, and the Standard Formula (SF)
for all other sub-risks.
For the breakdown of the base case SCR into different risk modules for SCR PIM for Insurance, we refer to the
Quantitative Reporting Template S.25.02.21.
2.1.2 Description of the methods used to calculate the probability distribution forecast and the SCR in the internal
model.
AIL takes a Partial Internal Model approach to SCR estimation. Underwriting risk is estimated using an Internal
Model; while market, counterparty default and operational risk are estimated using the Standard Formula approach.
These risks are then aggregated together using the Standard Formula aggregation approach to estimate the
diversified SCR.
The Internal Model uses stochastic simulation to generate a full distribution of possible underwriting loss outcomes
for the forthcoming year. The possible outcomes represented by this distribution are calibrated using AIL’s historic
data and then centred on the budget; where the budget is assumed to be the mean of all possible outcomes.

Solvency Financial Condition Report CAPITAL MANAGEMENT
80
The model is run to produce 100,000 simulations for every sub-risk for each line of business separately. This is
performed by drawing random numbers from chosen distributions to generate losses. Each of the simulations
therefore represents a different possible future outcome. The model then aggregates all lines of business and sub-
risks into a single probability distribution in order to provide a single measure of non-life insurance risk. In order to do
this, the model uses inputs for the strength of dependency between two risks and/or lines of business. These
dependencies are modelled via correlations that drive the diversification between risks and lines of business.
The required solvency capital is the difference between the 99.5th percentile (1 in 200 year scenario) and the input
mean. This represents the adverse deviation from the mean.
2.1.3 Description of the nature and appropriateness of the data used in the internal model.
The majority of the data feeding the Internal Model is held internally. Governance of the data is owned by the MCB
with Head of Capital, Risk Officer and Chief Actuary reviewing inputs prior to formal sign-offs. Given that the data is
largely from accredited sources which are already audited, validated or have other governance around them (e.g.
audited IFRS balance sheet, signed-off business plan etc.), it is deemed to be sufficiently accurate and complete.
The default position for the Internal Model calibration is to include all historic data. This means that for most sub-
risks, the entire history of loss ratios or reserve movements are used in the calibration process. Where less history
has been used or data has been excluded it has been fully justified.
2.1.4 Methodological differences between the Internal Model and the Standard Formula
AIL’s Internal Model differs from the Standard Formula in the following ways. 1. Risk Taxonomy,
2. PPO Modelling,
3. Reinsurance Modelling,
4. Dependency Structure.
1. Risk Taxonomy
AIL disaggregates its business into the following reporting units.
Personal Motor Liability and Commercial Motor Liability; these would be modelled together under “Motor
vehicle liability insurance” under Standard Formula.
Personal Motor Property and Commercial Motor Property; these would be modelled together under “Other
motor insurance” under Standard Formula.
Commercial Property and Household; these would be modelled together under “Fire and other damage to
property insurance” under Standard Formula.
Each reporting unit also uses an appropriate selection of large and attritional premium sub-risks; under the Standard
Formula these sub-risks are not modelled separately.
2. PPO Modelling
AIL’s Internal Model identifies and models PPO’s appropriately; this includes allowing for variability in mortality and
inflation risk.
3. Reinsurance Modelling
Reinsurance modelling is crude under Standard Formula allowing only for a broad spectrum 20% reduction in
premium risk COV for lines of business that carry non-proportional reinsurance. AIL’s Internal Model allows for more
accurate modelling of the true reinsurance structure.

Solvency Financial Condition Report CAPITAL MANAGEMENT
81
4. Dependency Structure
AIL’s Internal Model uses a dependency structure that has been calibrated internally. The most material difference is
that the Internal Model’s dependency structure models catastrophe risks as independent of premium and reserve
risk. Under the Standard Formula these risks are correlated by 25%.
2.2 SCR simplifications
AIL do not have any material simplifications in the SCR calculation.

Solvency Financial Condition Report CAPITAL MANAGEMENT
82
3 Information on internal models used for calculation of SCR and MCR
3.1 Description of the results of the review of the causes and sources of profits and losses for each major business unit and how the categorisation of risk chosen in the internal model explains those causes and sources of profit and loss
Profit and Loss Attribution reviews AIL’s Actual performance and compares it against the Budgeted prediction made
by the Internal Model at the beginning of the year.
The purpose of this analysis is to demonstrate that the Internal Model is able to sufficiently capture all the sources of
Underwriting Risk created by writing Insurance business. This establishes whether:
1. AILs Actual performance was favourable (more profitable), or unfavourable (less profitable) relative to the
Budget.
2. the Internal Model allows for sufficient variability around Budgeted estimates and thereby allows for
sufficient levels of risk.
3. the Internal Model is complete, allowing for the full range of underwriting risks AIL is exposed to.
The Internal Model sub-divides Underwriting risk into the following categories.
Lines of Business Reserve Risk Attritional Losses
Large Losses Man Made
Catastrophe Losses
Natural Catastrophe
Losses
Commercial Property X X X X X
Household & Caravan X X X X
Travel X X
Personal Accident X X X
Personal Motor Liability X X X X
Special Risks X X
Cancelled Business X
Commercial Motor Liability
X X X X
Commercial Motor Other X X X
Personal Motor Other X X X
GTPL X X X X
The 2016 Year End Profit and Loss Attribution compared the 2016 Internal Model prediction against 2016 Actuals. It
identified the following deviations from the Budget:
An unfavourable Personal Motor Large Loss and Commercial Motor Large Loss experience. This is
attributed to a change in Ogden rates and a slightly higher large loss frequency than predicted.
An unfavourable Personal Motor Reserve experience. This is attributed to a change in Ogden rates.
An unfavourable Commercial Liability Large Loss experience. This is attributed to a change in Ogden rates.
An unfavourable Special Risk Reserve experience.
None of the above analysis suggests that the model is incomplete or that it allows for an insufficient level of risk.

Solvency Financial Condition Report CAPITAL MANAGEMENT
83
3.2 Information on whether, and if so to what extent, the risk profile deviates from the assumptions underlying the internal model
Specific limitations of the Internal Model and the approach adopted by AIL to address them are set out in the table
below
Limitation AIL approach
Dependency
Data representing tail events is too limited to reliably model dependency between risk types and lines of business. Calibration of the correlation parameters is therefore based on expert judgement. A panel of experts, including the Head of Underwriting for each line of business, meets on an annual basis to discuss the emergence of any new insight into the drivers of dependency, and ensure the ongoing appropriateness of the correlation assumptions.
Natural catastrophe
Natural catastrophes are rare events and as such, data is limited. However, windstorms and floods are material risks to AIL and so must be modelled.
To mitigate the lack of data, AIL uses models supplied by third-parties that contain models of both the science of windstorms and floods, together with their impact on property.
AIL uses its relatively scarce data to help validate these models.
3.3 Information about future management actions used in the calculation of the SCR
Management actions are not included in the calculation of the AIL SCR.

Solvency Financial Condition Report CAPITAL MANAGEMENT
84
4 The risk of non-compliance with the MCR or SCR and plans to ensure compliance
The AIL Board sets the AIL Target Solvency Capital Level allowing for a solvency buffer above the SCR. AIL will not
pay a dividend that takes its solvency below this level.
Solvency levels are reviewed by the monthly Management Committee and reported to the AIL Board, Audit Committee,
Risk Committee and Ageas SA/NV on a quarterly basis.
The following possible actions are available to AIL should the Solvency ratio drop below target levels:
Increase own funds
Options available include: issuing further equity; reducing the dividends and issuing further sub-debt.
Decrease PIM SCR
Options available include: reducing the scale of the business, adjusting the investment portfolio, purchasing
additional reinsurance, hedging using derivatives.
5 Any other material information regarding Capital Management
On 27 February 2017 the Lord Chancellor announced that the personal injury discount rate (Ogden rate) would
reduce from 2.5% to minus 0.75% with effect from 20 March 2017. The reduction in the discount rate will have the
effect of increasing the cost of personal injury claims, also increasing the ultimate loss ratio for business written up to
the effective date. The immediate effect of this on AIL was an additional cost to claims reserves as at 31 December
2016, impacting the overall net pre-tax underwriting performance by £140m and reducing the Solvency II ratio to
91%. On 31 March 2017 the Board approved immediate actions to improve the solvency ratio by 25% after
discussions with the PRA. These actions included the issuance of an additional £50m of share capital on 7 April and
the purchase of a whole account stop loss treaty with effect from 1 April. Further actions will be developed in line with
the capital contingency plan (see section E.4).

Solvency Financial Condition Report
85
F. Validation & Authorisation
Ageas Insurance Limited Approval by the Board of Directors Financial year ended 31 December 2016 We certify: (a) that the Solvency and Financial Condition Report (“SFCR”) has been prepared in all material respects in
accordance with the PRA rules and Solvency II Regulations; and (b) we are satisfied that:
i) throughout the financial year in question, the insurer has complied in all material respects with the requirements of the PRA rules and Solvency II Regulations as applicable to the insurer; and
ii) it is reasonable to believe that the insurer has continued so to comply with the requirements of the PRA rules and Solvency II Regulations, and will continue so to comply in future.
Fernley Dyson Chief Financial Officer Ageas Insurance Limited 5 May 2017

Solvency Financial Condition Report APPENDICES
86
G APPENDICES
QUANTITATIVE REPORTING TEMPLATES
All figures GBP 000’s
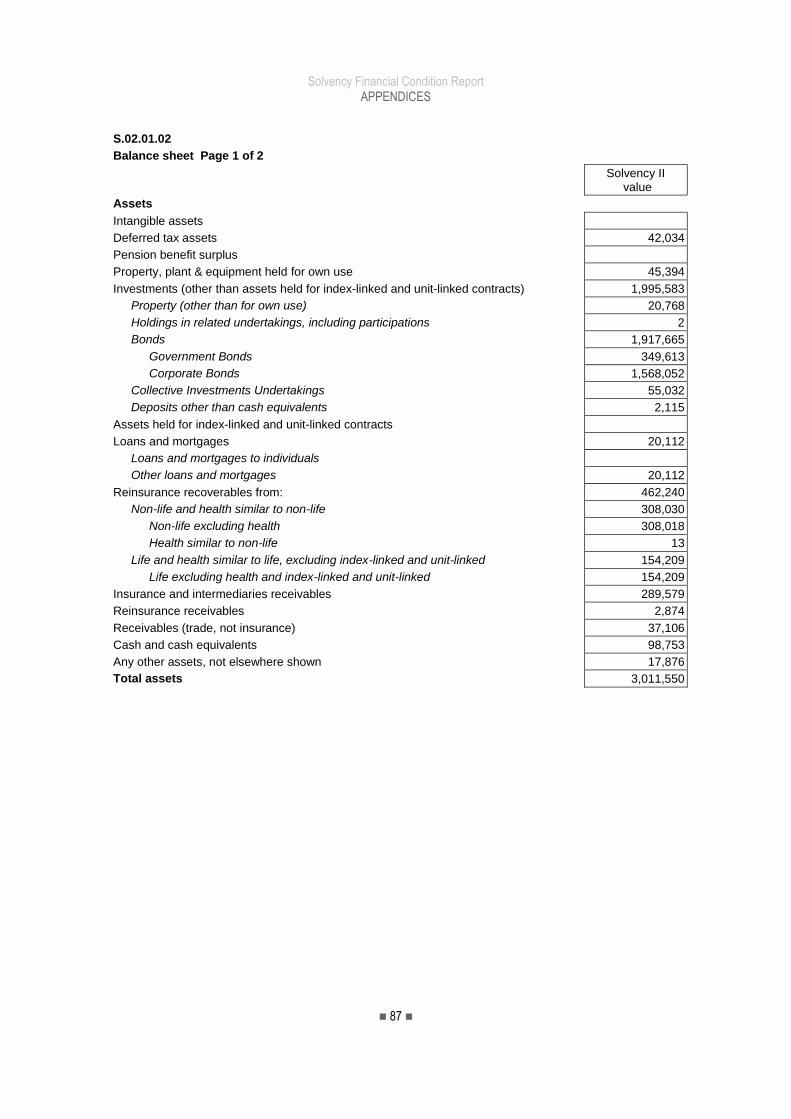
Solvency Financial Condition Report APPENDICES
87
S.02.01.02 Balance sheet Page 1 of 2
Solvency II
value
Assets
Intangible assets
Deferred tax assets 42,034
Pension benefit surplus
Property, plant & equipment held for own use 45,394
Investments (other than assets held for index-linked and unit-linked contracts) 1,995,583
Property (other than for own use) 20,768
Holdings in related undertakings, including participations 2
Bonds 1,917,665
Government Bonds 349,613
Corporate Bonds 1,568,052
Collective Investments Undertakings 55,032
Deposits other than cash equivalents 2,115
Assets held for index-linked and unit-linked contracts
Loans and mortgages 20,112
Loans and mortgages to individuals
Other loans and mortgages 20,112
Reinsurance recoverables from: 462,240
Non-life and health similar to non-life 308,030
Non-life excluding health 308,018
Health similar to non-life 13
Life and health similar to life, excluding index-linked and unit-linked 154,209
Life excluding health and index-linked and unit-linked 154,209
Insurance and intermediaries receivables 289,579
Reinsurance receivables 2,874
Receivables (trade, not insurance) 37,106
Cash and cash equivalents 98,753
Any other assets, not elsewhere shown 17,876
Total assets 3,011,550

Solvency Financial Condition Report APPENDICES
88
S.02.01.02
Balance sheet Page 2 of 2
Solvency II
value
Liabilities
Technical provisions - non-life 2,162,757
Technical provisions - non-life (excluding health) 2,158,532
Best Estimate 2,104,866
Risk margin 53,666
Technical provisions - health (similar to non-life) 4,224
Best Estimate 4,088
Risk margin 136
Technical provisions - life (excluding index-linked and unit-linked) 237,896
Technical provisions - life (excluding health and index-linked and unit-linked) 237,896
Best Estimate 213,634
Risk margin 24,262
Contingent liabilities
Provisions other than technical provisions 3,228
Pension benefit obligations 2,258
Deposits from reinsurers
Deferred tax liabilities
Derivatives 3,027
Debts owed to credit institutions
Financial liabilities other than debts owed to credit institutions 515
Insurance & intermediaries payables 25,632
Reinsurance payables 9,842
Payables (trade, not insurance) 41,271
Subordinated liabilities 136,780
Subordinated liabilities not in BOF
Subordinated liabilities in BOF 136,780
Any other liabilities, not elsewhere shown 19,595
Total liabilities 2,642,801
Excess of assets over liabilities 368,749
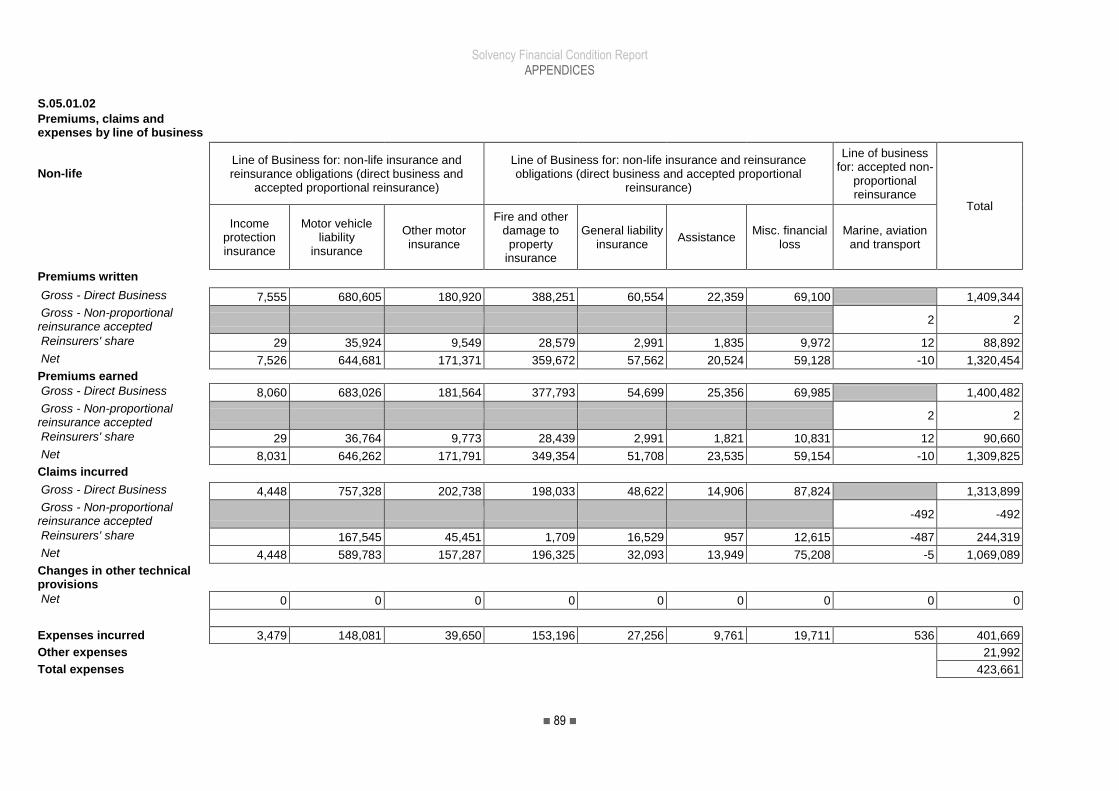
Solvency Financial Condition Report APPENDICES
89
S.05.01.02 Premiums, claims and expenses by line of business
Non-life Line of Business for: non-life insurance and reinsurance obligations (direct business and
accepted proportional reinsurance)
Line of Business for: non-life insurance and reinsurance obligations (direct business and accepted proportional
reinsurance)
Line of business for: accepted non-
proportional reinsurance
Total
Income protection insurance
Motor vehicle liability
insurance
Other motor insurance
Fire and other damage to property
insurance
General liability insurance
Assistance Misc. financial
loss Marine, aviation
and transport
Premiums written Gross - Direct Business 7,555 680,605 180,920 388,251 60,554 22,359 69,100 1,409,344
Gross - Non-proportional reinsurance accepted
2 2
Reinsurers' share 29 35,924 9,549 28,579 2,991 1,835 9,972 12 88,892
Net 7,526 644,681 171,371 359,672 57,562 20,524 59,128 -10 1,320,454
Premiums earned
Gross - Direct Business 8,060 683,026 181,564 377,793 54,699 25,356 69,985 1,400,482
Gross - Non-proportional reinsurance accepted
2 2
Reinsurers' share 29 36,764 9,773 28,439 2,991 1,821 10,831 12 90,660
Net 8,031 646,262 171,791 349,354 51,708 23,535 59,154 -10 1,309,825
Claims incurred
Gross - Direct Business 4,448 757,328 202,738 198,033 48,622 14,906 87,824 1,313,899
Gross - Non-proportional reinsurance accepted
-492 -492
Reinsurers' share 167,545 45,451 1,709 16,529 957 12,615 -487 244,319
Net 4,448 589,783 157,287 196,325 32,093 13,949 75,208 -5 1,069,089
Changes in other technical provisions
Net 0 0 0 0 0 0 0 0 0
Expenses incurred 3,479 148,081 39,650 153,196 27,256 9,761 19,711 536 401,669
Other expenses 21,992
Total expenses 423,661

Solvency Financial Condition Report APPENDICES
90
S.05.02.01 Premiums, claims and expenses by country
Non-life Home Country
Top 5 countries (by amount of gross premiums written) - non-life obligations Total Top 5 and
home country IE
Premiums written Gross - Direct Business 1,405,664 3,680 1,409,344
Gross - Non-proportional reinsurance accepted 2 2
Reinsurers' share 88,717 175 88,892
Net 1,316,949 3,505 0 0 1,320,454
Premiums earned
Gross - Direct Business 1,397,162 3,320 1,400,482
Gross - Non-proportional reinsurance accepted 2 2
Reinsurers' share 90,488 171 90,660
Net 1,306,676 3,149 0 0 1,309,825
Claims incurred
Gross - Direct Business 1,311,094 2,806 1,313,899
Gross - Non-proportional reinsurance accepted -492 -492
Reinsurers' share 244,212 107 244,319
Net 1,066,390 2,699 0 0 1,069,089
Changes in other technical provisions
Net 0 0 0 0 0
Expenses incurred 400,521 1,148 401,669
Other expenses 21,992
Total expenses 423,661
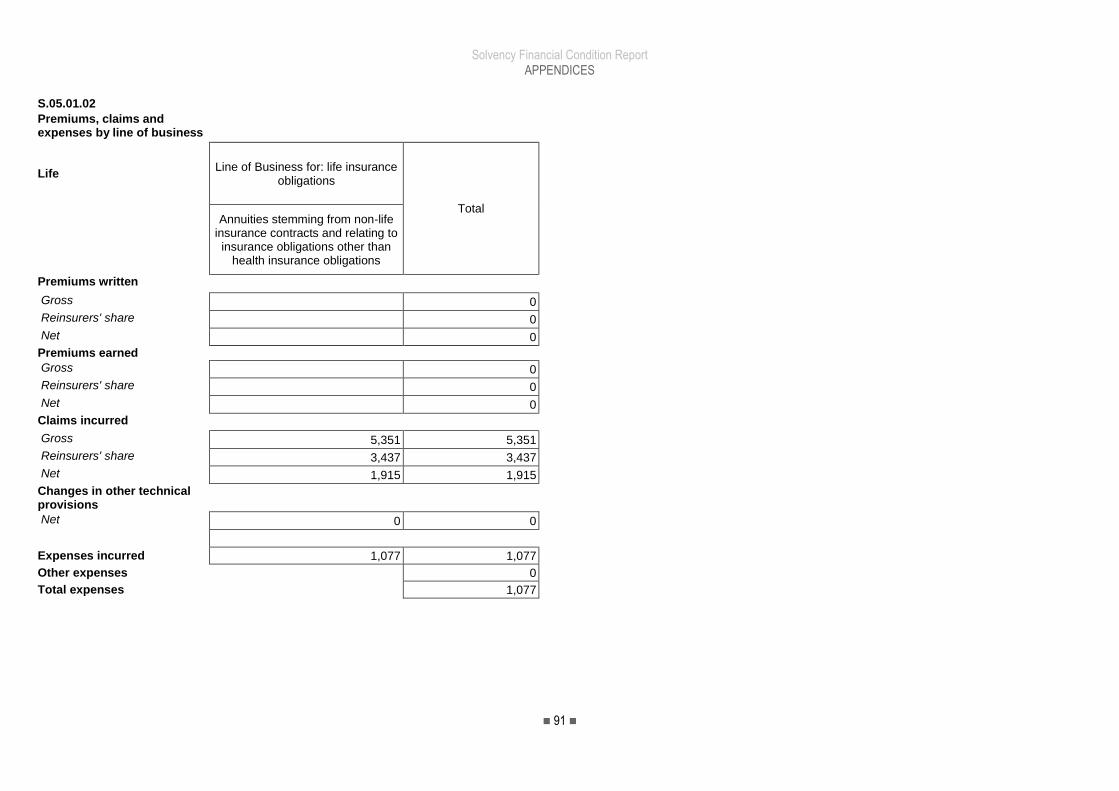
Solvency Financial Condition Report APPENDICES
91
S.05.01.02 Premiums, claims and expenses by line of business
Life Line of Business for: life insurance
obligations
Total
Annuities stemming from non-life insurance contracts and relating to insurance obligations other than
health insurance obligations
Premiums written Gross 0
Reinsurers' share 0
Net 0
Premiums earned
Gross 0
Reinsurers' share 0
Net 0
Claims incurred
Gross 5,351 5,351
Reinsurers' share 3,437 3,437
Net 1,915 1,915
Changes in other technical provisions
Net 0 0
Expenses incurred 1,077 1,077
Other expenses 0
Total expenses 1,077

Solvency Financial Condition Report APPENDICES
92
S.05.02.01 Premiums, claims and expenses by country
Life Home Country
Total Top 5 and home country
Premiums written Gross 0
Reinsurers' share 0
Net 0
Premiums earned
Gross 0
Reinsurers' share 0
Net 0
Claims incurred
Gross 5,351 5,351
Reinsurers' share 3,437 3,437
Net 1,915 1,915
Changes in other technical provisions
Net 0 0
Expenses incurred 1,077 1,077
Other expenses 0
Total expenses 1,077

Solvency Financial Condition Report APPENDICES
93
S.12.01.02
Life and Health SLT Technical Provisions
Annuities stemming from non-life insurance
contracts and relating to insurance obligation
other than health insurance obligations
Total (Life other than health
insurance, including Unit-Linked)
Technical provisions calculated as a sum of BE and RM
Best estimate
Gross Best Estimate 213,634 213,634
Total Recoverables from reinsurance/SPV and Finite Re after the adjustment for expected losses due to counterparty default
154,209 154,209
Best estimate minus recoverables from reinsurance/SPV and Finite Re
59,425 59,425
Risk margin 24,262 24,262
Amount of the transitional on Technical Provisions
Technical provisions - total 237,896 237,896

Solvency Financial Condition Report APPENDICES
94
S.17.01.02
Non-Life Technical Provisions
Direct business and
accepted proportional reinsurance
Direct business and accepted proportional reinsurance
Direct business and accepted proportional
reinsurance
Accepted non-proportional reinsurance
Total Non-Life
obligation
Income protection insurance
Motor vehicle liability
insurance
Other motor insurance
Fire and other damage to property
insurance
General liability
insurance Assistance
Miscellaneous financial loss
Non-proportional
marine, aviation and
transport reinsurance
Technical provisions calculated as a sum of BE and RM
Best estimate
Premium provisions
Gross 2,043 294,692 76,885 104,486 15,002 3,596 53,920 0 550,626
Total recoverable from reinsurance/SPV and Finite Re after the adjustment for expected losses due to counterparty default
13 8,158 262 1,834 -517 233 8,885 18,869
Net Best Estimate of Premium Provisions 2,031 286,534 76,623 102,652 15,520 3,363 45,035 0 531,757
Claims provisions
Gross 2,045 1,213,667 4,301 151,528 124,755 4,933 29,506 27,593 1,558,328
Total recoverable from reinsurance/SPV and Finite Re after the adjustment for expected losses due to counterparty default
252,583 7,621 4,896 16,897 147 4,344 2,675 289,162
Net Best Estimate of Claims Provisions 2,045 961,084 -3,320 146,632 107,859 4,786 25,162 24,918 1,269,167
Total best estimate - gross 4,088 1,508,359 81,187 256,014 139,758 8,530 83,426 27,593 2,108,954
Total best estimate - net 4,076 1,247,619 73,303 249,284 123,378 8,149 70,197 24,918 1,800,924
Risk margin 136 33,617 2,729 8,605 4,697 287 2,804 927 53,802
Technical provisions - total 4,224 1,541,977 83,915 264,619 144,455 8,816 86,230 28,520 2,162,757
Recoverable from reinsurance contract/SPV and Finite Re after the adjustment for expected losses due to counterparty default - total
13 260,740 7,883 6,730 16,379 380 13,230 2,675 308,030
Technical provisions minus recoverables from reinsurance/SPV and Finite Re - total
4,212 1,281,236 76,032 257,889 128,076 8,436 73,001 25,845 1,854,726

Solvency Financial Condition Report APPENDICES
95
S.19.01.21 Page 1 of 2
Non-Life insurance claims
Total Non-life business
Accident year / underwriting year Accident Year
Gross Claims Paid (non-cumulative)
(absolute amount)
Year Development year In Current
year
Sum of years
(cumulative) 0 1 2 3 4 5 6 7 8 9 10 & +
Prior 1,483 1,483 1,483
N-9 271,774 198,773 57,361 37,497 22,248 18,569 4,768 1,263 504 518 518 613,276
N-8 244,919 175,944 54,511 47,302 35,086 16,115 5,898 3,700 1,574 1,574 585,050
N-7 269,056 202,744 70,711 49,661 42,814 16,927 7,016 6,160 6,160 665,089
N-6 165,479 364,821 69,852 47,415 30,333 22,120 7,668 7,668 707,688
N-5 281,549 191,924 77,456 43,732 31,705 10,116 10,116 636,482
N-4 299,000 201,612 67,662 55,295 37,482 37,482 661,050
N-3 261,145 200,823 67,308 40,081 40,081 569,356
N-2 272,167 197,272 69,221 69,221 538,660
N-1 252,710 222,608 222,608 475,318
N 418,711 418,711 418,711
Total 815,622 5,872,163

Solvency Financial Condition Report APPENDICES
96
S.19.01.21 Page 2 of 2 Non-Life insurance claims
Gross undiscounted Best Estimate Claims Provisions
(absolute amount)
Year end
(discounted data)
Year Development year
0 1 2 3 4 5 6 7 8 9 10 & +
Prior 28,412 133,534
N-9 0 0 0 0 0 0 0 0 0 402 1,940
N-8 0 0 0 0 0 0 0 0 -622 -2,880
N-7 0 0 0 0 0 0 0 8,027 43,961
N-6 0 0 0 0 0 0 1,318 -514
N-5 0 0 0 0 0 243 3,838
N-4 0 0 0 0 6,508 33,220
N-3 0 0 0 -2,500 -10,068
N-2 0 0 6,277 22,768
N-1 0 208,063 972,256
N 136,688 516,809
Total 1,714,863

Solvency Financial Condition Report APPENDICES
97
S.22.01.21 Impact of long term guarantees measures and transitionals
Amount with Long Term Guarantee measures and transitionals
Impact of transitional on
technical provisions
Impact of volatility
adjustment set to zero
Technical provisions 2,162,757 237,896 32,927
Basic own funds 505,530 0 -32,927
Eligible own funds to meet Solvency Capital Requirement 505,530 0 -32,927
Solvency Capital Requirement 555,247 0 2,743
Eligible own funds to meet Minimum Capital Requirement 376,688 0 -32,680
Minimum Capital Requirement 249,861 0 1,234

Solvency Financial Condition Report APPENDICES
98
S.23.01.01
Own Funds
Basic own funds before deduction for participations in other financial sector as foreseen in article 68 of Delegated Regulation 2015/35
Total Tier 1
unrestricted Tier 1
restricted Tier 2 Tier 3
Ordinary share capital (gross of own shares) 227,823 227,823 0
Share premium account related to ordinary share capital 3,860 3,860 0
Initial funds, members' contributions or the equivalent basic own-fund item for mutual and mutual-type undertakings
0 0 0
Subordinated mutual member accounts 0 0 0 0
Surplus funds 0 0
Preference shares 0 0 0 0
Share premium account related to preference shares 0 0 0 0
Reconciliation reserve 95,032 95,032
Subordinated liabilities 136,780 0 136,780 0
An amount equal to the value of net deferred tax assets 42,034 42,034
Total basic own funds after deductions 505,530 326,716 0 136,780 42,034
Available and eligible own funds
Total available own funds to meet the SCR 505,530 326,716 0 136,780 42,034
Total available own funds to meet the MCR 463,496 326,716 0 136,780
Total eligible own funds to meet the SCR 505,530 326,716 0 136,780 42,034
Total eligible own funds to meet the MCR 376,688 326,716 0 49,972
SCR 555,247
MCR 249,861
Ratio of Eligible own funds to SCR 91.05%
Ratio of Eligible own funds to MCR 150.76%
Reconciliation reserve
Excess of assets over liabilities 368,749
Other basic own fund items 273,717
Reconciliation reserve 95,032
Expected profits
Expected profits included in future premiums (EPIFP) - Non- life business
-1,663
Total Expected profits included in future premiums (EPIFP)
-1,663

Solvency Financial Condition Report APPENDICES
99
S.25.02.21
Solvency Capital Requirement - for undertakings using the standard formula and partial internal model
Unique number
of component
Component description Calculation of the Solvency Capital
Requirement
Amount modelled
USP Simplifications
10200I Interest rate risk up 1,440
10400I Equity risk 29,797
10600I Property risk 40,119
10700I Spread risk 93,112
10900I Currency risk 4,369
19900I Diversification within market risk -23,104
20100I Type 1 counterparty credit risk 17,467
20200I Type 2 counterparty credit risk 53,253
20300I Diversification within counterparty credit risk -3,368
5015GI Premium risk (Attritional) 151,437 151,437
5015HI Premium risk (Large Losses) 87,690 87,690
50107I diversification within premium risk -53,579 -53,579
50210I Reserve risk 218,608 218,608
50310I Non-life catastrophe risk - meteorological & geological (i.e. 'natural') events - modelled 225,462 225,462
50330I Non-life catastrophe risk - other events (i.e. "Man-Made") 51,818 51,818
50399I diversification within cat risk -51,434 -51,434
50400I Non-life lapse risk 5,704 5,704
59900I Diversification within non-life underwriting risk -241,934 -241,934
70100I Operational risk 69,678
80300I Loss-absorbing capacity of deferred taxes -5,300

Solvency Financial Condition Report APPENDICES
100
S.25.02.21 Solvency Capital Requirement - for undertakings using the standard formula and partial internal model
Calculation of Solvency Capital Requirement
Total undiversified components 671,234
Diversification -115,988
Capital requirement for business operated in accordance with Art. 4 of Directive 2003/41/EC
Solvency capital requirement excluding capital add-on 555,247
Capital add-ons already set
Solvency capital requirement 555,247

Solvency Financial Condition Report APPENDICES
101
S.28.01.01 Minimum Capital Requirement - Only life or only non-life insurance or reinsurance activity
Linear formula component for non-life insurance and reinsurance obligations MCRNL Result 284,916
Net (of reinsurance/SPV) best estimate and TP calculated as a
whole
Net (of reinsurance)
written premiums in the last 12
months
Income protection insurance and proportional reinsurance 4,076 7,519
Motor vehicle liability insurance and proportional reinsurance 1,247,619 607,108
Other motor insurance and proportional reinsurance 73,303 206,388
Fire and other damage to property insurance and proportional reinsurance 249,284 345,897
General liability insurance and proportional reinsurance 123,378 62,569
Assistance and proportional reinsurance 8,149 19,694
Miscellaneous financial loss insurance and proportional reinsurance 70,197 69,592
Non-proportional marine, aviation and transport reinsurance 24,918
Overall MCR calculation Linear MCR 284,916 SCR 555,247 MCR cap 249,861 MCR floor 138,812
Combined MCR 249,861
Absolute floor of the MCR 3,168
Minimum Capital Requirement 249,861