Embed Size (px)
Citation preview

Management
Accounting
2008 Solutions
By
Colin Davy and Danny Bruce
Table of Contents Chapter 1: Cost Concepts .................................................................. 1
Chapter 2: Manufacturing & Trading Statements ..........................11
Chapter 3: Cost-Volume-Profit Analysis......................................... 28
Chapter 4: The Cost Accounting Cycle........................................... 42
Chapter 5: Material & Labour ........................................................ 59
Chapter 6: Overhead Allocation ..................................................... 79
Chapter 7: Job Costing.................................................................... 87
Chapter 8: Responsibility Accounting ...........................................114
Chapter 9: Review Examinations ................................................. 122
Chapter 10: Class Examinations ................................................... 145 Regards Colin Davy & Danny Bruce
www.learnnowbiz.com ISBN: 1 876 602 856 Fourth Edition 2008 Published by P.O. Box 210 Bondi N.S.W. 2026 Phone: ( 02 ) 9314 5374 © This book is copyright and all rights are reserved. No part of this work is to be
reproduced other than in accordance with the Copyright Act, or with the written permission of the publishers.
Chapter 1: Cost Concepts
1
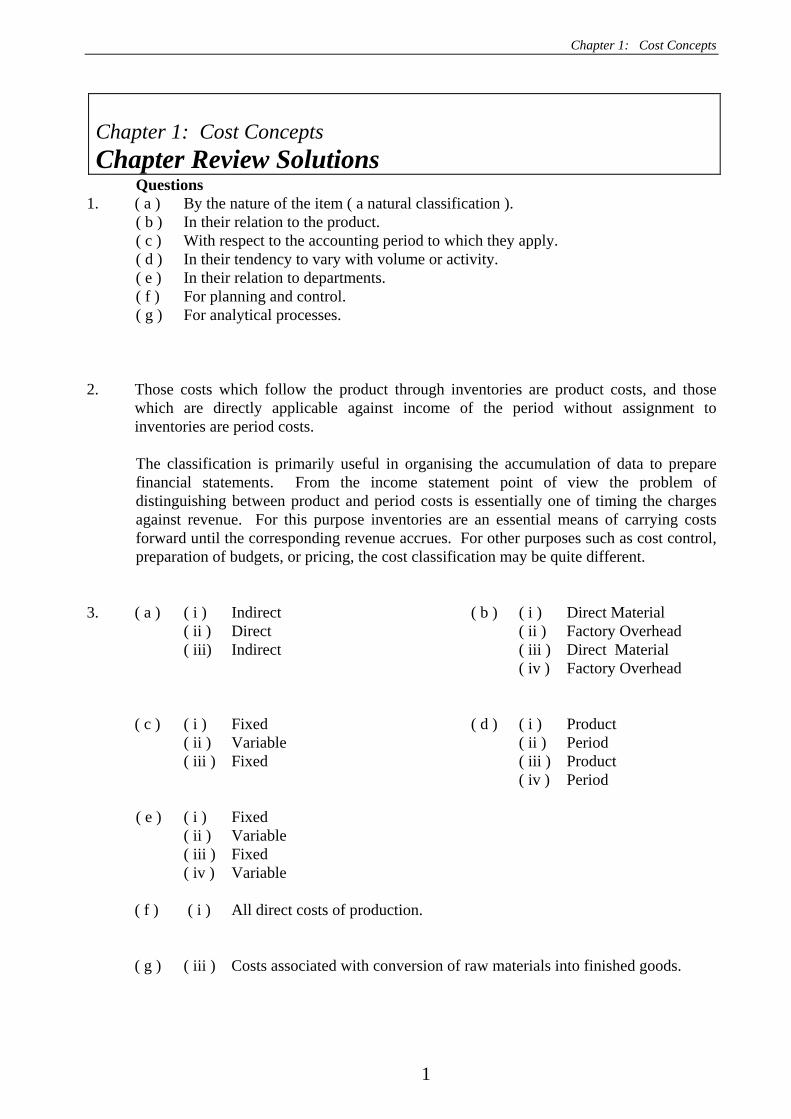
Chapter 1: Cost Concepts Chapter Review Solutions
Questions 1. ( a ) By the nature of the item ( a natural classification ).
( b ) In their relation to the product. ( c ) With respect to the accounting period to which they apply. ( d ) In their tendency to vary with volume or activity. ( e ) In their relation to departments. ( f ) For planning and control. ( g ) For analytical processes.
2. Those costs which follow the product through inventories are product costs, and those which are directly applicable against income of the period without assignment to inventories are period costs. The classification is primarily useful in organising the accumulation of data to prepare financial statements. From the income statement point of view the problem of distinguishing between product and period costs is essentially one of timing the charges against revenue. For this purpose inventories are an essential means of carrying costs forward until the corresponding revenue accrues. For other purposes such as cost control, preparation of budgets, or pricing, the cost classification may be quite different.
3. ( a ) ( i ) Indirect ( b ) ( i ) Direct Material ( ii ) Direct ( ii ) Factory Overhead ( iii) Indirect ( iii ) Direct Material ( iv ) Factory Overhead
( c ) ( i ) Fixed ( d ) ( i ) Product
( ii ) Variable ( ii ) Period ( iii ) Fixed ( iii ) Product ( iv ) Period
( e ) ( i ) Fixed
( ii ) Variable ( iii ) Fixed ( iv ) Variable
( f ) ( i ) All direct costs of production.
( g ) ( iii ) Costs associated with conversion of raw materials into finished goods.
Management Accounting in Australia - Solutions
2
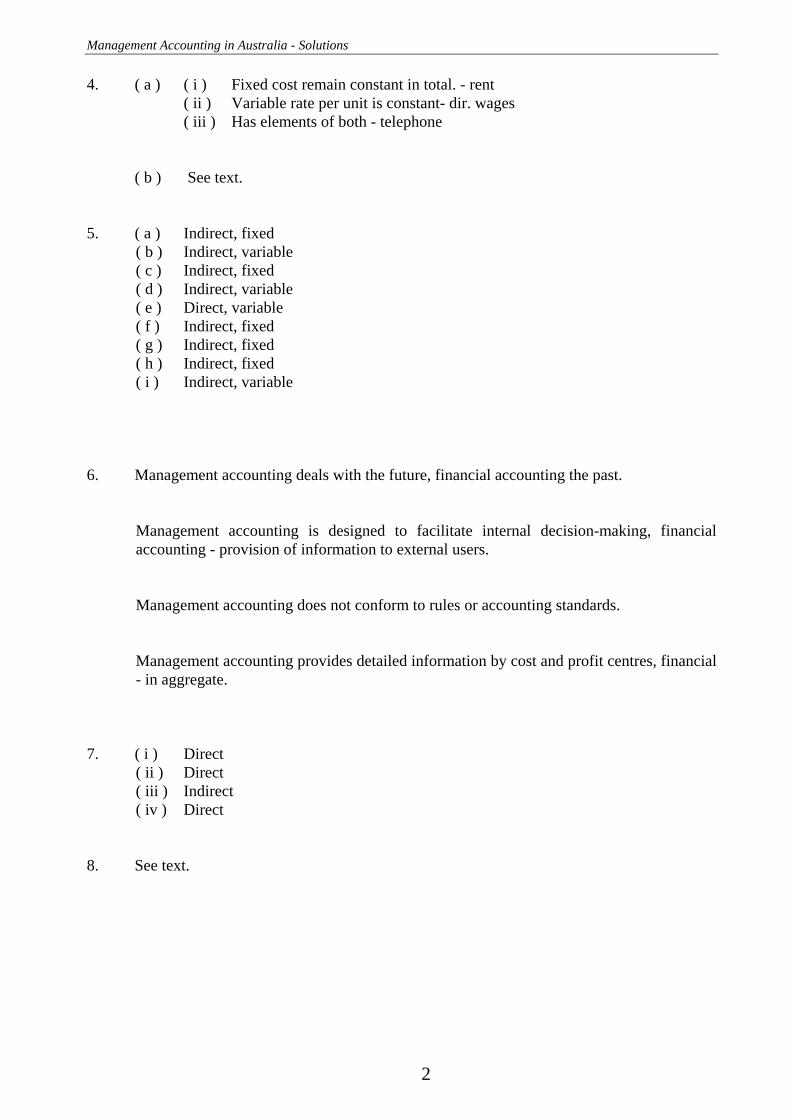
4. ( a ) ( i ) Fixed cost remain constant in total. - rent ( ii ) Variable rate per unit is constant- dir. wages ( iii ) Has elements of both - telephone
( b ) See text. 5. ( a ) Indirect, fixed
( b ) Indirect, variable ( c ) Indirect, fixed ( d ) Indirect, variable ( e ) Direct, variable ( f ) Indirect, fixed ( g ) Indirect, fixed ( h ) Indirect, fixed ( i ) Indirect, variable
6. Management accounting deals with the future, financial accounting the past. Management accounting is designed to facilitate internal decision-making, financial accounting - provision of information to external users. Management accounting does not conform to rules or accounting standards. Management accounting provides detailed information by cost and profit centres, financial - in aggregate.
7. ( i ) Direct ( ii ) Direct ( iii ) Indirect ( iv ) Direct
8. See text.
Chapter 1: Cost Concepts
3
9. Cost
Description Product
Costs Period Costs
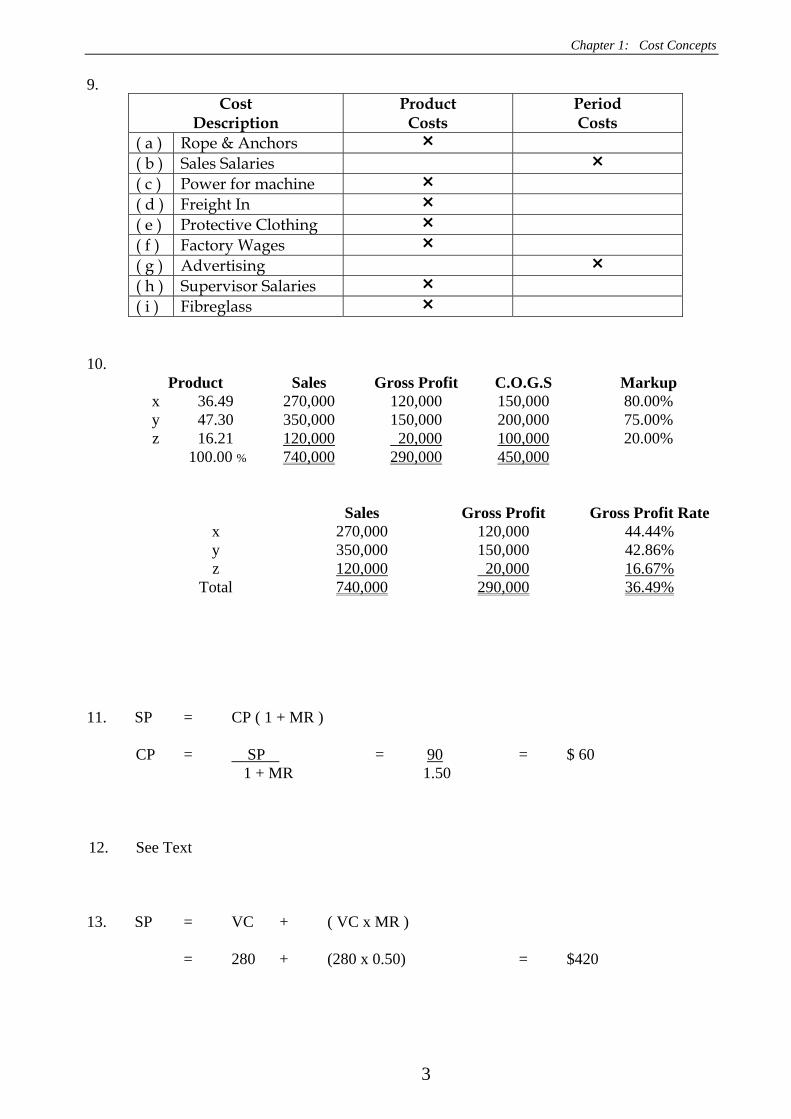
( a ) Rope & Anchors ( b ) Sales Salaries ( c ) Power for machine ( d ) Freight In ( e ) Protective Clothing ( f ) Factory Wages ( g ) Advertising ( h ) Supervisor Salaries ( i ) Fibreglass
10.
Product Sales Gross Profit C.O.G.S Markup x 36.49 270,000 120,000 150,000 80.00% y 47.30 350,000 150,000 200,000 75.00% z 16.21 120,000 20,000 100,000 20.00% 100.00 % 740,000 290,000 450,000
Sales Gross Profit Gross Profit Rate
x 270,000 120,000 44.44% y 350,000 150,000 42.86% z 120,000 20,000 16.67%
Total 740,000 290,000 36.49%
11. SP = CP ( 1 + MR )
CP = SP = 90 = $ 60 1 + MR 1.50
12. See Text 13. SP = VC + ( VC x MR )
= 280 + (280 x 0.50) = $420
Management Accounting in Australia - Solutions
4
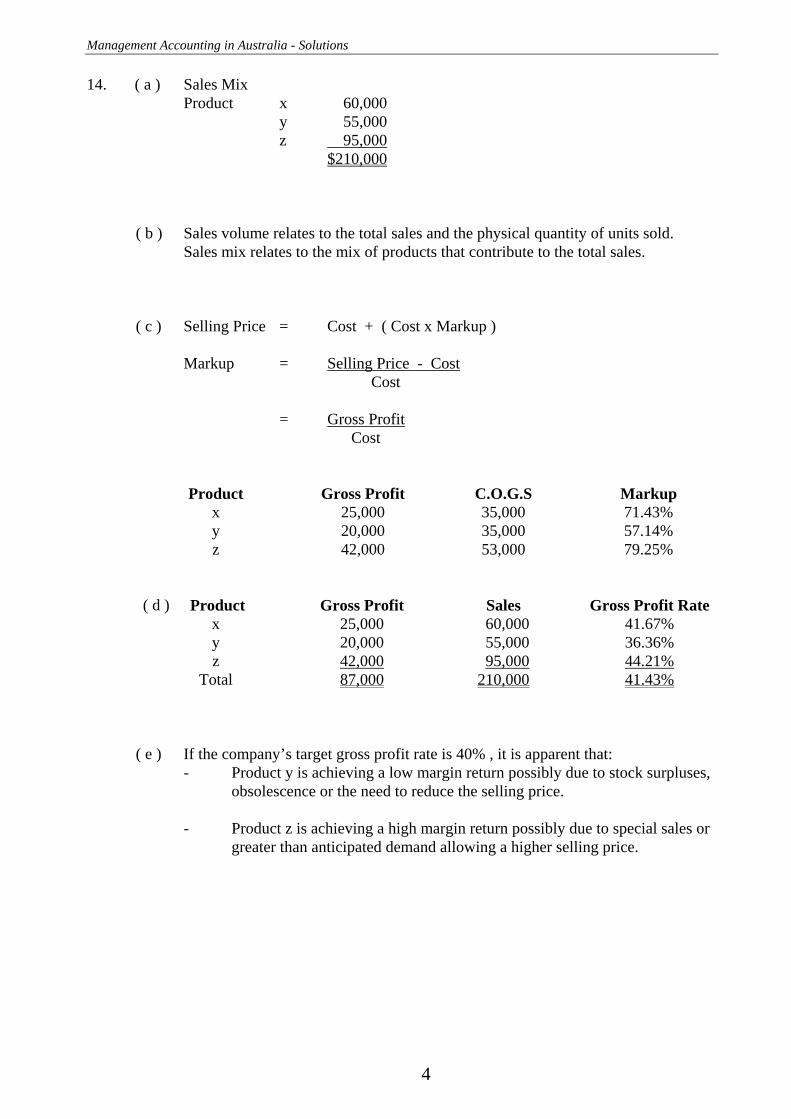
14. ( a ) Sales Mix Product x 60,000 y 55,000 z 95,000 $210,000 ( b ) Sales volume relates to the total sales and the physical quantity of units sold. Sales mix relates to the mix of products that contribute to the total sales. ( c ) Selling Price = Cost + ( Cost x Markup ) Markup = Selling Price - Cost Cost = Gross Profit Cost
Product Gross Profit C.O.G.S Markup x 25,000 35,000 71.43% y 20,000 35,000 57.14% z 42,000 53,000 79.25%
( d ) Product Gross Profit Sales Gross Profit Rate
x 25,000 60,000 41.67% y 20,000 55,000 36.36% z 42,000 95,000 44.21%
Total 87,000 210,000 41.43% ( e ) If the company’s target gross profit rate is 40% , it is apparent that: - Product y is achieving a low margin return possibly due to stock surpluses, obsolescence or the need to reduce the selling price. - Product z is achieving a high margin return possibly due to special sales or greater than anticipated demand allowing a higher selling price.

Chapter 1: Cost Concepts
5
15. ( a ) CBD Inner Metro Outer Metro Total Sales 15,000 12,000 16,000 43,000 Less Variable Costs 7,500 5,400 6,400 19,300 Contribution Margin 7,500 6,600 9,600 23,700 Less Fixed Costs 3,500 3,500 3,500 10,500 Net Profit 4,000 3,100 6,100 13,200
( b ) Outer Metro ( c ) Assume variable costs are a constant percentage of sales. CBD x = 3,500 + 0.50 x x = $7,000 where x = sales breakeven $ Inner Metro x = 3,500 + 0.45 x x = $6,364 Outer Metro x = 3,500 + 0.40 x x = $5,833
16. Sales price 200 100.00 Less Variable costs - 90 45.00 Contribution Margin 110 55.00
Break even quantity = Fixed Cost = $110,000 1,000 units Contribution Margin $110
Contribution Margin: $110 Contribution Margin Ratio 55%
Management Accounting in Australia - Solutions
6
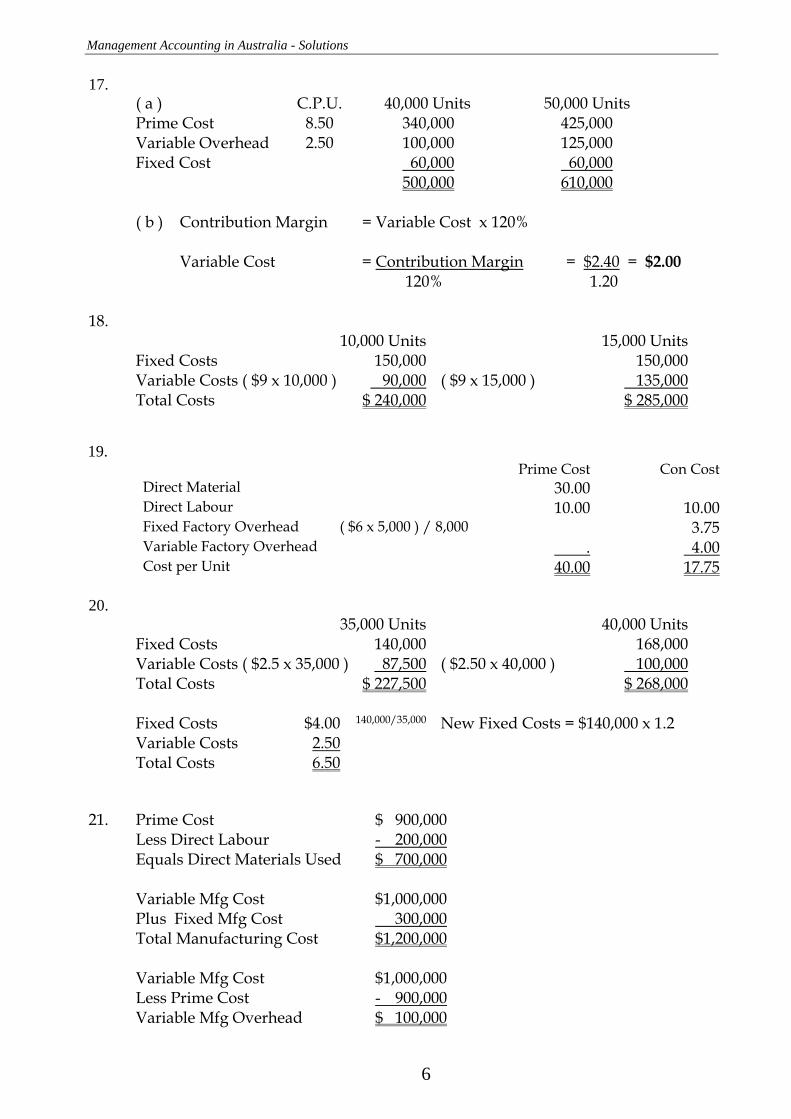
17. ( a ) C.P.U. 40,000 Units 50,000 Units Prime Cost 8.50 340,000 425,000 Variable Overhead 2.50 100,000 125,000 Fixed Cost 60,000 60,000 500,000 610,000 ( b ) Contribution Margin = Variable Cost x 120% Variable Cost = Contribution Margin = $2.40 = $2.00 120% 1.20
18. 10,000 Units 15,000 Units Fixed Costs 150,000 150,000 Variable Costs ( $9 x 10,000 ) 90,000 ( $9 x 15,000 ) 135,000 Total Costs $ 240,000 $ 285,000
19.
Prime Cost Con Cost Direct Material 30.00 Direct Labour 10.00 10.00 Fixed Factory Overhead ( $6 x 5,000 ) / 8,000 3.75 Variable Factory Overhead . 4.00 Cost per Unit 40.00 17.75
20.
35,000 Units 40,000 Units Fixed Costs 140,000 168,000 Variable Costs ( $2.5 x 35,000 ) 87,500 ( $2.50 x 40,000 ) 100,000 Total Costs $ 227,500 $ 268,000 Fixed Costs $4.00 140,000/35,000 New Fixed Costs = $140,000 x 1.2 Variable Costs 2.50 Total Costs 6.50
21. Prime Cost $ 900,000 Less Direct Labour - 200,000 Equals Direct Materials Used $ 700,000
Variable Mfg Cost $1,000,000 Plus Fixed Mfg Cost 300,000 Total Manufacturing Cost $1,200,000 Variable Mfg Cost $1,000,000 Less Prime Cost - 900,000 Variable Mfg Overhead $ 100,000
Chapter 1: Cost Concepts
7
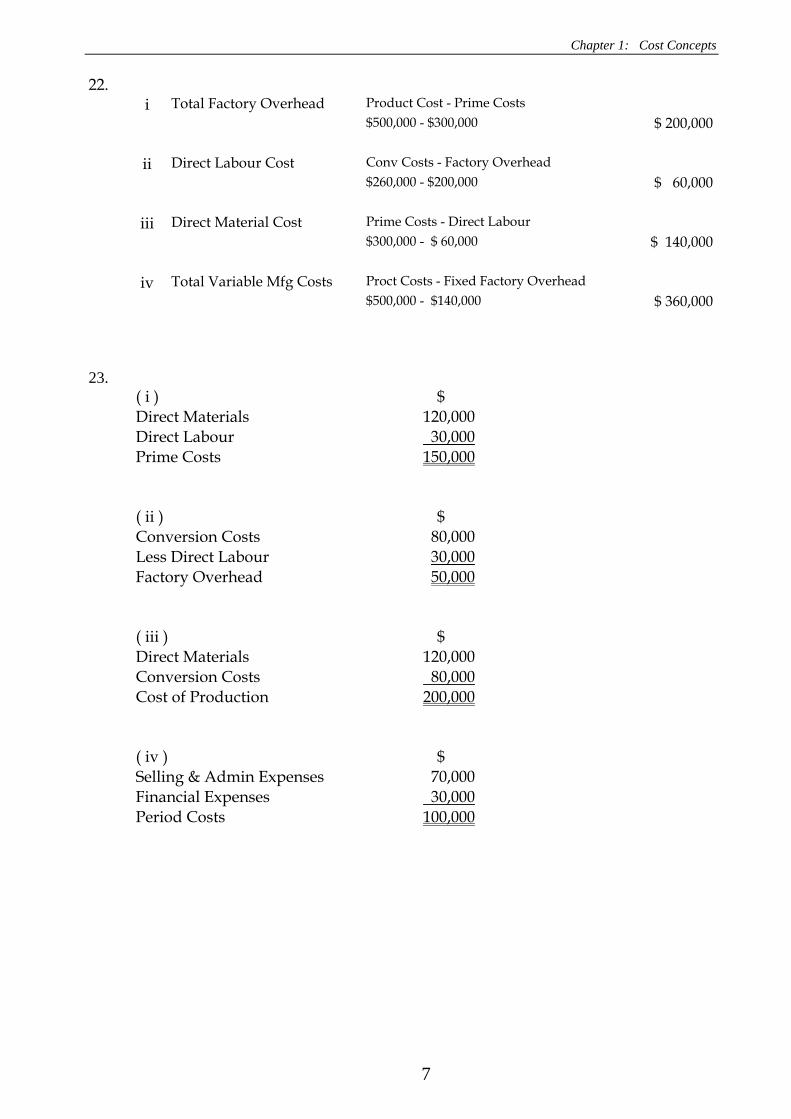
22. i Total Factory Overhead Product Cost - Prime Costs $500,000 - $300,000 $ 200,000
ii Direct Labour Cost Conv Costs - Factory Overhead $260,000 - $200,000 $ 60,000
iii Direct Material Cost Prime Costs - Direct Labour $300,000 - $ 60,000 $ 140,000
iv Total Variable Mfg Costs Proct Costs - Fixed Factory Overhead $500,000 - $140,000 $ 360,000
23. ( i ) $ Direct Materials 120,000 Direct Labour 30,000 Prime Costs 150,000 ( ii ) $ Conversion Costs 80,000 Less Direct Labour 30,000 Factory Overhead 50,000 ( iii ) $ Direct Materials 120,000 Conversion Costs 80,000 Cost of Production 200,000 ( iv ) $ Selling & Admin Expenses 70,000 Financial Expenses 30,000 Period Costs 100,000

Management Accounting in Australia - Solutions
8
Problems 24. ( a )
Prime Costs $500,000Less Direct Labour 150,000Direct Materials used 350,000 ( b ) Variable Manufacturing cost $525,000Add Fixed mfg. Overhead 75,000Total manufacturing cost 600,000 ( c ) Variable Manufacturing cost $525,000Less Prime Cost 500,000Variable mfg. overhead cost 25,000 Note: Total mfg cost comprises Direct Materials $350,000Direct labour 150,000Variable mfg. overhead cost 25,000Variable Manufacturing cost 525,000Add Fixed mfg. overhead 75,000Total manufacturing cost 600,000
25.
( a ) Prime Cost Direct Materials Fibreglass, resin etc. 12,000 Sailcloth 3,500 Rigging and fittings 3,000 Direct labour Production wages 10,000 28,500
( b ) Period cost General office rent 3,750 General office salaries 2,050 5,800
( c ) Fixed manufacturing cost Factory rent 2,500 Depreciation – factory equipment 700 3,200
( d ) Prime Cost + Variable factory Exp ( 28,500 + 500 ) 29,000
Chapter 1: Cost Concepts
9
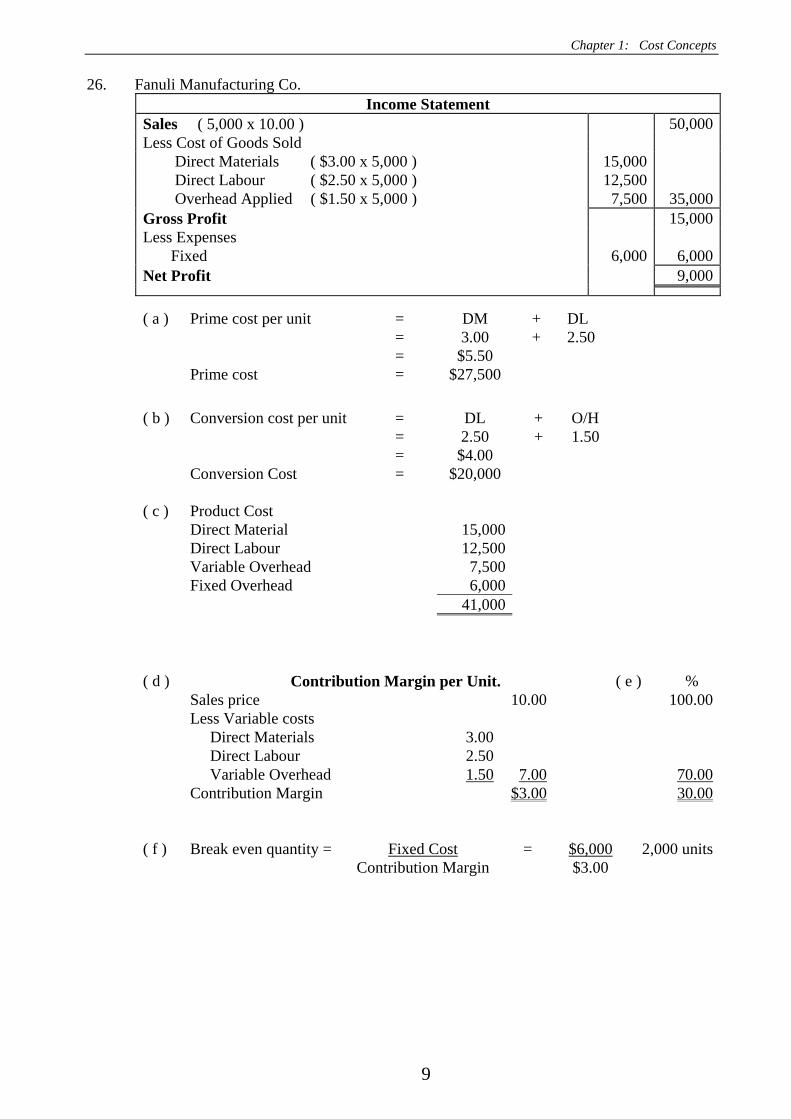
26. Fanuli Manufacturing Co. Income Statement
Sales ( 5,000 x 10.00 ) 50,000Less Cost of Goods Sold Direct Materials ( $3.00 x 5,000 ) 15,000 Direct Labour ( $2.50 x 5,000 ) 12,500 Overhead Applied ( $1.50 x 5,000 ) 7,500 35,000Gross Profit 15,000Less Expenses Fixed 6,000 6,000Net Profit 9,000
( a ) Prime cost per unit = DM + DL = 3.00 + 2.50 = $5.50 Prime cost = $27,500
( b ) Conversion cost per unit = DL + O/H = 2.50 + 1.50 = $4.00 Conversion Cost = $20,000 ( c ) Product Cost Direct Material 15,000 Direct Labour 12,500 Variable Overhead 7,500 Fixed Overhead 6,000 41,000
( d ) Contribution Margin per Unit. ( e ) % Sales price 10.00 100.00 Less Variable costs Direct Materials 3.00 Direct Labour 2.50 Variable Overhead 1.50 7.00 70.00 Contribution Margin $3.00 30.00
( f ) Break even quantity = Fixed Cost = $6,000 2,000 units Contribution Margin $3.00

Management Accounting in Australia - Solutions
10
27. ( a ) Conversion cost: Direct labour $80,000 Fixed manufacturing overhead 60,000 Variable manufacturing overhead 30,000 $170,000 ( b ) Product cost: Variable manufacturing $250,000 Fixed manufacturing overhead 60,000 $310,000 ( c ) Prime cost: Variable manufacturing $250,000 Less Variable manufacturing overhead 30,000 $220,000 ( d ) Period cost: Fixed selling and administration $110,000 Variable selling 70,000 $180,000 ( e ) Manufacturing overhead cost @ 60,000 units: Fixed manufacturing overhead $60,000 Variable manufacturing overhead $30,000 x 60,000 36,000 50,000 $96,000
28. ( a ) Direct Labour cost:
Conversion costs $150,000 Fixed manufacturing overhead - 56,000 Variable manufacturing overhead - 20,000 $ 74,000 ( b ) Variable conversion cost: Direct Labour $ 74,000 Variable manufacturing 20,000 $ 94,000 ( c ) Product cost: Prime cost $237,000 Fixed manufacturing overhead 56,000 Variable manufacturing overhead 20,000 $313,000 ( d ) Period cost: Fixed selling and administration $130,000 Variable selling 45,000 $175,000 ( e ) Manufacturing overhead cost @ 30,000 units: Fixed manufacturing overhead $56,000 Variable manufacturing overhead $20,000 x 30,000 30,000 20,000 $86,000

Chapter 2: Manufacturing & Trading Statements
11
Chapter 2: Manufacturing & Trading Statements Chapter Review Solutions
1. ( a ) Direct Material Cost Inventory 1/7/09 5,000 Purchases 25,000 30,000 Less Inventory 30/6/10 4,000 26,000
( b ) Direct Material Cost Inventory 1/7/08 4,000 Purchases 26,000 Freight on Purchases 1,000 31,000 Less Inventory 30/6/10 3,000 28,000
( c ) Direct Material Cost Inventory 1/7/09 5,000 Purchases 32,000 Freight & Other Charges 1,000 38,000 Less Inventory 30/6/10 8,000 30,000
( d ) Direct Material Cost Inventory 1/7/09 5,000 Purchases 30,000 Freight 1,000 Duty & Landing Charges 2,000 38,000 Less Inventory 30/6/10 6,000 32,000
( e ) Direct Material Cost Work in Progress 1/7/10 1,200 Inventory 1/7/10 6,500 Purchase 27,300 Freight Inwards 800 35,800 Less Work in Progress 30/6/11 700 Inventory 30/6/11 1,100 1,800 34,000

Management Accounting in Australia - Solutions
12
2. Direct Labour Costs Direct Labour Paid 48,000 Less Direct Labour. Accrued 1/7/09 1,400 46,600 Add DIRECT LABOUR. Accrued 30/6/10 2,200 48,800
3. Direct Labour Cost Direct Labour Paid 56,000 Less Direct Labour. Accrued 1/7/09 3,200 52,800 Add Direct Labour. Accrued 30/6/10 2,200 55,000
4. Work in Progress 1/7/09 11,800 Direct Labour Paid 52,000 + Accrued 30/6/10 1,100 Less Accrued 1/7/09 1,600 51,500 63,300 Less Work in Progress 30/6/10 3,300 60,000
5.
Manufacturing Overhead Factory Insurance 400 Factory Light & Power 1,800 Indirect Labour ( 400 + 15,000 - 400 ) 15,200 Machinery Repairs 1,300 Depreciation Machinery 5,900 Indirect Material ( 1,700 + 5,100 - 1,400 ) 5,400 30,000
6. Costs for the Period Manufacturing Overhead Work in Progress 1/7/09 2,200 Factory Insurance ( 500 - 100 ) 400 Factory Light & Power 2,300 Indirect Labour ( 17,000 + 600 - 400 ) 17,200 Machinery Repairs 400 Depreciation Machinery 4,500 Indirect Materials ( 1,400 + 7,000 - 1,600 ) 6,800 33,800 Less Work in Progress 30/6/10 1,800 32,000
7. By using method as in solution 5, number manufactured equals 7,000
W.I.P. O/bal 12,800 F.G.s 112,000 Cost of Prod 112,800 C/bal 13,600 125,600 125,600 Therefore cost per unit = $16.00 ( 112,000 / 7,000 )

Chapter 2: Manufacturing & Trading Statements
13
8. Factory Rates paid during year 2,500 Add Back prepayments 1/7/2009 1,200 3,700 Add Accrued 30/6/2010 600 To Manufacturing Account 4,300
9. Manufacturing Account
O / bal Work in Progress 4,000 Trading Account 30,000Direct Material 12,000 Cost of Production Direct Labour 8,000 Overhead 8,000 32,000 C/bal Work in Progress 2,000 30,000 30,000
10.
( a ) Raw Material Cost Work in Progress 1/7/08 2,000 Inventory 1/7/08 10,000 Purchases 60,000 Freight Inwards 2,000 Duty 5,000 79,000 Less Work in Progress 30/6/09 6,000 Inventory 30/6/09 16,000 22,000 57,000
( b ) Direct Labour Cost Work in Progress 1/7/09 2,000 Labour ( 25,000 + 2,000 - 1,000 ) 26,000 28,000 Less Work in Progress 30/6/10 6,000 22,000
( c ) Prime Cost Raw Materials 57,000 Direct Labour 22,000 79,000
Management Accounting in Australia - Solutions
14
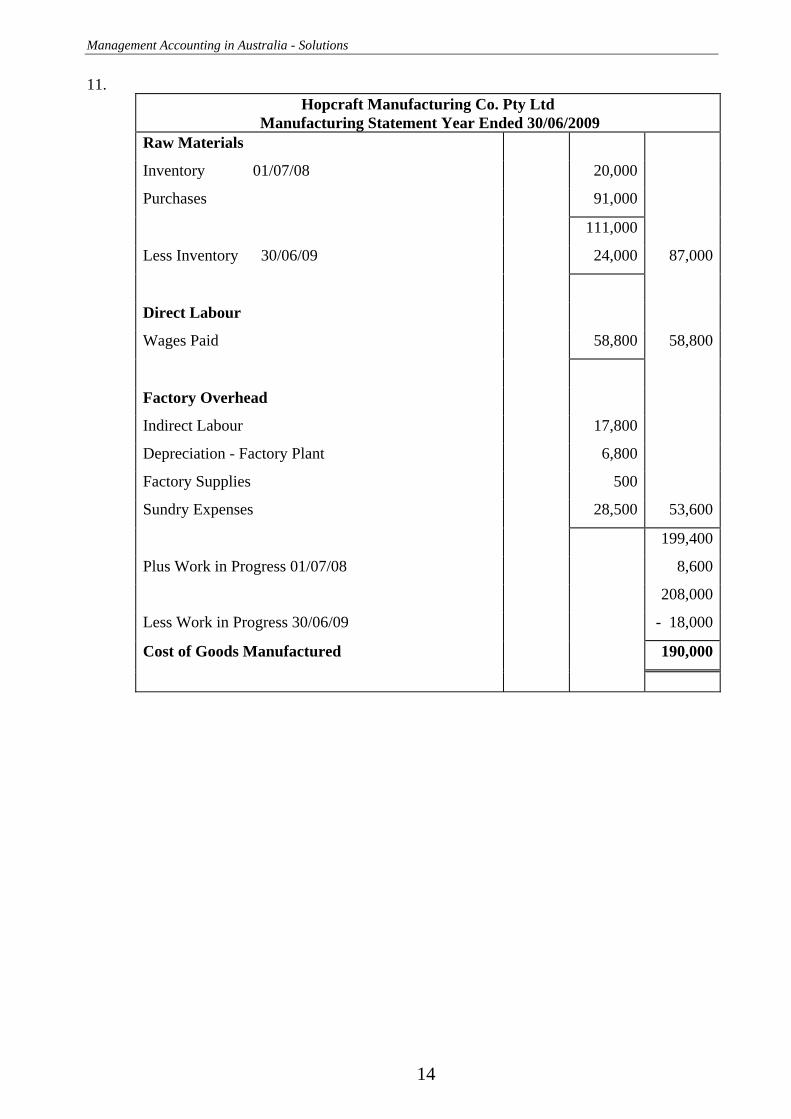
11. Hopcraft Manufacturing Co. Pty Ltd
Manufacturing Statement Year Ended 30/06/2009 Raw Materials
Inventory 01/07/08 20,000
Purchases 91,000
111,000
Less Inventory 30/06/09 24,000 87,000
Direct Labour
Wages Paid 58,800 58,800
Factory Overhead
Indirect Labour 17,800
Depreciation - Factory Plant 6,800
Factory Supplies 500
Sundry Expenses 28,500 53,600
199,400
Plus Work in Progress 01/07/08 8,600
208,000
Less Work in Progress 30/06/09 - 18,000
Cost of Goods Manufactured 190,000

Chapter 2: Manufacturing & Trading Statements
15
12.
Manufacturing Statement for the year ended 30 June 2009
Direct Materials
Inventory 1/07/08 7,500
Purchases 46,500
54,000
Less Inventory 30/06/09 4,000 50,000
Direct Labour
Labour paid 20,000 20,000
Factory Overhead
Supervisor 7,800
Depreciation - Manufacturing Plant 2,300
Factory Rates 5,200
Factory Supplies ( 1,400 – 400 ) 1,000
Insurance 1,100
Power 3,100
Repairs to Plant 4,200 24,700
Cost of Production this period 94,700
Work in Progress 01/07/08 13,300
108,000
Work in Progress 30/06/09 - 8,000
Cost of Goods Manufactured 100,000
Management Accounting in Australia - Solutions
16
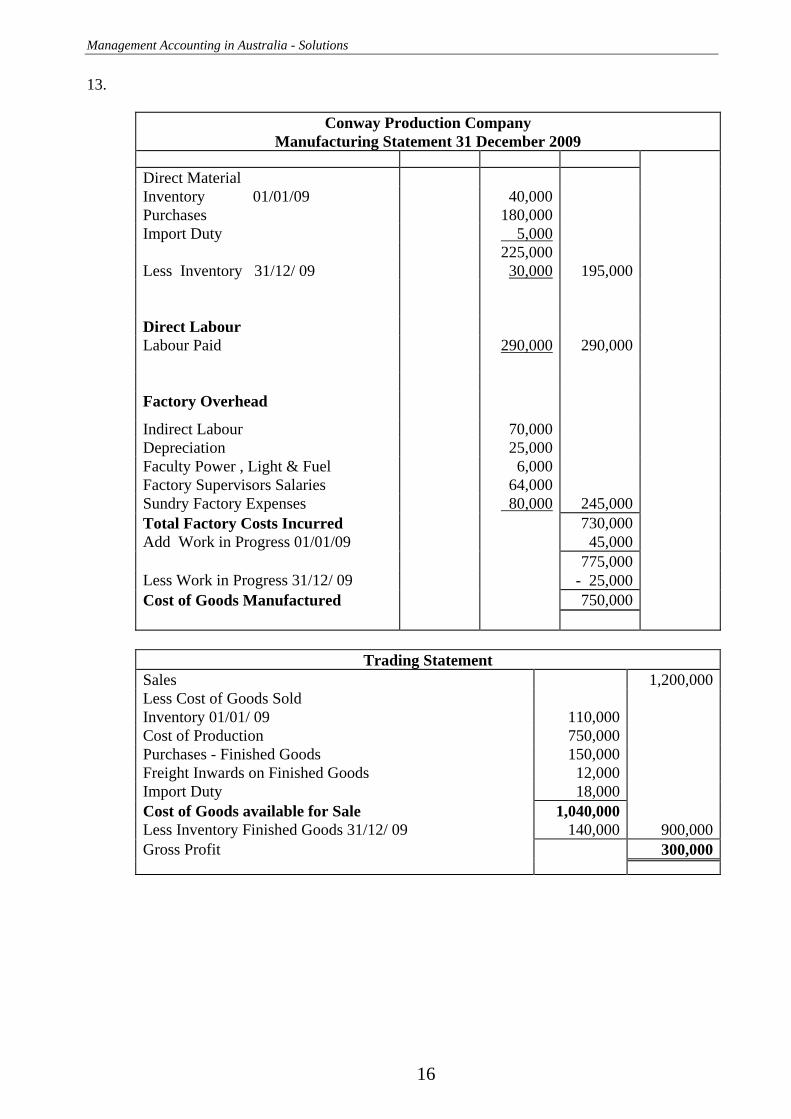
13.
Conway Production Company Manufacturing Statement 31 December 2009
Direct Material Inventory 01/01/09 40,000 Purchases 180,000 Import Duty 5,000 225,000 Less Inventory 31/12/ 09 30,000 195,000 Direct Labour Labour Paid 290,000 290,000 Factory Overhead
Indirect Labour 70,000 Depreciation 25,000 Faculty Power , Light & Fuel 6,000 Factory Supervisors Salaries 64,000 Sundry Factory Expenses 80,000 245,000 Total Factory Costs Incurred 730,000 Add Work in Progress 01/01/09 45,000 775,000 Less Work in Progress 31/12/ 09 - 25,000 Cost of Goods Manufactured 750,000
Trading Statement
Sales 1,200,000Less Cost of Goods Sold Inventory 01/01/ 09 110,000 Cost of Production 750,000 Purchases - Finished Goods 150,000 Freight Inwards on Finished Goods 12,000 Import Duty 18,000 Cost of Goods available for Sale 1,040,000 Less Inventory Finished Goods 31/12/ 09 140,000 900,000Gross Profit 300,000

Chapter 2: Manufacturing & Trading Statements
17
14. Rex Manufacturing Company Pty Ltd -Manufacturing Statement 31 December 2009
Direct Materials Inventory 01/01/09 8,400 Purchases 45,100 Duty on Raw Materials 1,400 54,900 Less Inventory 31/12/ 09 6,900 48,000 Direct Labour Labour Paid 62,000 62,000 Factory Overhead Indirect Labour 13,200 Holiday and Sick Pay 12,300 Factory Power, Light & Fuel 1,800 Factory Managers Salary 18,600 Sundry Factory Expenses 7,800 Depreciation Factory Plant 2,300 56,000 Cost of Production 166,000Work in Progress 01/01/ 09 4,000Less Work in Progress 31/12/ 09 - 10,000Cost of Goods Manufactured 160,000
15.
P. Hogan Manufacturing Statement - 30 June, 2009
Direct Materials Inventory 01/01/09 1,000 Purchases 145,000 Freight Inwards 400 146,400 Less Inventory 30/06/09 - 1,500 144,900 Direct Labour Labour ( 72,000 + 500 – 600 ) 71,900 71,900 Factory Overhead Factory Rent 50,000 Factory Supplies 2,000 Depreciation Factory Plant 11,000 Electricity 4,000 Indirect Labour 6,500 73,500 Cost of Production 290,300Work in Progress 01/01/09 1,200 291,500Less Work in Progress 31/12/09 - 1,500Cost of Goods Manufactured 290,000

Management Accounting in Australia - Solutions
18
16. Manufacturing Statement
30 June 2009 Direct Materials Inventory 1/7/ 08 3,200 Purchases 72,000 Duty on Raw Materials 3,200 Freight Inwards on Raw Material 3,600 82,000 Less Inventory 30/6/09 - 4,000 78,000 Direct Labour Labour ( 66,700 + 3,200 – 2,300 ) 67,600 67,600 Factory Overhead Factory Supplies 01/07/ 08 2,400 Purchases 10,400 12,800 Factory Supplies 30/06/09 – 1,600 11,200 Insurance 400 Factory Light & Power 1,600 Factory Managers Salary 12,000 Foreman’s Wages 8,000 Other Indirect Labour 6,400 Repairs to Machinery 2,000 Other Manufacturing Expenses 14,000 55,600 Cost of Production 201,200 Work in Progress 01/07/ 08 7,200 208,400 Less Work in Progress 30/06/ 09 - 11,200 Cost of Goods Manufactured 197,200

Chapter 2: Manufacturing & Trading Statements
19
17. Amalfi Manufacturing Co Pty Ltd
Manufacturing Statement 30 June 2009 Direct Materials Inventory 1/7/ 08 18,000 Purchases 100,000 Freight Inwards 5,000 123,000 Less Inventory 30/6/ 09 - 19,000 104,000 Direct Labour Labour Paid 80,000 80,000 Factory Overhead Factory Supplies 01/07/ 08 4,500 Purchases 10,000 14,500 Factory Supplies 30/06/09 – 5,500 9,000 Factory Expenses 45,400 Indirect Labour 20,000 74,400Cost of Production 258,400Work in Progress 1/7/ 08 5,500 263,900Less Work in Progress 30/6/ 09 8,500Cost of Goods Manufactured 255,400
Income Statement
Sales 480,000Less Cost of Goods Sold 290,400Inventory 1/7/08 10,000 Cost of Production 255,400 Purchases of Finished Goods 35,000 Freight Inwards 1,000 301,400 Less Inventory 30/6/ 09 11,000 Gross Profit 189,600Add other Operating Income 2,500Discount Received 2,500 192,100Less Expenditure Incurred 56,100Marketing Expenses 11,000 Advertising 4,800 Freight Outwards 6,200 General & Administrative Expenses 42,000 Office Salaries 30,000 Office Rent & Other Expenses 12,000 Financial Expenses 3,100 Discount Allowed 1,100 Interest on Bank Loan 2,000 Net ( Operating ) Profit 136,000
Management Accounting in Australia - Solutions
20
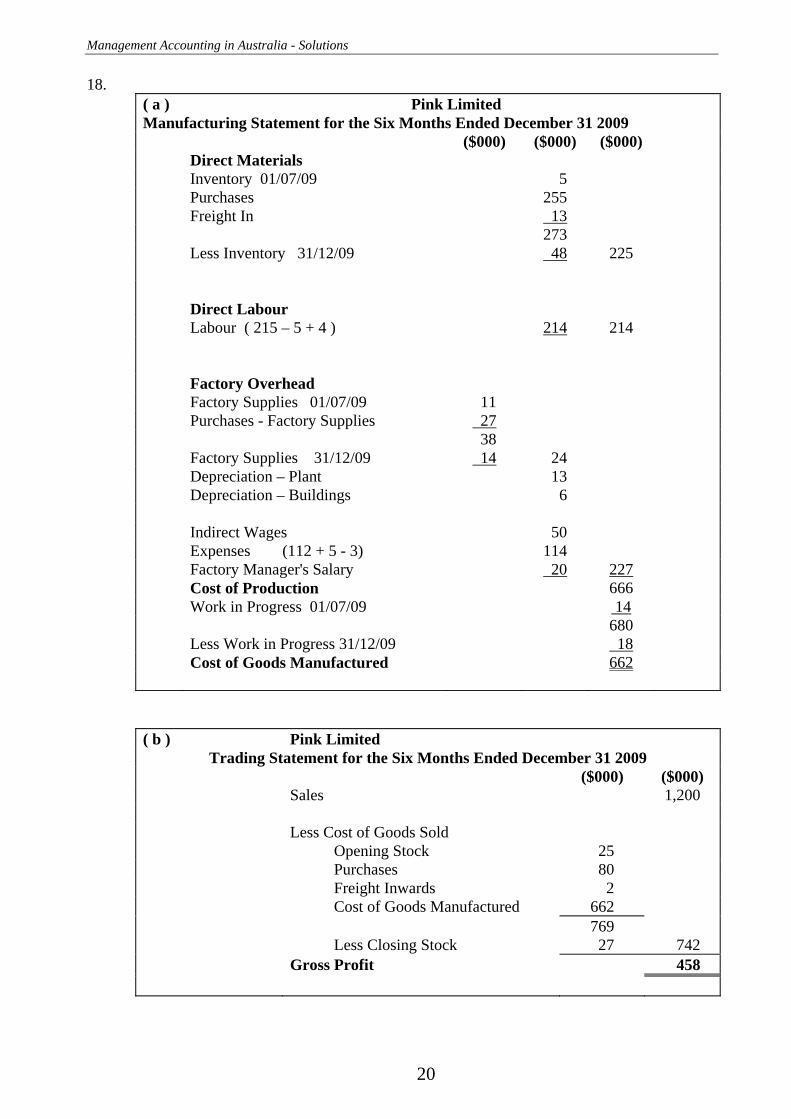
18. ( a ) Pink Limited Manufacturing Statement for the Six Months Ended December 31 2009 ($000) ($000) ($000) Direct Materials Inventory 01/07/09 5 Purchases 255 Freight In 13 273 Less Inventory 31/12/09 48 225 Direct Labour Labour ( 215 – 5 + 4 ) 214 214 Factory Overhead Factory Supplies 01/07/09 11 Purchases - Factory Supplies 27 38 Factory Supplies 31/12/09 14 24 Depreciation – Plant 13 Depreciation – Buildings 6 Indirect Wages 50 Expenses (112 + 5 - 3) 114 Factory Manager's Salary 20 227 Cost of Production 666 Work in Progress 01/07/09 14 680 Less Work in Progress 31/12/09 18 Cost of Goods Manufactured 662
( b ) Pink Limited
Trading Statement for the Six Months Ended December 31 2009 ($000) ($000) Sales 1,200 Less Cost of Goods Sold Opening Stock 25 Purchases 80 Freight Inwards 2 Cost of Goods Manufactured 662 769 Less Closing Stock 27 742 Gross Profit 458

Chapter 2: Manufacturing & Trading Statements
21
19. Direct Materials Bal 01/06/09 60,000 Purchases 240,000 300,000 Direct Materials - 65,000 235,000 Direct Labour Paid & Accrued ( 74,000 + 1,000 ) 75,000 75,000 Factory Overhead Factory Supplies 01/06/09 6,000 Purchases 18,000 24,000 Factory Supplies 30/06/09 - 4,000 20,000 Indirect Lab 10,000 Insurance ( 4,000 + 13,000 – 6,000 ) 11,000 Power – Factory 12,000 Depreciation * 16,000 Rent – Factory 15,000 General – Factory 18,000 102,000 Current Cost of Goods Manufactured 412,000 Plus Opening Balance of W.I.P. 35,000 447,000 Less Closing Balance of W.I.P. - 47,000 Cost of Goods Manufactured 400,000
Trading Statement for the Month June 2009 Sales 900,000
Cost of Goods Sold Finished Goods 01/06/09 100,000 Purchases 50,000 Cost of Goods Manufactured 400,000 550,000 Finished Goods 30/06/09 -50,000 500,000 Gross Profit 400,000 Note: Factory plant and machinery is depreciated at 20% p.a. straight-line. Balance 01 June 2009 960,000 0ne Month 80,000 20% 12 = 16,000

Management Accounting in Australia - Solutions
22
20. Manufacturing Statement for the six months ended 30th June, 2009 Direct Materials Material Inventory 01/01/09 30,000 Purchases 120,000 Cartage and Duty 10,000 160,000 Material Inventory 30/06/09 -10,000 150,000 Direct Labour Paid & Accrued ( 108,500 + 1,500 ) 110,000 110,000 Factory Overhead Factory Supplies 01/01/09 3,000 Purchases 12,000 15,000 Factory Supplies 30/06/09 -2,000 13,000 Indirect Labour ( 40,500 + 500 ) 41,000 Electricity 16,000 Rates ( 6,200 - 200 ) 6,000 General 4,000 Depreciation 15,000 95,000 355,000Work In Progress 01/01/09 44,000 399,000Work In Progress 30/06/09 - 39,000Cost of Goods Manufactured 360,000
Trading Statement for the six month June 2009 Sales 600,000 Cost of Goods Sold Opening Bal Finished Goods 70,000 Purchases 30,000 Cost of Goods Manufactured 360,000 460,000 Closing Bal Finished Goods -20,000 440,000 Gross Profit 160,000

Chapter 2: Manufacturing & Trading Statements
23
21. ( a ) Kangan Manufacturing Statement $ $ $
Direct Materials Opening stock 21,000 Cartage Inwards 4,800 Purchases 96,800
122,600 Less: Closing stock - 21,480 101,120
Direct Labour Direct labour ( 76,950 + 2,000 ) 78,950 78,950
Factory Overhead Factory Supplies Inventory 1 July 1,900 Purchases 11,980 13,880 Less Inventory 30 June 2,360 11,520 Indirect Labour ( 32,340 + 1,060 ) 33,400 Rent ( 22,000 x 50% ) 11,000 Rates & Insurance ( 50% x ( 4,100 + 680 – 940 ) 1,920 Sundry 6,070 Depreciation ( 59,000 x 15% ) 8,850 72,760 252,830 Opening Bal Work In Progress 21,710 274,540 Less Closing Bal Work In Progress - 24,540 Cost of Goods Manufactured $ 250,000 ( b )
Trading Statement $ $
Sales 423,600 Less: Cost of goods sold Opening stock of finished goods 28,320 Cost of Goods Manufactured 250,000
278,320 Less: Closing stock of finished goods 4,720 273,600 Gross Profit $ 150,000

Management Accounting in Australia - Solutions
24
22. ( a ) Brook Vale Manufacturing Statement $ $ $
Direct Materials Opening stock 60,000 Freight Inwards 4,000 Purchases 266,000
330,000 Less: Closing stock - 30,000 300,000
Direct Labour Direct labour ( 123,500 – 1,000 + 2,500) 125,000
Factory Overhead Factory Supplies: Inventory 1 July 12,000 Purchases 38,000 50,000 Less Inventory 30 June 10,000 40,000 Indirect Labour ( Factory Forman ) 49,000 Insurance ( 25% x 4,000 ) + 6,000 7,000 Power 6,000 Depreciation 10,000 112,000 537,000 Opening Bal Work In Progress 35,000 572,000 Less Closing Bal Work In Progress - 20,000 Cost of Goods Manufactured 552,000 ( b )
Trading Statement $ $
Sales 1,140,000 Less: Cost of goods sold Opening stock of finished goods 25,000 Purchases 45,000 Freight Inwards 2,000 Cost of Goods Manufactured 552,000
624,000 Less: Closing stock of finished goods 32,000 592,000 Gross Profit 548,000

Chapter 2: Manufacturing & Trading Statements
25
23. ( a ) Radoslow Ltd Manufacturing Statement $ $ $
Direct Materials Opening Inventory 66,000 Purchases 276,000 Freight inwards 12,000
354,000 Less: Closing Inventory 14,000 340,000
Direct Labour Direct labour ( 159,800 + 1,100 – 900 ) 160,000 160,000
Factory Overhead Factory Supplies Inventory 1 July 12,600 Purchases 32,400 45,000 Less Inventory 30 June 12,700 32,300 Indirect Labour 43,340 Insurance ( 3,960 + 3,000 – [ 3,960 x 10/12 ] ) 3,660 Power 5,200 Depreciation 10,500 95,000
595,000 Work In Progress 01/07/2008 15,000 610,000 Work In Progress 30/06/2009 - 10,000 Cost of Production 600,000 ( b )
Trading Statement $ $
Sales 900,000 Less: Cost of Goods Sold Opening Stock of Finished Goods 24,000 Cost of Goods Manufactured 600,000 Purchases 46,700 Freight 2,300
673,000 Less: Closing stock of finished goods 23,000 650,000 Gross Profit 250,000

Management Accounting in Australia - Solutions
26
24. ( a ) Lone Pine Ltd Manufacturing Statement for Year Ended 30 June 2009 DIRECT MATERIALS Inventory 1 July 2008 $ 25,000 Purchases 170,000 Freight inwards 5,000 200,000 Less: Inventory 30 June 2009 20,000 180,000 DIRECT LABOUR Direct Labour incurred ( $119,200 + 800 ) 120,000 120,000 FACTORY OVERHEAD Factory Supplies Inventory 1 July 2008 2,500 Purchases 17,500 20,000 Less: Inventory 30 June 2009 3,000 17,000 Indirect Labour 23,500 Factory Repairs and Maintenance 6,500 Factory Power ( $9,500 + 500 ) 10,000 Factory Waste disposal 3,300 Factory Insurance 4,500 Depreciation – Factory building & machinery 15,300 80,100 380,100 Work In Progress 01/07/08 19,900 400,000 Work In Progress 30/06/09 10,000 Cost of Goods Manufactured 390,000
( b ) Lone Pine Ltd Trading Statement for Year Ended 30 June 2009 Sales 800,000 Less Cost of Goods Sold Finished Goods Inventory 1 July 2008 33,400 Purchases 40,600 Freight Inwards 4,000 Cost of Goods Manufactured 390,000 468,000 Less Finished Goods Inventory 30 June 2009 18,000 450,000 Gross Profit $350,000
Chapter 2: Manufacturing & Trading Statements
27
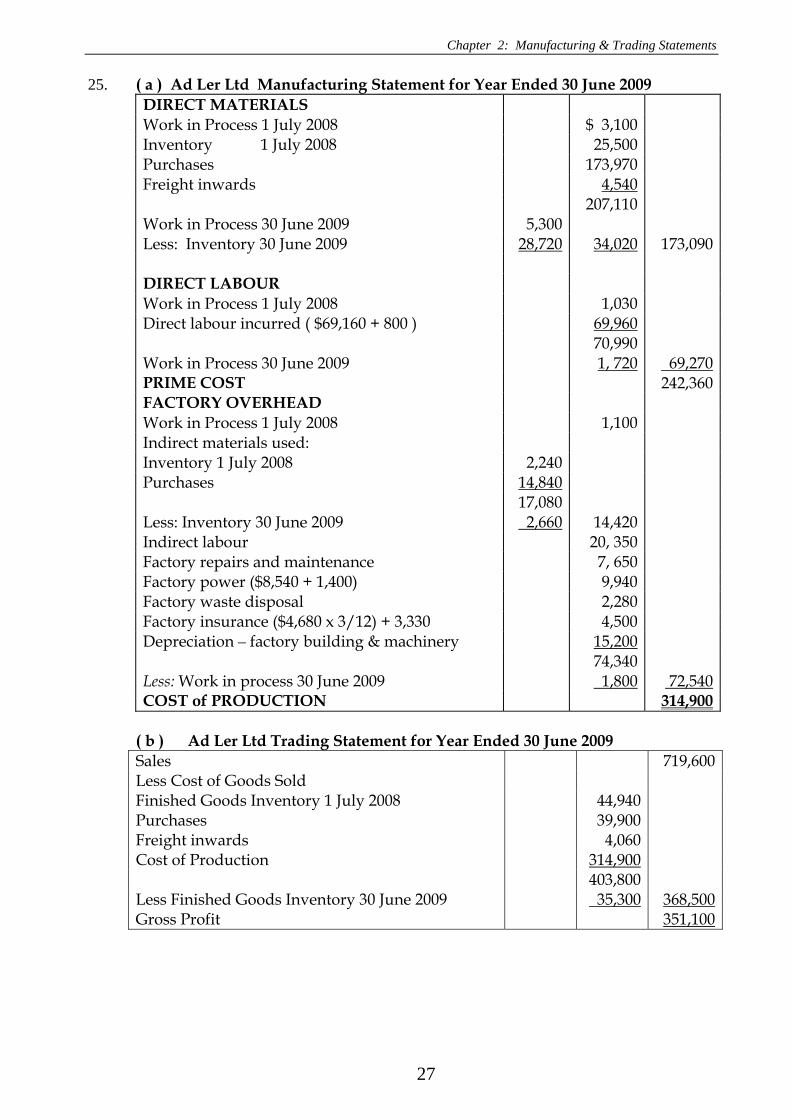
25. ( a ) Ad Ler Ltd Manufacturing Statement for Year Ended 30 June 2009 DIRECT MATERIALS Work in Process 1 July 2008 $ 3,100 Inventory 1 July 2008 25,500 Purchases 173,970 Freight inwards 4,540 207,110 Work in Process 30 June 2009 5,300 Less: Inventory 30 June 2009 28,720 34,020 173,090 DIRECT LABOUR Work in Process 1 July 2008 1,030 Direct labour incurred ( $69,160 + 800 ) 69,960 70,990 Work in Process 30 June 2009 1, 720 69,270 PRIME COST 242,360 FACTORY OVERHEAD Work in Process 1 July 2008 1,100 Indirect materials used: Inventory 1 July 2008 2,240 Purchases 14,840 17,080 Less: Inventory 30 June 2009 2,660 14,420 Indirect labour 20, 350 Factory repairs and maintenance 7, 650 Factory power ($8,540 + 1,400) 9,940 Factory waste disposal 2,280 Factory insurance ($4,680 x 3/12) + 3,330 4,500 Depreciation – factory building & machinery 15,200 74,340 Less: Work in process 30 June 2009 1,800 72,540 COST of PRODUCTION 314,900
( b ) Ad Ler Ltd Trading Statement for Year Ended 30 June 2009 Sales 719,600 Less Cost of Goods Sold Finished Goods Inventory 1 July 2008 44,940 Purchases 39,900 Freight inwards 4,060 Cost of Production 314,900 403,800 Less Finished Goods Inventory 30 June 2009 35,300 368,500 Gross Profit 351,100
Management Accounting in Australia - Solutions
28
Chapter 3: Cost-Volume-Profit Analysis Chapter Review Solutions
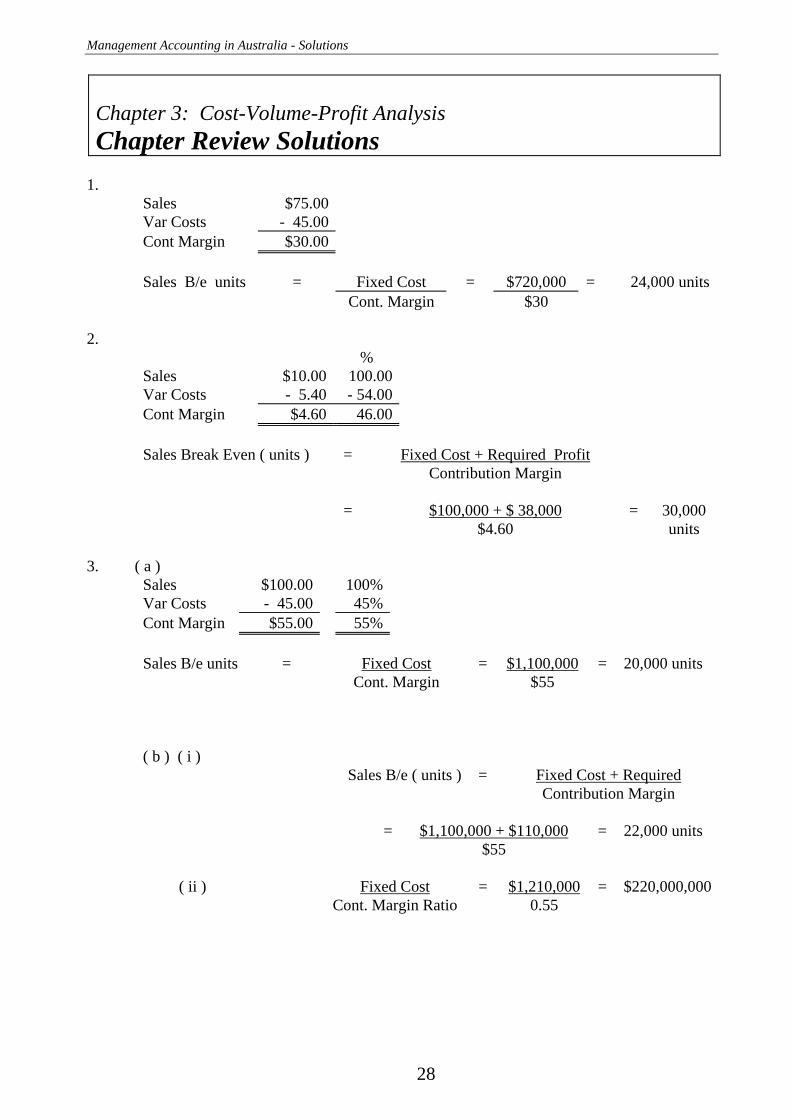
1.
Sales $75.00 Var Costs - 45.00 Cont Margin $30.00 Sales B/e units = Fixed Cost = $720,000 = 24,000 units Cont. Margin $30
2.
% Sales $10.00 100.00 Var Costs - 5.40 - 54.00 Cont Margin $4.60 46.00 Sales Break Even ( units ) = Fixed Cost + Required Profit Contribution Margin = $100,000 + $ 38,000 = 30,000 $4.60 units
3. ( a )
Sales $100.00 100% Var Costs - 45.00 45% Cont Margin $55.00 55% Sales B/e units = Fixed Cost = $1,100,000 = 20,000 units Cont. Margin $55 ( b ) ( i )
Sales B/e ( units ) = Fixed Cost + Required Contribution Margin
= $1,100,000 + $110,000 = 22,000 units
$55
( ii ) Fixed Cost = $1,210,000 = $220,000,000 Cont. Margin Ratio 0.55
Chapter 3: Cost-Volume-Profit Analysis
29
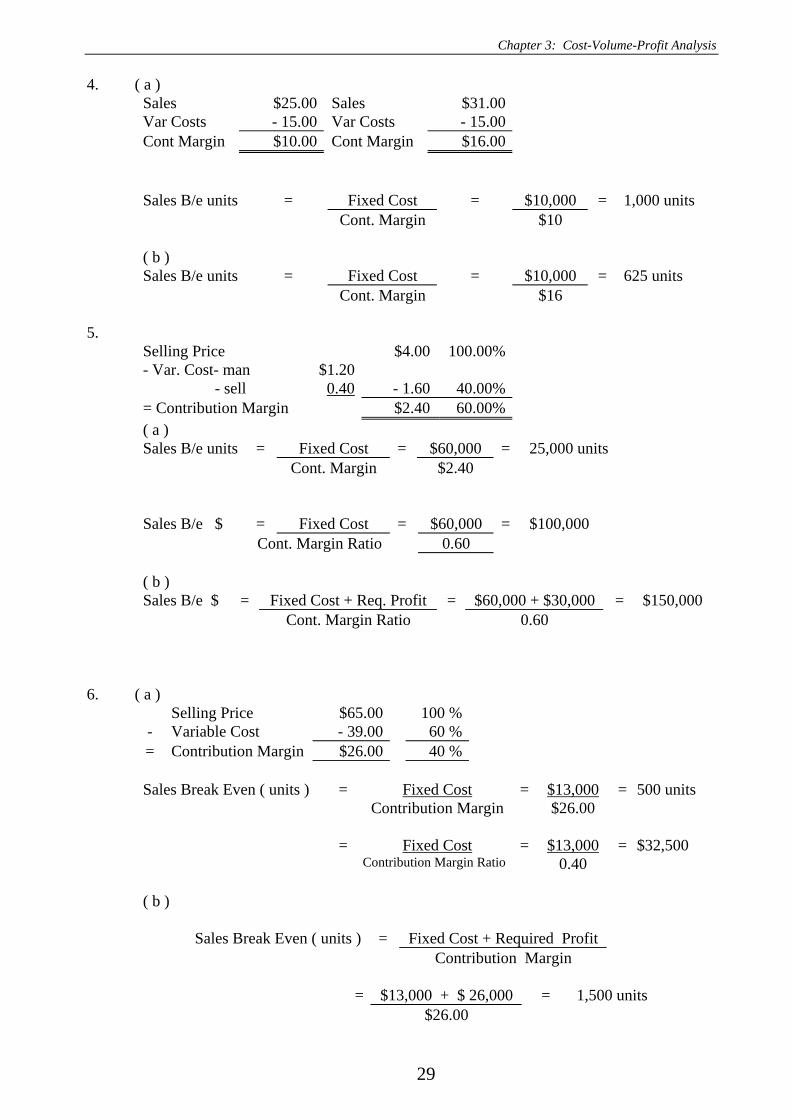
4. ( a ) Sales $25.00 Sales $31.00 Var Costs - 15.00 Var Costs - 15.00 Cont Margin $10.00 Cont Margin $16.00 Sales B/e units = Fixed Cost = $10,000 = 1,000 units Cont. Margin $10 ( b ) Sales B/e units = Fixed Cost = $10,000 = 625 units Cont. Margin $16
5.
Selling Price $4.00 100.00% - Var. Cost- man $1.20 - sell 0.40 - 1.60 40.00% = Contribution Margin $2.40 60.00% ( a ) Sales B/e units = Fixed Cost = $60,000 = 25,000 units Cont. Margin $2.40 Sales B/e $ = Fixed Cost = $60,000 = $100,000 Cont. Margin Ratio 0.60 ( b ) Sales B/e $ = Fixed Cost + Req. Profit = $60,000 + $30,000 = $150,000 Cont. Margin Ratio 0.60
6. ( a ) Selling Price $65.00 100 % - Variable Cost - 39.00 60 % = Contribution Margin $26.00 40 %
Sales Break Even ( units ) = Fixed Cost = $13,000 = 500 units Contribution Margin $26.00 = Fixed Cost = $13,000 = $32,500 Contribution Margin Ratio 0.40 ( b ) Sales Break Even ( units ) = Fixed Cost + Required Profit Contribution Margin
= $13,000 + $ 26,000 = 1,500 units $26.00
Management Accounting in Australia - Solutions
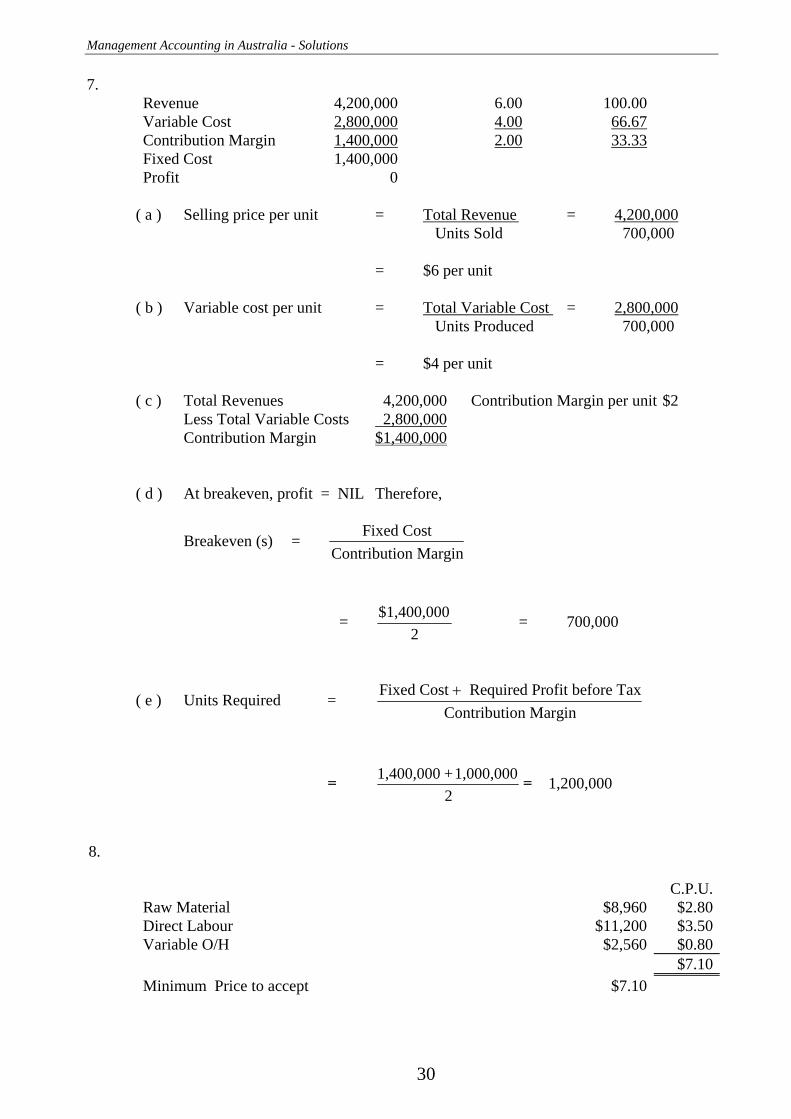
7. Revenue 4,200,000 6.00 100.00 Variable Cost 2,800,000 4.00 66.67 Contribution Margin 1,400,000 2.00 33.33 Fixed Cost 1,400,000 Profit 0
( a ) Selling price per unit = Total Revenue = 4,200,000 Units Sold 700,000 = $6 per unit ( b ) Variable cost per unit = Total Variable Cost = 2,800,000 Units Produced 700,000 = $4 per unit ( c ) Total Revenues 4,200,000 Contribution Margin per unit $2 Less Total Variable Costs 2,800,000 Contribution Margin $1,400,000 ( d ) At breakeven, profit = NIL Therefore,
Breakeven (s) = Fixed CostContribution Margin
= 2
$1,400,000 = 700,000
( e ) Units Required = Fixed Cost Required Profit before TaxContribution Margin+
= 2
1,000,000 + 1,400,000 = 1,200,000
8.
C.P.U.Raw Material $8,960 $2.80Direct Labour $11,200 $3.50Variable O/H $2,560 $0.80 $7.10Minimum Price to accept $7.10
30
Chapter 3: Cost-Volume-Profit Analysis
31
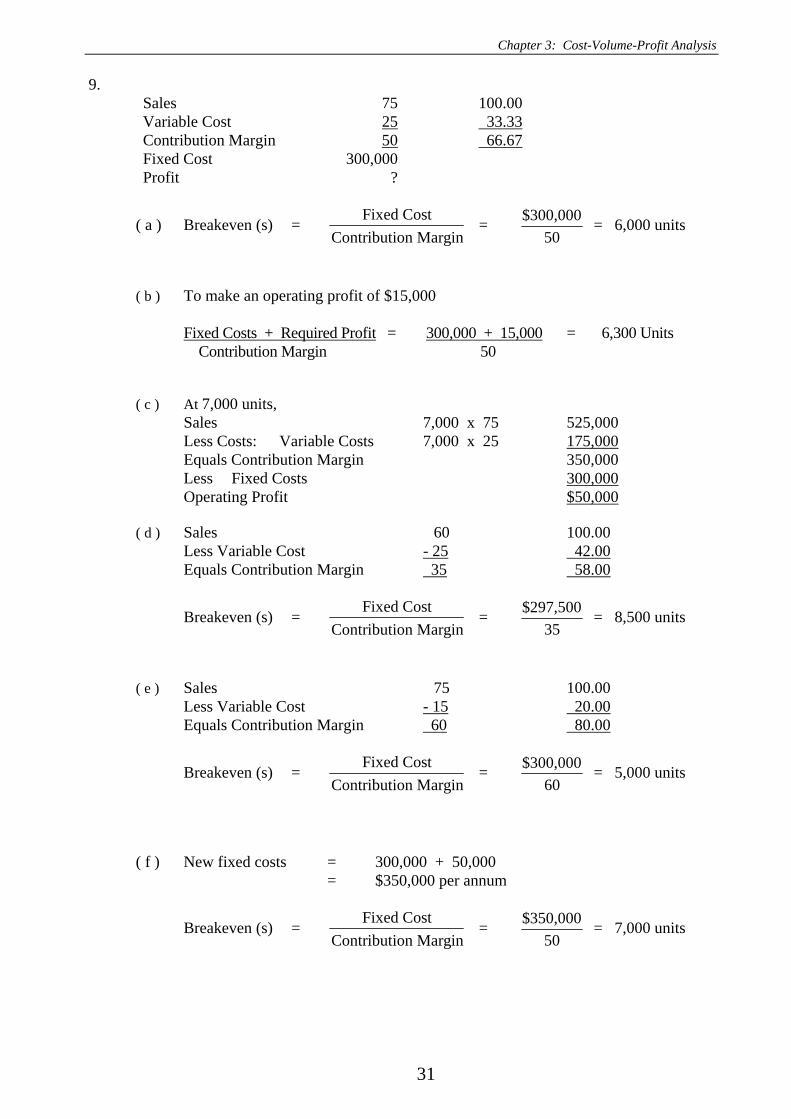
9. Sales 75 100.00 Variable Cost 25 33.33 Contribution Margin 50 66.67 Fixed Cost 300,000 Profit ?
( a ) Breakeven (s) = Fixed CostContribution Margin
= 50
$300,000 = 6,000 units
( b ) To make an operating profit of $15,000 Fixed Costs + Required Profit = 300,000 + 15,000 = 6,300 Units
Contribution Margin 50 ( c ) At 7,000 units,
Sales 7,000 x 75 525,000 Less Costs: Variable Costs 7,000 x 25 175,000 Equals Contribution Margin 350,000
Less Fixed Costs 300,000 Operating Profit $50,000
( d ) Sales 60 100.00
Less Variable Cost - 25 42.00 Equals Contribution Margin 35 58.00
Breakeven (s) = Fixed CostContribution Margin
= 35
$297,500 = 8,500 units
( e ) Sales 75 100.00
Less Variable Cost - 15 20.00 Equals Contribution Margin 60 80.00
Breakeven (s) = Fixed CostContribution Margin
= 60
$300,000 = 5,000 units
( f ) New fixed costs = 300,000 + 50,000 = $350,000 per annum
Breakeven (s) = Fixed CostContribution Margin
= 50
$350,000 = 7,000 units
Management Accounting in Australia - Solutions
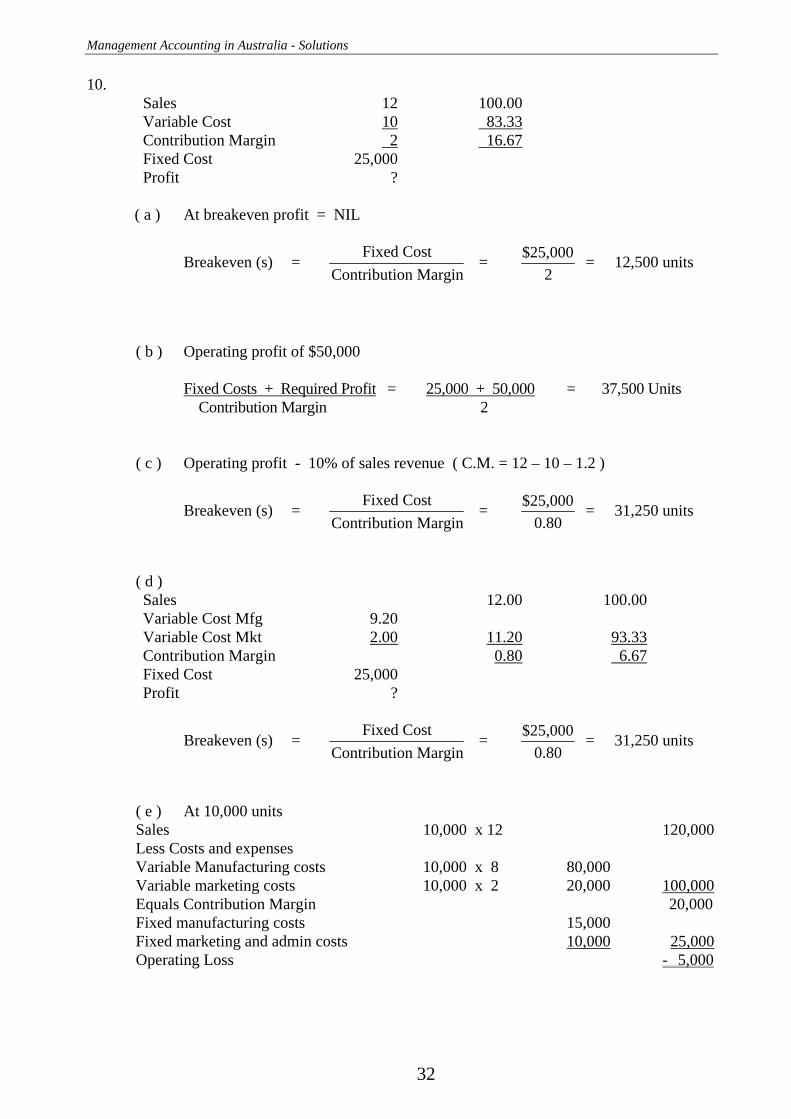
10. Sales 12 100.00 Variable Cost 10 83.33 Contribution Margin 2 16.67 Fixed Cost 25,000 Profit ?
( a ) At breakeven profit = NIL
Breakeven (s) = Fixed CostContribution Margin
= 2
$25,000 = 12,500 units
( b ) Operating profit of $50,000 Fixed Costs + Required Profit = 25,000 + 50,000 = 37,500 Units
Contribution Margin 2 ( c ) Operating profit - 10% of sales revenue ( C.M. = 12 – 10 – 1.2 )
Breakeven (s) = Fixed CostContribution Margin
= 0.80
$25,000 = 31,250 units
( d ) Sales 12.00 100.00 Variable Cost Mfg 9.20 Variable Cost Mkt 2.00 11.20 93.33 Contribution Margin 0.80 6.67 Fixed Cost 25,000 Profit ?
Breakeven (s) = Fixed CostContribution Margin
= 0.80
$25,000 = 31,250 units
( e ) At 10,000 units Sales 10,000 x 12 120,000 Less Costs and expenses Variable Manufacturing costs 10,000 x 8 80,000 Variable marketing costs 10,000 x 2 20,000 100,000 Equals Contribution Margin 20,000 Fixed manufacturing costs 15,000 Fixed marketing and admin costs 10,000 25,000 Operating Loss - 5,000
32
Chapter 3: Cost-Volume-Profit Analysis
33
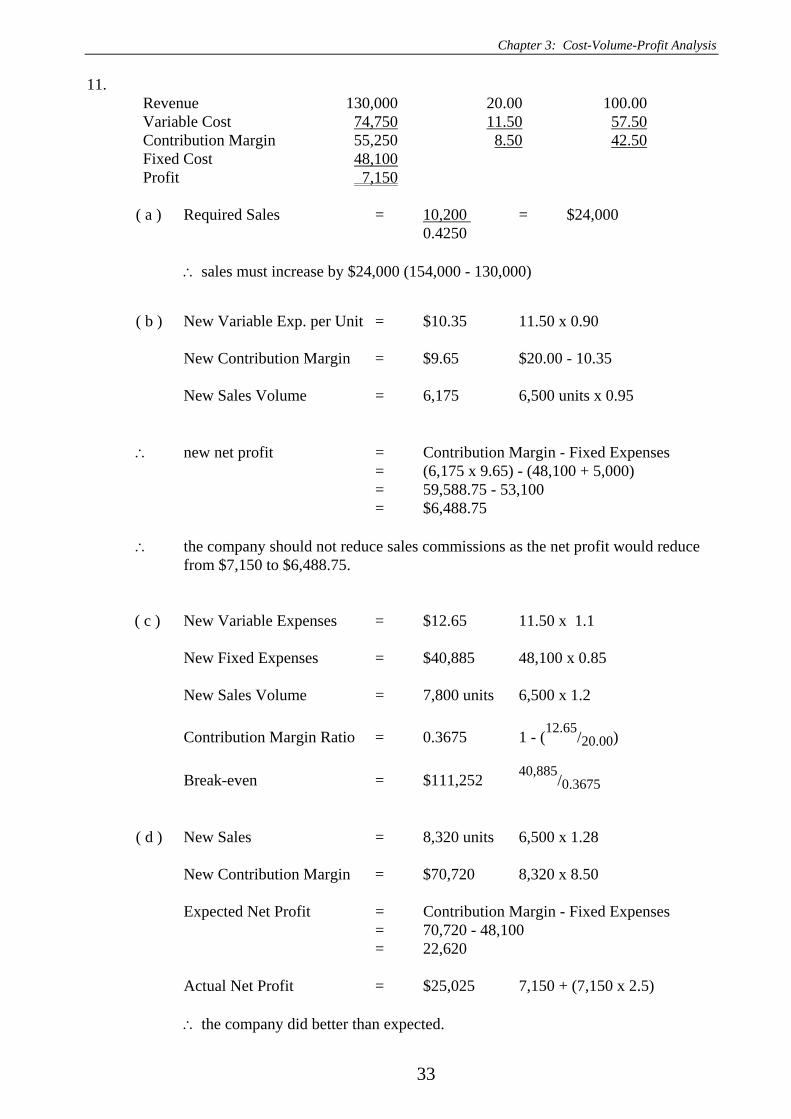
11. Revenue 130,000 20.00 100.00 Variable Cost 74,750 11.50 57.50 Contribution Margin 55,250 8.50 42.50 Fixed Cost 48,100 Profit 7,150
( a ) Required Sales = 10,200 = $24,000
0.4250
∴ sales must increase by $24,000 (154,000 - 130,000)
( b ) New Variable Exp. per Unit = $10.35 11.50 x 0.90 New Contribution Margin = $9.65 $20.00 - 10.35 New Sales Volume = 6,175 6,500 units x 0.95 ∴ new net profit = Contribution Margin - Fixed Expenses = (6,175 x 9.65) - (48,100 + 5,000) = 59,588.75 - 53,100 = $6,488.75 ∴ the company should not reduce sales commissions as the net profit would reduce
from $7,150 to $6,488.75. ( c ) New Variable Expenses = $12.65 11.50 x 1.1
New Fixed Expenses = $40,885 48,100 x 0.85 New Sales Volume = 7,800 units 6,500 x 1.2 Contribution Margin Ratio = 0.3675 1 - (12.65/20.00) Break-even = $111,252 40,885/0.3675 ( d ) New Sales = 8,320 units 6,500 x 1.28 New Contribution Margin = $70,720 8,320 x 8.50 Expected Net Profit = Contribution Margin - Fixed Expenses = 70,720 - 48,100 = 22,620 Actual Net Profit = $25,025 7,150 + (7,150 x 2.5) ∴ the company did better than expected.

Management Accounting in Australia - Solutions
12. Sales 600 100.00 Variable Cost 420 70.00 Contribution Margin 180 30.00 Fixed Cost 360,000 Profit ?
( a ) Breakeven Sales (units) = Fixed CostsContribution Margin
= 360,000180
= 2,000 units
Breakeven Sales ($) = Fixed CostsContribution Margin Ratio
= 0.30
360,000 = $1,200,000
( b ) Contribution Margin (1,800 machines x $180) $324,000 less: Fixed Costs 360,000 Net Less - 36,000 ( c ) Workings: Selling Price/unit = $600 Variable Cost/unit 425 Contribution Margin $175
Breakeven Sales (units) = 360,000175
= 2,057 units
2,057 units x $600 = $1,234,200
( d ) Sales (units) = Fixed Costs + Desired ProfitContribution Margin
= 180
180,000 + 360,000 = 180
540,000 = 3,000 units
( e ) 1. All costs can be classified into fixed and variable costs. 2. All costs are linear in the relevant range, i.e., variable basis change in total with a change in volume and fixed costs in total remain constant. 3. Selling price will not charge over the range of sales activity. 4. Cost efficiencies remain the same for each product.
34

Chapter 3: Cost-Volume-Profit Analysis
35
13. ( a ) $ per unit % Selling Price 576,000 8.00 100.00 Less Variable costs 216,000 3.00 37.50 Contribution margin per unit 360,000 5.00 62.50 Less Fixed Costs 200,000 Equals Profit 160,000
( b )
Break-even point ( units ) = $200,000 = 40,000 units $5.00
Break-even point ( $ ) = $200,000 = $320,000 0.625
( c )
Sales req for profit = $200,000 + $320,000 = 104,000 unitsof $320,000 $5.00
( d )
Margin of Safety = 576,000 – 320,000 = $256,000
( e )
$ per unit % Selling Price 8.00 100.00 Less Variable costs 2.00 25.00 Contribution margin per unit 6.00 75.00 ( i ) Sales B/even = $250,000 = 62,500 units $4.00
( f )
Selling Price 100.00Less Variable costs 37.50 Variable selling costs 12.50Contribution margin per unit 50.00
Break-even point ( $ ) = $200,000 = $400,000 0.5

Management Accounting in Australia - Solutions
36
14. Sales 40 100.00 Variable Cost 15 37.50 Contribution Margin 25 62.50 Fixed Cost 45,000 Profit ?
( a ) Fixed Costs . = $ 45,000 = 1,800 Units Contribution Margin $25.00 ( b ) Fixed Costs + Required Profit = $ 125,000 = 5,000 Units Contribution Margin $25.00 ( c ) Fixed Costs + Required Profit = $ 137,500 = 5,500 Units Contribution Margin $25.00 ( $64,750 / 0.7 ) = $92,500 ( d ) Sales ( 4,400 x $40.00 ) $176,000
Less Variable Costs ( 4,400 x $15.00 ) 66,000- Equals Contribution Margin 110,000
Less Fixed Costs - 45,000 Equals Profit $ 65,000
( e ) Sales ( 4,000 x $44.00 ) $176,000
Less Variable Costs ( 4,000 x $15.00 ) 60,000- Equals Contribution Margin 116,000
Less Fixed Costs - 45,000 Equals Profit $ 71,000
Chapter 3: Cost-Volume-Profit Analysis
37
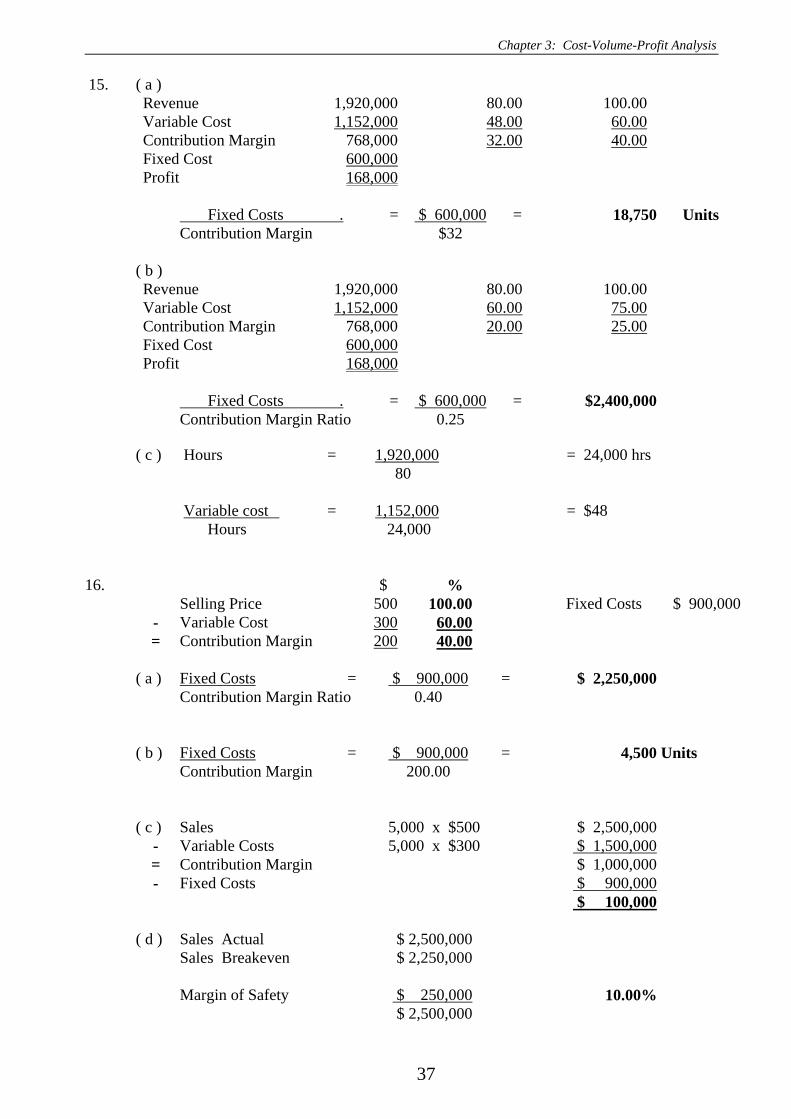
15. ( a ) Revenue 1,920,000 80.00 100.00 Variable Cost 1,152,000 48.00 60.00 Contribution Margin 768,000 32.00 40.00 Fixed Cost 600,000 Profit 168,000
Fixed Costs . = $ 600,000 = 18,750 Units Contribution Margin $32 ( b ) Revenue 1,920,000 80.00 100.00 Variable Cost 1,152,000 60.00 75.00 Contribution Margin 768,000 20.00 25.00 Fixed Cost 600,000 Profit 168,000
Fixed Costs . = $ 600,000 = $2,400,000 Contribution Margin Ratio 0.25 ( c ) Hours = 1,920,000 = 24,000 hrs
80 Variable cost = 1,152,000 = $48 Hours 24,000
16. $ % Selling Price 500 100.00 Fixed Costs $ 900,000
- Variable Cost 300 60.00 = Contribution Margin 200 40.00
( a ) Fixed Costs = $ 900,000 = $ 2,250,000
Contribution Margin Ratio 0.40
( b ) Fixed Costs = $ 900,000 = 4,500 Units Contribution Margin 200.00
( c ) Sales 5,000 x $500 $ 2,500,000 - Variable Costs 5,000 x $300 $ 1,500,000 = Contribution Margin $ 1,000,000 - Fixed Costs $ 900,000 $ 100,000
( d ) Sales Actual $ 2,500,000 Sales Breakeven $ 2,250,000 Margin of Safety $ 250,000 10.00% $ 2,500,000
Management Accounting in Australia - Solutions
38
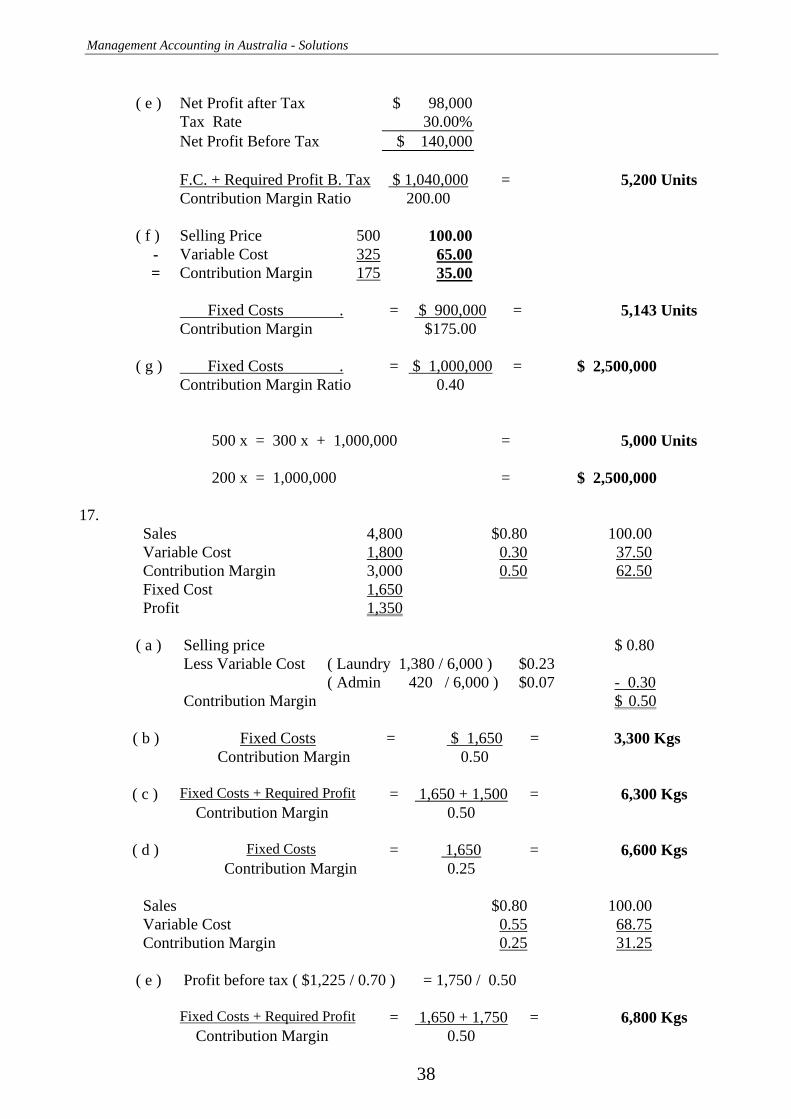
( e ) Net Profit after Tax $ 98,000
Tax Rate 30.00% Net Profit Before Tax $ 140,000 F.C. + Required Profit B. Tax $ 1,040,000 = 5,200 Units Contribution Margin Ratio 200.00
( f ) Selling Price 500 100.00
- Variable Cost 325 65.00 = Contribution Margin 175 35.00
Fixed Costs . = $ 900,000 = 5,143 Units Contribution Margin $175.00 ( g ) Fixed Costs . = $ 1,000,000 = $ 2,500,000 Contribution Margin Ratio 0.40
500 x = 300 x + 1,000,000 = 5,000 Units 200 x = 1,000,000 = $ 2,500,000
17.
Sales 4,800 $0.80 100.00 Variable Cost 1,800 0.30 37.50 Contribution Margin 3,000 0.50 62.50 Fixed Cost 1,650 Profit 1,350
( a ) Selling price $ 0.80
Less Variable Cost ( Laundry 1,380 / 6,000 ) $0.23 ( Admin 420 / 6,000 ) $0.07 - 0.30 Contribution Margin $ 0.50 ( b ) Fixed Costs = $ 1,650 = 3,300 Kgs
Contribution Margin 0.50
( c ) Fixed Costs + Required Profit = 1,650 + 1,500 = 6,300 Kgs Contribution Margin 0.50 ( d ) Fixed Costs = 1,650 = 6,600 Kgs Contribution Margin 0.25
Sales $0.80 100.00 Variable Cost 0.55 68.75 Contribution Margin 0.25 31.25
( e ) Profit before tax ( $1,225 / 0.70 ) = 1,750 / 0.50
Fixed Costs + Required Profit = 1,650 + 1,750 = 6,800 Kgs Contribution Margin 0.50

Chapter 3: Cost-Volume-Profit Analysis
39
18. Total C.P.U. % Sales 500,000 5.00 100 Less Variable costs 300,000 3.00 60 Contribution margin 200,000 2.00 40 Fixed Costs 60,000 Gross Profit 140,000
( a )
Break-even point ( Q ) = 60,000 / 2.00 = 30,000 units Break-even point ( $ ) = 60,000 / 0.40 = $150,000
( b )
Margin of Safety = 100,000 – 30,000 x 100 = 70.00% 100,000
( c )
Sales req for profit = 60,000 + 90,000 = $ 375,000 of $90,000 before tax ( 0.40 )
( d )
Sales req for profit = 60,000 + 60,000 = $ 300,000 of $42,000 after tax ( 0.40 )
( e )
Sales req for add = 100,000 + 60,000 = $ 400,000 fixed costs $40,000 ( 0.40 )
Management Accounting in Australia - Solutions
40
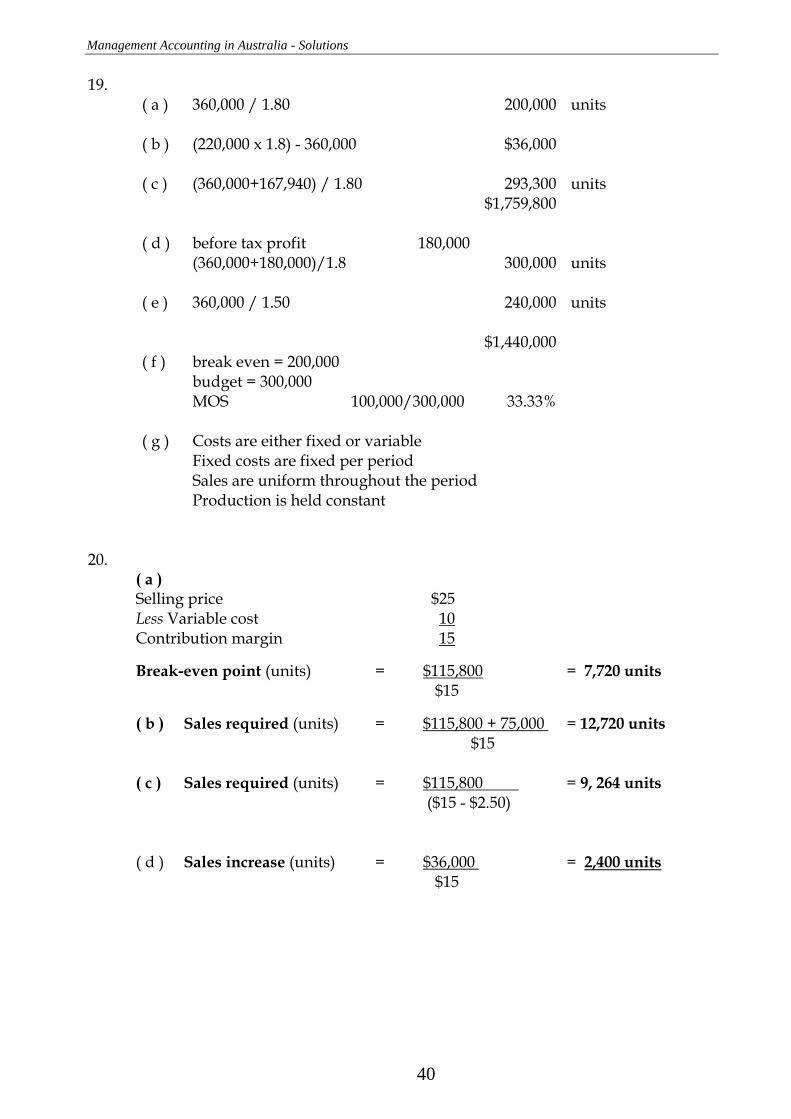
19. ( a ) 360,000 / 1.80 200,000 units ( b ) (220,000 x 1.8) - 360,000 $36,000 ( c ) (360,000+167,940) / 1.80 293,300 units $1,759,800 ( d ) before tax profit 180,000 (360,000+180,000)/1.8 300,000 units ( e ) 360,000 / 1.50 240,000 units $1,440,000 ( f ) break even = 200,000 budget = 300,000 MOS 100,000/300,000 33.33% ( g ) Costs are either fixed or variable Fixed costs are fixed per period Sales are uniform throughout the period Production is held constant
20.
( a ) Selling price $25 Less Variable cost 10 Contribution margin 15
Break-even point (units) = $115,800 = 7,720 units $15
( b ) Sales required (units) = $115,800 + 75,000 = 12,720 units $15 ( c ) Sales required (units) = $115,800 = 9, 264 units ($15 - $2.50) ( d ) Sales increase (units) = $36,000 = 2,400 units $15

Chapter 3: Cost-Volume-Profit Analysis
41
21 % Selling Price 16.00 100.00 Variable Cost 8.00 50.00 Contribution Margin 8.00 50.00
( a ) Break-even point (units) = $55,000 = 6,875 units $8
Break-even point ( $ ) = $55,000 = $110,000 0.50 ( b ) Profit before tax $28,000 Sales required (units) = $55,000 + $28,000 = 10, 375 units $8
( c ) Profit after tax $31,500 Sales required (units) = $55,000 + $45,000 = 12, 500 units $8
( d ) Margin on Safety = 12,900 - 6,875 = 6,025 units
= 6,025 x $16 = $96,400
Management Accounting in Australia - Solutions
42
Chapter 4: The Cost Accounting Cycle
Chapter Review Solutions
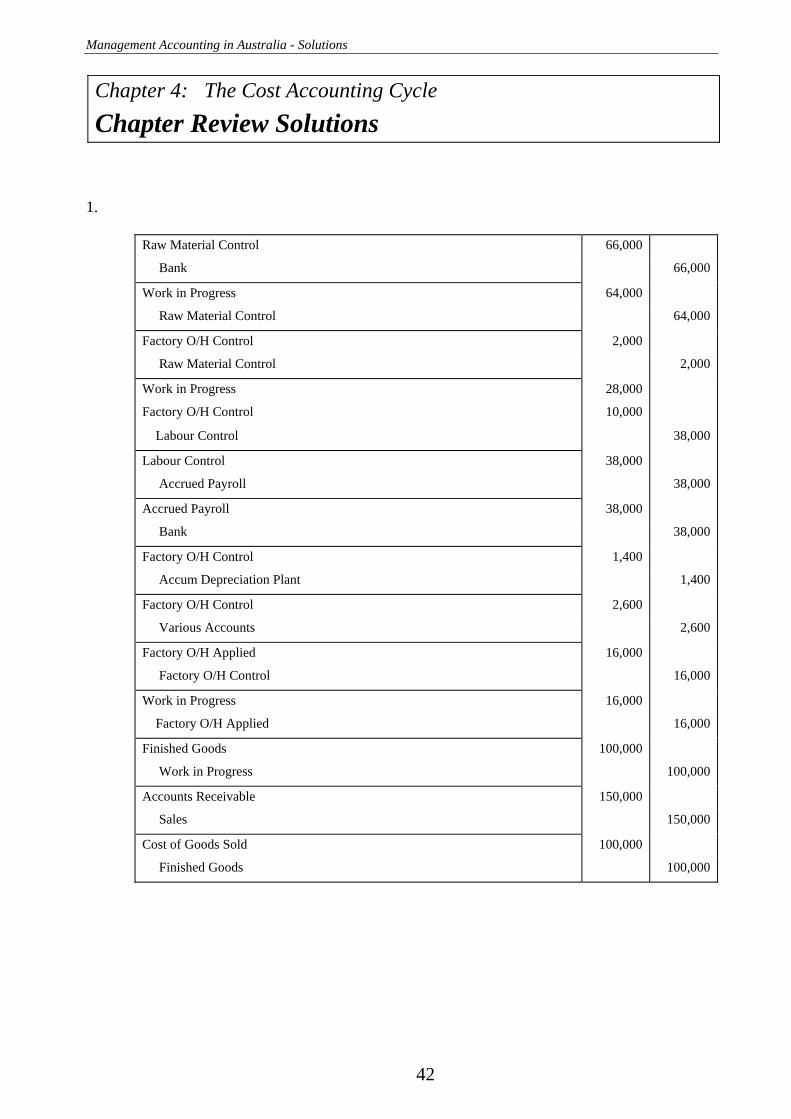
1.
Raw Material Control 66,000
Bank 66,000
Work in Progress 64,000
Raw Material Control 64,000
Factory O/H Control 2,000
Raw Material Control 2,000
Work in Progress 28,000
Factory O/H Control 10,000
Labour Control 38,000
Labour Control 38,000
Accrued Payroll 38,000
Accrued Payroll 38,000
Bank 38,000
Factory O/H Control 1,400
Accum Depreciation Plant 1,400
Factory O/H Control 2,600
Various Accounts 2,600
Factory O/H Applied 16,000
Factory O/H Control 16,000
Work in Progress 16,000
Factory O/H Applied 16,000
Finished Goods 100,000
Work in Progress 100,000
Accounts Receivable 150,000
Sales 150,000
Cost of Goods Sold 100,000
Finished Goods 100,000
Chapter 4: The Cost Accounting Cycle
43
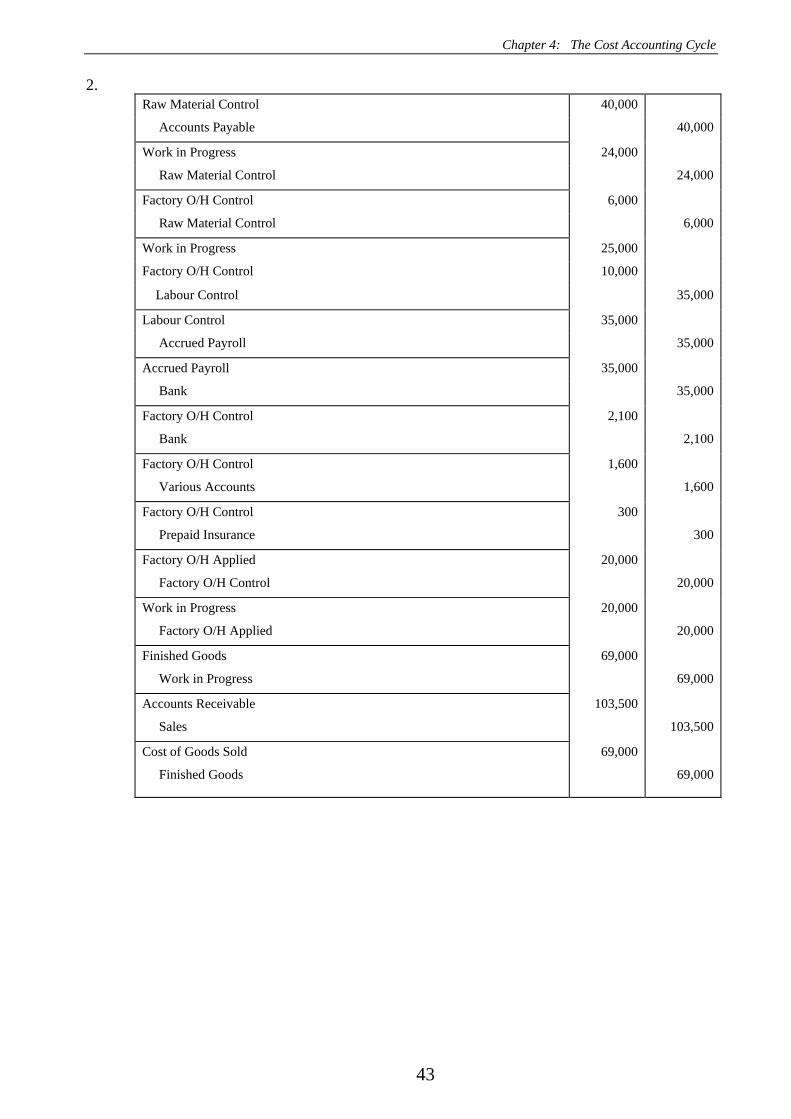
2. Raw Material Control 40,000
Accounts Payable 40,000
Work in Progress 24,000
Raw Material Control 24,000
Factory O/H Control 6,000
Raw Material Control 6,000
Work in Progress 25,000
Factory O/H Control 10,000
Labour Control 35,000
Labour Control 35,000
Accrued Payroll 35,000
Accrued Payroll 35,000
Bank 35,000
Factory O/H Control 2,100
Bank 2,100
Factory O/H Control 1,600
Various Accounts 1,600
Factory O/H Control 300
Prepaid Insurance 300
Factory O/H Applied 20,000
Factory O/H Control 20,000
Work in Progress 20,000
Factory O/H Applied 20,000
Finished Goods 69,000
Work in Progress 69,000
Accounts Receivable 103,500
Sales 103,500
Cost of Goods Sold 69,000
Finished Goods 69,000

Management Accounting in Australia - Solutions
44
3.
Raw Material Control 20,000
A/c Payable 20,000
Work in Progress 15,000
Factory O/H Control 2,000
Raw Material Control 17,000
Work in Progress 17,000
Factory O/H Control 2,000
Labour Control 19,000
Labour Control 19,000
PAYG Tax Withheld 3,000
Accrued Payroll 16,000
Accrued Payroll 16,000
Bank 16,000
Factory O/H Control 8,500
Bank ( Rent Paid ) 8,500
Factory O/H Control 7,500
Accumulated Depreciation Plant 7,500
Factory O/H Applied 20,000
Factory O/H Control 20,000
Work in Progress 20,000
Factory O/H Applied 20,000
Finished Goods 32,000
Work in Progress 32,000
Accounts Receivable 29,000
Sales 29,000
Cost of Goods Sold 22,000
Finished Goods 22,000
Chapter 4: The Cost Accounting Cycle
45
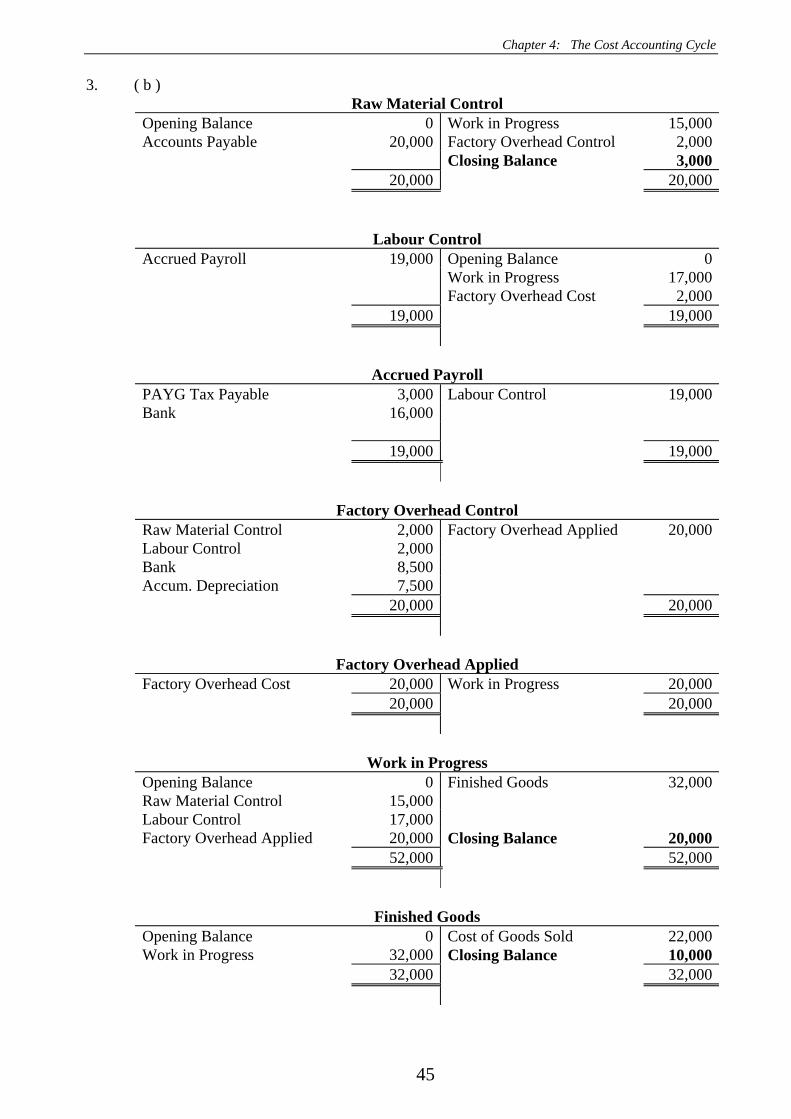
3. ( b ) Raw Material Control
Opening Balance 0 Work in Progress 15,000Accounts Payable 20,000 Factory Overhead Control 2,000 Closing Balance 3,000 20,000 20,000
Labour Control Accrued Payroll 19,000 Opening Balance 0 Work in Progress 17,000 Factory Overhead Cost 2,000 19,000 19,000
Accrued Payroll PAYG Tax Payable 3,000 Labour Control 19,000Bank 16,000 19,000 19,000
Factory Overhead Control Raw Material Control 2,000 Factory Overhead Applied 20,000Labour Control 2,000 Bank 8,500 Accum. Depreciation 7,500 20,000 20,000
Factory Overhead Applied Factory Overhead Cost 20,000 Work in Progress 20,000 20,000 20,000
Work in Progress Opening Balance 0 Finished Goods 32,000Raw Material Control 15,000 Labour Control 17,000 Factory Overhead Applied 20,000 Closing Balance 20,000 52,000 52,000
Finished Goods Opening Balance 0 Cost of Goods Sold 22,000Work in Progress 32,000 Closing Balance 10,000 32,000 32,000

Management Accounting in Australia - Solutions
46
4. Raw Material Control 60,000 Accounts Payable 60,000Work in Progress 44,000 Factory O/H Control 16,000 Raw Material Control 60,000Work in Progress 26,000 Factory O/H Control 4,000 Labour Control 30,000Labour Control 30,000 Taxation Withheld 10,000 Accrued Payroll 20,000Accrued Payroll 20,000 Bank 20,000Factory O/H Control 10,000 Accum. Depreciation 10,000Factory O/H Applied 30,000 Factory O/H Control 30,000Work in Progress 30,000 Factory O/H Applied 30,000Finished Goods 90,000 Work in Progress 90,000Cost of Goods Sold 50,000 Finished Goods 50,000Accounts Receivable 75,000 Sales 75,000

Chapter 4: The Cost Accounting Cycle
47
5. Raw Material Control 50,000 Accounts Payable 50,000Work in Progress 32,000 Factory O/H Control 10,000 Raw Material Control 42,000Accounts Payable 2,000 Raw Material Control 2,000Work in Progress 40,000 Factory O/H Control 10,000 Labour Control 50,000Labour Control 50,000 Taxation Withheld 15,000 Accrued Payroll 35,000Accrued Payroll 35,000 Bank 35,000Factory O/H Control 20,000 Accum. Depreciation 20,000Factory O/H Applied 40,000 Factory O/H Control 40,000Work in Progress 40,000 Factory O/H Applied 40,000Finished Goods 80,000 Work in Progress 80,000Cost of Goods Sold 80,000 Finished Goods 80,000Accounts Receivable 160,000 Sales 160,000
Management Accounting in Australia - Solutions
48
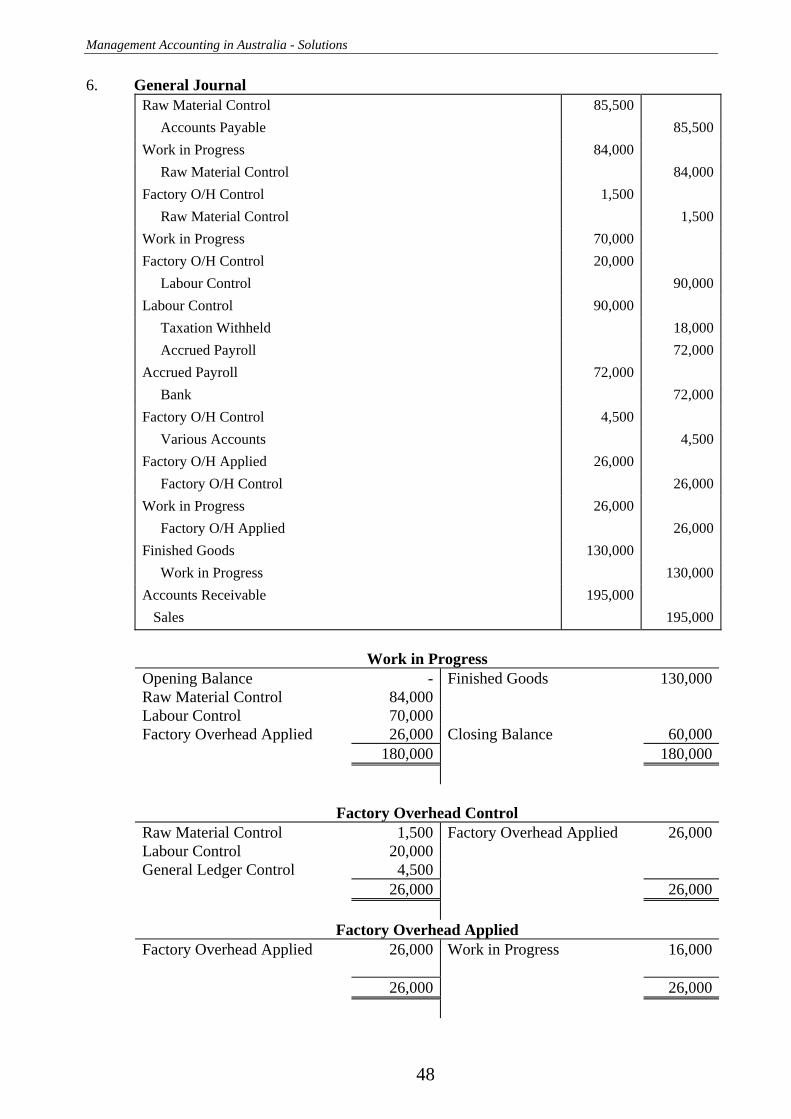
6. General Journal Raw Material Control 85,500 Accounts Payable 85,500Work in Progress 84,000 Raw Material Control 84,000Factory O/H Control 1,500 Raw Material Control 1,500Work in Progress 70,000 Factory O/H Control 20,000 Labour Control 90,000Labour Control 90,000 Taxation Withheld 18,000 Accrued Payroll 72,000Accrued Payroll 72,000 Bank 72,000Factory O/H Control 4,500 Various Accounts 4,500Factory O/H Applied 26,000 Factory O/H Control 26,000Work in Progress 26,000 Factory O/H Applied 26,000Finished Goods 130,000 Work in Progress 130,000Accounts Receivable 195,000 Sales 195,000
Work in Progress
Opening Balance - Finished Goods 130,000Raw Material Control 84,000 Labour Control 70,000 Factory Overhead Applied 26,000 Closing Balance 60,000 180,000 180,000
Factory Overhead Control Raw Material Control 1,500 Factory Overhead Applied 26,000Labour Control 20,000 General Ledger Control 4,500 26,000 26,000
Factory Overhead Applied Factory Overhead Applied 26,000 Work in Progress 16,000 26,000 26,000
Chapter 4: The Cost Accounting Cycle
49
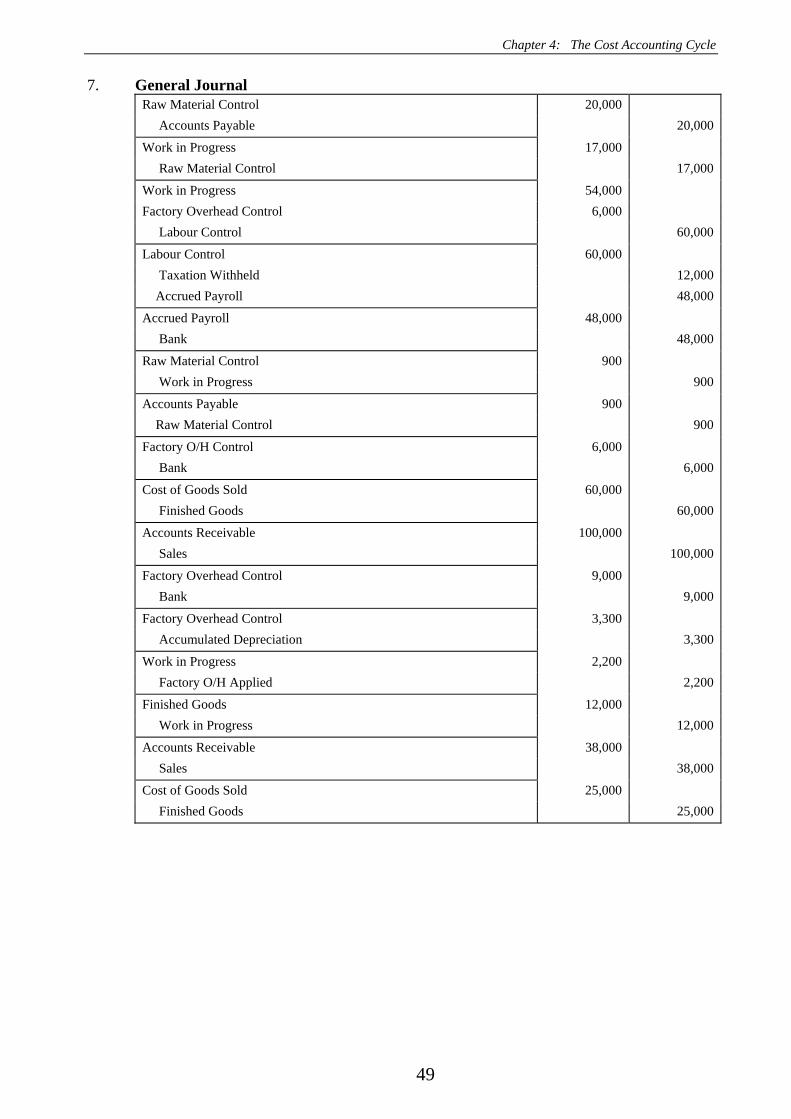
7. General Journal Raw Material Control 20,000 Accounts Payable 20,000
Work in Progress 17,000 Raw Material Control 17,000
Work in Progress 54,000 Factory Overhead Control 6,000 Labour Control 60,000
Labour Control 60,000 Taxation Withheld 12,000 Accrued Payroll 48,000
Accrued Payroll 48,000 Bank 48,000
Raw Material Control 900 Work in Progress 900
Accounts Payable 900 Raw Material Control 900
Factory O/H Control 6,000 Bank 6,000
Cost of Goods Sold 60,000 Finished Goods 60,000
Accounts Receivable 100,000 Sales 100,000
Factory Overhead Control 9,000 Bank 9,000
Factory Overhead Control 3,300 Accumulated Depreciation 3,300
Work in Progress 2,200 Factory O/H Applied 2,200
Finished Goods 12,000 Work in Progress 12,000
Accounts Receivable 38,000 Sales 38,000
Cost of Goods Sold 25,000 Finished Goods 25,000

Management Accounting in Australia - Solutions
50
8. General Journal Raw Material Control 44,000 Accounts Payable 44,000
Work in Progress 24,000 Raw Material Control 24,000
Factory O/H Control 16,000 Raw Material Control 16,000
Work in Progress 26,000 Factory O/H Control 4,000 Labour Control 30,000
Labour Control 30,000 Taxation Withheld 6,000 Accrued Payroll 24,000
Accrued Payroll 24,000 Bank 24,000
Factory O/H Control 5,000 Accum. Depreciation 5,000
Factory O/H Applied 25,000 Factory O/H Control 25,000
Work in Progress 25,000 Factory O/H Applied 25,000
Finished Goods 70,000 Work in Progress 70,000
Cost of Goods Sold 62,500 Finished Goods 62,500
Accounts Receivable 100,000 Sales 100,000
Raw Material Control
Opening Balance 8,000 Work in Progress 24,000 Accounts Payable 44,000 Factory Overhead Control 16,000 Closing Balance 12,000 52,000 52,000
Factory Overhead Control Raw Material Control 16,000 Factory Overhead Applied 25,000 Labour Control 4,000 Accumulated Depreciation 5,000 25,000 25,000
Factory Overhead Applied
Factory Overhead Control 25,000 Work In Progress 25,000 25,000 25,000
Work in Progress Opening Balance - Finished Goods 70,000 Raw Material Control 24,000 Labour Control 26,000 Factory Overhead Applied 25,000 Closing Balance 5,000 75,000 75,000
Finished Goods Opening Balance - Cost of Goods Sold 62,500 Finished Goods 70,000 Closing Balance 7,500 70,000 70,000
Chapter 4: The Cost Accounting Cycle
51
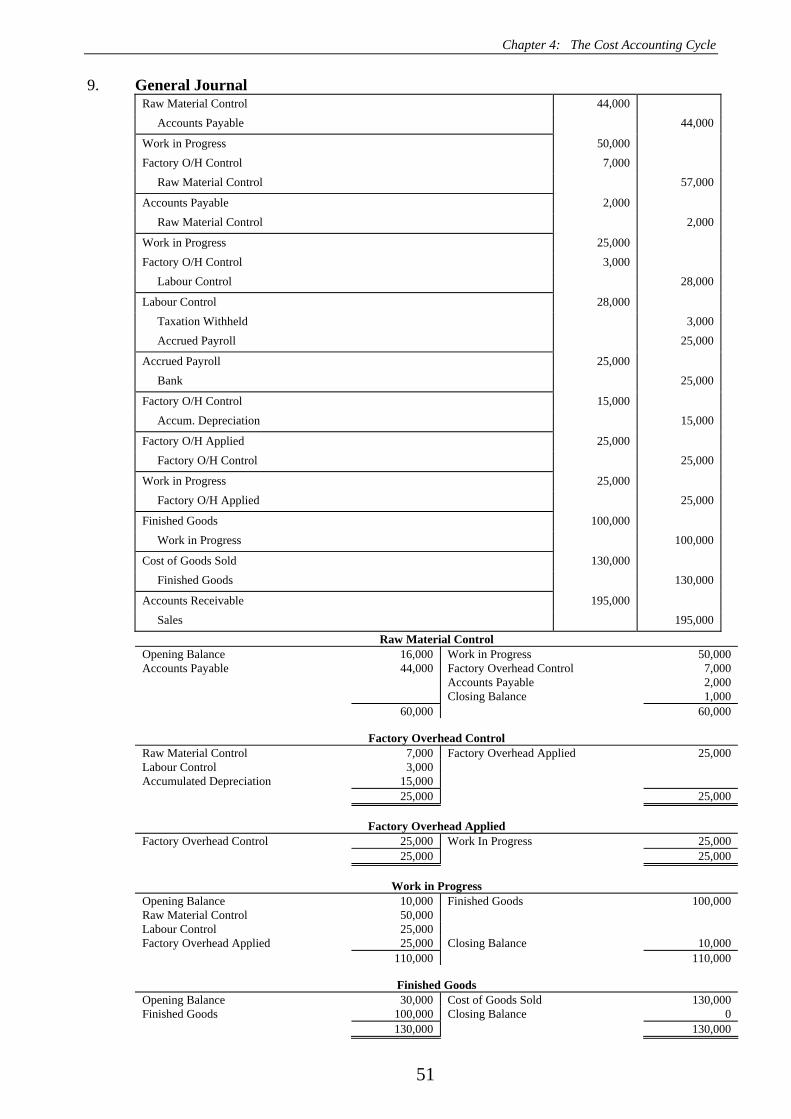
9. General Journal Raw Material Control 44,000 Accounts Payable 44,000
Work in Progress 50,000 Factory O/H Control 7,000 Raw Material Control 57,000
Accounts Payable 2,000 Raw Material Control 2,000
Work in Progress 25,000 Factory O/H Control 3,000 Labour Control 28,000
Labour Control 28,000 Taxation Withheld 3,000 Accrued Payroll 25,000
Accrued Payroll 25,000 Bank 25,000
Factory O/H Control 15,000 Accum. Depreciation 15,000
Factory O/H Applied 25,000 Factory O/H Control 25,000
Work in Progress 25,000 Factory O/H Applied 25,000
Finished Goods 100,000 Work in Progress 100,000
Cost of Goods Sold 130,000 Finished Goods 130,000
Accounts Receivable 195,000 Sales 195,000
Raw Material Control Opening Balance 16,000 Work in Progress 50,000 Accounts Payable 44,000 Factory Overhead Control 7,000 Accounts Payable 2,000 Closing Balance 1,000 60,000 60,000
Factory Overhead Control Raw Material Control 7,000 Factory Overhead Applied 25,000 Labour Control 3,000 Accumulated Depreciation 15,000 25,000 25,000
Factory Overhead Applied
Factory Overhead Control 25,000 Work In Progress 25,000 25,000 25,000
Work in Progress Opening Balance 10,000 Finished Goods 100,000 Raw Material Control 50,000 Labour Control 25,000 Factory Overhead Applied 25,000 Closing Balance 10,000 110,000 110,000
Finished Goods Opening Balance 30,000 Cost of Goods Sold 130,000 Finished Goods 100,000 Closing Balance 0 130,000 130,000
Management Accounting in Australia - Solutions
52
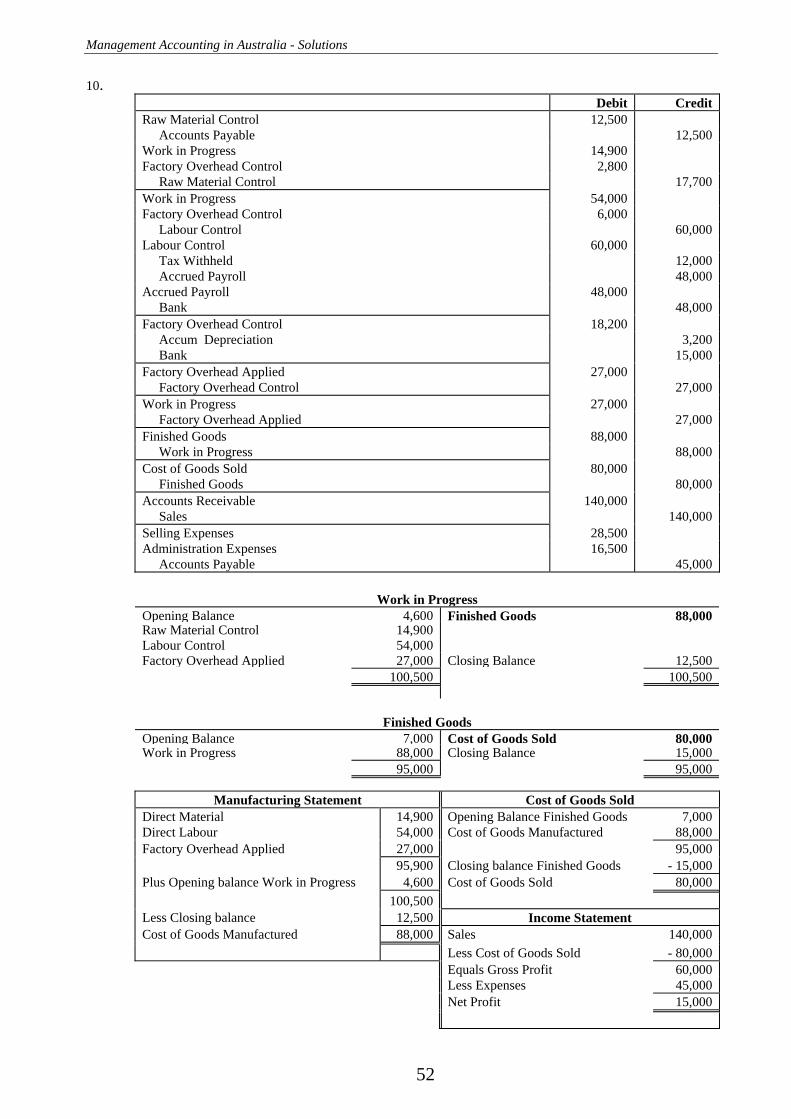
10. Debit Credit Raw Material Control 12,500 Accounts Payable 12,500 Work in Progress 14,900 Factory Overhead Control 2,800 Raw Material Control 17,700 Work in Progress 54,000 Factory Overhead Control 6,000 Labour Control 60,000 Labour Control 60,000 Tax Withheld 12,000 Accrued Payroll 48,000 Accrued Payroll 48,000 Bank 48,000 Factory Overhead Control 18,200 Accum Depreciation 3,200 Bank 15,000 Factory Overhead Applied 27,000 Factory Overhead Control 27,000 Work in Progress 27,000 Factory Overhead Applied 27,000 Finished Goods 88,000 Work in Progress 88,000 Cost of Goods Sold 80,000 Finished Goods 80,000 Accounts Receivable 140,000 Sales 140,000 Selling Expenses 28,500 Administration Expenses 16,500 Accounts Payable 45,000
Work in Progress
Opening Balance 4,600 Finished Goods 88,000Raw Material Control 14,900Labour Control 54,000Factory Overhead Applied 27,000 Closing Balance 12,500 100,500 100,500
Finished Goods
Opening Balance 7,000 Cost of Goods Sold 80,000Work in Progress 88,000 Closing Balance 15,000 95,000 95,000
Manufacturing Statement Cost of Goods Sold Direct Material 14,900 Opening Balance Finished Goods 7,000Direct Labour 54,000 Cost of Goods Manufactured 88,000Factory Overhead Applied 27,000 95,000 95,900 Closing balance Finished Goods - 15,000Plus Opening balance Work in Progress 4,600 Cost of Goods Sold 80,000 100,500 Less Closing balance 12,500 Income Statement Cost of Goods Manufactured 88,000 Sales 140,000 Less Cost of Goods Sold - 80,000 Equals Gross Profit 60,000 Less Expenses 45,000 Net Profit 15,000

Chapter 4: The Cost Accounting Cycle
53
11. Debit Credit Raw Material Control 25,000 Accounts Payable 25,000 Accounts Payable 5,000 Raw Material Control 5,000 Work in Progress 20,000 Factory Overhead Control 4,000 Raw Material Control 24,000 Work in Progress 35,000 Factory Overhead Control 11,000 Labour Control 46,000 Labour Control 46,000 Tax Withheld 16,100 Accrued Payroll 29,900 Accrued Payroll 29,900 Bank 29,900 Factory Overhead Control 7,500 Accumulated Depreciation 3,000 Prepaid Insurance 500 Bank 4,000 Factory Overhead Applied 22,500 Actual Factory Overhead Control 22,500 Work in Progress 21,000 Applied Factory Overhead Applied 21,000 Cost of Goods Sold 1,500 Factory Overhead Applied 1,500 Finished Goods 80,000 Work in Progress 80,000 Cost of Goods Sold 84,000 Finished Goods 84,000 Accounts Receivable 151,200 Sales 151,200 Selling Expenses 18,000 Administrative Expenses 19,200 Accounts Payable 37,200
Manufacturing Statement Cost of Goods Sold
Direct Material 20,000 Opening Balance Finished Goods 10,000Direct Labour 35,000 Cost of Goods Manufactured 80,000Factory Overhead Applied 21,000 90,000 76,000 Opening Balance Finished Goods - 6,000Plus Opening balance Work in Progress 14,000 Cost of Goods Sold 84,000 90,000 plus Underapplied Overhead 1,500Less Closing balance 10,000 Cost of Goods Sold 85,500Cost of Goods Manufactured 80,000
Factory Overhead Control Income Statement
Raw M Control 4,000 F O A 22,500 Sales 151,200Labour Costs 11,000 Cost of Goods Sold 85,500Other 7,500 Equals Gross Profit 65,700 22,500 22,500 Less Expenses 37,200 Net Profit 28,500
Factory Overhead Applied F O C 22,500 W I P 21,000 C O G S 1,500 22,500 22,500
Management Accounting in Australia - Solutions
54
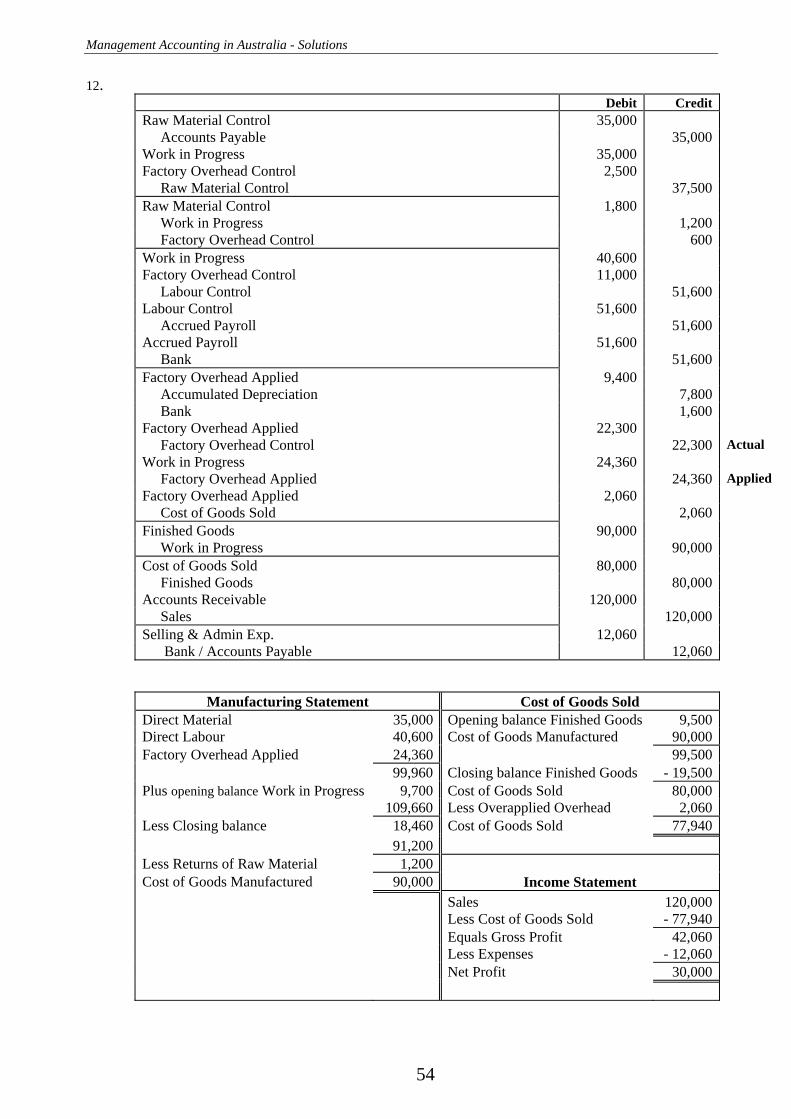
12. Debit Credit Raw Material Control 35,000 Accounts Payable 35,000Work in Progress 35,000 Factory Overhead Control 2,500 Raw Material Control 37,500Raw Material Control 1,800 Work in Progress 1,200 Factory Overhead Control 600Work in Progress 40,600 Factory Overhead Control 11,000 Labour Control 51,600Labour Control 51,600 Accrued Payroll 51,600Accrued Payroll 51,600 Bank 51,600Factory Overhead Applied 9,400 Accumulated Depreciation 7,800 Bank 1,600Factory Overhead Applied 22,300 Factory Overhead Control 22,300 Actual Work in Progress 24,360 Factory Overhead Applied 24,360 Applied Factory Overhead Applied 2,060 Cost of Goods Sold 2,060Finished Goods 90,000 Work in Progress 90,000Cost of Goods Sold 80,000 Finished Goods 80,000Accounts Receivable 120,000 Sales 120,000Selling & Admin Exp. 12,060 Bank / Accounts Payable 12,060
Manufacturing Statement Cost of Goods Sold Direct Material 35,000 Opening balance Finished Goods 9,500Direct Labour 40,600 Cost of Goods Manufactured 90,000Factory Overhead Applied 24,360 99,500 99,960 Closing balance Finished Goods - 19,500Plus opening balance Work in Progress 9,700 Cost of Goods Sold 80,000 109,660 Less Overapplied Overhead 2,060Less Closing balance 18,460 Cost of Goods Sold 77,940 91,200Less Returns of Raw Material 1,200Cost of Goods Manufactured 90,000 Income Statement Sales 120,000 Less Cost of Goods Sold - 77,940 Equals Gross Profit 42,060 Less Expenses - 12,060 Net Profit 30,000

Chapter 4: The Cost Accounting Cycle
55
13. Raw Material Control
Opening balance 14,000 Work in Progress 18,600 Accounts Payable 22,000 Factory Overhead Control 2,400 Closing balance 15,000 36,000 36,000
Labour Control Accrued Payroll 23,400 Work in Progress 24,000 Tax Payable 10,200 Factory Overhead Control 10,000 Union Dues 400 34,000 34,000
Work in Progress Opening balance 15,200 Finished Goods 60,000 Raw Material Control 18,600 Labour Control 24,000 Factory Overhead Applied 18,000 Closing balance 15,800 75,800 75,800
Finished Goods Opening balance 15,000 Cost of Goods Sold 50,000 Work in Progress 60,000 Closing balance 25,000 75,000 75,000 Total Manufacturing Costs $ 60,600 Less Raw Material Costs - 18,600 Equals Conversion Costs $ 42,000 Conversion Costs $ 42,000 = $ 24,000 ( L.C. ) 1.75
Factory Overhead Control Raw Material Control 2,400 Factory Overhead Applied 18,000 Labour Control 10,000 Account Depreciation 2,200 Prepaid Insurance 400 Bank 3,000 18,000 18,000
Factory Overhead Applied Factory Overhead Control 18,000 Work in Progress 18,000 18,000 18,000
Manufacturing Statement Cost of Goods Sold Direct Material $ 18,600 O/Bal Finished Goods $ 15,000Direct Labour 24,000 Cost of Goods Manufactured 60,000Factory Overhead Applied 18,000 $ 75,000 $ 60,600 C/Bal Finished Goods -25,000 Plus O/Bal Work in Progress. 15,200 Cost of Goods Sold $ 50,000 75,800 Less C/Bal 15,800 Statement of Financial Performance Cost of Goods Manufactured $ 60,000 Sales $ 100,000 Less Cost of Goods Sold -50,000 Equals Gross Profit $ 50,000 Less Expenses -25,000 Net Profit $ 25,000

Management Accounting in Australia - Solutions
56
14. Raw Material Control
Opening Balance 40,000 Work in Progress 162,000Accounts Payable 170,000 Factory Overhead Control 18,000 Closing Balance 30,000 210,000 210,000
Work in ProgressOpening Balance 50,000 Finished Goods 410,000Raw Material Control 162,000 Labour Control 192,000 Factory Overhead Applied 96,000 Closing Balance 90,000 500,000 500,000
Finished GoodsOpening Balance 40,000 Cost of Goods Sold 400,000Work in Progress 410,000 Closing Balance 50,000 450,000 450,000
15. ( a ) Debit CreditRaw Material Control 55,000 Accounts Payable 55,000Work in Progress 68,000 Factory Overhead Control 5,600 Raw Material Control 73,600Work in Progress 85,000 Factory Overhead Control 10,500 Labour Control 95,500Labour Control 95,500 Tax Withheld 20,000 Accrued Payroll 75,500Accrued Payroll 75,500 Bank 75,500Factory Overhead Control 14,000 Accounts Payable 14,000Bank 310,000 Accounts Receivable 310,000Accounts Payable 109,000 Bank 109,000Factory Overhead Control 1,600 Accum. Depn. – Plant 1,600Factory Overhead Applied 31,700 Factory Overhead Control 31,700
Chapter 4: The Cost Accounting Cycle
57
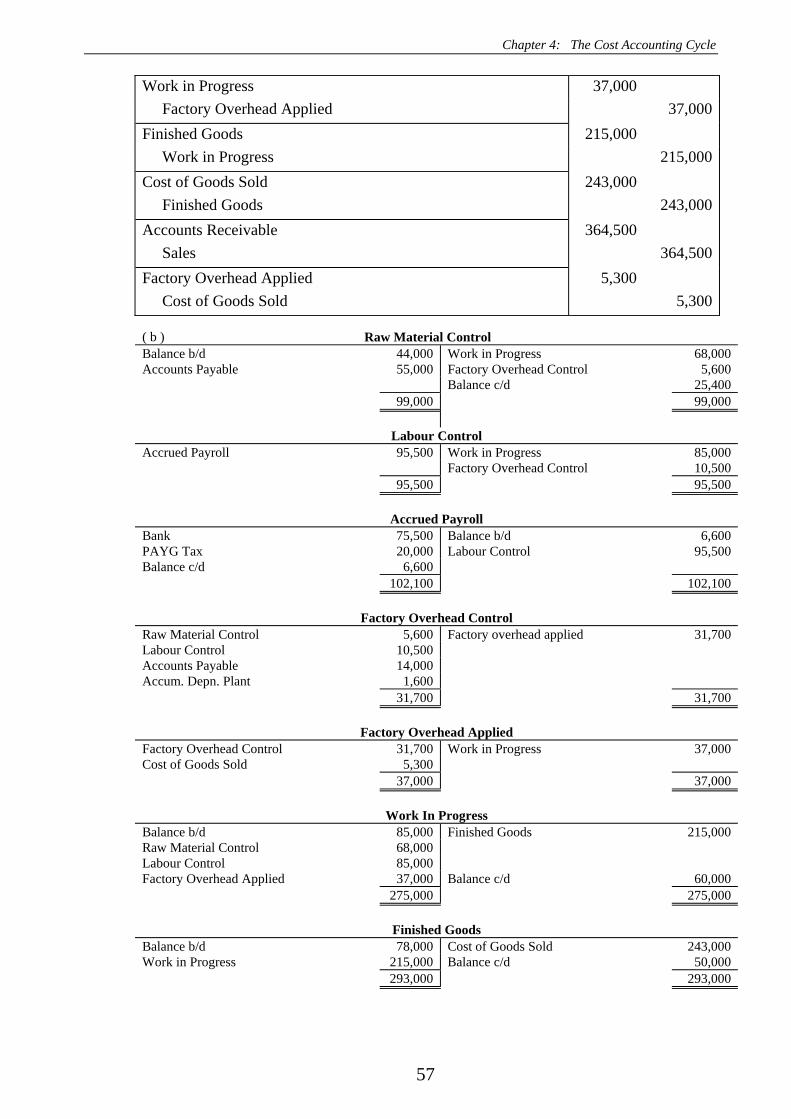
Work in Progress 37,000 Factory Overhead Applied 37,000Finished Goods 215,000 Work in Progress 215,000Cost of Goods Sold 243,000 Finished Goods 243,000Accounts Receivable 364,500 Sales 364,500Factory Overhead Applied 5,300 Cost of Goods Sold 5,300 ( b ) Raw Material Control Balance b/d 44,000 Work in Progress 68,000 Accounts Payable 55,000 Factory Overhead Control 5,600 Balance c/d 25,400 99,000 99,000
Labour Control Accrued Payroll 95,500 Work in Progress 85,000 Factory Overhead Control 10,500 95,500 95,500
Accrued Payroll Bank 75,500 Balance b/d 6,600 PAYG Tax 20,000 Labour Control 95,500 Balance c/d 6,600 102,100 102,100
Factory Overhead Control Raw Material Control 5,600 Factory overhead applied 31,700 Labour Control 10,500 Accounts Payable 14,000 Accum. Depn. Plant 1,600 31,700 31,700
Factory Overhead Applied Factory Overhead Control 31,700 Work in Progress 37,000 Cost of Goods Sold 5,300 37,000 37,000
Work In Progress Balance b/d 85,000 Finished Goods 215,000 Raw Material Control 68,000 Labour Control 85,000 Factory Overhead Applied 37,000 Balance c/d 60,000 275,000 275,000
Finished Goods Balance b/d 78,000 Cost of Goods Sold 243,000 Work in Progress 215,000 Balance c/d 50,000 293,000 293,000

Management Accounting in Australia - Solutions
58
Accounts Payable
Bank 109,000 Balance b/d 65,400 Balance c/d 25,400 Raw Material Control 55,000 Factory Overhead Control 14,000 134,400 134,400
Sales Accounts Receivable 364,500
Cost Of Goods Sold Finished Goods 243,000 Factory Overhead Applied 5,300 Balance c/d 237,700 243,000 243,000
Accounts Receivable Balance b/d 32,000 Bank 310,000 Sales 364,500 Balance c/d 86,500 396,500 396,500
Accumulated Depreciation - Plant Balance b/d 92,000 Factory Overhead Control 1,600 93,600
Bank Balance b/d 15,000 Accrued Payroll + PAYE Tax 95,500 Accounts Receivable 310,000 Accounts Payable 109,000 Balance c/d 120,500 325,000 325,000
Plant & Machinery Balance b/d 192,000
Paid Up Capital Balance b/d 220,000
Retained Earnings Balance b/d 62,000
Trial Balance Debit CreditRaw Material Control 25,400 Work in Progress 60,000 Finished Goods 50,000 Accounts Receivable 86,500 Bank 120,500 Plant 192,000 Accounts Payable 25,400Accrued Payroll 6,600Accum. Depreciation 93,600Retained Earnings 62,000Paid Up Capital 220,000Sales 364,500Cost of Goods Sold 237,700 772,100 772,100
Chapter 5: Material & Labour
59
Chapter 5 Material & Labour Chapter Review Solutions
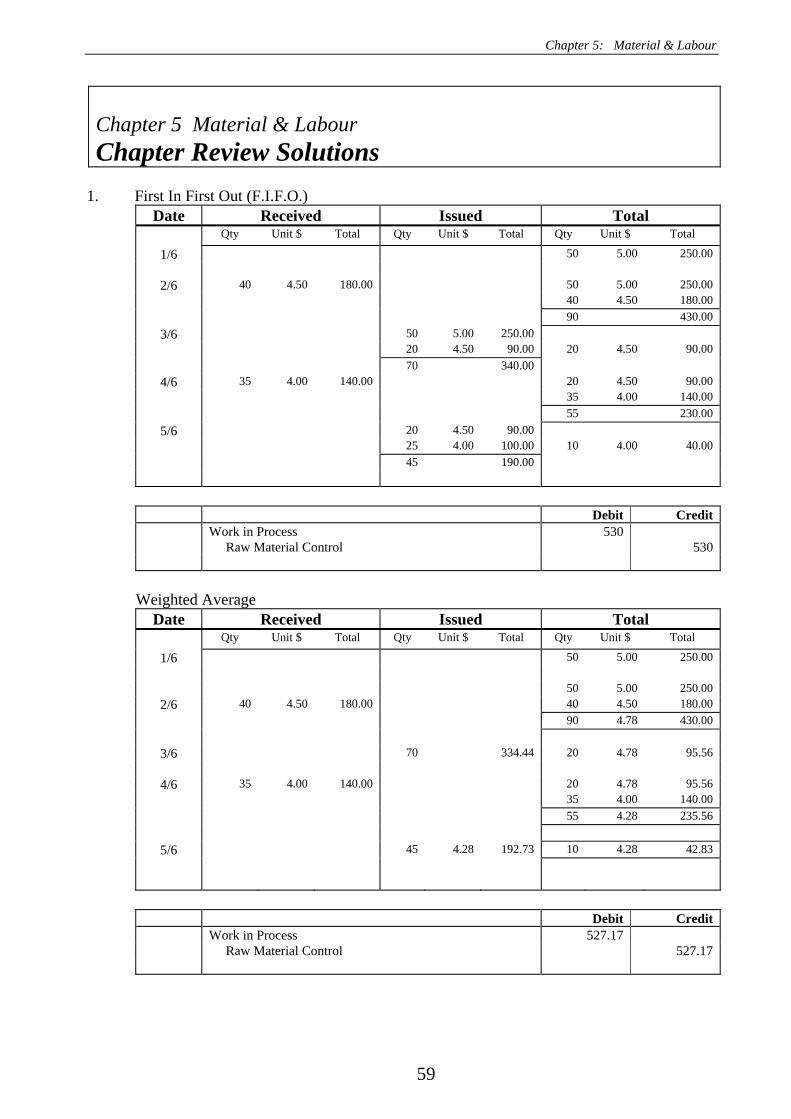
1. First In First Out (F.I.F.O.)
Date Received Issued Total Qty Unit $ Total Qty Unit $ Total Qty Unit $ Total
1/6 50 5.00 250.00
2/6 40 4.50 180.00 50 5.00 250.00 40 4.50 180.00 90 430.00
3/6 50 5.00 250.00 20 4.50 90.00 20 4.50 90.00 70 340.00
4/6 35 4.00 140.00 20 4.50 90.00 35 4.00 140.00 55 230.00
5/6 20 4.50 90.00 25 4.00 100.00 10 4.00 40.00 45 190.00
Debit Credit Work in Process 530 Raw Material Control 530
Weighted Average
Date Received Issued Total Qty Unit $ Total Qty Unit $ Total Qty Unit $ Total
1/6 50 5.00 250.00 50 5.00 250.00
2/6 40 4.50 180.00 40 4.50 180.00 90 4.78 430.00
3/6 70 334.44 20 4.78 95.56
4/6 35 4.00 140.00 20 4.78 95.56 35 4.00 140.00 55 4.28 235.56
5/6 45 4.28 192.73 10 4.28 42.83
Debit Credit Work in Process 527.17 Raw Material Control 527.17

Management Accounting in Australia - Solutions
60
2. First In First Out (F.I.F.O.)
Date Received Issued Total Qty Unit $ Total Qty Unit $ Total Qty Unit $ Total
1/12 150 15.00 2,250
6/12 150 15.50 2,325 150 15.00 2,250 150 15.50 2,325 300 4,575 150 15.00 2,250
10/12 30 15.50 465 120 15.50 1,860 180 2,715 120 15.50 1,860
21/12 150 15.60 2,340 150 15.60 2,340 270 4,200 120 15.50 1,860
23/12 40 15.60 624 110 15.60 1,716
160 2,484
Weighted Average Date Received Issued Total
Qty Unit $ Total Qty Unit $ Total Qty Unit $ Total
1/12 150 15.00 2,250 150 15.00 2,325
6/12 150 15.50 2,325 150 15.00 2,250 300 15.25 4,575
10/12 180 15.25 2,745 120 15.25 1,830 150 15.60 2,340
21/12 150 15.60 2,340 120 15.25 1,830 270 15.44 4,170
23/12 160 15.44 2,471 110 15.44 1,699

Chapter 5: Material & Labour
61
3. First In First Out (F.I.F.O.) ( a ) Stock Card Date Received Issued Total
Qty Unit $ Total Qty Unit $ Total Qty Unit $ Total
1/7 500 4.00 2,000
4/7 200 5.00 1,000 500 4.00 2,000 200 5.00 1,000 700 3,000
8/7 100 4.00 400 400 4.00 1,600 200 5.00 1,000 600 2,600
12/7 - 100 5.00 - 500 400 4.00 1,600 100 5.00 500 500 2,100
15/7 200 4.00 800 200 4.00 800 100 5.00 500 300 1,300
19/7 300 6.00 1,800 200 4.00 800 100 5.00 500 300 6.00 1,800 600 3,100
24/7 200 4.00 800 100 5.00 500 100 6.00 600 200 6.00 1,200 400 1,900
29/7 - 100 4.00 - 400 100 4.00 400 200 6.00 1,200 300 1,600
31/7 50 4.00 200 50 4.00 200 200 6.00 1,200 250 1,400
Debit Credit
( b ) Work in Process 2,700 Raw Material Control 2,700
( c ) Factory Overhead Control 200 Raw Material Control 200 50 units loss @ $4.00 per unit
( d ) Accounts Payable 300 Raw Material Control 300 300 units overcharged @ $1.00 per unit
Management Accounting in Australia - Solutions
62
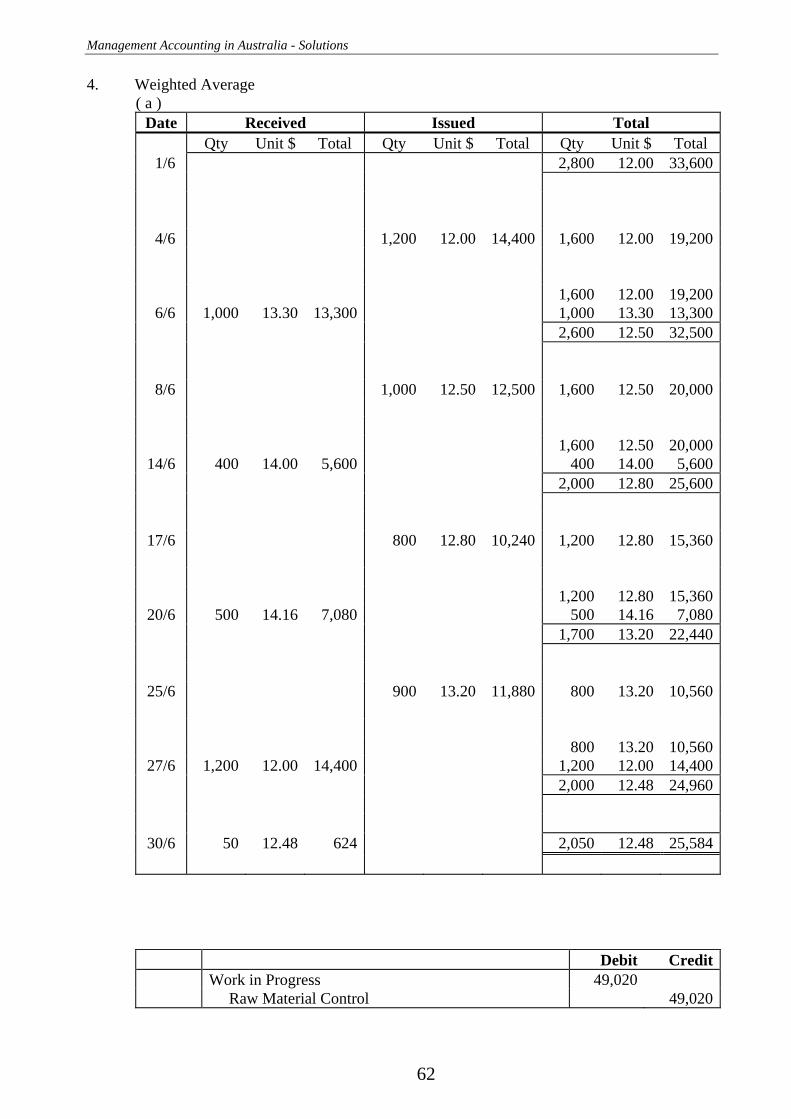
4. Weighted Average ( a )
Date Received Issued Total Qty Unit $ Total Qty Unit $ Total Qty Unit $ Total
1/6 2,800 12.00 33,600
4/6 1,200 12.00 14,400 1,600 12.00 19,200 1,600 12.00 19,200
6/6 1,000 13.30 13,300 1,000 13.30 13,300 2,600 12.50 32,500
8/6 1,000 12.50 12,500 1,600 12.50 20,000 1,600 12.50 20,000
14/6 400 14.00 5,600 400 14.00 5,600 2,000 12.80 25,600
17/6 800 12.80 10,240 1,200 12.80 15,360 1,200 12.80 15,360
20/6 500 14.16 7,080 500 14.16 7,080 1,700 13.20 22,440
25/6 900 13.20 11,880 800 13.20 10,560 800 13.20 10,560
27/6 1,200 12.00 14,400 1,200 12.00 14,400 2,000 12.48 24,960
30/6 50 12.48 624 2,050 12.48 25,584
Debit Credit Work in Progress 49,020 Raw Material Control 49,020
Chapter 5: Material & Labour
63
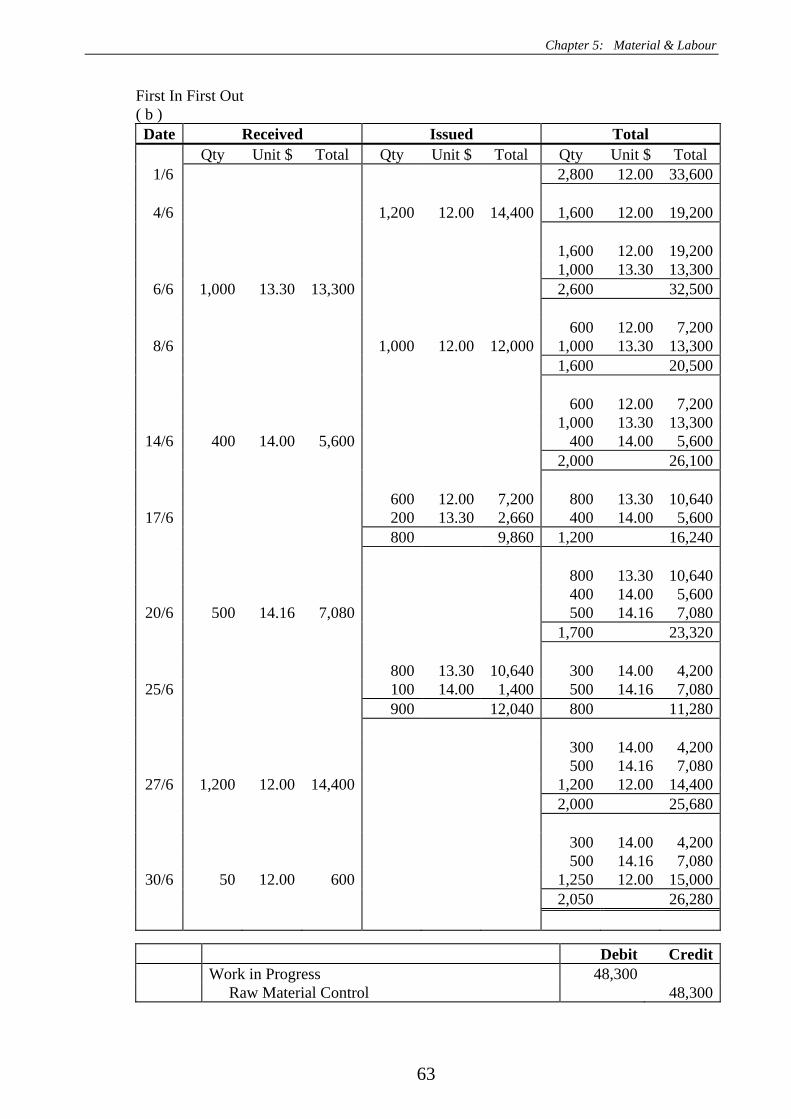
First In First Out ( b ) Date Received Issued Total
Qty Unit $ Total Qty Unit $ Total Qty Unit $ Total 1/6 2,800 12.00 33,600
4/6 1,200 12.00 14,400 1,600 12.00 19,200
1,600 12.00 19,200 1,000 13.30 13,300
6/6 1,000 13.30 13,300 2,600 32,500 600 12.00 7,200
8/6 1,000 12.00 12,000 1,000 13.30 13,300 1,600 20,500 600 12.00 7,200 1,000 13.30 13,300
14/6 400 14.00 5,600 400 14.00 5,600 2,000 26,100 600 12.00 7,200 800 13.30 10,640
17/6 200 13.30 2,660 400 14.00 5,600 800 9,860 1,200 16,240 800 13.30 10,640 400 14.00 5,600
20/6 500 14.16 7,080 500 14.16 7,080 1,700 23,320 800 13.30 10,640 300 14.00 4,200
25/6 100 14.00 1,400 500 14.16 7,080 900 12,040 800 11,280 300 14.00 4,200 500 14.16 7,080
27/6 1,200 12.00 14,400 1,200 12.00 14,400 2,000 25,680 300 14.00 4,200 500 14.16 7,080
30/6 50 12.00 600 1,250 12.00 15,000 2,050 26,280
Debit Credit Work in Progress 48,300 Raw Material Control 48,300
Management Accounting in Australia - Solutions
64
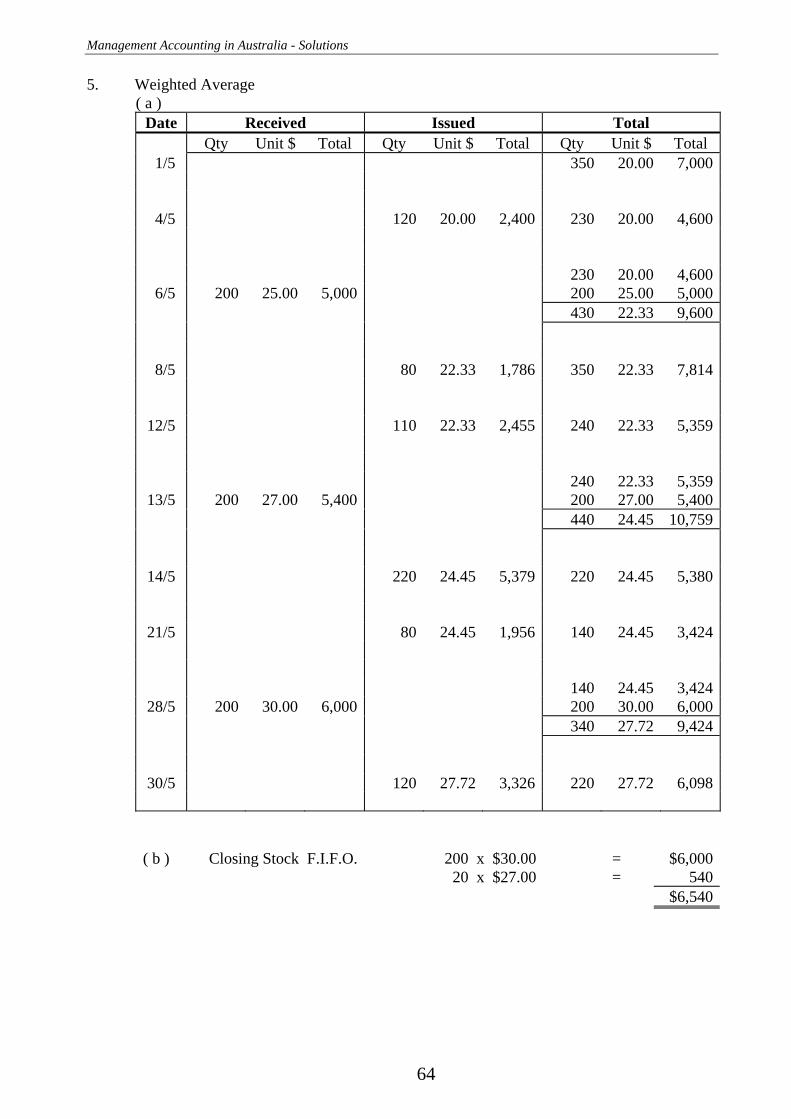
5. Weighted Average ( a )
Date Received Issued Total Qty Unit $ Total Qty Unit $ Total Qty Unit $ Total
1/5 350 20.00 7,000
4/5 120 20.00 2,400 230 20.00 4,600 230 20.00 4,600
6/5 200 25.00 5,000 200 25.00 5,000 430 22.33 9,600
8/5 80 22.33 1,786 350 22.33 7,814
12/5 110 22.33 2,455 240 22.33 5,359 240 22.33 5,359
13/5 200 27.00 5,400 200 27.00 5,400 440 24.45 10,759
14/5 220 24.45 5,379 220 24.45 5,380
21/5 80 24.45 1,956 140 24.45 3,424 140 24.45 3,424
28/5 200 30.00 6,000 200 30.00 6,000 340 27.72 9,424
30/5 120 27.72 3,326 220 27.72 6,098
( b ) Closing Stock F.I.F.O. 200 x $30.00 = $6,000 20 x $27.00 = 540 $6,540

Chapter 5: Material & Labour
65
6. ( a ) Weighted Average Date Received Issued Total
Qty Unit $ Total Qty Unit $ Total Qty Unit $ Total
1/6 400 25.00 10,000 400 25.00 10,000 200 26.00 5,200
6/6 200 26.00 5,200 600 25.33 15,200
7/6 170 25.33 4,307 430 25.33 10,893 - 20 26.00 - 520
9/6 - 20 26.00 - 520 430 25.33 10,893 410 25.30 10,373
17/6 130 25.30 3,289 280 25.30 7,084 280 25.30 7,084
23/6 120 27.00 3,240 120 27.00 3,240 400 25.81 10,324 400 25.81 10,324
25/6 140 28.00 3,920 140 28.00 3,920 540 26.38 14,244
28/6 160 26.38 4,221 380 26.38 10,023 380 26.38 10,024
30/6 - 10 25.30 - 253 10 25.30 253 390 26.35 10,277
30/6 5 26.35 132 385 26.35 10,145
Purchases Debit Credit Raw Material Control 12,360 Creditors 12,360 Returns Creditors 520 Raw Material Control 520 F.I.F.O Debit Credit Issues Work in Progress 11,560 Raw Material Control 11,560 Returns Raw Material Control 250 Work in Progress 250
Weighted Average Debit Credit Issues Work in Progress 11,817 Raw Material Control 11,817 Returns Raw Material Control 253 Work in Progress 253

Management Accounting in Australia - Solutions
66
6. ( b ) First In First Out (F.I.F.O.) Date Received Issued Total Qty Unit $ Total Qty Unit $ Total Qty Unit $ Total 1/6 400 25.00 10,000 400 25.00 10,000 200 26.00 5,2006/6 200 26.00 5,200 600 15,200 230 25.00 5,750 170 25.00 4,250 200 26.00 5,200 430 10,950 230 25.00 5,7509/6 - 20 26.00 - 520 180 26.00 4,680 410 10,430 100 25.00 2,50017/6 130 25.00 3,250 180 26.00 4,680 280 7,180 100 25.00 2,500 180 26.00 4,68023/6 120 27.00 3,240 120 27.00 3,240 400 10,420 100 25.00 2,500 180 26.00 4,680 120 27.00 3,24025/6 140 28.00 3,920 140 28.00 3,920 540 14,340 120 26.00 3,120 100 25.00 2,500 120 27.00 3,24028/6 60 26.00 1,560 140 28.00 3,920 160 4,060 380 10,280 10 25.00 250 120 26.00 3,120 120 27.00 3,24030/6 - 10 25.00 - 250 140 28.00 3,920 390 10,530 5 25.00 175 120 26.00 3,120 120 27.00 3,24030/6 5 25.00 125 140 28.00 3,920 385 10,405
Chapter 5: Material & Labour
67
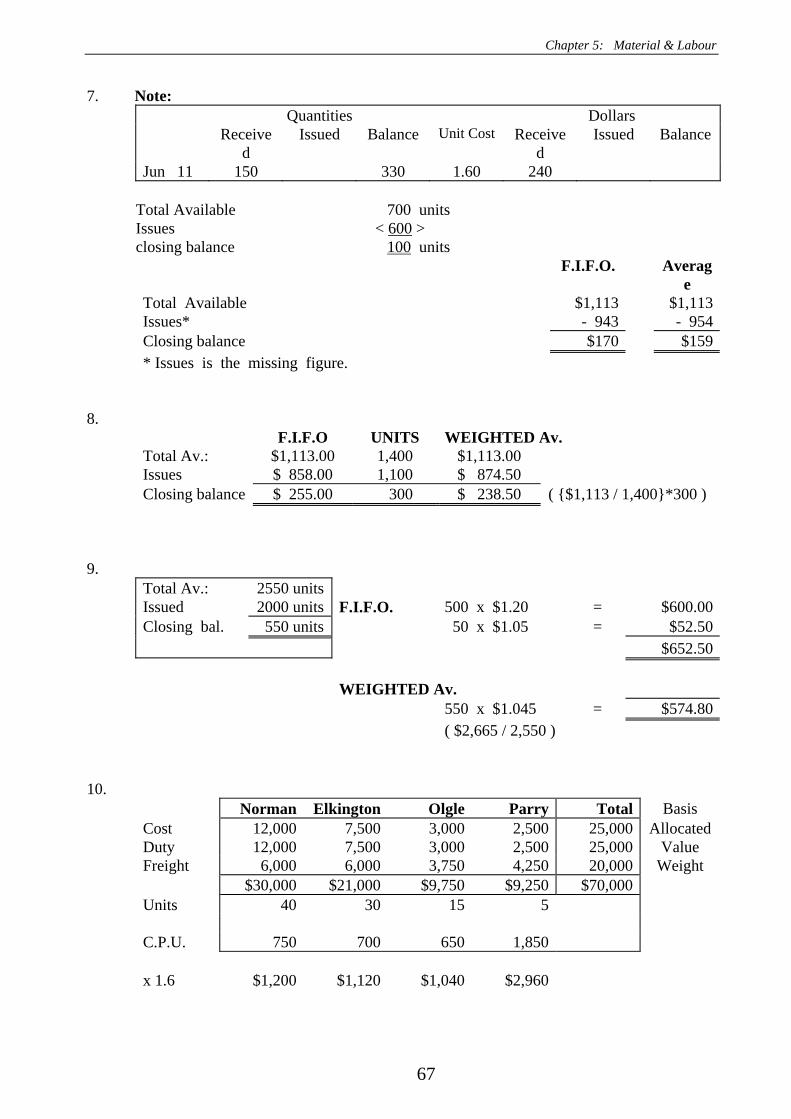
7. Note: Quantities Dollars Receive
d Issued Balance Unit Cost Receive
d Issued Balance
Jun 11 150 330 1.60 240
Total Available 700 units Issues < 600 > closing balance 100 units F.I.F.O. Averag
e Total Available $1,113 $1,113Issues* - 943 - 954Closing balance $170 $159* Issues is the missing figure.
8. F.I.F.O UNITS WEIGHTED Av.
Total Av.: $1,113.00 1,400 $1,113.00 Issues $ 858.00 1,100 $ 874.50 Closing balance $ 255.00 300 $ 238.50 ( {$1,113 / 1,400}*300 )
9. Total Av.: 2550 units Issued 2000 units F.I.F.O. 500 x $1.20 = $600.00Closing bal. 550 units 50 x $1.05 = $52.50 $652.50 WEIGHTED Av. 550 x $1.045 = $574.80 ( $2,665 / 2,550 )
10. Norman Elkington Olgle Parry Total Basis Cost 12,000 7,500 3,000 2,500 25,000 Allocated Duty 12,000 7,500 3,000 2,500 25,000 Value Freight 6,000 6,000 3,750 4,250 20,000 Weight $30,000 $21,000 $9,750 $9,250 $70,000 Units 40 30 15 5 C.P.U. 750 700 650 1,850 x 1.6 $1,200 $1,120 $1,040 $2,960
Management Accounting in Australia - Solutions
68
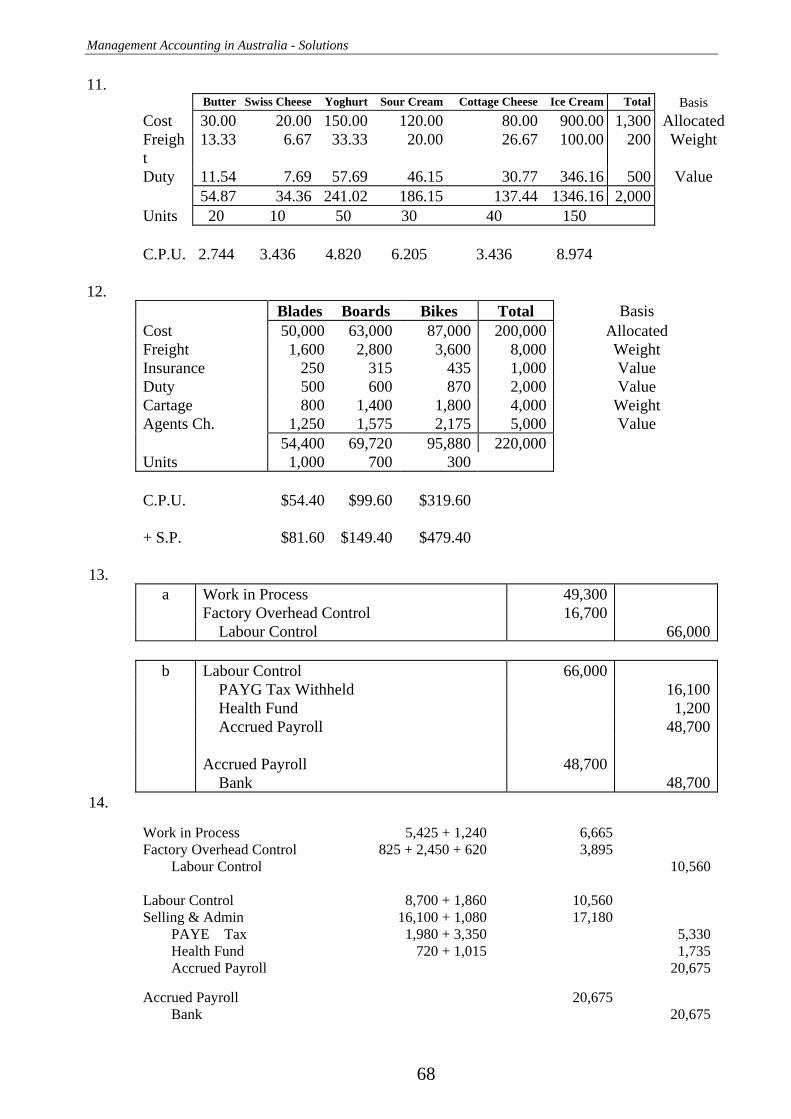
11. Butter Swiss Cheese Yoghurt Sour Cream Cottage Cheese Ice Cream Total Basis
Cost 30.00 20.00 150.00 120.00 80.00 900.00 1,300 Allocated Freight
13.33 6.67 33.33 20.00 26.67 100.00 200 Weight
Duty 11.54 7.69 57.69 46.15 30.77 346.16 500 Value 54.87 34.36 241.02 186.15 137.44 1346.16 2,000 Units 20 10 50 30 40 150 C.P.U. 2.744 3.436 4.820 6.205 3.436 8.974
12.
Blades Boards Bikes Total Basis Cost 50,000 63,000 87,000 200,000 Allocated Freight 1,600 2,800 3,600 8,000 Weight Insurance 250 315 435 1,000 Value Duty 500 600 870 2,000 Value Cartage 800 1,400 1,800 4,000 Weight Agents Ch. 1,250 1,575 2,175 5,000 Value 54,400 69,720 95,880 220,000 Units 1,000 700 300 C.P.U. $54.40 $99.60 $319.60 + S.P. $81.60 $149.40 $479.40
13.
a Work in Process 49,300 Factory Overhead Control 16,700 Labour Control 66,000
b Labour Control 66,000 PAYG Tax Withheld 16,100 Health Fund 1,200 Accrued Payroll 48,700 Accrued Payroll 48,700 Bank 48,700
14. Work in Process 5,425 + 1,240 6,665 Factory Overhead Control 825 + 2,450 + 620 3,895 Labour Control 10,560 Labour Control 8,700 + 1,860 10,560 Selling & Admin 16,100 + 1,080 17,180
PAYE Tax 1,980 + 3,350 5,330 Health Fund 720 + 1,015 1,735 Accrued Payroll 20,675
Accrued Payroll 20,675 Bank 20,675
Chapter 5: Material & Labour
69
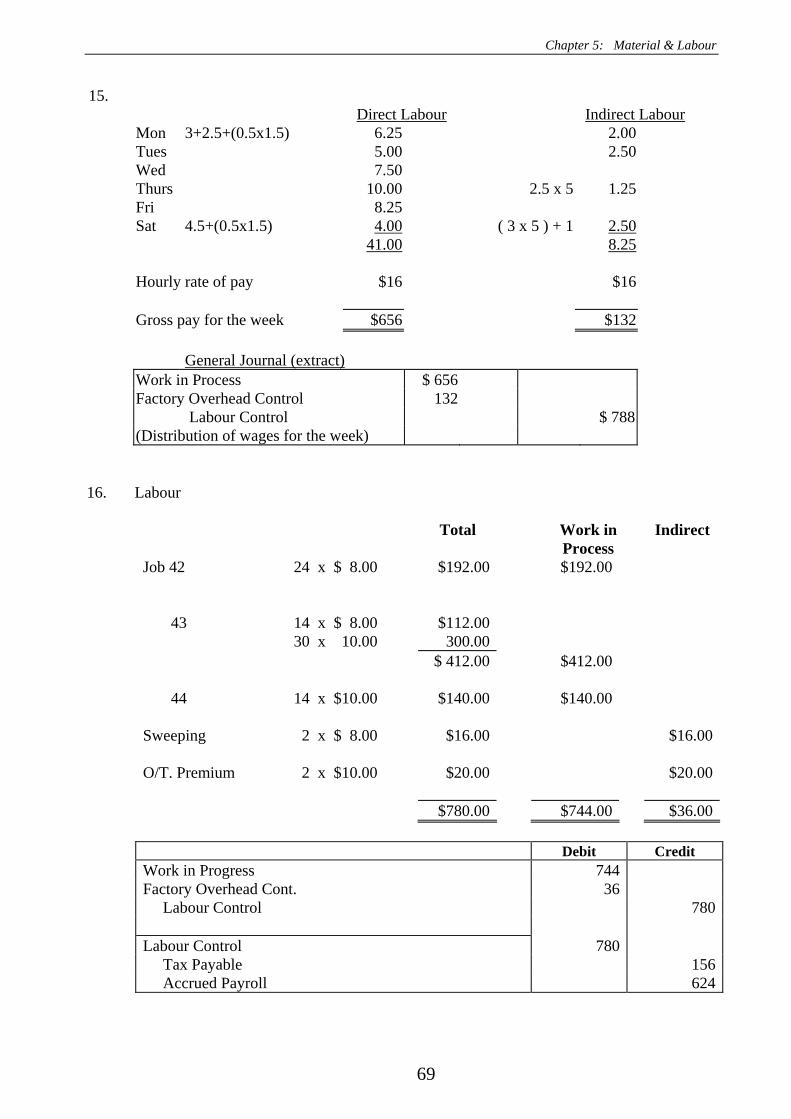
15. Direct Labour Indirect Labour Mon 3+2.5+(0.5x1.5) 6.25 2.00 Tues 5.00 2.50 Wed 7.50 Thurs 10.00 2.5 x 5 1.25 Fri 8.25 Sat 4.5+(0.5x1.5) 4.00 ( 3 x 5 ) + 1 2.50
41.00 8.25
Hourly rate of pay $16 $16 Gross pay for the week $656 $132
General Journal (extract)
Work in Process $ 656 Factory Overhead Control 132
Labour Control $ 788 (Distribution of wages for the week)
16. Labour Total Work in
Process Indirect
Job 42 24 x $ 8.00 $192.00 $192.00 43 14 x $ 8.00 $112.00 30 x 10.00 300.00 $ 412.00 $412.00 44 14 x $10.00 $140.00 $140.00 Sweeping 2 x $ 8.00 $16.00 $16.00 O/T. Premium 2 x $10.00 $20.00 $20.00 $780.00 $744.00 $36.00 Debit Credit Work in Progress 744 Factory Overhead Cont. 36 Labour Control 780 Labour Control 780 Tax Payable 156 Accrued Payroll 624
Management Accounting in Australia - Solutions
70
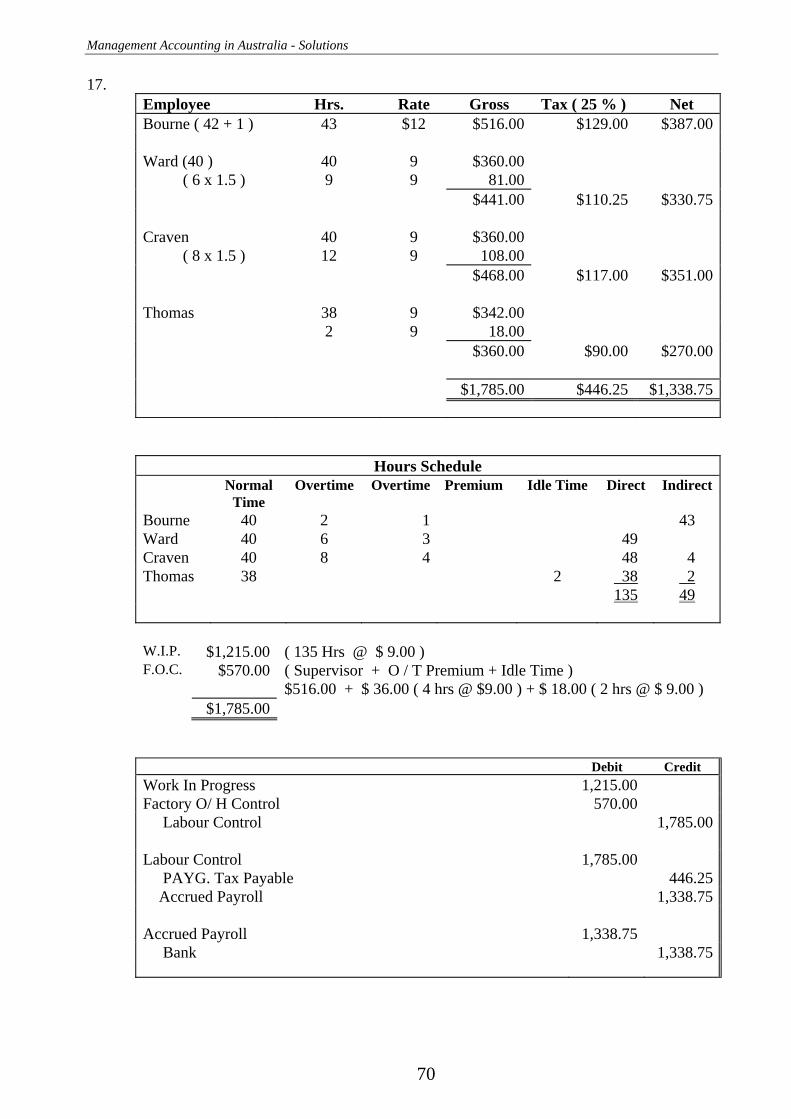
17. Employee Hrs. Rate Gross Tax ( 25 % ) Net Bourne ( 42 + 1 ) 43 $12 $516.00 $129.00 $387.00 Ward (40 ) 40 9 $360.00 ( 6 x 1.5 ) 9 9 81.00 $441.00 $110.25 $330.75 Craven 40 9 $360.00 ( 8 x 1.5 ) 12 9 108.00 $468.00 $117.00 $351.00 Thomas 38 9 $342.00 2 9 18.00 $360.00 $90.00 $270.00 $1,785.00 $446.25 $1,338.75
Hours Schedule Normal
Time Overtime Overtime Premium Idle Time Direct Indirect
Bourne 40 2 1 43 Ward 40 6 3 49 Craven 40 8 4 48 4 Thomas 38 2 38 2 135 49
W.I.P. $1,215.00 ( 135 Hrs @ $ 9.00 ) F.O.C. $570.00 ( Supervisor + O / T Premium + Idle Time ) $516.00 + $ 36.00 ( 4 hrs @ $9.00 ) + $ 18.00 ( 2 hrs @ $ 9.00 ) $1,785.00
Debit Credit Work In Progress 1,215.00 Factory O/ H Control 570.00 Labour Control 1,785.00 Labour Control 1,785.00 PAYG. Tax Payable 446.25 Accrued Payroll 1,338.75 Accrued Payroll 1,338.75 Bank 1,338.75

Chapter 5: Material & Labour
71
18. Days W.I.P. F.O.C. Absent Total Tue 7 1 8 Wed 8 8 Thur 7 2.5* 9.5 Fri 8 8 Mon 8 8 30 hrs 3.5 hrs 8 hrs 41.5 hrs
Normal Time 6 hrs Only O / T Premium to F.O.C. O / T Time 1 hrs *.5 Hrs + 2 hrs clean up = 2.5 hrs 7 hrs Debit Credit Work In Progress 300 ( 30 x $ 10 ) Factory O/H Control 35 ( 3.5 x $ 10 ) Provision for Sick Pay 80 ( 8 x $ 10 ) Labour Control 415 ( 41.5 x $ 10 )
19.
a Work in Process 170,000 Factory Overhead Control 16,000 Labour Control 186,000
b Labour Control 181,400 Prov for Sick Leave 600 Prov for Annual Leave 8,000 PAYG Tax Withheld 40,000 Super 9,000 Medical 6,000 Union Dues 400 Accrued Payroll 134,600 Accrued Payroll 134,600 Bank 134,600
c Factory Overhead Control 16,740 Prov for Sick Leave 5,580 Prov for Public Holidays 3,720 Prov for Annual Leave 7,440

Management Accounting in Australia - Solutions
72
20. ( Note: 13 pay periods p. a. ) * ( a ) Debit Credit Work In Progress 26,832 ( 2,216 + 20 ) ( $ 12 ) Factory O/H. Control 7,920 ( 315 + 10 ) ( $ 12 ) + $ 2,820 + $ 1,200 Prov. An. Leave 2,820 ( 15 x 4 x 40 x $12 x 1.175 )( 1/12 ) * Prov. Sick Pay 1,200 ( 15 x 10 x 8 x $12 )( 1/12 ) * Labour Control 30,732
Debit CreditFactory Overhead Control 1,500Prepaid Workers Comp. Ins. 1,500
21.
Annual Weeks Av. 52 Base Rate 9.00 - Annual Leave 4 ( 4/45 $ 9 ) ( 1.175 ) $0.94 ( including loading ) - Sick Leave. 2 ( 2/45 $ 9 ) $0.40 - Public Holidays 1 ( 1/45 $ 9 ) $0.20 Weeks Available 45 Charge Rate $ 10.54
22.
Hourly Rate $ 20.0000 Annual Leave 4/45 $ 1.7778 Loading 17.50% $ 0.3111 Sick Leave 1/45 $ 0.4444 Public Holidays 2/45 $ 0.8889 Total $ 23.4222
Payroll Tax 23.4222 x 6% $ 1.4053 W.C.I. 23.4222 x 10% $ 2.3422 Superannuation 23.1111 x 9% $ 2.0800
$ 29.2497

Chapter 5: Material & Labour
73
23. Hourly Rate 10.0000 Annual Leave 4/44 0.9091 Loading 17.50% 0.1591 Sick Leave 2/44 0.4545 Public Holidays 2/44 0.4545 Total 11.9773
Payroll Tax 11.9773 x 6% $0.7186 W.C.I. 11.9733 x 10% $1.1977 Superannuation 11.9773 - 0.1591 x 9% $1.0636
$14.9572
24. Productive Weeks = 52 – 9 = 43 weeks $ per Hour Wages Paid 12.0000 Annual Leave (4/43) 1.1163 Annual Leave Loading (17 ½ %) 0.1953 Other Leave (5/43) 1.3953 14.7069 Superannuation* 14.5116 x 9% 1.3060 Payroll Tax 14.7069 x 6% 0.8824 W.C.I. 14.7069 x 3% 0.4412 2.6296 * ( 14.7069 - 0.1953 ) $ 17.3365
25 Labour Charge Rates Total pay p.a. $380 per week x 52 weeks $19,760 + Leave Loading weeks 4 $380 0.175 $ 266 $20,026 Total weeks 52 Annual leave -4 Overtime Premium 1.5 Sick Leave -2 Public Holidays -2 Leave Loading 0.175 Weeks Available 44 Hours Sick 15 Annual Leave Pay 150 Tax Rate 30% Superannuation 9%
44 Number of working weeks x 37.5 hours per week = 1,650 Annual hours Gross Charge Rate = Total wages / annual hours $ 12.1370
Management Accounting in Australia - Solutions
74
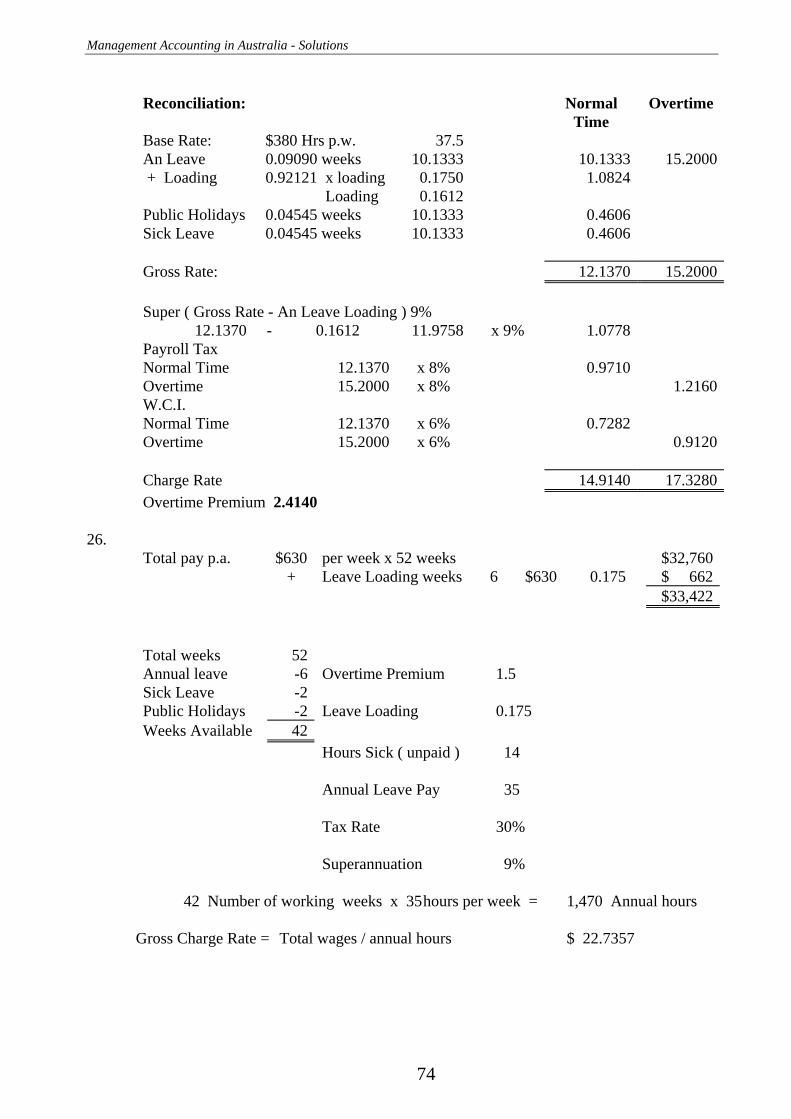
Reconciliation: Normal
Time Overtime
Base Rate: $380 Hrs p.w. 37.5 An Leave 0.09090 weeks 10.1333 10.1333 15.2000 + Loading 0.92121 x loading 0.1750 1.0824 Loading 0.1612 Public Holidays 0.04545 weeks 10.1333 0.4606 Sick Leave 0.04545 weeks 10.1333 0.4606 Gross Rate: 12.1370 15.2000 Super ( Gross Rate - An Leave Loading ) 9% 12.1370 - 0.1612 11.9758 x 9% 1.0778 Payroll Tax Normal Time 12.1370 x 8% 0.9710 Overtime 15.2000 x 8% 1.2160W.C.I. Normal Time 12.1370 x 6% 0.7282 Overtime 15.2000 x 6% 0.9120 Charge Rate 14.9140 17.3280Overtime Premium 2.4140
26.
Total pay p.a. $630 per week x 52 weeks $32,760 + Leave Loading weeks 6 $630 0.175 $ 662 $33,422
Total weeks 52 Annual leave -6 Overtime Premium 1.5 Sick Leave -2 Public Holidays -2 Leave Loading 0.175 Weeks Available 42 Hours Sick ( unpaid ) 14 Annual Leave Pay 35 Tax Rate 30% Superannuation 9%
42 Number of working weeks x 35 hours per week = 1,470 Annual hours Gross Charge Rate = Total wages / annual hours $ 22.7357

Chapter 5: Material & Labour
75
Reconcilation: Normal
Time Overtime
Base Rate: $630 Hrs p.w. 35 18.0000 27.0000 An Leave 0.1429 weeks 18.0000 + Loading 2.5714 x loading 0.1750 3.0214 Loading 0.4500 Public Holidays 0.0476 weeks 18.0000 0.8571 Sick Leave 0.0476 weeks 18.0000 0.8571 Gross Rate: 22.7356 27.0000 Super ( Gross Rate - An Leave Loading ) 9% 22.7356 - 0.4500 22.2856 x 9% 2.0057 Payroll Tax 6% Normal Time 22.7356 x 6% 1.3641 Overtime 27.0000 x 6% 1.6200 W.C.I. 9% Normal Time 22.7356 x 9% 2.0462 Overtime 27.0000 x 9% 2.4300Charge Rate 28.1516 31.0500Overtime Premium 2.8984 Time Sheet Analysis: 620 Direct Total Hours Worked 700 80 Indirect Normal Time 651 Overtime 49 Accrual: Debit Credit Work in Process Direct Hrs 620 x Ch Rate 27.2602 16,901
Factory Overhead Control Indirect Hrs 80 x Ch Rate 27.2602 2,181
Factory Overhead Control Overtime Hrs 49 x O.T. Pre 3.7898 186
Accrued Payroll Normal Time 651 x Base Rate 18.0000 13,041
Overtime 49 x O.T. Base 27.0000
Accrued Annual Leave Normal Time 651 x Leave Rate 3.0214 1,967
Accrued Public Holiday Normal Time 651 x Hol Rate 0.8571 558
Accrued Sick Leave Normal Time 651 x Hol Rate 0.8571 558
Accrued Super Normal Time 651 x Hol Rate 1.1143 725
Accrued Payroll Tax Normal Time 651 x Hol Rate 1.3641 967
Overtime 49 x O/time Rate 1.6200
Accrued W. C. I. Normal Time 651 x Hol Rate 2.0462 1,452
Overtime 49 x O/time Rate 2.4300
19,268 19,268

Management Accounting in Australia - Solutions
76
Payment: Debit Credit Accrued Payroll Normal Time 651 x Base Rate 18.0000 13,041
Overtime 49 x O.T. Base 27.0000
Accrued Sick Leave Hrs Sick 0 x Base Rate 18.0000 -
Accrued Annual Leave Hrs Paid 35 x Base Rate 18.0000 740
+ Plus Loading 1.175
Super Withheld Normal Time 651 x Base Rate 18.0000 617
@ ..% Hrs Sick 0 x Base Rate 18.0000
Hrs Paid 35 x Base Rate 18.0000
Tax Withheld Debits $ 13,781 x Tax Rate 30% 4,134
@ ..%
Bank Missing Figure 9,030
13,781 13,781
27 ( a ) Base Rate $ 20.00Annual Leave (4/45 x 20) 1.78Loading (0.175 x 1.78) 0.31Public Hols (2/45 x 20) 0.89Sick Leave (1/45 x 20) 0.44 23.42Super (6% x 23.42) 1.41 $ 24.83
( b ) i. Direct (1600 x 15) $ 24,000 Indirect (400 x 15) 6,000 O/Time Premium ( 40 x 15) 600 6,600 $ 30,600 Super (6% x 23.42) 1.41 $ 24.83 Less: Tax (25%) 7,560 Super 3,000 - 10,560 Net Pay Due $ 19,950
ii. Labour Control 30,600 Accrued Payroll 30,600 Accrued Payroll 30,600 Bank 19,950 PAYE Tax Payable 7,650 Accrued Super 3,000 iii. Work in Process 24,000 Factory Overhead Control 6,600 Labour Control 30,600

Chapter 5: Material & Labour
77
28. Total pay p.a. $455 per week x 52 weeks $23,660 + Leave Loading weeks 4 $455 0.175 $ 319 $23,979
Total weeks 52 Annual leave -4 Overtime Premium 1.5 Sick Leave -1 Double Time Premium 2 Public Holidays -2 Leave Loading 0.175 Weeks Available 45 Hours Sick 35 Annual Leave Pay 140 Tax Rate 33.33% Superannuation 5% Public Holidays 70
45 Number of working weeks x 35 hours per week = 1,575 Annual hours Gross Charge Rate = Total wages / annual hours $ 15.2244
Reconciliation: Normal Time Overtime 1 Overtime 2
Base Rate: $455 Hrs p.w. 35 13.0000 19.5000 26.0000 An Leave 0.0889 weeks 13.0000 + Loading 1.1556 x loading 0.1750 1.3578 Loading 0.2022 Public Hols 0.0444 weeks 13.0000 0.5778 Sick Leave 0.0222 weeks 13.0000 0.2889 Gross Rate: 15.2245 19.5000 26.0000 Super ( Gross Rate - An Leave Loading ) 9% 15.2245 - 0.2022 15.0223 x 9% 1.3530 Payroll Tax 4% Normal Time 15.2245 x 4% 0.6090 Overtime 19.5000 x 4% 0.7800 26.0000 x 4% 1.0400W.C.I. 6% Normal Time 15.2245 x 6% 0.9135 Overtime 19.5000 x 6% 1.1700 26.0000 x 6% 1.5600Charge Rate 17.4981 21.4500 28.6000 Overtime Premium 1 3.9519 Overtime Premium 2 11.1019

Management Accounting in Australia - Solutions
78
Time Sheet Analysis: 240 Direct Total Hours Worked 300 60 Indirect Normal Time 245 Overtime 1 35 Overtime 2 20
Accrual: Debit Credit Work in Process Direct Hrs 240 x Ch Rate 17.4981 4,200 Factory Overhead Control Indirect Hrs 60 x Ch Rate 17.4981 1,050 Factory Overhead Control Overtime Hrs 35 x O.T. Pre 3.9519 138 Factory Overhead Control Overtime Hrs 20 x O.T. Pre 11.1019 222 Accrued Payroll Normal Time 245 x Base Rate 13.0000 4,388 Overtime 35 x O.T. Base 19.5000 Overtime 20 x O.T. Base 26.0000 Accrued Annual Leave Normal Time 245 x Leave Rate 1.3578 333 Accrued Public Holiday Normal Time 245 x Hol Rate 0.5778 142 Accrued Sick Leave Normal Time 245 x Hol Rate 0.2889 71 Accrued Super Normal Time 245 x Hol Rate 0.7511 184 Accrued Payroll Tax Normal Time 245 x Hol Rate 0.6090 197 Overtime 35 x O/time Rate 0.7800 Overtime 20 x O/time Rate 1.0400 Accrued W. C. I. Normal Time 245 x Hol Rate 0.9135 295 Overtime 35 x O/time Rate 1.1700 Overtime 20 x O/time Rate 1.5600
5,610 5,610
Payment: Debit Credit Accrued Payroll Normal Time 245 x Base Rate 13.0000 4,388 Overtime 35 x O.T. Base 19.5000 Overtime 20 x O. T. Base 26.0000 Accrued Sick Leave Hrs Sick 35 x Base Rate 13.0000 455 Accrued Annual Leave Hrs Paid 140 x Base Rate 13.0000 2,139 + Plus Loading 1.175 Accrued Public Holidays Hrs Paid 70 x Base Rate 13.0000 910 Super Withheld Normal Time 245 x Base Rate 13.0000 273 @ ..% Hrs Sick 35 x Base Rate 13.0000 Hrs Paid 140 x Base Rate 13.0000 Tax Withheld Debits $ 6,981 x Tax Rate 33.33% 2,327 @ ..% Union Dues 60 Medical Insurance 340 Bank Missing Figure 4,891
7,891 7,891
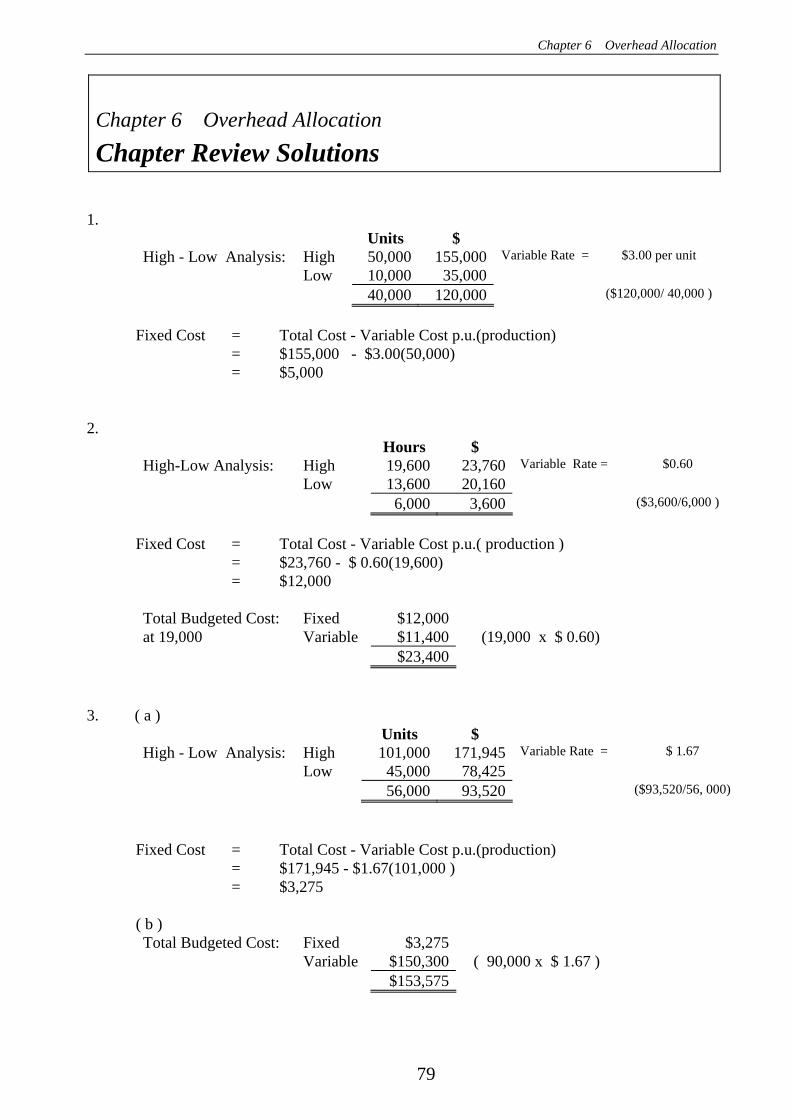
Chapter 6 Overhead Allocation
79
Chapter 6 Overhead Allocation
Chapter Review Solutions
1. Units $ High - Low Analysis: High 50,000 155,000 Variable Rate = $3.00 per unit Low 10,000 35,000 40,000 120,000 ($120,000/ 40,000 )
Fixed Cost = Total Cost - Variable Cost p.u.(production) = $155,000 - $3.00(50,000) = $5,000
2. Hours $ High-Low Analysis: High 19,600 23,760 Variable Rate = $0.60 Low 13,600 20,160 6,000 3,600 ($3,600/6,000 )
Fixed Cost = Total Cost - Variable Cost p.u.( production ) = $23,760 - $ 0.60(19,600) = $12,000 Total Budgeted Cost: Fixed $12,000 at 19,000 Variable $11,400 (19,000 x $ 0.60)
$23,400
3. ( a ) Units $ High - Low Analysis: High 101,000 171,945 Variable Rate = $ 1.67 Low 45,000 78,425 56,000 93,520 ($93,520/56, 000)
Fixed Cost = Total Cost - Variable Cost p.u.(production) = $171,945 - $1.67(101,000 ) = $3,275 ( b ) Total Budgeted Cost: Fixed $3,275 Variable $150,300 ( 90,000 x $ 1.67 )
$153,575

Management Accounting in Australia - Solutions
80
4. ( a ) Units $ High - Low Analysis: High 21,500 216,100 Variable Rate = $ 9.40 Low 15,000 155,000 6,500 61,100 ($ 61,100 / 6,500 )
Fixed Cost = Total Cost - Variable Cost p.u.(production) = $216,100 - 9.40( 21,500 ) = $14,000 ( b ) Total Budgeted Cost: Fixed $14,000 Variable 188,000 (20,000 x $9.40)
$ 202,000
5. ( a ) Units $ High - Low Analysis: High 180 40,000 Variable Rate = $182.50 Low 20 10,800 160 29,200 ($29,200/160 )
Fixed Cost = Total Cost - Variable Cost p.u.(production) = $40,000 - $182.50( 180 ) = $7,150 ( b ) Units Produced: 45 (3,600 D.L.H./ 80 D.L.H.) Total Budgeted Cost: Fixed $ 7,150 Variable $ 8,212.50 ( 45 x $ 182.50 )
$ 15,362.50
6. ( a ) Direct Labour Variable Direct Materials Variable Indirect Labour Semi Variable Indirect Materials Semi Variable Rent Fixed Power and lighting Semi Variable Administration Fixed Insurance Fixed

Chapter 6 Overhead Allocation
81
( b ) Costs Alternative 1 Alternative 2 Difference Production units 100,000 150,000 50,000 Indirect labour 25,000 30,000 5,000 Indirect material 8,000 10,000 2,000 Power and lighting 9,500 12,500 3,000 Indirect Labour Variable cost per unit = 5,000 / 50,000 = $0.10 Fixed cost = 25,000 - ( 100,000 x 0.10 ) = 15,000 Indirect Material Variable cost per unit = 2,000 / 50,000 = $0.04 Fixed cost = 8,000 - ( 100,000 x 0.04 ) = 4,000 Power and lighting Variable cost per unit = 3,000 / 50,000 = $0.06 Fixed cost = 9,500 - ( 100,000 x 0.06 ) = 3,500
( c ) Cost budget Production in units 120,000 Budgeted costs: Direct labour 24,000 Direct materials 60,000 Indirect labour 27,000 Indirect materials 8,800 Rent 15,000 Power and lighting 10,700 Administration 10,500 Insurance 5,000 Total costs 161,000
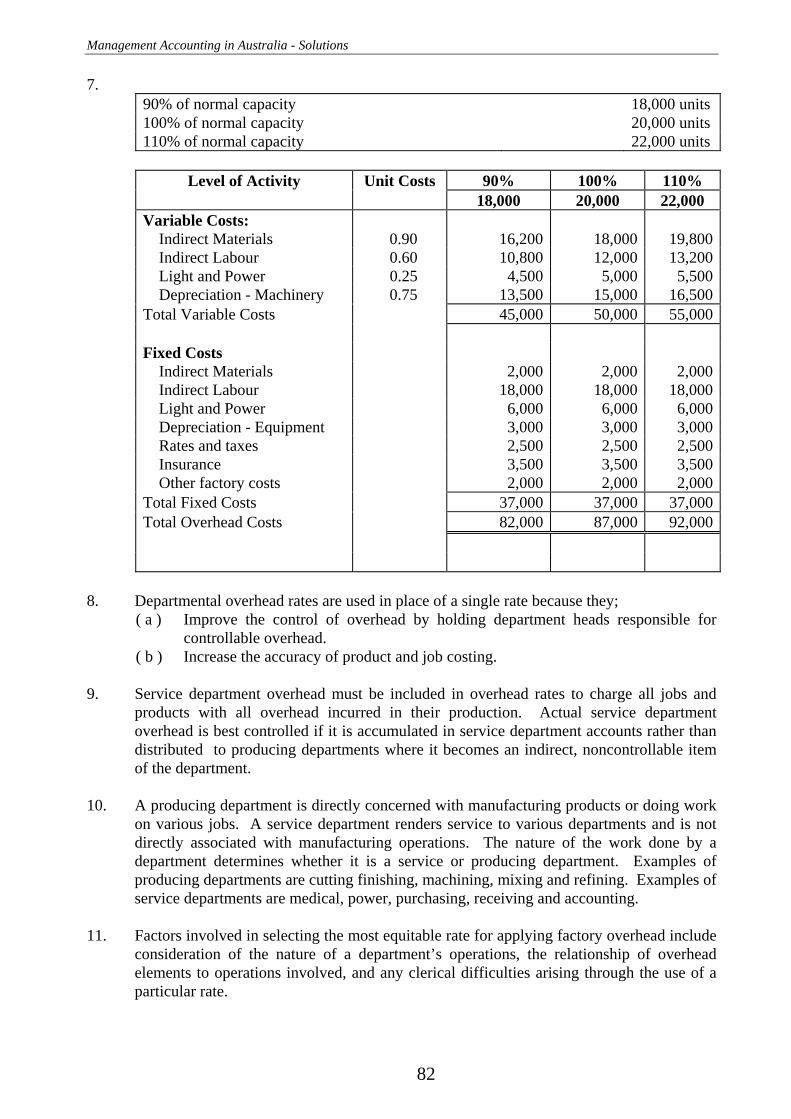
Management Accounting in Australia - Solutions
82
7. 90% of normal capacity 18,000 units 100% of normal capacity 20,000 units 110% of normal capacity 22,000 units
Level of Activity Unit Costs 90% 100% 110%
18,000 20,000 22,000 Variable Costs: Indirect Materials 0.90 16,200 18,000 19,800 Indirect Labour 0.60 10,800 12,000 13,200 Light and Power 0.25 4,500 5,000 5,500 Depreciation - Machinery 0.75 13,500 15,000 16,500Total Variable Costs 45,000 50,000 55,000 Fixed Costs Indirect Materials 2,000 2,000 2,000 Indirect Labour 18,000 18,000 18,000 Light and Power 6,000 6,000 6,000 Depreciation - Equipment 3,000 3,000 3,000 Rates and taxes 2,500 2,500 2,500 Insurance 3,500 3,500 3,500 Other factory costs 2,000 2,000 2,000Total Fixed Costs 37,000 37,000 37,000Total Overhead Costs 82,000 87,000 92,000
8. Departmental overhead rates are used in place of a single rate because they;
( a ) Improve the control of overhead by holding department heads responsible for controllable overhead.
( b ) Increase the accuracy of product and job costing.
9. Service department overhead must be included in overhead rates to charge all jobs and products with all overhead incurred in their production. Actual service department overhead is best controlled if it is accumulated in service department accounts rather than distributed to producing departments where it becomes an indirect, noncontrollable item of the department.
10. A producing department is directly concerned with manufacturing products or doing work on various jobs. A service department renders service to various departments and is not directly associated with manufacturing operations. The nature of the work done by a department determines whether it is a service or producing department. Examples of producing departments are cutting finishing, machining, mixing and refining. Examples of service departments are medical, power, purchasing, receiving and accounting.
11. Factors involved in selecting the most equitable rate for applying factory overhead include consideration of the nature of a department’s operations, the relationship of overhead elements to operations involved, and any clerical difficulties arising through the use of a particular rate.

Chapter 6 Overhead Allocation
83
12. Direct Method Service Departments Production Departments
Office Stores Assembly Finishing Total $ 60,000 $ 15,000 $ 80,000 $ 45,000 $200,000 - 60,000 37,500 22,500 Reallocation Office
- 15,000 9,000 6,000 0 0 $126,500 $ 73,500 $200,000
Recovery Rate: Assembly $14.06 per M.Hr ($126,500 / 9,000 Mach. Hrs.) Finishing $12.25 per D.L.H. ($73,500 / 6,000 D. L. H.) Plant Wide $25.00 per D.L.H. ($200,000 / 8,000 D. L. H.)
13. ( a ) Production Departments Service Departments
Cutting Machining Finishing Stores Repairs Total $ 23,400 $ 27,900 $ 26,120 $ 25,700 $ 10,500 $ 113,620 15,420 7,710 2,570 - 25,700
1,313 6,562 2,625 - 10,500 $ 40,133 $ 42,173 $ 31,315 0 0 $ 113,620
( b ) Recovery Rate: Cutting $1.00 per D.L.H. ($ 40,133 / 40,133 D.L.H.) Machining $2.00 per M..Hr. ($ 42,173 / 21,086 Mach. Hr) Finishing $4.00 per D.L.H. ($ 31,315 / 7,828 D. L. H.) ( c ) Plant wide Rate: $2.30 per D.L.H. ($ 113,620 / 49,400 D. L. H.)
14. Direct Method Producing Departments Service Departments Total
Cutting Assembly Stores Utilities $ 21,000 $ 13,000 $ 5,000 $ 2,200 $ 41,200 4,500 500 - 5,000 1,100 1,100 - 2,200 $ 26,600 $ 14,600 0 0 $ 41,200
Recovery Rate: Cutting $8.00 per M..Hr ($ 26,600 / 3,325 Mach. Hr) Machining $5.00 per D.L.H. ($ 14,600 / 2,920 D.L.H.) Plant Wide $7.10 per D.L.H. ($ 41,200 / 5,800 D.L.H.)

Management Accounting in Australia - Solutions
84
15. Direct Method Production
Departments Service
Department Total
Basis A B X
Rates $ 600 $ 600 $ 300 $ 1,500 Floor Area Insurance 800 800 400 2,000 " Maintenance 2,000 2,000 1,000 5,000 " Depreciation 7,500 5,000 2,500 15,000 Plant Value Electricity 2,000 600 400 3,000 Power (kwt.) Indirect Labour 1,500 1,200 600 3,300 Actual Indirect Material 600 400 500 1,500 Actual Total $15,000 $10,600 $5,700 $31,300 Redistribution 3,420 2,280 - 5,700 Total $18,420 $12,880 0 $31,300
Recovery Rate: A $5.00 per Mach Hrs ($18,420 / 3,684 M.Hrs) B 80% D.L.C. ($12,880 / $ 16,100)
16. ( a ) Direct Method Producing Service
Total Machining Assembly Stores Basis Of AllocationIndirect Material $23,000 $14,000 $8,000 $1,000 actual Indirect Labour 30,000 15,000 10,000 5,000 actual Rates & Rent 5,000 2,000 2,500 500 area Insurance -Plant 11,000 9,000 2,000 0 $ plant Ins -Building 5,000 2,000 2,500 500 area Depn. -Plant 22,000 18,000 4,000 0 $ plant Depn. -Building 4,000 1,600 2,000 400 area Power 10,000 8,000 2,000 0 Power units Total $110,000 $69,600 $33,000 $7,400 Redistribution 4,400 3,000 - 7,400 No. of Requisitions Factory O / H $110,000 $74,000 $36,000 $ 0
Recovery Rate: Machining $4.00 per D.L.H. ($74,000 / 18,500 D.L.H.) Assembly $1.00 per D.L.H. ($36,000 / 36,000 D.L.H.) ( b ) Plantwide $2.0183 per D.L.H ($110,000 / 54,500 D.L.H.) ( c ) ( i ) Job No. 1 $20.18 (10 hrs x $2.0183) Job No. 2 $20.18 (10 hrs x $2.0183) ( ii ) Job No. 1: Machining $32 (8 hrs @ $4.00) Assembly $ 2 (2 hrs @ $1.00) Total $34 Job No. 2: Machining $ 8 (2 hrs @ $4.00) Assembly $ 8 (8 hrs @ $1.00 ) Total $16
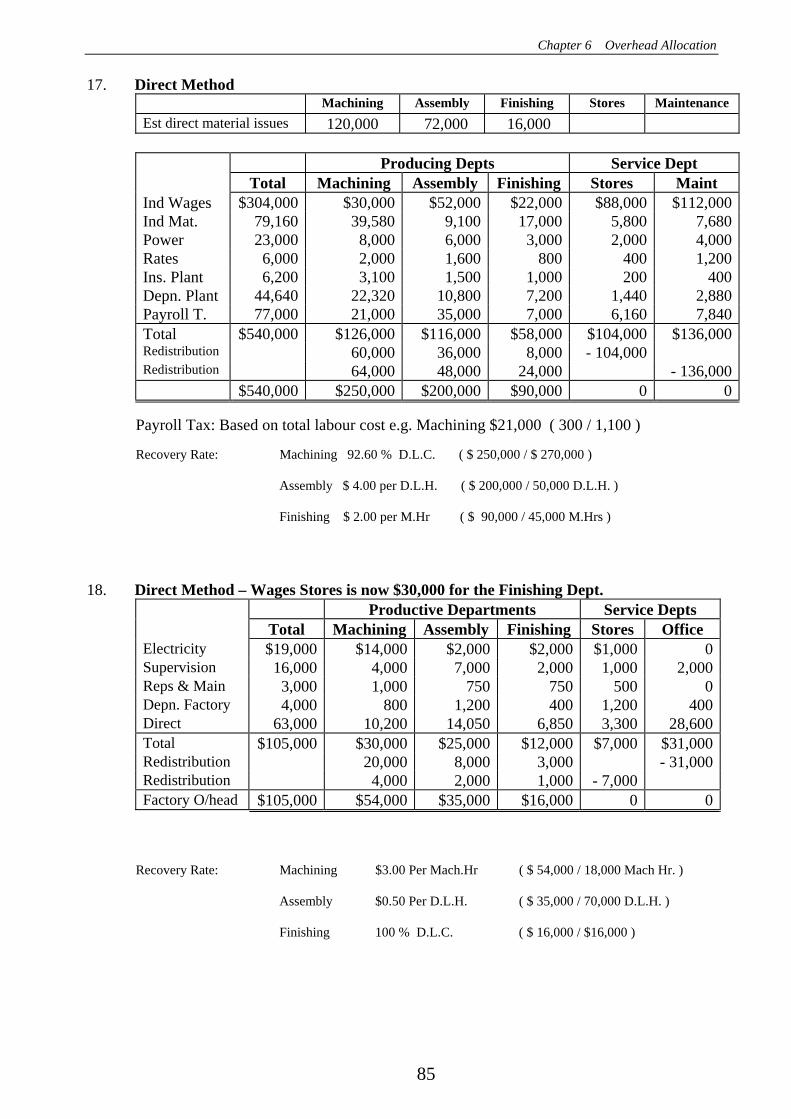
Chapter 6 Overhead Allocation
85
17. Direct Method Machining Assembly Finishing Stores Maintenance Est direct material issues 120,000 72,000 16,000
Producing Depts Service Dept
Total Machining Assembly Finishing Stores Maint Ind Wages $304,000 $30,000 $52,000 $22,000 $88,000 $112,000Ind Mat. 79,160 39,580 9,100 17,000 5,800 7,680Power 23,000 8,000 6,000 3,000 2,000 4,000Rates 6,000 2,000 1,600 800 400 1,200Ins. Plant 6,200 3,100 1,500 1,000 200 400Depn. Plant 44,640 22,320 10,800 7,200 1,440 2,880Payroll T. 77,000 21,000 35,000 7,000 6,160 7,840Total $540,000 $126,000 $116,000 $58,000 $104,000 $136,000Redistribution 60,000 36,000 8,000 - 104,000 Redistribution 64,000 48,000 24,000 - 136,000 $540,000 $250,000 $200,000 $90,000 0 0
Payroll Tax: Based on total labour cost e.g. Machining $21,000 ( 300 / 1,100 ) Recovery Rate: Machining 92.60 % D.L.C. ( $ 250,000 / $ 270,000 ) Assembly $ 4.00 per D.L.H. ( $ 200,000 / 50,000 D.L.H. ) Finishing $ 2.00 per M.Hr ( $ 90,000 / 45,000 M.Hrs )
18. Direct Method – Wages Stores is now $30,000 for the Finishing Dept.
Productive Departments Service Depts Total Machining Assembly Finishing Stores Office
Electricity $19,000 $14,000 $2,000 $2,000 $1,000 0Supervision 16,000 4,000 7,000 2,000 1,000 2,000Reps & Main 3,000 1,000 750 750 500 0Depn. Factory 4,000 800 1,200 400 1,200 400Direct 63,000 10,200 14,050 6,850 3,300 28,600Total $105,000 $30,000 $25,000 $12,000 $7,000 $31,000Redistribution 20,000 8,000 3,000 - 31,000Redistribution 4,000 2,000 1,000 - 7,000 Factory O/head $105,000 $54,000 $35,000 $16,000 0 0
Recovery Rate: Machining $3.00 Per Mach.Hr ( $ 54,000 / 18,000 Mach Hr. ) Assembly $0.50 Per D.L.H. ( $ 35,000 / 70,000 D.L.H. ) Finishing 100 % D.L.C. ( $ 16,000 / $16,000 )

Management Accounting in Australia - Solutions
86
19. Activity based costing takes account of the fact that many activities affect costs other than just volume. It is a method of assigning costs to goods and services that assumes all costs vary with the activities used to produce goods and services.
20. A cost driver is an activity which causes ( drives ) a cost to vary.
Examples include, direct labour hours, machine hours, floor space.
21. ( i ) Identify the activities or transactions ( cost drivers ) that incur costs
( ii ) Assign a cost to each cost driver ( iii ) Sum the costs of the cost drivers that make up the product.

Chapter 7 Job Costing - Solutions
87
Chapter 7 Job Costing Chapter Review Solutions
1.
1 2 3 4 Total R.M.C. Op Bal 3,000 1,000 4,000 April 500 4,000 1,100 5,600 Labour Op Bal 1,500 500 2,000 April 1,200 600 3,000 1,050 5,850 Overhead Op Bal 1,500 500 2,000 April 1,200 600 3,000 1,050 5,850 8,400 3,700 10,000 3,200 25,300 Fin Goods 8,400 3,700 12,100 C.O.G.S. 8,400 8,400
( i ) Work In Progress Bal b/d 8,000 Finished Goods 12,100 Materials 5,600 Labour 5,850 Balance 13,200 Overhead 5,850 25,300 25,300
( ii ) Finished Goods W.I.P. 12,100 C.O.G.S. 8,400 Balance 3,700 12,100 12,100
2 ( i ) Overhead recovery rate = 300/15 = $20 per hour
( ii ) JOB CARD NAME OF CLIENT: Nick Easter $ LABOUR COSTS Partners 10 hours @ $100 per hour 1,000 Staff 20 hours @ $ 50 per hour 1,000 COMPUTER COSTS Computer Time 10 hours @ $40 per hour 400 OVERHEADS Overhead applied 30 hours @ $20 per hour 600 TOTAL COST 3,000 INVOICE PRICE $4,500
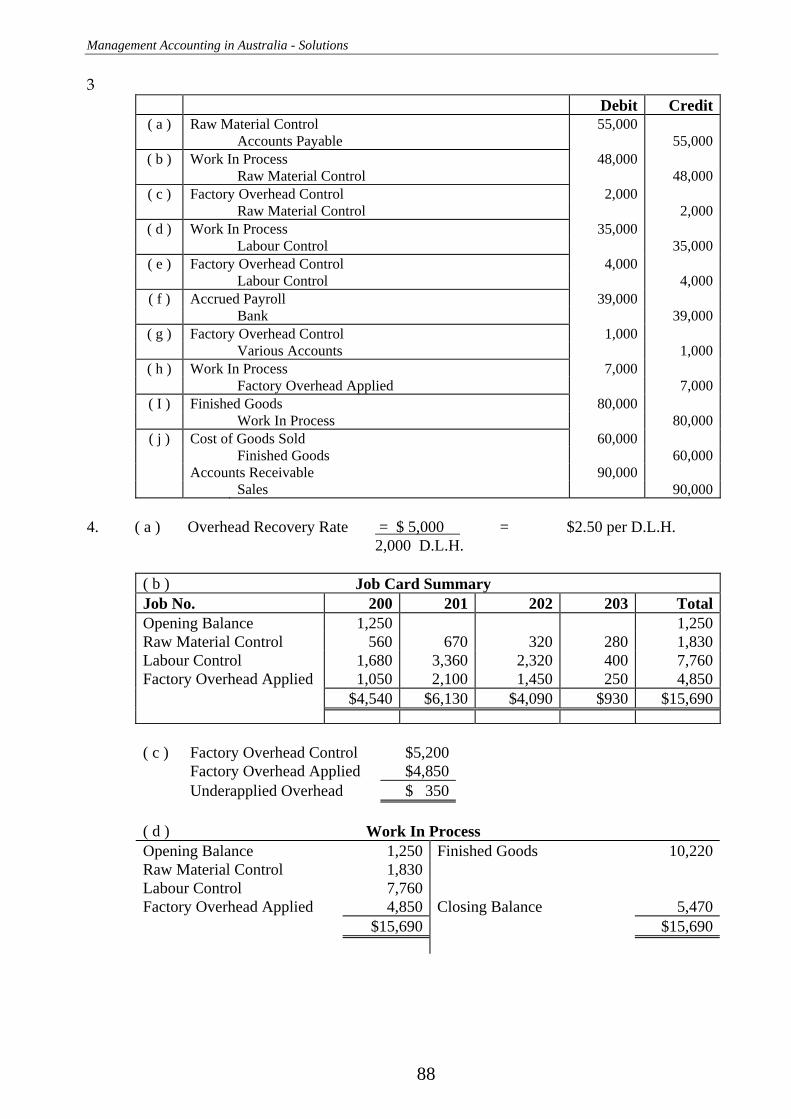
Management Accounting in Australia - Solutions
88
3 Debit Credit
( a ) Raw Material Control 55,000 Accounts Payable 55,000
( b ) Work In Process 48,000 Raw Material Control 48,000
( c ) Factory Overhead Control 2,000 Raw Material Control 2,000
( d ) Work In Process 35,000 Labour Control 35,000
( e ) Factory Overhead Control 4,000 Labour Control 4,000
( f ) Accrued Payroll 39,000 Bank 39,000
( g ) Factory Overhead Control 1,000 Various Accounts 1,000
( h ) Work In Process 7,000 Factory Overhead Applied 7,000
( I ) Finished Goods 80,000 Work In Process 80,000
( j ) Cost of Goods Sold 60,000 Finished Goods 60,000 Accounts Receivable 90,000 Sales 90,000
4. ( a ) Overhead Recovery Rate = $ 5,000 = $2.50 per D.L.H.
2,000 D.L.H. ( b ) Job Card Summary Job No. 200 201 202 203 TotalOpening Balance 1,250 1,250Raw Material Control 560 670 320 280 1,830Labour Control 1,680 3,360 2,320 400 7,760Factory Overhead Applied 1,050 2,100 1,450 250 4,850 $4,540 $6,130 $4,090 $930 $15,690
( c ) Factory Overhead Control $5,200 Factory Overhead Applied $4,850 Underapplied Overhead $ 350 ( d ) Work In Process Opening Balance 1,250 Finished Goods 10,220Raw Material Control 1,830 Labour Control 7,760 Factory Overhead Applied 4,850 Closing Balance 5,470 $15,690 $15,690

Chapter 7 Job Costing - Solutions
89
5. General Ledger Debit Credit Raw Material Control 80,000 Bank 80,000 Work In Process 60,000 Raw Material Control 60,000 Factory O/head Control 3,000 Raw Material Control 3,000 Raw Material Control 1,000 Factory O/head Control 1,000 Work In Process 30,000 Labour Control 30,000 Factory O/head Control 3,000 Labour Control 3,000 Labour Control 40,000 Accrued Payroll 40,000 Accrued Payroll 40,000 Bank 40,000 Factory O/head Control 2,000 Accumulated Depreciation 2,000 Factory O/head Control 3,000 Prepaid Rent 3,000 Factory O/head Applied 10,000 Factory O/head Control 10,000 Work In Process 10,000 Factory O/head Applied 10,000 Finished Goods 80,000 Work In Process 80,000 Cost of Goods Sold 50,000 Finished Goods 50,000 Accounts Receivable 90,000 Sales 90,000
6.
Debit Credit ( a ) Raw Material Control 45,900 Accounts Payable 45,900 ( b ) Accrued Payroll 60,000 Bank 60,000 ( c ) Work in Process 54,000 Factory Overhead Control 8,500 Labour Control 62,500 ( d ) Work in Process 37,300 Factory Overhead Control 7,400 Raw Material Control 44,700 ( e ) Factory Overhead Control 3,300 Accumulated Depreciation 3,300 ( f ) Factory Overhead Control 1,400 Various Accounts 1,400 ( g ) Factory Overhead Control 4,200 Prepaid Rent 4,200 ( h ) Work In Process 32,400 Factory Overhead Applied 32,400 ( i ) Finished Goods 126,900 Work In Process 126,900 ( j ) Cost of Goods Sold 125,000 Finished Goods 125,000 Accounts Receivable 198,000 Sales 198,000

Management Accounting in Australia - Solutions
90
7. ( a ) Job Cost Summary Card Job No. 38 39 40 41 42 43 TotalOpening Balance 6,500 2,500 9,000 Input Material 1,500 500 21,000 6,300 29,300Labour 1,000 300 11,000 2,800 15,100Factory O/h Applied 500 150 5,500 1,400 7,550Total 9,500 3,450 37,500 10,500 60,950
( b ) Debit CreditRaw Material Control 32,000 Accounts Payable 32,000Work In Process 29,300 Factory Overhead Control 700 Raw Material Control 30,000Work In Process 15,100 Factory Overhead Control 1,900 Labour Control 17,000Labour Control 17,000 Accrued Payroll 17,000Accrued Payroll 17,000 Bank 17,000Factory Overhead Control 4,900 Various Accounts 4,900Factory Overhead Applied 7,500 Factory Overhead Control 7,500Work In Process 7,550 Factory Overhead Applied 7,550Finished Goods 50,450 Work In Process 50,450Cost of Goods Sold 20,950 Finished Goods 20,950Accounts Receivable 23,000 Sales 23,000
( c ) Work In Process Opening Balance 9,000 Finished Goods 50,450Raw Material Control 29,300 Labour Control 15,100 Factory Overhead Applied 7,550 Closing Balance 10,500 60,950 60,950
Finished Goods Opening Balance 8,000 Cost of Goods Sold 20,950Work in Process 50,450 Closing Balance 37,500 58,450 58,450
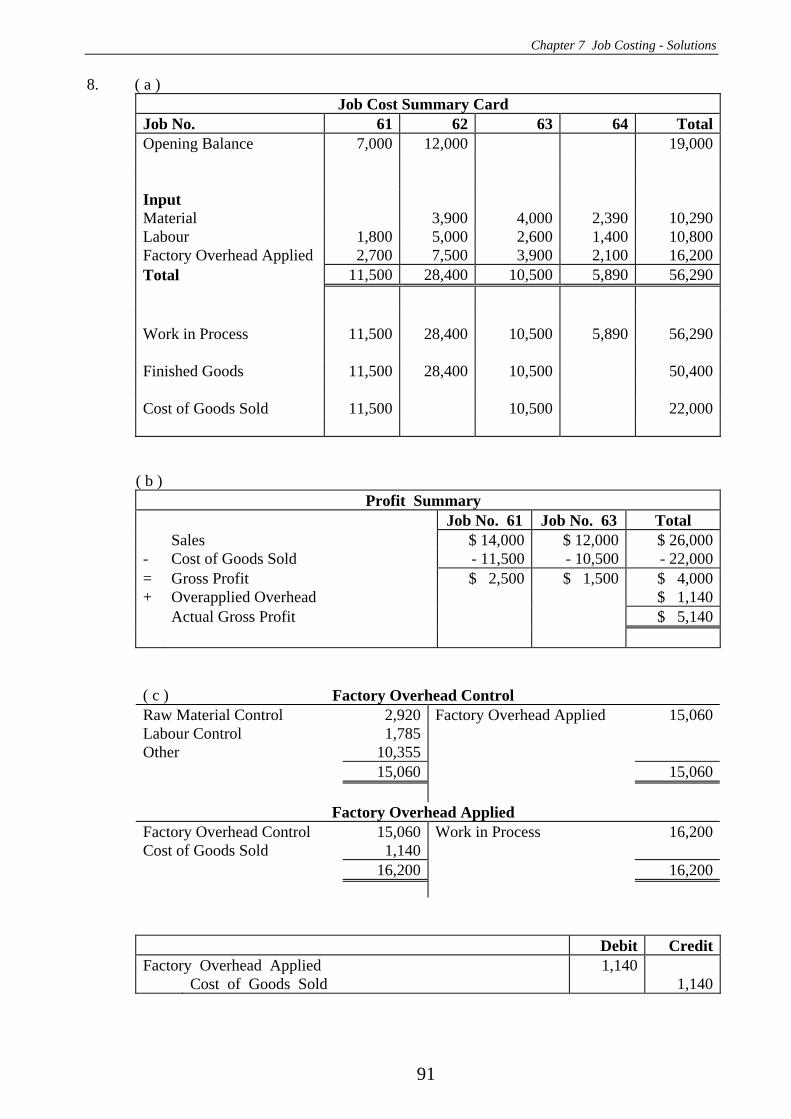
Chapter 7 Job Costing - Solutions
91
8. ( a ) Job Cost Summary Card Job No. 61 62 63 64 TotalOpening Balance 7,000 12,000 19,000 Input Material 3,900 4,000 2,390 10,290Labour 1,800 5,000 2,600 1,400 10,800Factory Overhead Applied 2,700 7,500 3,900 2,100 16,200Total 11,500 28,400 10,500 5,890 56,290 Work in Process 11,500 28,400 10,500 5,890 56,290 Finished Goods 11,500 28,400 10,500 50,400 Cost of Goods Sold 11,500 10,500 22,000
( b ) Profit Summary Job No. 61 Job No. 63 Total Sales $ 14,000 $ 12,000 $ 26,000- Cost of Goods Sold - 11,500 - 10,500 - 22,000= Gross Profit $ 2,500 $ 1,500 $ 4,000+ Overapplied Overhead $ 1,140 Actual Gross Profit $ 5,140
( c ) Factory Overhead Control Raw Material Control 2,920 Factory Overhead Applied 15,060Labour Control 1,785 Other 10,355 15,060 15,060 Factory Overhead Applied Factory Overhead Control 15,060 Work in Process 16,200Cost of Goods Sold 1,140 16,200 16,200
Debit CreditFactory Overhead Applied 1,140 Cost of Goods Sold 1,140
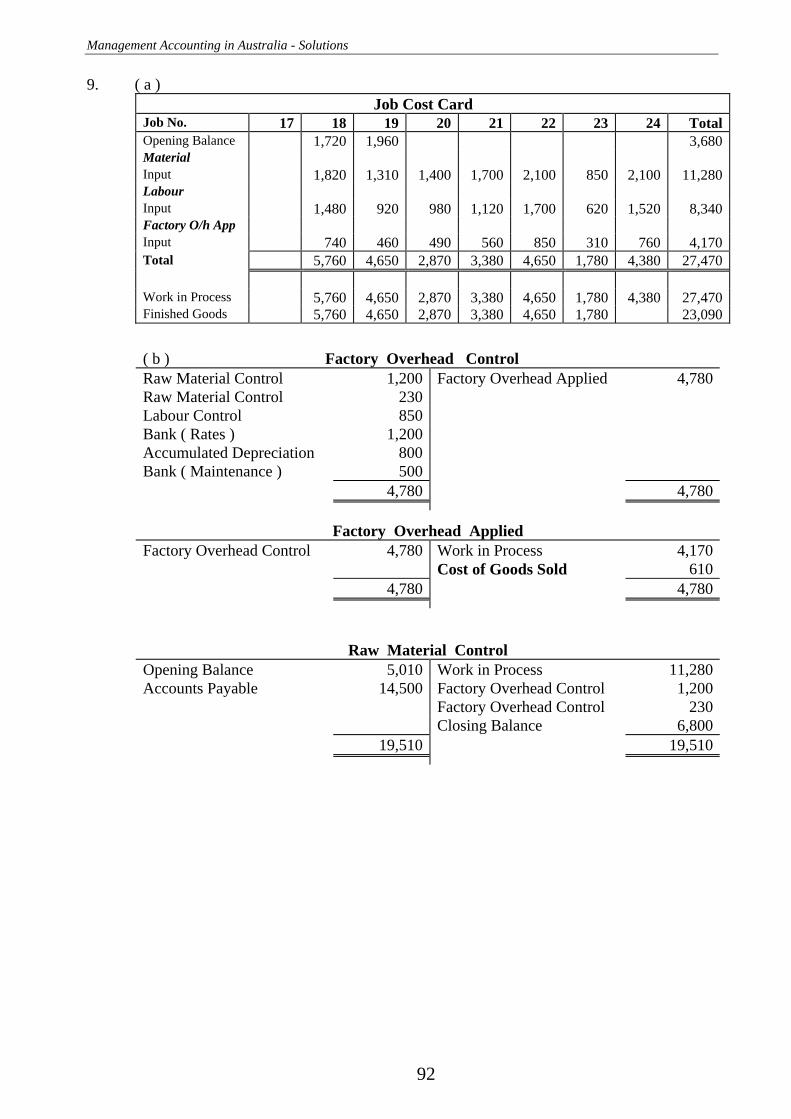
Management Accounting in Australia - Solutions
92
9. ( a ) Job Cost Card Job No. 17 18 19 20 21 22 23 24 TotalOpening Balance 1,720 1,960 3,680Material Input 1,820 1,310 1,400 1,700 2,100 850 2,100 11,280Labour Input 1,480 920 980 1,120 1,700 620 1,520 8,340Factory O/h App Input 740 460 490 560 850 310 760 4,170Total 5,760 4,650 2,870 3,380 4,650 1,780 4,380 27,470 Work in Process 5,760 4,650 2,870 3,380 4,650 1,780 4,380 27,470Finished Goods 5,760 4,650 2,870 3,380 4,650 1,780 23,090
( b ) Factory Overhead Control Raw Material Control 1,200 Factory Overhead Applied 4,780Raw Material Control 230 Labour Control 850 Bank ( Rates ) 1,200 Accumulated Depreciation 800 Bank ( Maintenance ) 500 4,780 4,780
Factory Overhead Applied Factory Overhead Control 4,780 Work in Process 4,170 Cost of Goods Sold 610 4,780 4,780
Raw Material Control Opening Balance 5,010 Work in Process 11,280Accounts Payable 14,500 Factory Overhead Control 1,200 Factory Overhead Control 230 Closing Balance 6,800 19,510 19,510
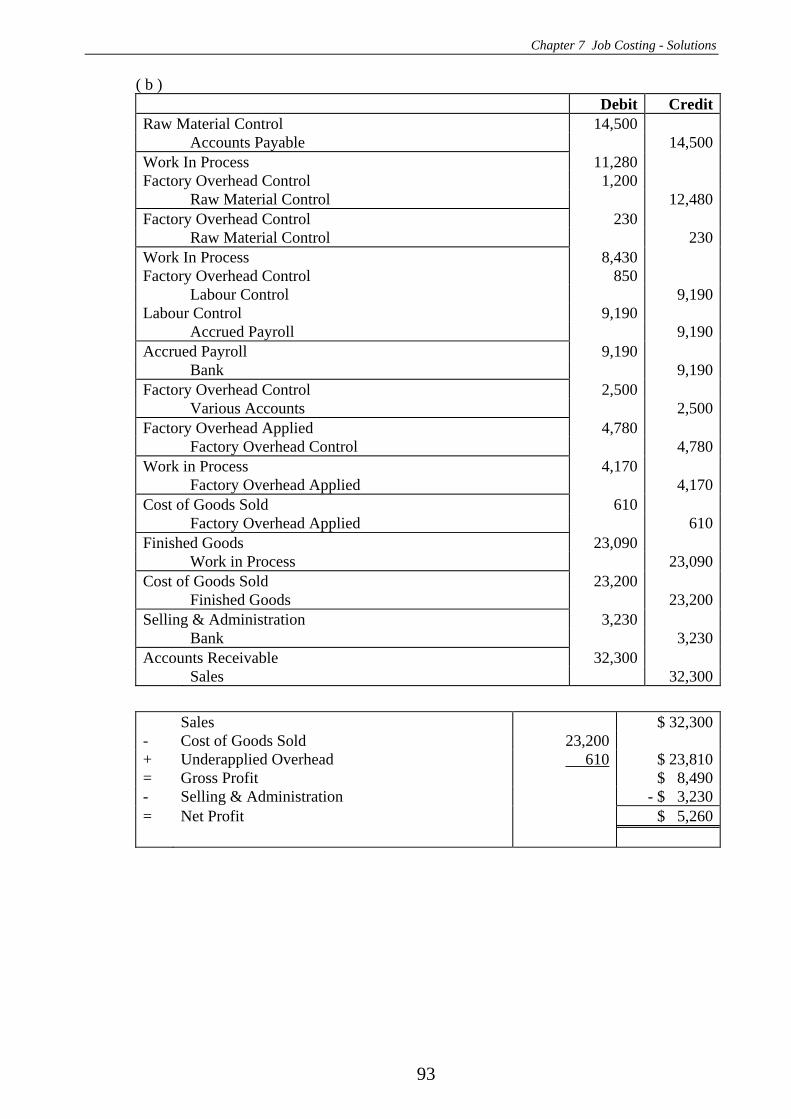
Chapter 7 Job Costing - Solutions
93
( b ) Debit CreditRaw Material Control 14,500 Accounts Payable 14,500Work In Process 11,280 Factory Overhead Control 1,200 Raw Material Control 12,480Factory Overhead Control 230 Raw Material Control 230Work In Process 8,430 Factory Overhead Control 850 Labour Control 9,190Labour Control 9,190 Accrued Payroll 9,190Accrued Payroll 9,190 Bank 9,190Factory Overhead Control 2,500 Various Accounts 2,500Factory Overhead Applied 4,780 Factory Overhead Control 4,780Work in Process 4,170 Factory Overhead Applied 4,170Cost of Goods Sold 610 Factory Overhead Applied 610Finished Goods 23,090 Work in Process 23,090Cost of Goods Sold 23,200 Finished Goods 23,200Selling & Administration 3,230 Bank 3,230Accounts Receivable 32,300 Sales 32,300
Sales $ 32,300- Cost of Goods Sold 23,200 + Underapplied Overhead 610 $ 23,810= Gross Profit $ 8,490- Selling & Administration - $ 3,230= Net Profit $ 5,260

Management Accounting in Australia - Solutions
94
10. Job Cost Card Job No. 35 36 37 38 39 40 41 TotalOpening Balance 900 700 1,600 Input Material 60 2,100 1,345 1,690 4,295 9,490 Labour 520 1,100 2,650 1,630 140 6,040 Factory O/H Appl 312 660 1,590 978 84 3,624 Total 1,792 4,560 5,585 4,298 4,519 20,754 Work in Process 1,792 4,560 5,585 4,298 4,519 20,754 Finished Goods 1,792 4,560 5,585 4,298 16,235 Cost of Goods Sold 1,600 1,300 1,792 4,560 5,585 14,837
Debit CreditRaw Material Control 19,430 Accounts Payable 19,430Work In Process 9,490 Factory Overhead Control 710 Raw Material Control 10,200Work in Process 6,040 Factory Overhead Control 990 Labour Control 7,030Labour Control 7,030 Accrued Payroll 7,030Accrued Payroll 7,030 Bank 7,030Factory Overhead Control 2,090 Various Accounts 2,090Factory Overhead Applied 3,790 Factory Overhead Control 3,790Work in Process 3,624 Factory Overhead Applied 3,624Cost of Goods Sold 166 Factory Overhead Applied 166Finished Goods 16,235 Work in Process 16,235Cost of Goods Sold 14,837 Finished Goods 14,837Accounts Receivable ( Debtors ) 17,550 Sales 17,550
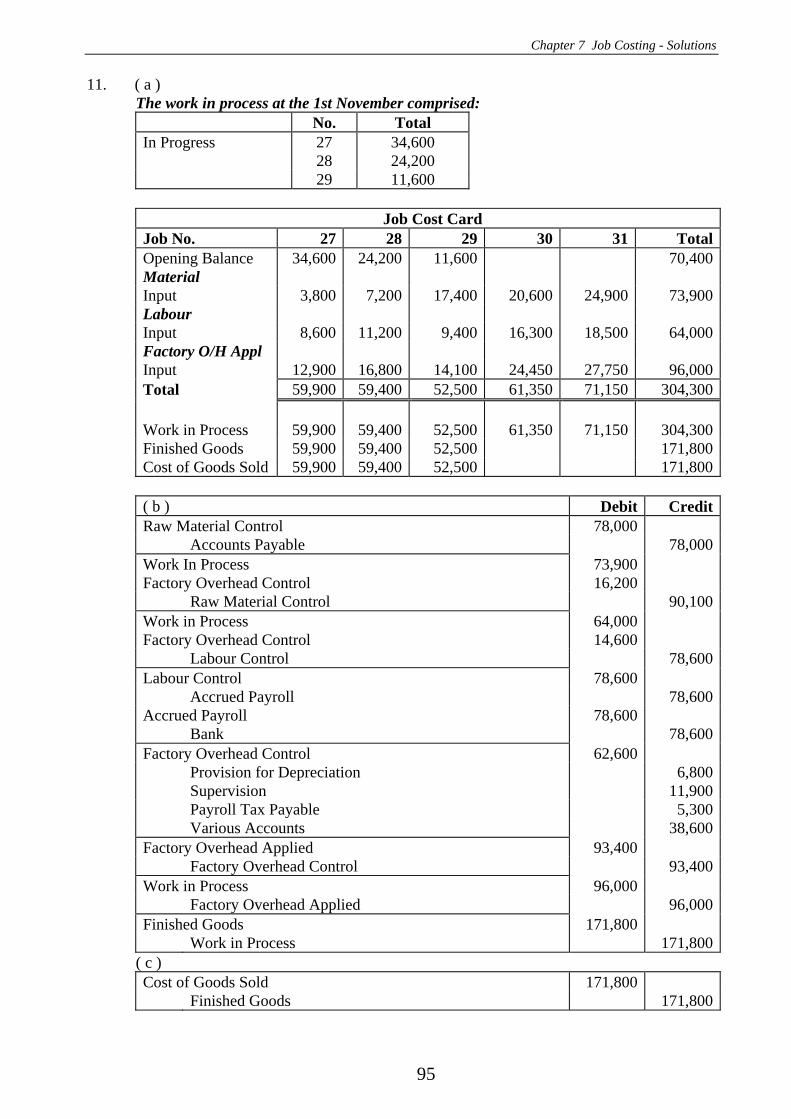
Chapter 7 Job Costing - Solutions
95
11. ( a ) The work in process at the 1st November comprised:
No. Total In Progress 27 34,600 28 24,200 29 11,600
Job Cost Card Job No. 27 28 29 30 31 TotalOpening Balance 34,600 24,200 11,600 70,400Material Input 3,800 7,200 17,400 20,600 24,900 73,900Labour Input 8,600 11,200 9,400 16,300 18,500 64,000Factory O/H Appl Input 12,900 16,800 14,100 24,450 27,750 96,000Total 59,900 59,400 52,500 61,350 71,150 304,300 Work in Process 59,900 59,400 52,500 61,350 71,150 304,300Finished Goods 59,900 59,400 52,500 171,800Cost of Goods Sold 59,900 59,400 52,500 171,800
( b ) Debit CreditRaw Material Control 78,000 Accounts Payable 78,000Work In Process 73,900 Factory Overhead Control 16,200 Raw Material Control 90,100Work in Process 64,000 Factory Overhead Control 14,600 Labour Control 78,600Labour Control 78,600 Accrued Payroll 78,600Accrued Payroll 78,600 Bank 78,600Factory Overhead Control 62,600 Provision for Depreciation 6,800 Supervision 11,900 Payroll Tax Payable 5,300 Various Accounts 38,600Factory Overhead Applied 93,400 Factory Overhead Control 93,400Work in Process 96,000 Factory Overhead Applied 96,000Finished Goods 171,800 Work in Process 171,800
( c ) Cost of Goods Sold 171,800 Finished Goods 171,800
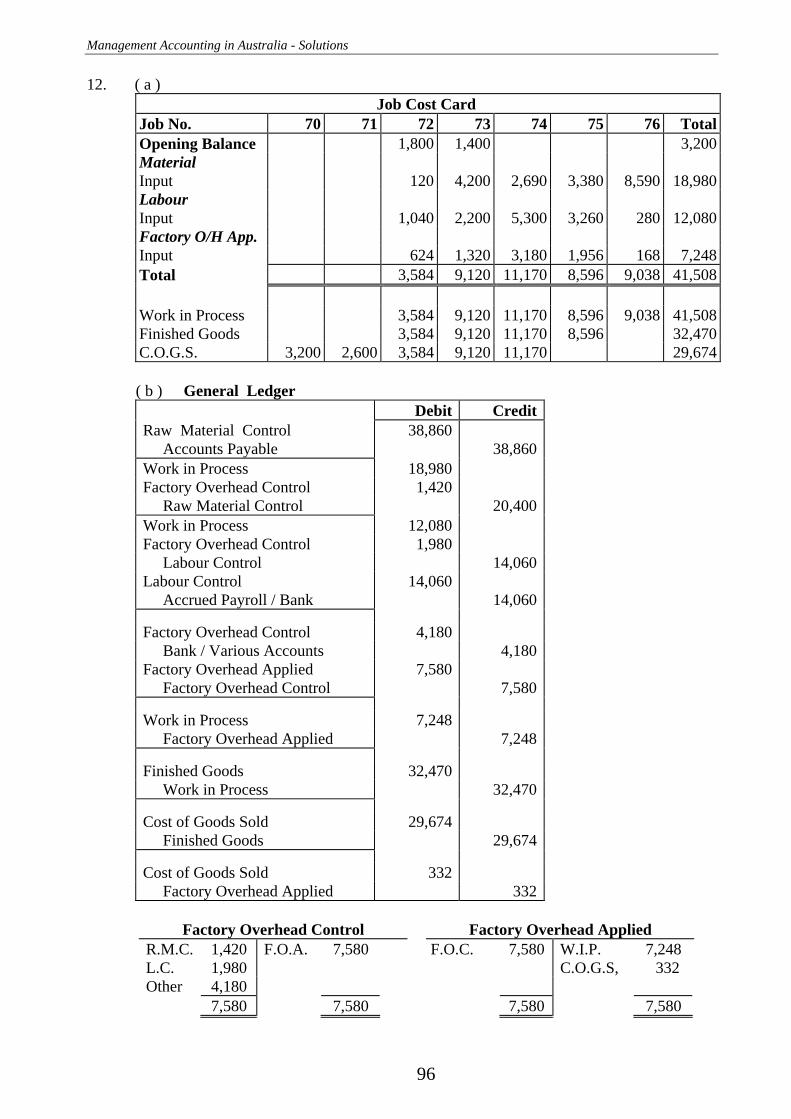
Management Accounting in Australia - Solutions
96
12. ( a ) Job Cost Card Job No. 70 71 72 73 74 75 76 TotalOpening Balance 1,800 1,400 3,200Material Input 120 4,200 2,690 3,380 8,590 18,980Labour Input 1,040 2,200 5,300 3,260 280 12,080Factory O/H App. Input 624 1,320 3,180 1,956 168 7,248Total 3,584 9,120 11,170 8,596 9,038 41,508 Work in Process 3,584 9,120 11,170 8,596 9,038 41,508Finished Goods 3,584 9,120 11,170 8,596 32,470C.O.G.S. 3,200 2,600 3,584 9,120 11,170 29,674 ( b ) General Ledger
Debit CreditRaw Material Control 38,860 Accounts Payable 38,860Work in Process 18,980Factory Overhead Control 1,420 Raw Material Control 20,400Work in Process 12,080Factory Overhead Control 1,980 Labour Control 14,060Labour Control 14,060 Accrued Payroll / Bank 14,060
Factory Overhead Control 4,180 Bank / Various Accounts 4,180Factory Overhead Applied 7,580 Factory Overhead Control 7,580
Work in Process 7,248 Factory Overhead Applied 7,248
Finished Goods 32,470 Work in Process 32,470
Cost of Goods Sold 29,674 Finished Goods 29,674
Cost of Goods Sold 332 Factory Overhead Applied 332
Factory Overhead Control Factory Overhead Applied
R.M.C. 1,420 F.O.A. 7,580 F.O.C. 7,580 W.I.P. 7,248 L.C. 1,980 C.O.G.S, 332 Other 4,180 7,580 7,580 7,580 7,580
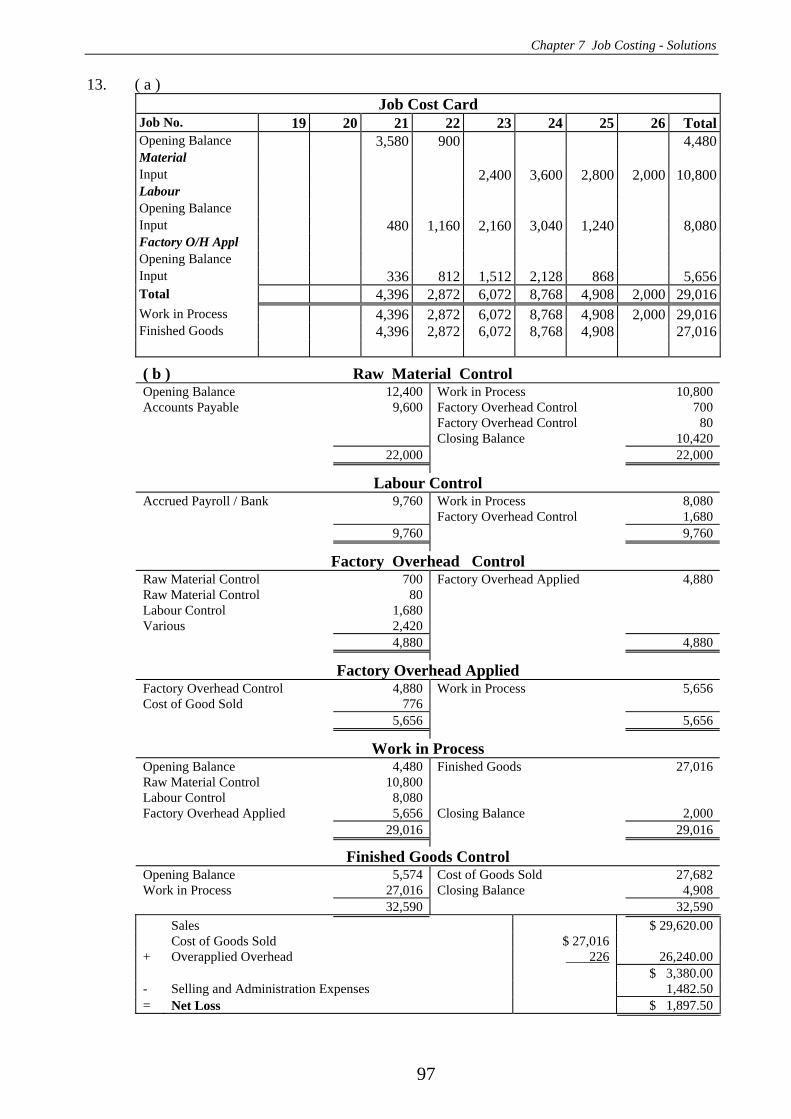
Chapter 7 Job Costing - Solutions
97
13. ( a ) Job Cost Card
Job No. 19 20 21 22 23 24 25 26 TotalOpening Balance 3,580 900 4,480Material Input 2,400 3,600 2,800 2,000 10,800Labour Opening Balance Input 480 1,160 2,160 3,040 1,240 8,080Factory O/H Appl Opening Balance Input 336 812 1,512 2,128 868 5,656Total 4,396 2,872 6,072 8,768 4,908 2,000 29,016Work in Process 4,396 2,872 6,072 8,768 4,908 2,000 29,016Finished Goods 4,396 2,872 6,072 8,768 4,908 27,016
( b ) Raw Material Control Opening Balance 12,400 Work in Process 10,800 Accounts Payable 9,600 Factory Overhead Control 700 Factory Overhead Control 80 Closing Balance 10,420 22,000 22,000
Labour Control Accrued Payroll / Bank 9,760 Work in Process 8,080 Factory Overhead Control 1,680 9,760 9,760
Factory Overhead Control Raw Material Control 700 Factory Overhead Applied 4,880 Raw Material Control 80 Labour Control 1,680 Various 2,420 4,880 4,880
Factory Overhead Applied Factory Overhead Control 4,880 Work in Process 5,656 Cost of Good Sold 776 5,656 5,656
Work in Process Opening Balance 4,480 Finished Goods 27,016 Raw Material Control 10,800 Labour Control 8,080 Factory Overhead Applied 5,656 Closing Balance 2,000 29,016 29,016
Finished Goods Control Opening Balance 5,574 Cost of Goods Sold 27,682 Work in Process 27,016 Closing Balance 4,908 32,590 32,590 Sales $ 29,620.00 Cost of Goods Sold $ 27,016 + Overapplied Overhead 226 26,240.00 $ 3,380.00 - Selling and Administration Expenses 1,482.50 = Net Loss $ 1,897.50
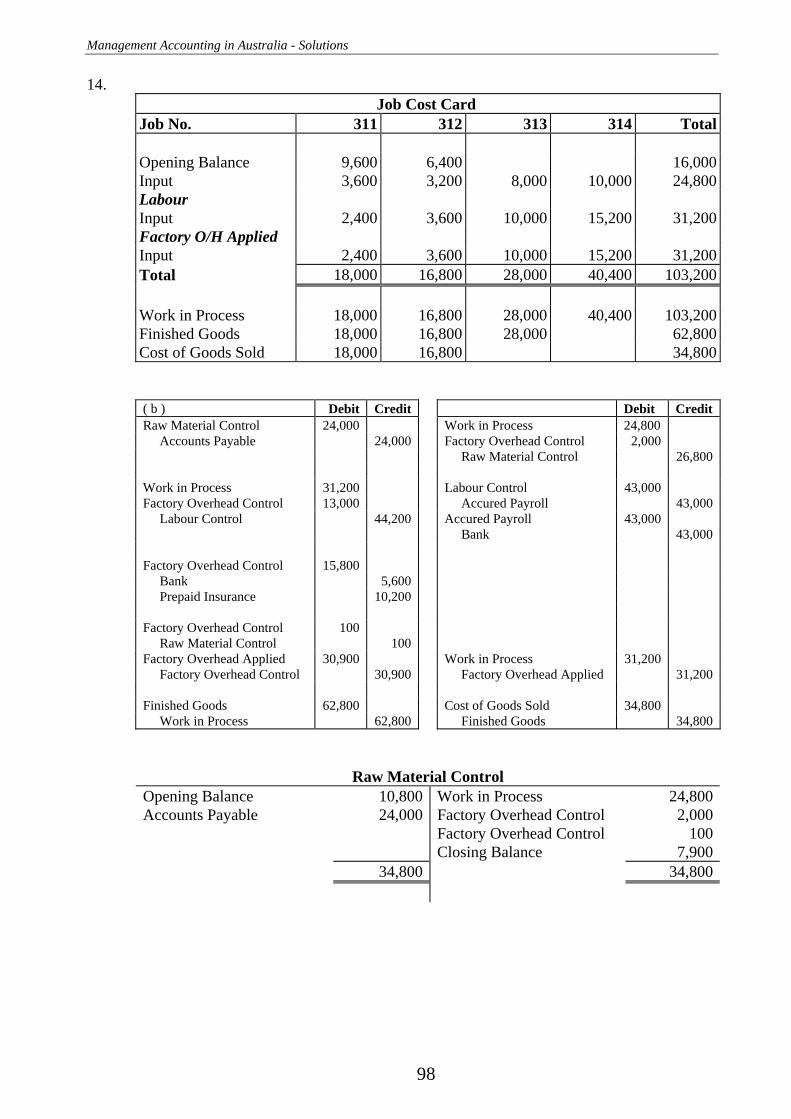
Management Accounting in Australia - Solutions
98
14. Job Cost Card Job No. 311 312 313 314 Total Opening Balance 9,600 6,400 16,000Input 3,600 3,200 8,000 10,000 24,800Labour Input 2,400 3,600 10,000 15,200 31,200Factory O/H Applied Input 2,400 3,600 10,000 15,200 31,200Total 18,000 16,800 28,000 40,400 103,200 Work in Process 18,000 16,800 28,000 40,400 103,200Finished Goods 18,000 16,800 28,000 62,800Cost of Goods Sold 18,000 16,800 34,800
( b ) Debit Credit Debit Credit Raw Material Control 24,000 Work in Process 24,800 Accounts Payable 24,000 Factory Overhead Control 2,000 Raw Material Control 26,800 Work in Process 31,200 Labour Control 43,000 Factory Overhead Control 13,000 Accured Payroll 43,000 Labour Control 44,200 Accured Payroll 43,000 Bank 43,000 Factory Overhead Control 15,800 Bank 5,600 Prepaid Insurance 10,200 Factory Overhead Control 100 Raw Material Control 100 Factory Overhead Applied 30,900 Work in Process 31,200 Factory Overhead Control 30,900 Factory Overhead Applied 31,200 Finished Goods 62,800 Cost of Goods Sold 34,800 Work in Process 62,800 Finished Goods 34,800
Raw Material Control Opening Balance 10,800 Work in Process 24,800Accounts Payable 24,000 Factory Overhead Control 2,000 Factory Overhead Control 100 Closing Balance 7,900 34,800 34,800
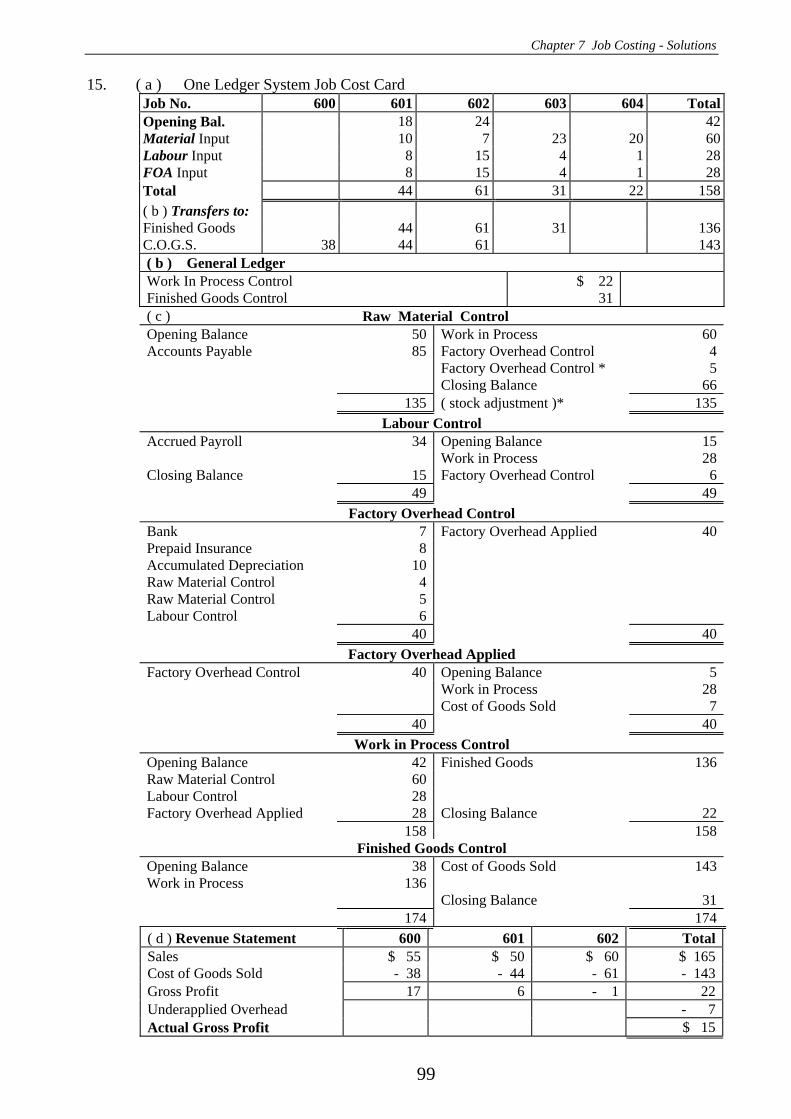
Chapter 7 Job Costing - Solutions
99
15. ( a ) One Ledger System Job Cost Card Job No. 600 601 602 603 604 TotalOpening Bal. 18 24 42Material Input 10 7 23 20 60Labour Input 8 15 4 1 28FOA Input 8 15 4 1 28Total 44 61 31 22 158( b ) Transfers to: Finished Goods 44 61 31 136C.O.G.S. 38 44 61 143( b ) General Ledger Work In Process Control $ 22 Finished Goods Control 31 ( c ) Raw Material Control Opening Balance 50 Work in Process 60Accounts Payable 85 Factory Overhead Control 4 Factory Overhead Control * 5 Closing Balance 66 135 ( stock adjustment )* 135
Labour Control Accrued Payroll 34 Opening Balance 15 Work in Process 28Closing Balance 15 Factory Overhead Control 6 49 49
Factory Overhead Control Bank 7 Factory Overhead Applied 40Prepaid Insurance 8 Accumulated Depreciation 10 Raw Material Control 4 Raw Material Control 5 Labour Control 6 40 40
Factory Overhead Applied Factory Overhead Control 40 Opening Balance 5 Work in Process 28 Cost of Goods Sold 7 40 40
Work in Process Control Opening Balance 42 Finished Goods 136Raw Material Control 60 Labour Control 28 Factory Overhead Applied 28 Closing Balance 22 158 158
Finished Goods Control Opening Balance 38 Cost of Goods Sold 143Work in Process 136 Closing Balance 31 174 174( d ) Revenue Statement 600 601 602 TotalSales $ 55 $ 50 $ 60 $ 165Cost of Goods Sold - 38 - 44 - 61 - 143Gross Profit 17 6 - 1 22Underapplied Overhead - 7Actual Gross Profit $ 15
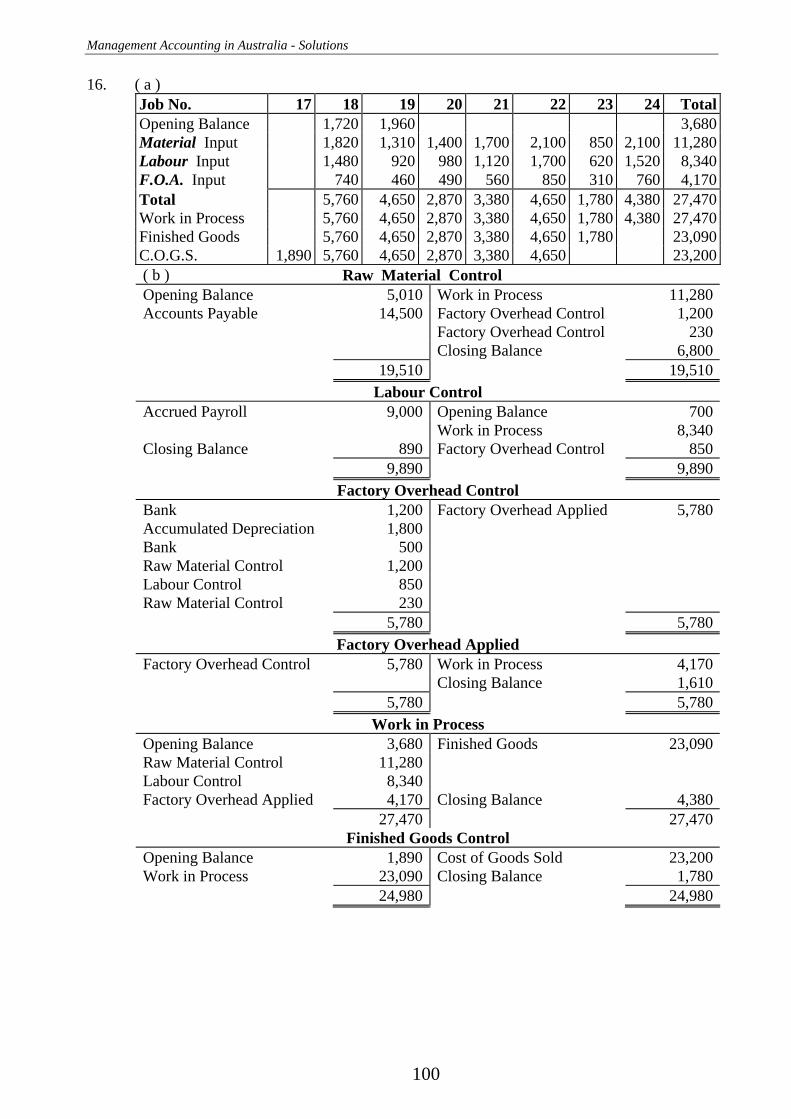
Management Accounting in Australia - Solutions
100
16. ( a ) Job No. 17 18 19 20 21 22 23 24 TotalOpening Balance 1,720 1,960 3,680Material Input 1,820 1,310 1,400 1,700 2,100 850 2,100 11,280Labour Input 1,480 920 980 1,120 1,700 620 1,520 8,340F.O.A. Input 740 460 490 560 850 310 760 4,170Total 5,760 4,650 2,870 3,380 4,650 1,780 4,380 27,470Work in Process 5,760 4,650 2,870 3,380 4,650 1,780 4,380 27,470Finished Goods 5,760 4,650 2,870 3,380 4,650 1,780 23,090C.O.G.S. 1,890 5,760 4,650 2,870 3,380 4,650 23,200( b ) Raw Material Control Opening Balance 5,010 Work in Process 11,280Accounts Payable 14,500 Factory Overhead Control 1,200 Factory Overhead Control 230 Closing Balance 6,800 19,510 19,510
Labour Control Accrued Payroll 9,000 Opening Balance 700 Work in Process 8,340Closing Balance 890 Factory Overhead Control 850 9,890 9,890
Factory Overhead Control Bank 1,200 Factory Overhead Applied 5,780Accumulated Depreciation 1,800 Bank 500 Raw Material Control 1,200 Labour Control 850 Raw Material Control 230 5,780 5,780
Factory Overhead Applied Factory Overhead Control 5,780 Work in Process 4,170 Closing Balance 1,610 5,780 5,780
Work in Process Opening Balance 3,680 Finished Goods 23,090Raw Material Control 11,280 Labour Control 8,340 Factory Overhead Applied 4,170 Closing Balance 4,380 27,470 27,470
Finished Goods Control Opening Balance 1,890 Cost of Goods Sold 23,200Work in Process 23,090 Closing Balance 1,780 24,980 24,980
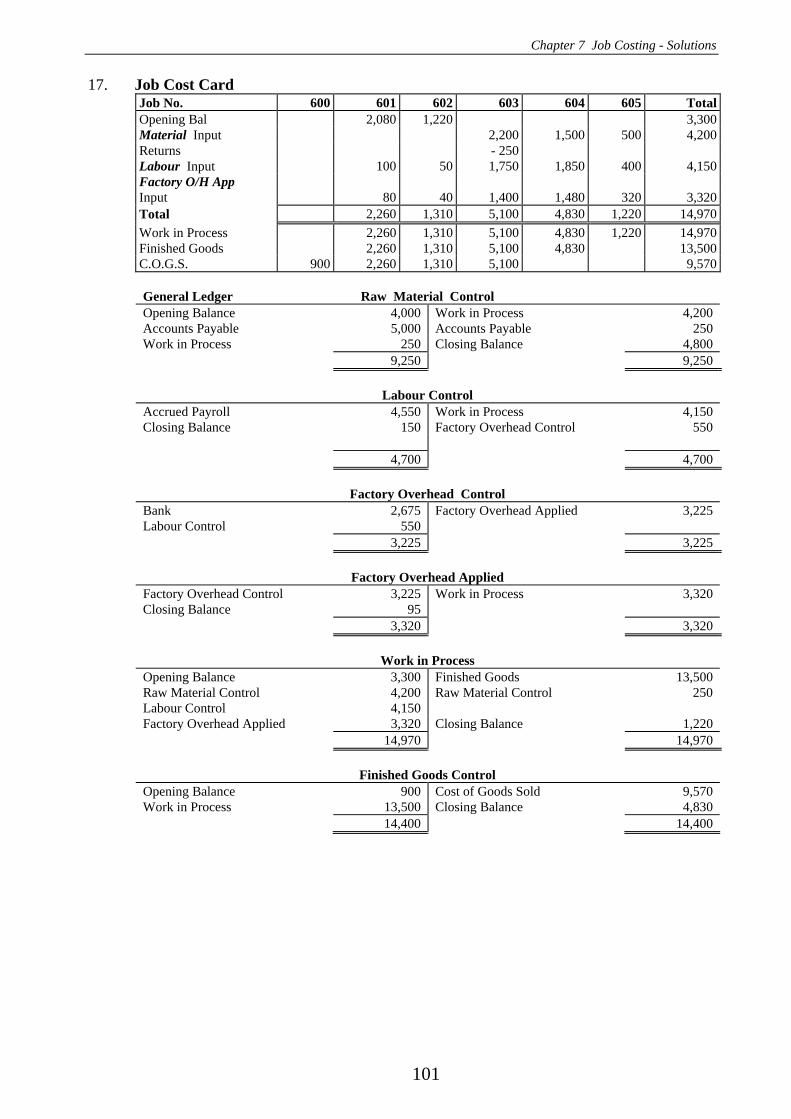
Chapter 7 Job Costing - Solutions
101
17. Job Cost Card Job No. 600 601 602 603 604 605 TotalOpening Bal 2,080 1,220 3,300Material Input 2,200 1,500 500 4,200Returns - 250 Labour Input 100 50 1,750 1,850 400 4,150Factory O/H App Input 80 40 1,400 1,480 320 3,320Total 2,260 1,310 5,100 4,830 1,220 14,970Work in Process 2,260 1,310 5,100 4,830 1,220 14,970Finished Goods 2,260 1,310 5,100 4,830 13,500C.O.G.S. 900 2,260 1,310 5,100 9,570 General Ledger
Raw Material Control
Opening Balance 4,000 Work in Process 4,200 Accounts Payable 5,000 Accounts Payable 250 Work in Process 250 Closing Balance 4,800 9,250 9,250
Labour Control
Accrued Payroll 4,550 Work in Process 4,150 Closing Balance 150 Factory Overhead Control 550 4,700 4,700
Factory Overhead Control
Bank 2,675 Factory Overhead Applied 3,225 Labour Control 550 3,225 3,225
Factory Overhead Applied
Factory Overhead Control 3,225 Work in Process 3,320 Closing Balance 95 3,320 3,320
Work in Process
Opening Balance 3,300 Finished Goods 13,500 Raw Material Control 4,200 Raw Material Control 250 Labour Control 4,150 Factory Overhead Applied 3,320 Closing Balance 1,220 14,970 14,970
Finished Goods Control
Opening Balance 900 Cost of Goods Sold 9,570 Work in Process 13,500 Closing Balance 4,830 14,400 14,400
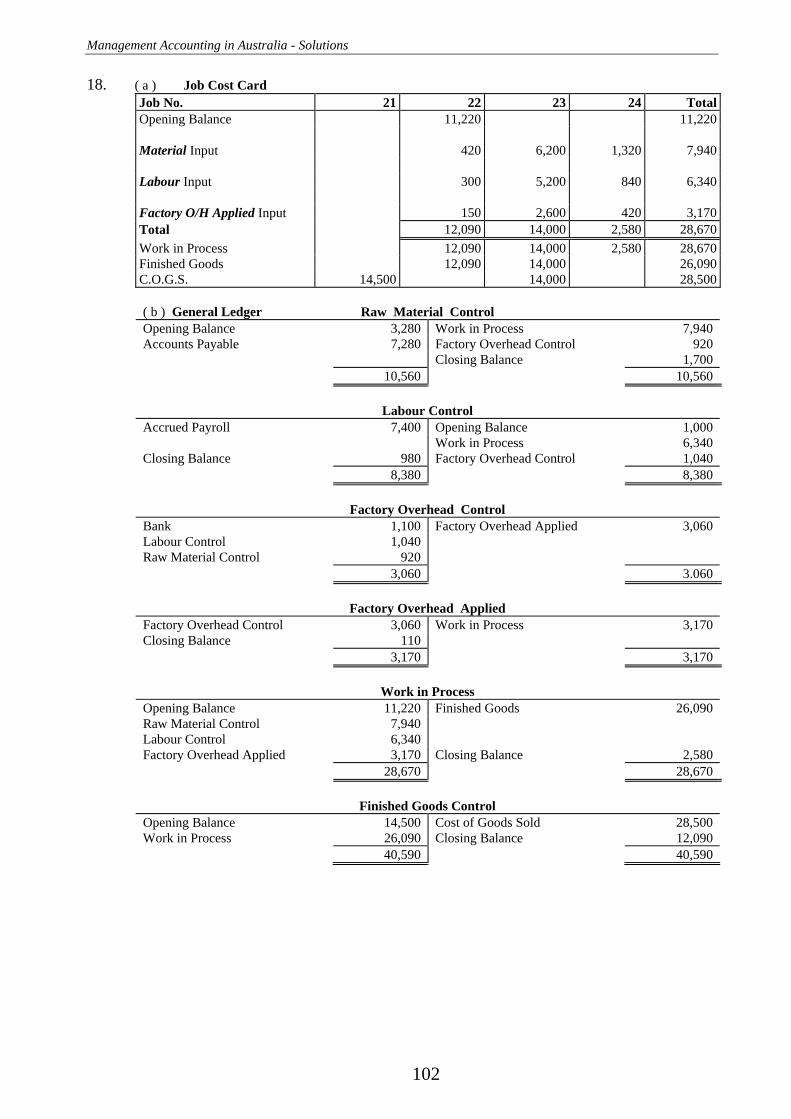
Management Accounting in Australia - Solutions
102
18. ( a ) Job Cost Card Job No. 21 22 23 24 TotalOpening Balance 11,220 11,220 Material Input 420 6,200 1,320 7,940 Labour Input 300 5,200 840 6,340 Factory O/H Applied Input 150 2,600 420 3,170Total 12,090 14,000 2,580 28,670Work in Process 12,090 14,000 2,580 28,670Finished Goods 12,090 14,000 26,090C.O.G.S. 14,500 14,000 28,500 ( b ) General Ledger
Raw Material Control
Opening Balance 3,280 Work in Process 7,940 Accounts Payable 7,280 Factory Overhead Control 920 Closing Balance 1,700 10,560 10,560
Labour Control
Accrued Payroll 7,400 Opening Balance 1,000 Work in Process 6,340 Closing Balance 980 Factory Overhead Control 1,040 8,380 8,380
Factory Overhead Control
Bank 1,100 Factory Overhead Applied 3,060 Labour Control 1,040 Raw Material Control 920 3,060 3.060
Factory Overhead Applied
Factory Overhead Control 3,060 Work in Process 3,170 Closing Balance 110 3,170 3,170
Work in Process
Opening Balance 11,220 Finished Goods 26,090 Raw Material Control 7,940 Labour Control 6,340 Factory Overhead Applied 3,170 Closing Balance 2,580 28,670 28,670
Finished Goods Control
Opening Balance 14,500 Cost of Goods Sold 28,500 Work in Process 26,090 Closing Balance 12,090 40,590 40,590
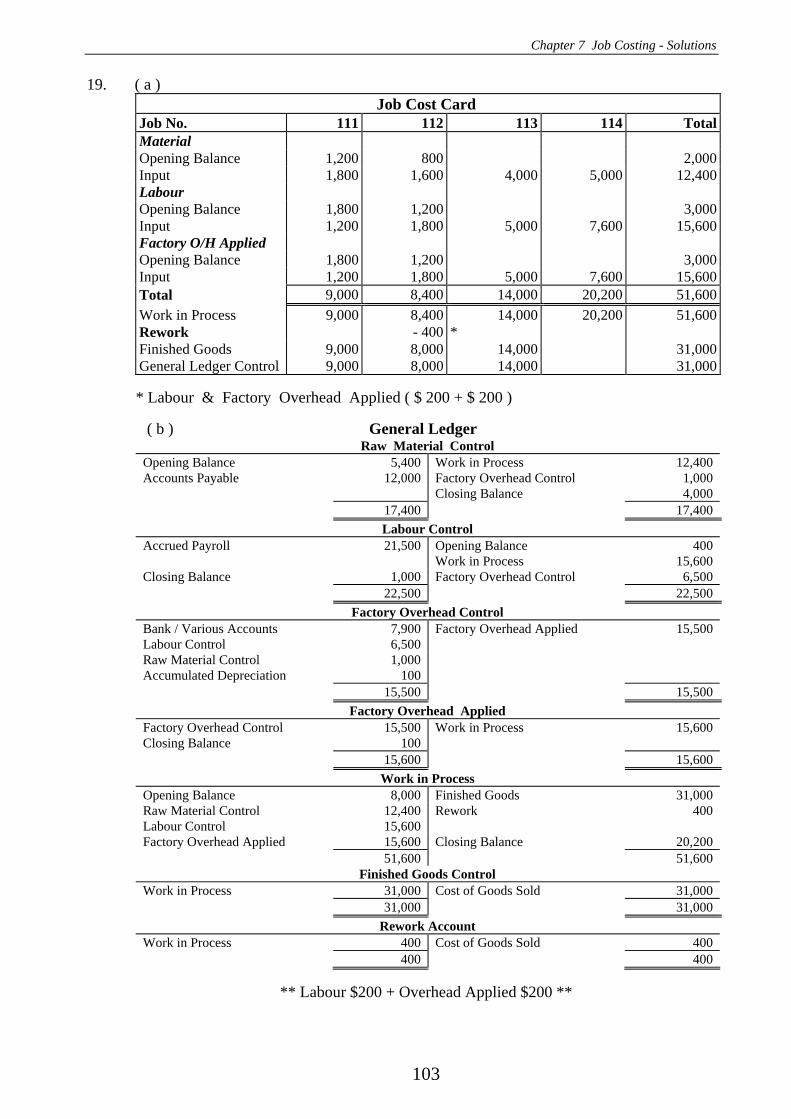
Chapter 7 Job Costing - Solutions
103
19. ( a ) Job Cost Card
Job No. 111 112 113 114 TotalMaterial Opening Balance 1,200 800 2,000Input 1,800 1,600 4,000 5,000 12,400Labour Opening Balance 1,800 1,200 3,000Input 1,200 1,800 5,000 7,600 15,600Factory O/H Applied Opening Balance 1,800 1,200 3,000Input 1,200 1,800 5,000 7,600 15,600Total 9,000 8,400 14,000 20,200 51,600Work in Process 9,000 8,400 14,000 20,200 51,600Rework - 400 * Finished Goods 9,000 8,000 14,000 31,000General Ledger Control 9,000 8,000 14,000 31,000
* Labour & Factory Overhead Applied ( $ 200 + $ 200 )
( b ) General Ledger Raw Material Control
Opening Balance 5,400 Work in Process 12,400 Accounts Payable 12,000 Factory Overhead Control 1,000 Closing Balance 4,000 17,400 17,400
Labour Control Accrued Payroll 21,500 Opening Balance 400 Work in Process 15,600 Closing Balance 1,000 Factory Overhead Control 6,500 22,500 22,500
Factory Overhead Control Bank / Various Accounts 7,900 Factory Overhead Applied 15,500 Labour Control 6,500 Raw Material Control 1,000 Accumulated Depreciation 100 15,500 15,500
Factory Overhead Applied Factory Overhead Control 15,500 Work in Process 15,600 Closing Balance 100 15,600 15,600
Work in Process Opening Balance 8,000 Finished Goods 31,000 Raw Material Control 12,400 Rework 400 Labour Control 15,600 Factory Overhead Applied 15,600 Closing Balance 20,200 51,600 51,600
Finished Goods Control Work in Process 31,000 Cost of Goods Sold 31,000 31,000 31,000
Rework Account Work in Process 400 Cost of Goods Sold 400 400 400
** Labour $200 + Overhead Applied $200 **

Management Accounting in Australia - Solutions
104
20. ( a ) Job Cost Card
Job No. 19 18 20 21 22 23 TotalMaterial Opening Balance 700 190 890Input 590 420 480 120 1,610Labour Opening Balance 620 200 820Input 50 460 510 590 90 1,700Factory O/H Applied Opening Balance 310 100 410Input 25 230 255 295 45 850Clean-up 46 32 26 28 132Total 1,751 1,802 1,211 1,393 255 6,412Work in Process 1,751 1,802 1,211 1,393 255 6,412Returns - 40 Finished Goods 1,751 1,802 1,211 1,353 6,117General Ledger Control 950 1,751 1,802 1,211 1,353 7,067( b ) Factory Ledger
Raw Material Control Opening Balance 1,800 Work in Process 1,610 Accounts Payable 2,010 Factory Overhead Control 360 Work in Process 40 Factory Overhead Control 20 Closing Balance 1,900 3,870 3,870
Labour Control Accrued Payroll 2,380 Opening Balance 360 Work in Process 1,700 Closing Balance 50 Factory Overhead Control 370 2,430 2,430
Factory Overhead Control Bank / Various Accounts 186 Factory Overhead Applied 896 Labour Control 370 Raw Material Control 20 Raw Material Control 360 916 916
Factory Overhead Applied Factory Overhead Control 896 Work in Process 850 Closing Balance 46 896 896
Work in Process Opening Balance 2,120 Finished Goods 6,117 Raw Material Control 1,610 Raw Material Control 40 Labour Control 1,700 Factory Overhead Applied 850 Clean Up 132 Closing Balance 255 6,412 6,412
Finished Goods Opening Balance 950 Cost of Goods Sold 7,067 Work in Process 6,117 7,067 7,067
Clean-Up Account Bank 132 Work in Process 132 132 132
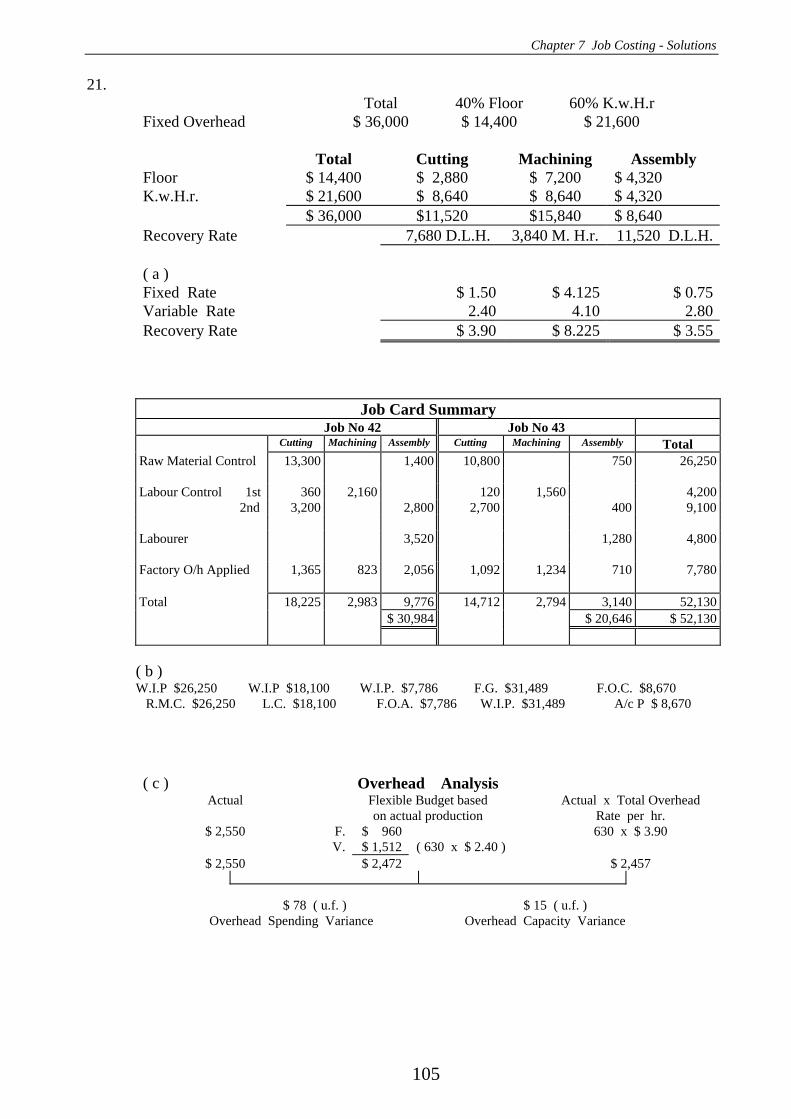
Chapter 7 Job Costing - Solutions
105
21. Total 40% Floor 60% K.w.H.r Fixed Overhead $ 36,000 $ 14,400 $ 21,600 Total Cutting Machining Assembly Floor $ 14,400 $ 2,880 $ 7,200 $ 4,320 K.w.H.r. $ 21,600 $ 8,640 $ 8,640 $ 4,320 $ 36,000 $11,520 $15,840 $ 8,640 Recovery Rate 7,680 D.L.H. 3,840 M. H.r. 11,520 D.L.H. ( a ) Fixed Rate $ 1.50 $ 4.125 $ 0.75Variable Rate 2.40 4.10 2.80Recovery Rate $ 3.90 $ 8.225 $ 3.55
Job Card Summary
Job No 42 Job No 43 Cutting Machining Assembly Cutting Machining Assembly Total Raw Material Control 13,300 1,400 10,800 750 26,250 Labour Control 1st 360 2,160 120 1,560 4,200 2nd 3,200 2,800 2,700 400 9,100 Labourer 3,520 1,280 4,800 Factory O/h Applied 1,365 823 2,056 1,092 1,234 710 7,780 Total 18,225 2,983 9,776 14,712 2,794 3,140 52,130 $ 30,984 $ 20,646 $ 52,130
( b ) W.I.P $26,250 W.I.P $18,100 W.I.P. $7,786 F.G. $31,489 F.O.C. $8,670 R.M.C. $26,250 L.C. $18,100 F.O.A. $7,786 W.I.P. $31,489 A/c P $ 8,670 ( c ) Overhead Analysis
Actual Flexible Budget based Actual x Total Overhead on actual production Rate per hr.
$ 2,550 F. $ 960 630 x $ 3.90 V. $ 1,512 ( 630 x $ 2.40 )
$ 2,550 $ 2,472 $ 2,457
$ 78 ( u.f. ) $ 15 ( u.f. )
Overhead Spending Variance Overhead Capacity Variance
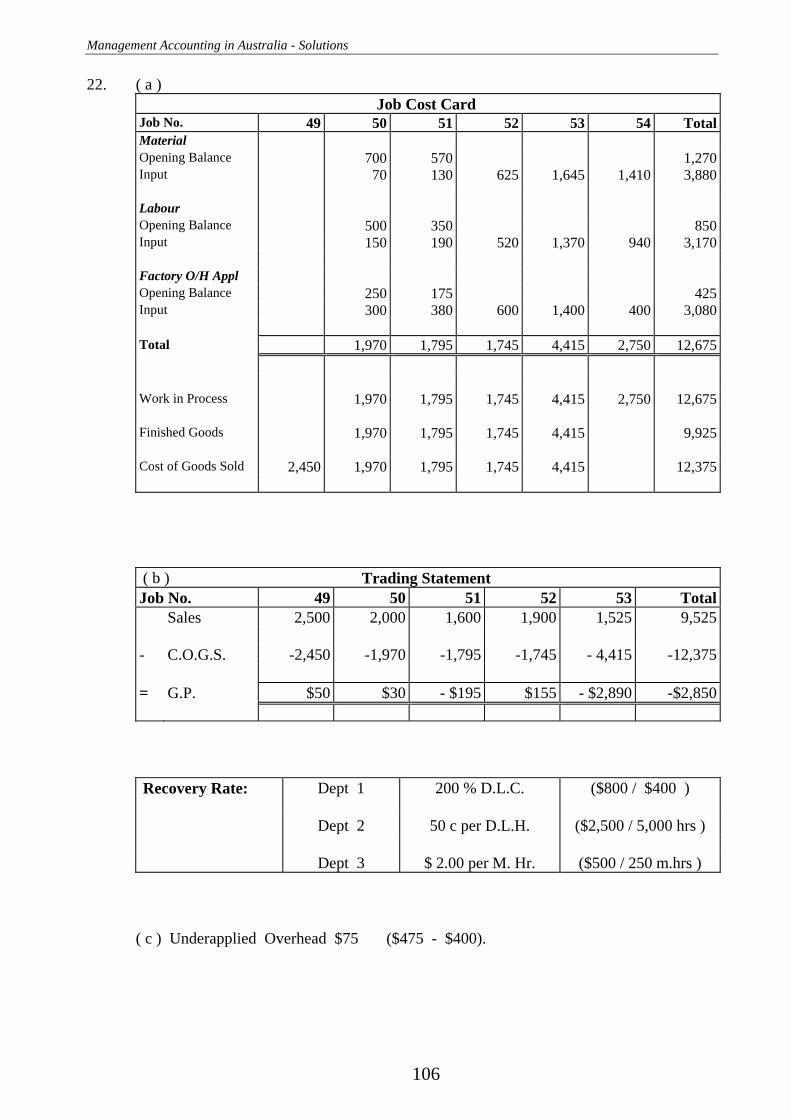
Management Accounting in Australia - Solutions
106
22. ( a ) Job Cost Card
Job No. 49 50 51 52 53 54 TotalMaterial Opening Balance 700 570 1,270Input 70 130 625 1,645 1,410 3,880 Labour Opening Balance 500 350 850Input 150 190 520 1,370 940 3,170 Factory O/H Appl Opening Balance 250 175 425Input 300 380 600 1,400 400 3,080 Total 1,970 1,795 1,745 4,415 2,750 12,675 Work in Process 1,970 1,795 1,745 4,415 2,750 12,675 Finished Goods 1,970 1,795 1,745 4,415 9,925 Cost of Goods Sold 2,450 1,970 1,795 1,745 4,415 12,375
( b ) Trading Statement Job No. 49 50 51 52 53 Total Sales 2,500 2,000 1,600 1,900 1,525 9,525 - C.O.G.S. -2,450 -1,970 -1,795 -1,745 - 4,415 -12,375 = G.P. $50 $30 - $195 $155 - $2,890 -$2,850 Recovery Rate: Dept 1 200 % D.L.C. ($800 / $400 ) Dept 2 50 c per D.L.H. ($2,500 / 5,000 hrs ) Dept 3 $ 2.00 per M. Hr. ($500 / 250 m.hrs )
( c ) Underapplied Overhead $75 ($475 - $400).
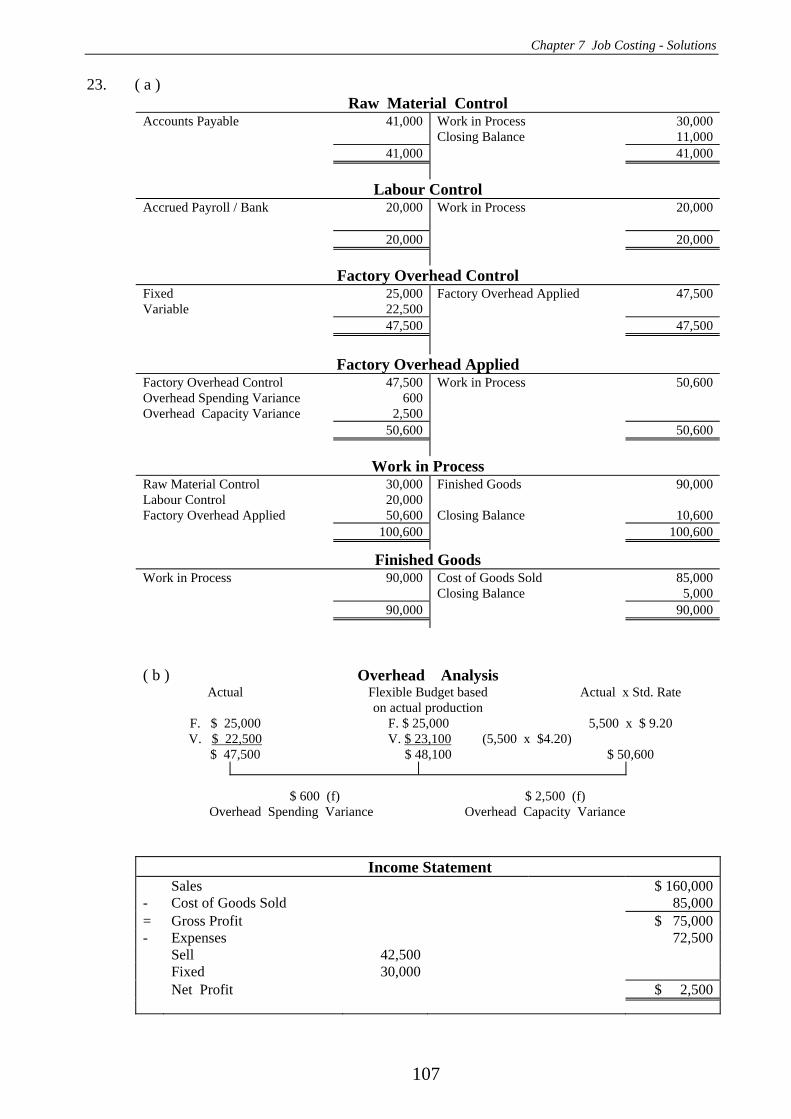
Chapter 7 Job Costing - Solutions
107
23. ( a ) Raw Material Control
Accounts Payable 41,000 Work in Process 30,000 Closing Balance 11,000 41,000 41,000
Labour Control Accrued Payroll / Bank 20,000 Work in Process 20,000 20,000 20,000
Factory Overhead Control Fixed 25,000 Factory Overhead Applied 47,500 Variable 22,500 47,500 47,500
Factory Overhead Applied Factory Overhead Control 47,500 Work in Process 50,600 Overhead Spending Variance 600 Overhead Capacity Variance 2,500 50,600 50,600
Work in Process Raw Material Control 30,000 Finished Goods 90,000 Labour Control 20,000 Factory Overhead Applied 50,600 Closing Balance 10,600 100,600 100,600
Finished Goods Work in Process 90,000 Cost of Goods Sold 85,000 Closing Balance 5,000 90,000 90,000
( b ) Overhead Analysis
Actual Flexible Budget based Actual x Std. Rate on actual production
F. $ 25,000 F. $ 25,000 5,500 x $ 9.20 V. $ 22,500 V. $ 23,100 (5,500 x $4.20)
$ 47,500 $ 48,100 $ 50,600
$ 600 (f) $ 2,500 (f)
Overhead Spending Variance Overhead Capacity Variance
Income Statement Sales $ 160,000- Cost of Goods Sold 85,000= Gross Profit $ 75,000- Expenses 72,500 Sell 42,500 Fixed 30,000 Net Profit $ 2,500

Management Accounting in Australia - Solutions
108
24. Hint: Work backwards. Raw Material Control Opening Balance 0 Factory Overhead Control 500 Work in Process 8,000Accounts Payable 12,500 Closing Balance 4,000 12,500 12,500
Labour Control
Accrued Payroll / Bank 9,100 Work in Process 9,000Closing Balance 400 Factory Overhead Control 500 9,500 9,500
Factory Overhead Control
Raw Material Control 500 Factory Overhead Applied 6,500Labour Control 500 Other 5,500 6,500 6,500
Factory Overhead Applied
Factory Overhead Control 6,500 Opening Balance 500 Work in Process 6,000 6,500 6,500
Work In Process
Raw Material Control 8,000 Finished Goods 20,000Labour Control 9,000 Factory Overhead Applied 6,000 Closing Balance 3,000 23,000 23,000
Finished Goods
Work in Process 20,000 Cost of Goods Sold 13,000 Closing Balance 7,000 20,000 20,000

Chapter 7 Job Costing - Solutions
109
25. Debit Credit
Raw Material Control 20,200 Accounts Payable 20,200 Work in Process 17,500 Factory Overhead Control 2,500 Raw Material Control 20,000 Work in Process 6,000 Factory Overhead Control 1,300 Labour Control 7,300 Labour Control 7,300 P.A.Y.G. Tax Payable 1,240 Union Fees Due 60 Medical Benefits Payable 200 Accured Payroll 5,800 Accured Payroll 5,800 Bank 5,800 Factory O/head Control 200 Raw Material Control 200 Factory Overhead Control 5,000 Bank 4,000 Accumulated Depreciation 1,000 Factory Overhead Applied 9,000 Factory Overhead Control 9,000 Work in Process 9,000 Factory Overhead Applied 9,000 Finished Goods 23,500 Work in Process 23,500 Cost of Goods Sold 23,500 Finished Goods 23,500

Management Accounting in Australia - Solutions
110
26. ( a ) Job Cost Card
Job No. 1720 1721 1723 1724 1725 R911 R912 TotalMaterial Opening Balance 11,200 6,500 1,700 19,400Input 800 3,200 6,400 4,600 300 1,100 16,400Labour Opening Balance 14,400 8,800 4,600 27,800Input 1,500 5,600 11,300 7,800 700 2,100 29,000Factory O/H Applied Opening Balance 7,200 4,400 2,300 13,900Input 750 2,800 5,650 3,900 350 1,050 14,500Travel 240 380 620Total 35,850 31,300 23,350 16,300 10,190 4,630 121,620Work in Process 35,850 31,300 23,350 16,300 10,190 4,630 121,620Finished Goods 35,850 23,350 16,300 10,190 85,690General Ledger Control 18,500 35,850 23,350 10,190 87,890 ( b )
Factory Ledger Raw Material Control
Opening Balance 42,400 Work in Process 16,400 Accounts Payable 23,600 Factory Overhead Control 2,800 Closing Balance 46,800 66,000 66,000
Labour Control Accrued Payroll 33,000 Opening Balance 1,800 Work in Process 29,000 Closing Balance 2,000 Factory Overhead Control 4,200 35,000 35,000
Factory Overhead Control Raw Material Control 2,800 Factory Overhead Applied 14,600 Labour Control 4,200 Various Accounts 7,600 14,600 14,600
Factory Overhead Applied
Factory Overhead Control 14,600 Opening Balance 700 Cost of Goods Sold 600 Work in Process 14,500 15,200 15,200
Work in Process Opening Balance 61,100 Finished Goods 85,690 Raw Material Control 16,400 Labour Control 29,000 Factory Overhead Applied 14,500 Accounts Payable 620 Closing Balance 35,930 121,620 121,620
Finished Goods Opening Balance 18,500 Cost of Goods Sold 87,890 Work in Process 85,690 Closing Balance 16,300 104,190 104,190

Chapter 7 Job Costing - Solutions
111
27. Job Cost Card
Job No. 101 102 103 Total Budgeted Overhead = $ 90,000Raw Material Control 9,400 13,300 6,400 29,100 Labour Control 2,000 12,400 14,100 28,500 Factory O/H Applied 500 3,100 3,525 7,125 Budgeted Lab. Cost = $ 360,000 Work in Process 11,900 28,800 24,025 64,725 Recovery Rate = 25% DLCFinished Goods 11,900 28,800 40,700 Cost of Goods Sold 11,900 11,900
General Ledger Raw Material Control
Opening Balance 7,450 Work in Process 29,100 Accounts Payable 34,000 Factory Overhead Control 1,050 Accounts Payable 1,500 Factory Overhead Control 400 Closing Balance 9,400 41,450 41,450
Labour Control Accrued Payroll 31,050 Factory Overhead Control 2,550 Work in Process 28,500 31,050 31,050
Factory Overhead Control Raw Material Control 1,050 Factory Overhead Applied 8,050 Labour Control 2,550 Bank 4,050 Raw Material Control 400 8,050 8,050
Factory Overhead Applied Opening Balance 350 Work in Process 7,125 Factory Overhead Control 8,050 Closing Balance 1,275 8,400 8,400
Work in Process Opening Balance 0 Finished Goods 40,700 Raw Material Control 29,100 Labour Control 28,500 Factory Overhead Applied 7,125 Closing Balance 24,025 64,725 64,725
Finished Goods Control Work in Process 40,700 Cost of Goods Sold 11,900 Closing Balance 28,800 40,700 40,700
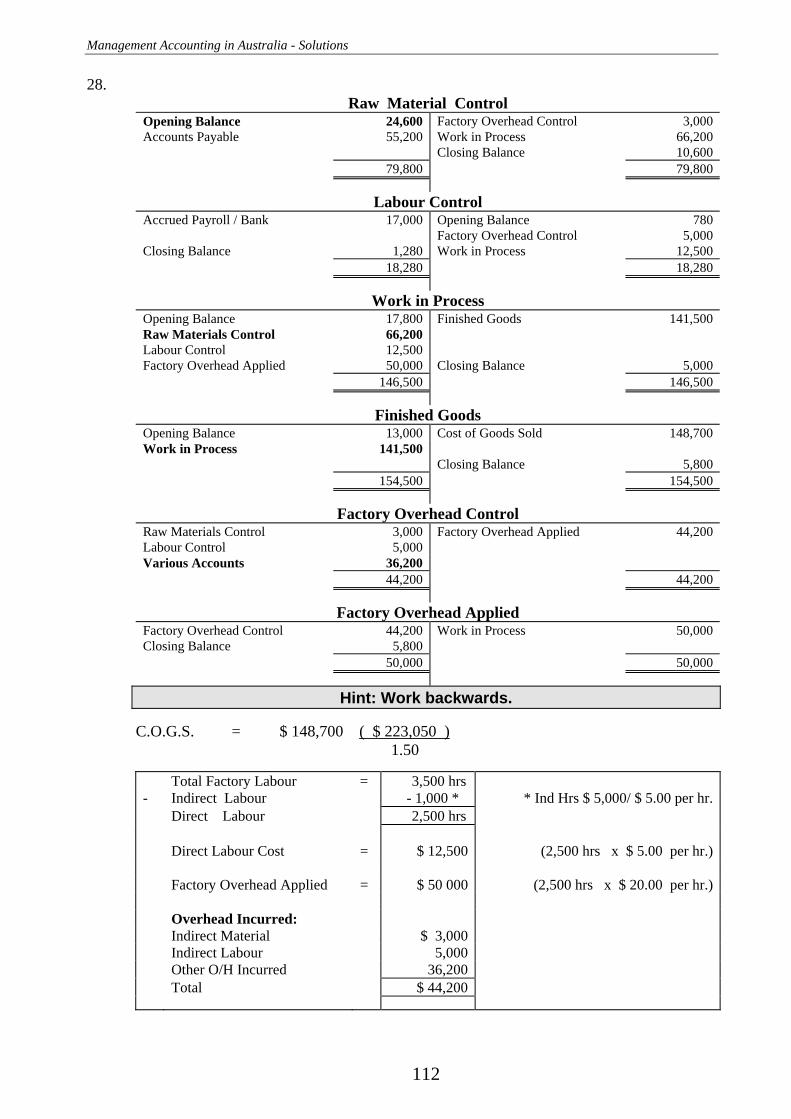
Management Accounting in Australia - Solutions
112
28. Raw Material Control
Opening Balance 24,600 Factory Overhead Control 3,000 Accounts Payable 55,200 Work in Process 66,200 Closing Balance 10,600 79,800 79,800
Labour Control Accrued Payroll / Bank 17,000 Opening Balance 780 Factory Overhead Control 5,000 Closing Balance 1,280 Work in Process 12,500 18,280 18,280
Work in Process Opening Balance 17,800 Finished Goods 141,500 Raw Materials Control 66,200 Labour Control 12,500 Factory Overhead Applied 50,000 Closing Balance 5,000 146,500 146,500
Finished Goods Opening Balance 13,000 Cost of Goods Sold 148,700 Work in Process 141,500 Closing Balance 5,800 154,500 154,500
Factory Overhead Control Raw Materials Control 3,000 Factory Overhead Applied 44,200 Labour Control 5,000 Various Accounts 36,200 44,200 44,200
Factory Overhead Applied Factory Overhead Control 44,200 Work in Process 50,000 Closing Balance 5,800 50,000 50,000
Hint: Work backwards.
C.O.G.S. = $ 148,700 ( $ 223,050 ) 1.50 Total Factory Labour = 3,500 hrs - Indirect Labour - 1,000 * * Ind Hrs $ 5,000/ $ 5.00 per hr. Direct Labour 2,500 hrs Direct Labour Cost = $ 12,500 (2,500 hrs x $ 5.00 per hr.) Factory Overhead Applied = $ 50 000 (2,500 hrs x $ 20.00 per hr.) Overhead Incurred: Indirect Material $ 3,000 Indirect Labour 5,000 Other O/H Incurred 36,200 Total $ 44,200
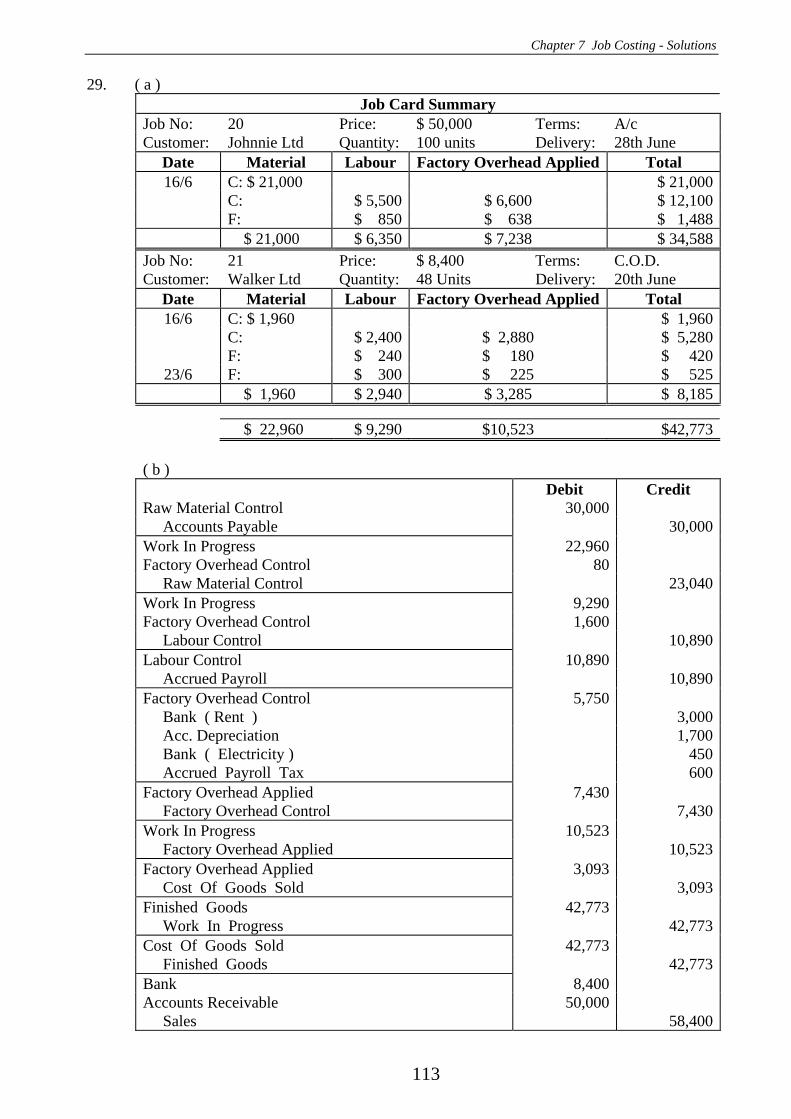
Chapter 7 Job Costing - Solutions
113
29. ( a ) Job Card Summary
Job No: 20 Price: $ 50,000 Terms: A/c Customer: Johnnie Ltd Quantity: 100 units Delivery: 28th June
Date Material Labour Factory Overhead Applied Total 16/6 C: $ 21,000 $ 21,000
C: $ 5,500 $ 6,600 $ 12,100 F: $ 850 $ 638 $ 1,488 $ 21,000 $ 6,350 $ 7,238 $ 34,588Job No: 21 Price: $ 8,400 Terms: C.O.D. Customer: Walker Ltd Quantity: 48 Units Delivery: 20th June
Date Material Labour Factory Overhead Applied Total 16/6 C: $ 1,960 $ 1,960
C: $ 2,400 $ 2,880 $ 5,280 F: $ 240 $ 180 $ 420
23/6 F: $ 300 $ 225 $ 525 $ 1,960 $ 2,940 $ 3,285 $ 8,185
$ 22,960 $ 9,290 $10,523 $42,773 ( b ) Debit Credit Raw Material Control 30,000 Accounts Payable 30,000Work In Progress 22,960 Factory Overhead Control 80 Raw Material Control 23,040Work In Progress 9,290 Factory Overhead Control 1,600 Labour Control 10,890Labour Control 10,890 Accrued Payroll 10,890Factory Overhead Control 5,750 Bank ( Rent ) 3,000 Acc. Depreciation 1,700 Bank ( Electricity ) 450 Accrued Payroll Tax 600Factory Overhead Applied 7,430 Factory Overhead Control 7,430Work In Progress 10,523 Factory Overhead Applied 10,523Factory Overhead Applied 3,093 Cost Of Goods Sold 3,093Finished Goods 42,773 Work In Progress 42,773Cost Of Goods Sold 42,773 Finished Goods 42,773Bank 8,400 Accounts Receivable 50,000 Sales 58,400

Management Accounting in Australia - Solutions
114
Chapter 8 Responsibility Accounting Chapter Review Solutions
1 Actual Flexible Budget Applied
F 220,500 Fixed 216,000 21,000 x $18.90 V 170,940 Variable 21,000 x $8.10 170,100 $391,440 $386,100 396,900
$ 5,340 Unfavourable $ 10,800 Favourable Overhead Spending Variance Overhead Capacity Variance
$5,460 Over applied Total Variance
2. ( a ) Variable Overhead = 180,000 = 200,000 $0.90 Fixed Overhead = 70,000 = $0.35 200,000 $1.25
Actual Flexible Budget Applied
F 72,000 Fixed 70,000 180,000 x $1.25 V 160,200 Variable 180,000 x $0.90 162,000 $232,200 $232,000 225,000
$ 200 UnF $ 7,000 UF Spending Variance Capacity Variance
$ 7,200 Underapplied Total Variance

Chapter 8 Responsibility Accounting
115
Normal capacity 50,000 maintenance labour hours
3. ( a ) The predetermined overhead rate:
Total Overhead Recovery Rate = Total Budgeted Overhead Budgeted Level of Activity
= [ $50,000 + ( $2 x 50,000 ) ] / 50,000 $ 3.00 per maintenance labour hour Variable Overhead Recovery Rate = Total Budgeted Variable Overhead Budgeted Level of Activity = $ 100,000 / 50,000 = $ 2.00 per hour
Fixed Overhead Recovery Rate = Total Budgeted Fixed Overhead
Budgeted Level of Activity = $ 50,000 / 50,000 = $ 1.00 per hour ( b ) Amount of Under/Overapplied Overhead: Actual Overhead Incurred = $ 161,000 Applied Overhead = $ 3.00 x 54,000 = $ 162,000 Overapplied Overhead = $ 1,000
The overapplied overhead of $1,000 is a favourable variance which may be further broken down into 2 separate variances titled: • Spending Variance • Capacity Variance using the following schedule.
Actual Factory Overhead Incurred
Flexible Budget based on Actual hours worked
Actual Hours Worked x Total Overhead rate per hour
Variable = 54,000 x $2.00 = $108,000
Fixed = $ 50,000 54,000 x $ 3.00
$161,000 $158,000 $162,000
Overhead Spending Variance $3,000 U Overhead Capacity Variance $4,000 F Under/Over Applied Overhead = $1,000 F

Management Accounting in Australia - Solutions
116
4. ( a ) Budgeted direct labour hours = 140,000 Labour hours per unit = 2 Budgeted production = 70,000 units ( b ) Indirect cost recovery rate = Total budgeted indirect costs Budgeted level of activity = ( 2 x 70,000 ) + ( 4 x 70,000 ) 70,000 = $6 per unit ( c ) Amount of Under / Over Applied Overhead : Actual overhead incurred $370,000 Applied overhead 6 x 60,000 $360,000 Underapplied overhead $ 10,000 ( d )
Actual Factory Overhead Incurred
Flexible Budget based on Actual hours worked
Actual Hours Worked x Total Overhead rate per hour
Variable = $ 240,000
Fixed = $ 140,000 120,000 x 3
370,000 $380,000 360,000
Overhead Spending Variance 10,000 F Overhead Capacity Variance 20,000 U Under/Over Applied Overhead = 10,000 U
5. Units $ High - Low Analysis:
High 56,000 268,000
Low 40,000 220,000 16,000 48,000
Variable Rate = $3.00 per unit ($48,000/16,000) Fixed Cost = Total Cost - Variable Cost (production) = $220,000 - $3 (40,000) = $100,000
Flexible Budget Based Actual on Actual Hours
Fixed $101,000 Fixed $100,000
Variable 152,000 Variable $150,000 (50,000 x $3.00) $253,000 $250,000
$3,000 Unfavourable Overhead Spending Variance
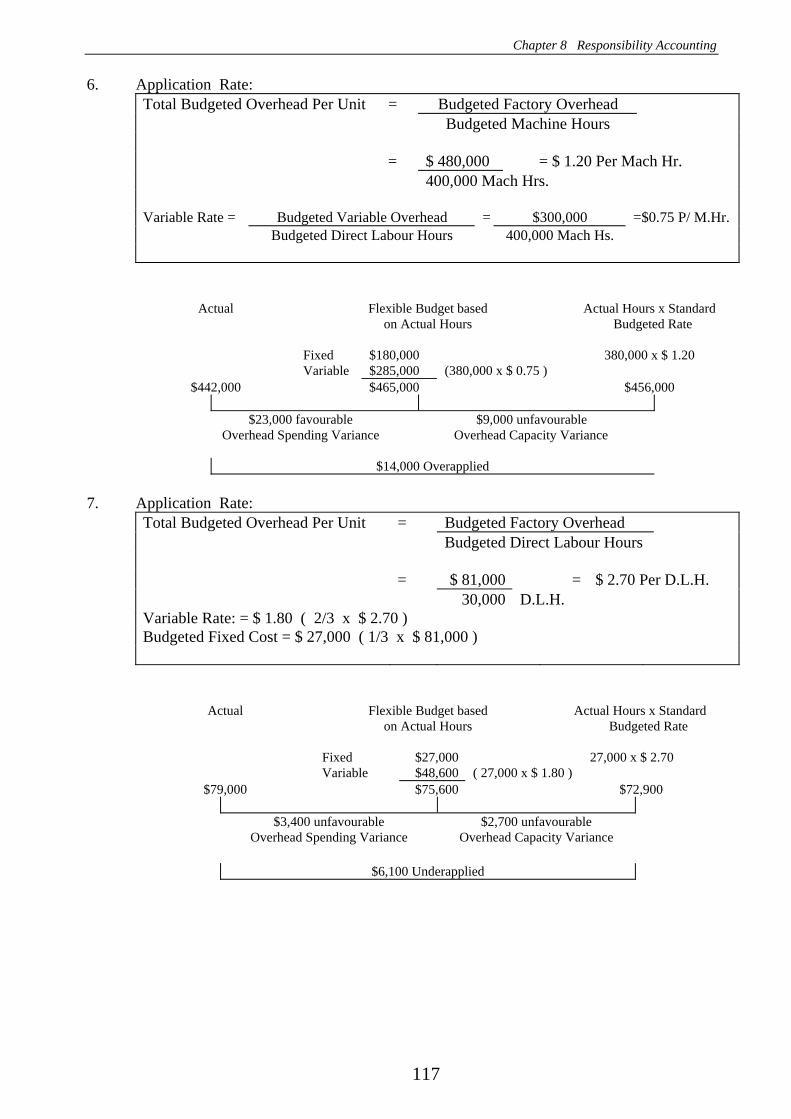
Chapter 8 Responsibility Accounting
117
6. Application Rate: Total Budgeted Overhead Per Unit = Budgeted Factory Overhead Budgeted Machine Hours = $ 480,000 = $ 1.20 Per Mach Hr. 400,000 Mach Hrs. Variable Rate = Budgeted Variable Overhead = $300,000 =$0.75 P/ M.Hr. Budgeted Direct Labour Hours 400,000 Mach Hs.
Actual Flexible Budget based Actual Hours x Standard on Actual Hours Budgeted Rate
Fixed $180,000 380,000 x $ 1.20 Variable $285,000 (380,000 x $ 0.75 )
$442,000 $465,000 $456,000 $23,000 favourable $9,000 unfavourable
Overhead Spending Variance Overhead Capacity Variance
$14,000 Overapplied
7. Application Rate: Total Budgeted Overhead Per Unit = Budgeted Factory Overhead Budgeted Direct Labour Hours = $ 81,000 = $ 2.70 Per D.L.H. 30,000 D.L.H. Variable Rate: = $ 1.80 ( 2/3 x $ 2.70 ) Budgeted Fixed Cost = $ 27,000 ( 1/3 x $ 81,000 )
Actual Flexible Budget based Actual Hours x Standard on Actual Hours Budgeted Rate Fixed $27,000 27,000 x $ 2.70 Variable $48,600 ( 27,000 x $ 1.80 )
$79,000 $75,600 $72,900 $3,400 unfavourable $2,700 unfavourable
Overhead Spending Variance Overhead Capacity Variance
$6,100 Underapplied
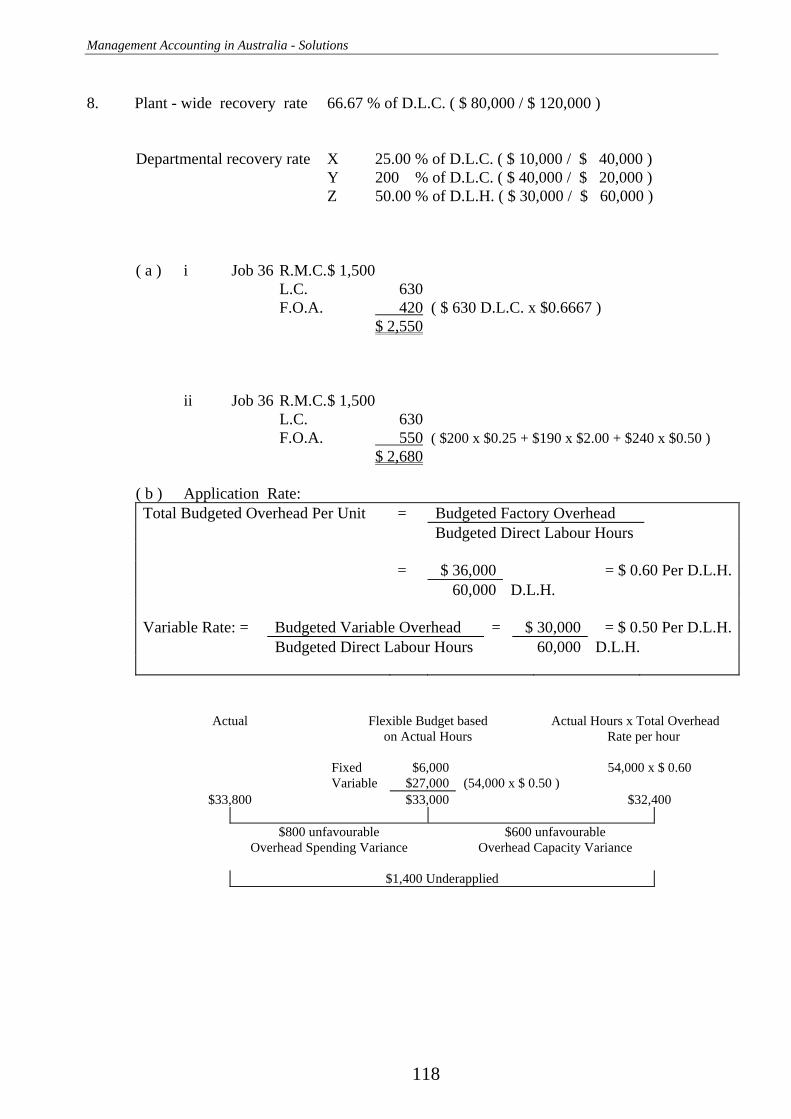
Management Accounting in Australia - Solutions
118
8. Plant - wide recovery rate 66.67 % of D.L.C. ( $ 80,000 / $ 120,000 )
Departmental recovery rate X 25.00 % of D.L.C. ( $ 10,000 / $ 40,000 ) Y 200 % of D.L.C. ( $ 40,000 / $ 20,000 ) Z 50.00 % of D.L.H. ( $ 30,000 / $ 60,000 ) ( a ) i Job 36 R.M.C. $ 1,500 L.C. 630 F.O.A. 420 ( $ 630 D.L.C. x $0.6667 ) $ 2,550 ii Job 36 R.M.C. $ 1,500 L.C. 630 F.O.A. 550 ( $200 x $0.25 + $190 x $2.00 + $240 x $0.50 ) $ 2,680 ( b ) Application Rate: Total Budgeted Overhead Per Unit = Budgeted Factory Overhead Budgeted Direct Labour Hours = $ 36,000 = $ 0.60 Per D.L.H. 60,000 D.L.H. Variable Rate: = Budgeted Variable Overhead = $ 30,000 = $ 0.50 Per D.L.H. Budgeted Direct Labour Hours 60,000 D.L.H.
Actual Flexible Budget based Actual Hours x Total Overhead on Actual Hours Rate per hour
Fixed $6,000 54,000 x $ 0.60 Variable $27,000 (54,000 x $ 0.50 )
$33,800 $33,000 $32,400 $800 unfavourable $600 unfavourable
Overhead Spending Variance Overhead Capacity Variance
$1,400 Underapplied
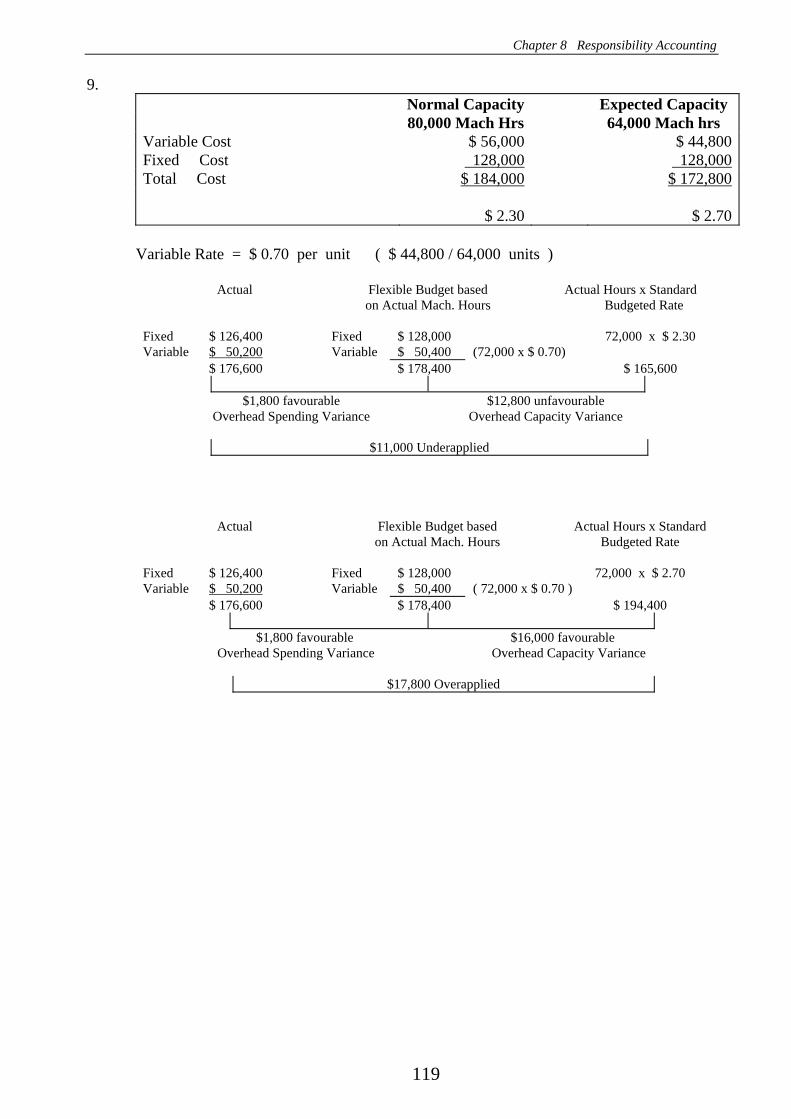
Chapter 8 Responsibility Accounting
119
9. Normal Capacity Expected Capacity 80,000 Mach Hrs 64,000 Mach hrs Variable Cost $ 56,000 $ 44,800Fixed Cost 128,000 128,000Total Cost $ 184,000 $ 172,800 $ 2.30 $ 2.70
Variable Rate = $ 0.70 per unit ( $ 44,800 / 64,000 units )
Actual Flexible Budget based Actual Hours x Standard on Actual Mach. Hours Budgeted Rate
Fixed $ 126,400 Fixed $ 128,000 72,000 x $ 2.30 Variable $ 50,200 Variable $ 50,400 (72,000 x $ 0.70) $ 176,600 $ 178,400 $ 165,600 $1,800 favourable $12,800 unfavourable Overhead Spending Variance Overhead Capacity Variance
$11,000 Underapplied
Actual Flexible Budget based Actual Hours x Standard on Actual Mach. Hours Budgeted Rate
Fixed $ 126,400 Fixed $ 128,000 72,000 x $ 2.70 Variable $ 50,200 Variable $ 50,400 ( 72,000 x $ 0.70 ) $ 176,600 $ 178,400 $ 194,400 $1,800 favourable $16,000 favourable Overhead Spending Variance Overhead Capacity Variance
$17,800 Overapplied
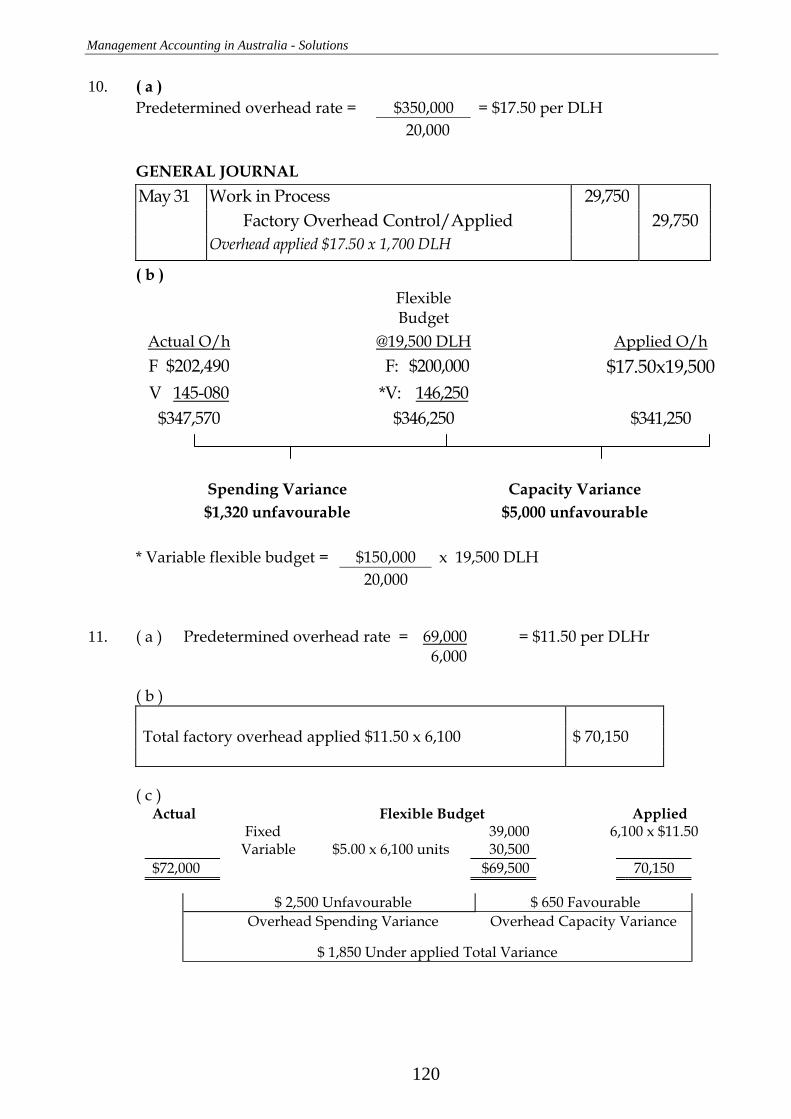
Management Accounting in Australia - Solutions
120
10. ( a ) Predetermined overhead rate = $350,000 = $17.50 per DLH 20,000 GENERAL JOURNAL
May 31 Work in Process 29,750 Factory Overhead Control/Applied 29,750 Overhead applied $17.50 x 1,700 DLH
( b ) Flexible
Budget
Actual O/h @19,500 DLH Applied O/h F $202,490 F: $200,000 $17.50x19,500 V 145-080 *V: 146,250
$347,570 $346,250 $341,250
Spending Variance $1,320 unfavourable
Capacity Variance
$5,000 unfavourable * Variable flexible budget = $150,000 x 19,500 DLH 20,000
11. ( a ) Predetermined overhead rate = 69,000 = $11.50 per DLHr
6,000 ( b ) Total factory overhead applied $11.50 x 6,100 $ 70,150
( c )
Actual Flexible Budget Applied Fixed 39,000 6,100 x $11.50 Variable $5.00 x 6,100 units 30,500 $72,000 $69,500 70,150
$ 2,500 Unfavourable $ 650 Favourable Overhead Spending Variance Overhead Capacity Variance
$ 1,850 Under applied Total Variance

Chapter 8 Responsibility Accounting
121
12. ( a ) Predetermined overhead rate = 183,000 = $ 6.10 per unit 30,000
( b ) Total factory overhead applied $ 6.10 x 29,000 $176,900 ( c )
Actual Flexible Budget Applied Fixed 99,000 29,000 x $ 6.10 Variable $2.80 x 29,000 units 81,200 $175,000 $180,200 176,900
$ 5,200 Favourable $ 3,300 Unfavourable Overhead Spending Variance Overhead Capacity Variance
$ 1,900 Over applied Total Variance
13. ( a ) Predetermined overhead rate = 72,000 = $4.80 per unit
15,000 ( b ) Total factory overhead incurred $ 70,300 Total factory overhead applied $4.80 x 13,500 64,800 Under Applied factory overhead 5,500
( c )
Actual Flexible Budget Applied F 45,200 Fixed 45,000 13,500 x $4.80 V 27,800 Variable 27,000/15,000 x 13,500 units 24,300 $70,300 $69,300 64,800
$ 1,000 Unfavourable $ 4,500 unfavourable Overhead Spending Variance Overhead Capacity Variance
$5,500 Under applied Total Variance

122
Paper 1 Solutions QUESTION 1. ( a ) Direct Labour: Conversion Costs $ 40,100 Factory Overhead - 19,200 $ 20,900 ( b ) Production cost: Conversion Costs $ 40,100 Direct Material 48,600 $ 88,700 ( c ) Variable Conversion cost: Direct Labour $ 20,900 Variable Factory Overhead 8,800 $ 29,700 ( d ) Period cost: Selling and Administration $ 66,000 Financial expenses 17,500 $ 83,500 ( e ) Manufacturing overhead cost @ 25,000 units: Fixed manufacturing overhead ( 19,200 – 8,800 ) $ 10,400 Variable manufacturing overhead $8,800 x 25,000 11,000 20,000 $ 21,400

123
QUESTION 2. PART A ( i ) Sales 240,000 100 % Var Costs - 60,000 25 % Cont Margin 180,000 75 % ( a ) Sales B/e $ = Fixed Cost = $150,000 = $200,000 Cont. Margin Ratio 0.75
( b ) Sales required ($) = $150,000 + 60,000 = $280,000
75%
( c ) Profit before tax required = $63,000 = $90,000 70%
Sales required ($) = $150,000 + 90,000 = $320,000 75%
PART B ( i ) ( b ) ( ii ) ( c )

124
QUESTION 3. ( a ) Derwent Ltd Manufacturing Statement for Six Months Ended 30 June 2008 $ $ $ DIRECT MATERIALS Inventory 1 January 2008 49,900 Purchases 196,320 Freight in and duty 8,040 254,260 Less: Inventory 30 June 2008 53,380 200,880 DIRECT LABOUR Direct labour incurred 80,430 FACTORY OVERHEAD Factory supplies used: Inventory 1 January 2008 4,390 Purchases 17,560 Freight in 950 22,900 Less: Inventory 30 June 2008 4,720 18,180 Depreciation Factory P & E ($285,500 x 10 x ½ yr) 14,275 Factory insurances ($1,000 + 6,420 ÷ 3) 3,140 Indirect labour 30,600 Factory maintenance 5,950 Factory lighting and power ($8,710 - 2,140) 6,570 Annual leave Factory 8,490 87,205 368,515 Work in process 1 January 2008 15,000 383,515 Less: Work in process 30 June 2008 19,350 COST of PRODUCTION 364,165 ( b ) Derwent Ltd Trading Statement for Six Months Ended 30 June 2008 $ $ Sales 960,180 Less Cost of Goods Sold Finished Goods Inventory 1 January 2008 90,850 Cost of Production 364,165 Purchases 37,380 Freight In 4,320 496,715 Less Finished Goods Inventory 30 June 2008 Gross Profit 89,535 407,180 $ 553,000
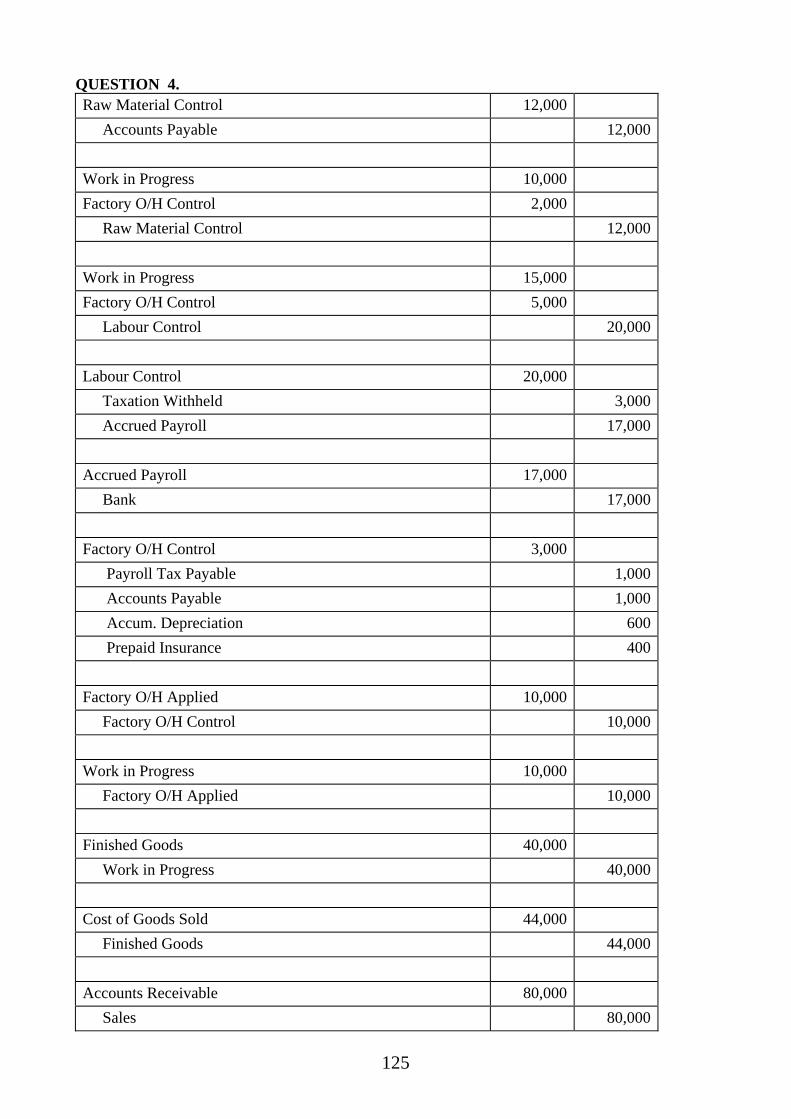
125
QUESTION 4. Raw Material Control 12,000 Accounts Payable 12,000 Work in Progress 10,000 Factory O/H Control 2,000 Raw Material Control 12,000 Work in Progress 15,000 Factory O/H Control 5,000 Labour Control 20,000 Labour Control 20,000 Taxation Withheld 3,000 Accrued Payroll 17,000 Accrued Payroll 17,000 Bank 17,000 Factory O/H Control 3,000 Payroll Tax Payable 1,000 Accounts Payable 1,000 Accum. Depreciation 600 Prepaid Insurance 400 Factory O/H Applied 10,000 Factory O/H Control 10,000 Work in Progress 10,000 Factory O/H Applied 10,000 Finished Goods 40,000 Work in Progress 40,000 Cost of Goods Sold 44,000 Finished Goods 44,000 Accounts Receivable 80,000 Sales 80,000
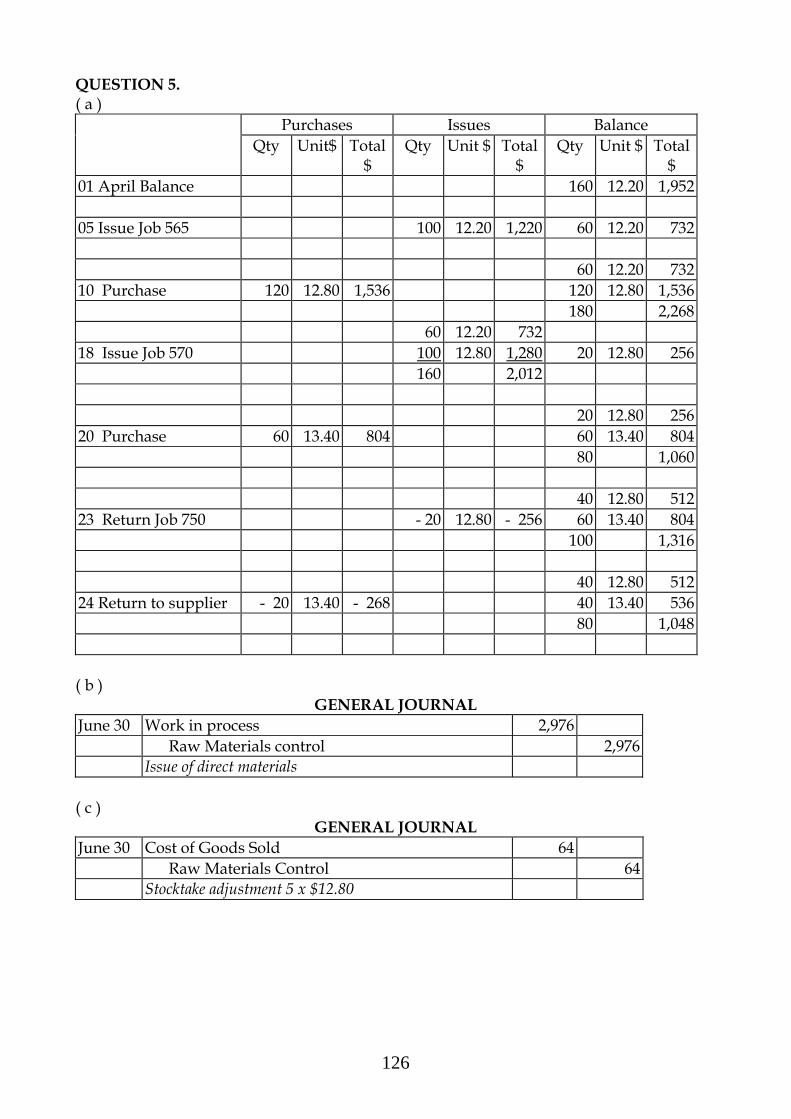
126
QUESTION 5. ( a )
Purchases Issues Balance Qty Unit$ Total
$ Qty Unit $ Total
$ Qty Unit $ Total
$ 01 April Balance 160 12.20 1,952
05 Issue Job 565 100 12.20 1,220 60 12.20 732 60 12.20 732 10 Purchase 120 12.80 1,536 120 12.80 1,536 180 2,268 60 12.20 732 18 Issue Job 570 100 12.80 1,280 20 12.80 256 160 2,012 20 12.80 256 20 Purchase 60 13.40 804 60 13.40 804 80 1,060 40 12.80 512 23 Return Job 750 - 20 12.80 - 256 60 13.40 804 100 1,316 40 12.80 512 24 Return to supplier - 20 13.40 - 268 40 13.40 536
80 1,048
( b )
GENERAL JOURNAL June 30 Work in process 2,976 Raw Materials control 2,976 Issue of direct materials ( c )
GENERAL JOURNAL June 30 Cost of Goods Sold 64 Raw Materials Control 64 Stocktake adjustment 5 x $12.80
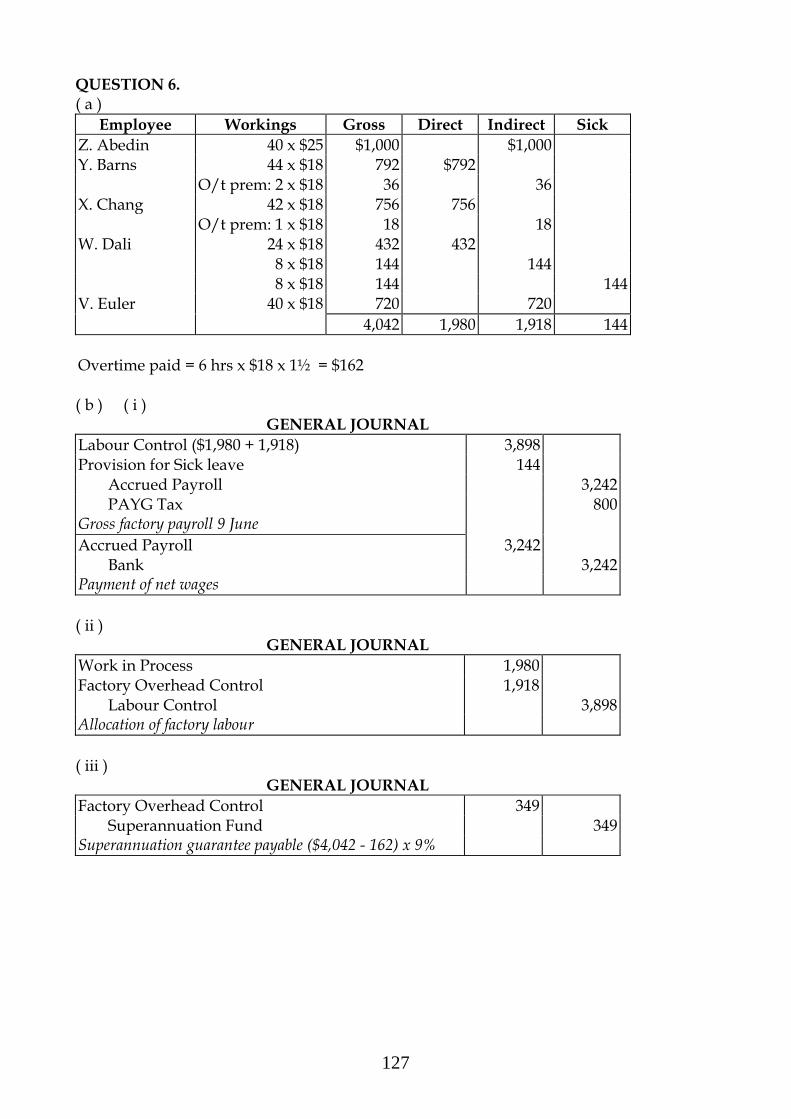
127
QUESTION 6. ( a )
Employee Workings Gross Direct Indirect Sick Z. Abedin 40 x $25 $1,000 $1,000 Y. Barns 44 x $18 792 $792 O/t prem: 2 x $18 36 36 X. Chang 42 x $18 756 756 O/t prem: 1 x $18 18 18 W. Dali 24 x $18 432 432 8 x $18 144 144 8 x $18 144 144 V. Euler 40 x $18 720 720 4,042 1,980 1,918 144 Overtime paid = 6 hrs x $18 x 1½ = $162 ( b ) ( i )
GENERAL JOURNAL Labour Control ($1,980 + 1,918) 3,898 Provision for Sick leave 144 Accrued Payroll 3,242 PAYG Tax 800 Gross factory payroll 9 June Accrued Payroll 3,242 Bank 3,242 Payment of net wages ( ii )
GENERAL JOURNAL Work in Process 1,980 Factory Overhead Control 1,918 Labour Control 3,898 Allocation of factory labour ( iii )
GENERAL JOURNAL Factory Overhead Control 349 Superannuation Fund 349 Superannuation guarantee payable ($4,042 - 162) x 9%
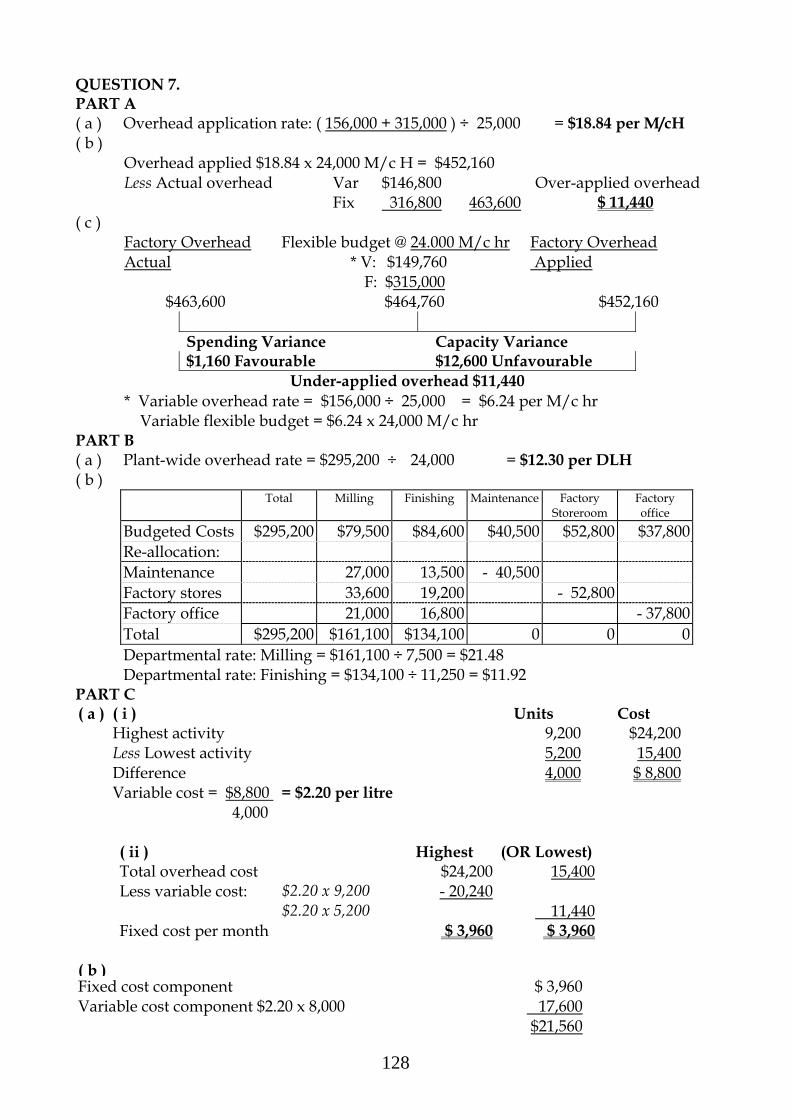
128
QUESTION 7. PART A ( a ) Overhead application rate: ( 156,000 + 315,000 ) ÷ 25,000 = $18.84 per M/cH ( b )
Overhead applied $18.84 x 24,000 M/c H = $452,160 Less Actual overhead Var $146,800 Over-applied overhead Fix 316,800 463,600 $ 11,440
( c ) Factory Overhead Actual
$463,600
Flexible budget @ 24.000 M/c hr * V: $149,760 F: $315,000 $464,760
Factory Overhead Applied
$452,160
Spending Variance Capacity Variance $1,160 Favourable $12,600 Unfavourable
Under-applied overhead $11,440 * Variable overhead rate = $156,000 ÷ 25,000 = $6.24 per M/c hr Variable flexible budget = $6.24 x 24,000 M/c hr
PART B ( a ) Plant-wide overhead rate = $295,200 ÷ 24,000 = $12.30 per DLH ( b )
Total Milling Finishing Maintenance Factory Storeroom
Factory office
Budgeted Costs $295,200 $79,500 $84,600 $40,500 $52,800 $37,800 Re-allocation: Maintenance 27,000 13,500 - 40,500 Factory stores 33,600 19,200 - 52,800 Factory office 21,000 16,800 - 37,800 Total $295,200 $161,100 $134,100 0 0 0 Departmental rate: Milling = $161,100 ÷ 7,500 = $21.48 Departmental rate: Finishing = $134,100 ÷ 11,250 = $11.92
PART C ( a ) ( i ) Units Cost Highest activity 9,200 $24,200 Less Lowest activity 5,200 15,400 Difference 4,000 $ 8,800 Variable cost = $8,800 = $2.20 per litre
4,000
( ii ) Highest (OR Lowest) Total overhead cost $24,200 15,400 Less variable cost: $2.20 x 9,200 - 20,240 $2.20 x 5,200 11,440 Fixed cost per month $ 3,960 $ 3,960 ( b ) Fixed cost component $ 3,960 Variable cost component $2.20 x 8,000 17,600 $21,560
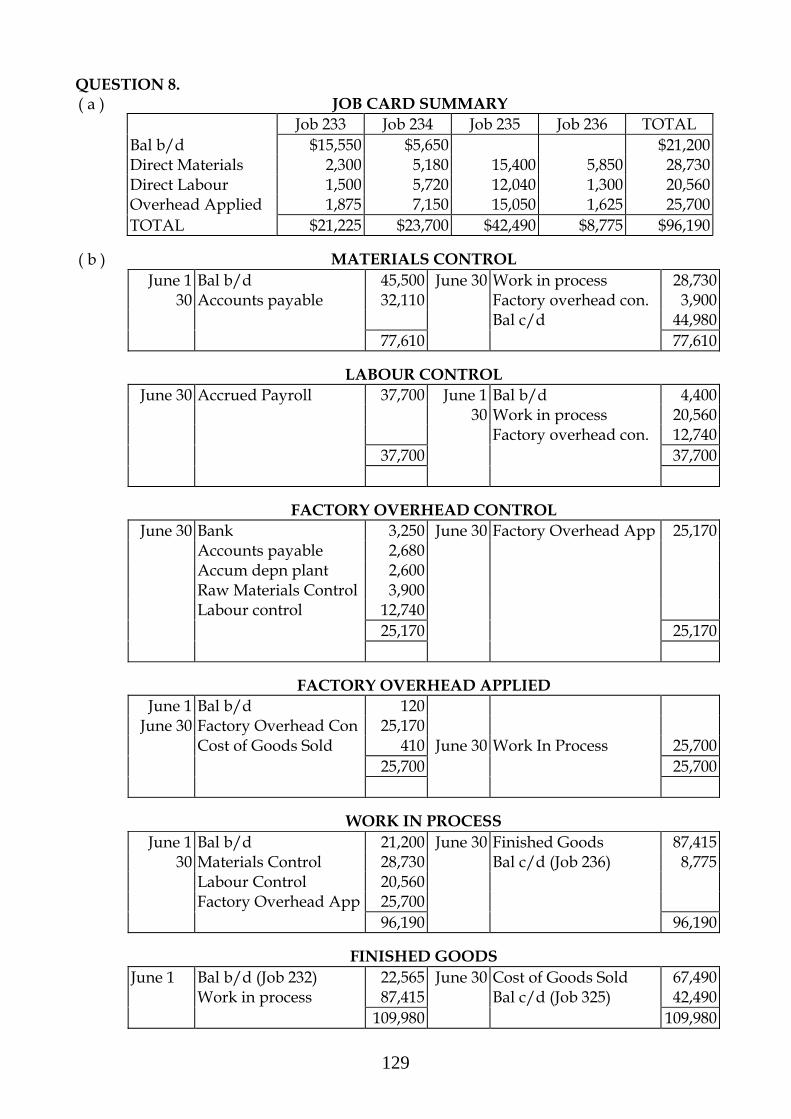
129
QUESTION 8. JOB CARD SUMMARY
Job 233 Job 234 Job 235 Job 236 TOTAL Bal b/d $15,550 $5,650 $21,200 Direct Materials 2,300 5,180 15,400 5,850 28,730 Direct Labour 1,500 5,720 12,040 1,300 20,560 Overhead Applied 1,875 7,150 15,050 1,625 25,700
( a )
TOTAL $21,225 $23,700 $42,490 $8,775 $96,190
( b ) MATERIALS CONTROL June 1 Bal b/d 45,500 June 30 Work in process 28,730 30 Accounts payable 32,110 Factory overhead con. 3,900 Bal c/d 44,980 77,610 77,610
LABOUR CONTROL June 30 Accrued Payroll 37,700 June 1 Bal b/d 4,400 30 Work in process 20,560 Factory overhead con. 12,740 37,700 37,700
FACTORY OVERHEAD CONTROL June 30 Bank 3,250 June 30 Factory Overhead App 25,170 Accounts payable 2,680 Accum depn plant 2,600 Raw Materials Control 3,900 Labour control 12,740 25,170 25,170
FACTORY OVERHEAD APPLIED June 1 Bal b/d 120 June 30 Factory Overhead Con 25,170 Cost of Goods Sold 410 June 30 Work In Process 25,700 25,700 25,700
WORK IN PROCESS June 1 Bal b/d 21,200 June 30 Finished Goods 87,415 30 Materials Control 28,730 Bal c/d (Job 236) 8,775 Labour Control 20,560 Factory Overhead App 25,700 96,190 96,190
FINISHED GOODS June 1 Bal b/d (Job 232) 22,565 June 30 Cost of Goods Sold 67,490 Work in process 87,415 Bal c/d (Job 325) 42,490 109,980 109,980
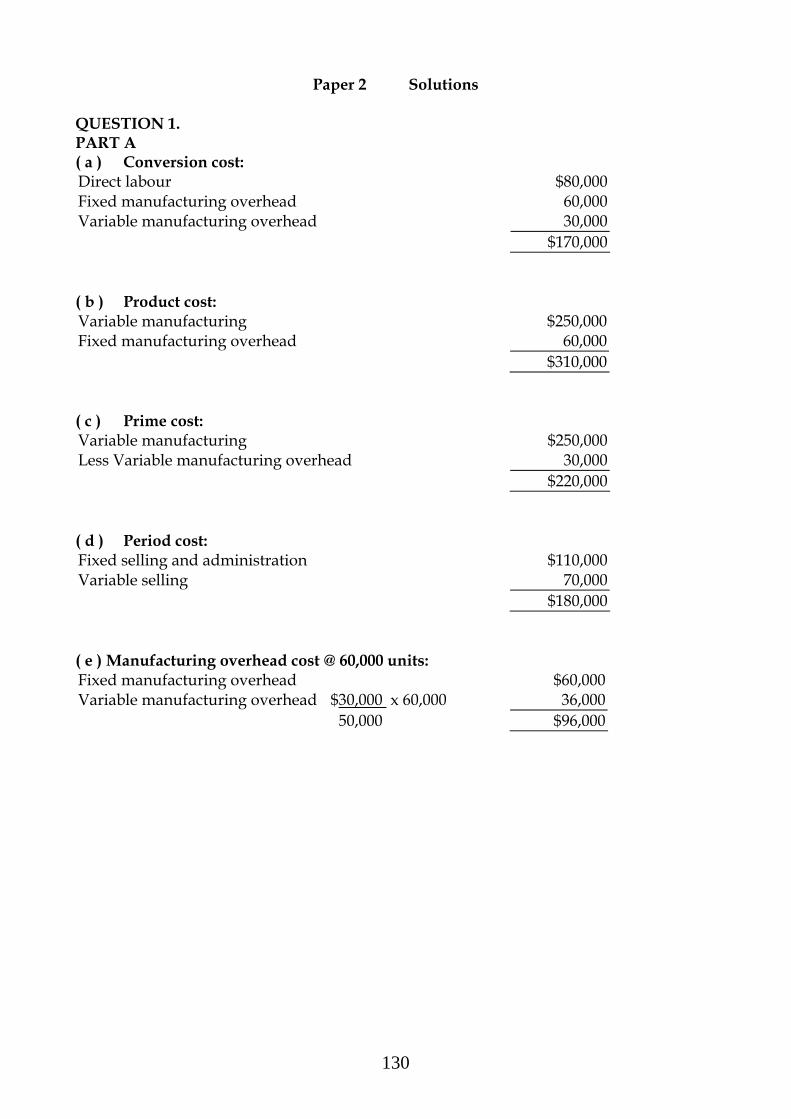
130
Paper 2 Solutions QUESTION 1. PART A ( a ) Conversion cost: Direct labour $80,000 Fixed manufacturing overhead 60,000 Variable manufacturing overhead 30,000 $170,000 ( b ) Product cost: Variable manufacturing $250,000 Fixed manufacturing overhead 60,000 $310,000 ( c ) Prime cost: Variable manufacturing $250,000 Less Variable manufacturing overhead 30,000 $220,000 ( d ) Period cost: Fixed selling and administration $110,000 Variable selling 70,000 $180,000 ( e ) Manufacturing overhead cost @ 60,000 units: Fixed manufacturing overhead $60,000 Variable manufacturing overhead $30,000 x 60,000 36,000 50,000 $96,000
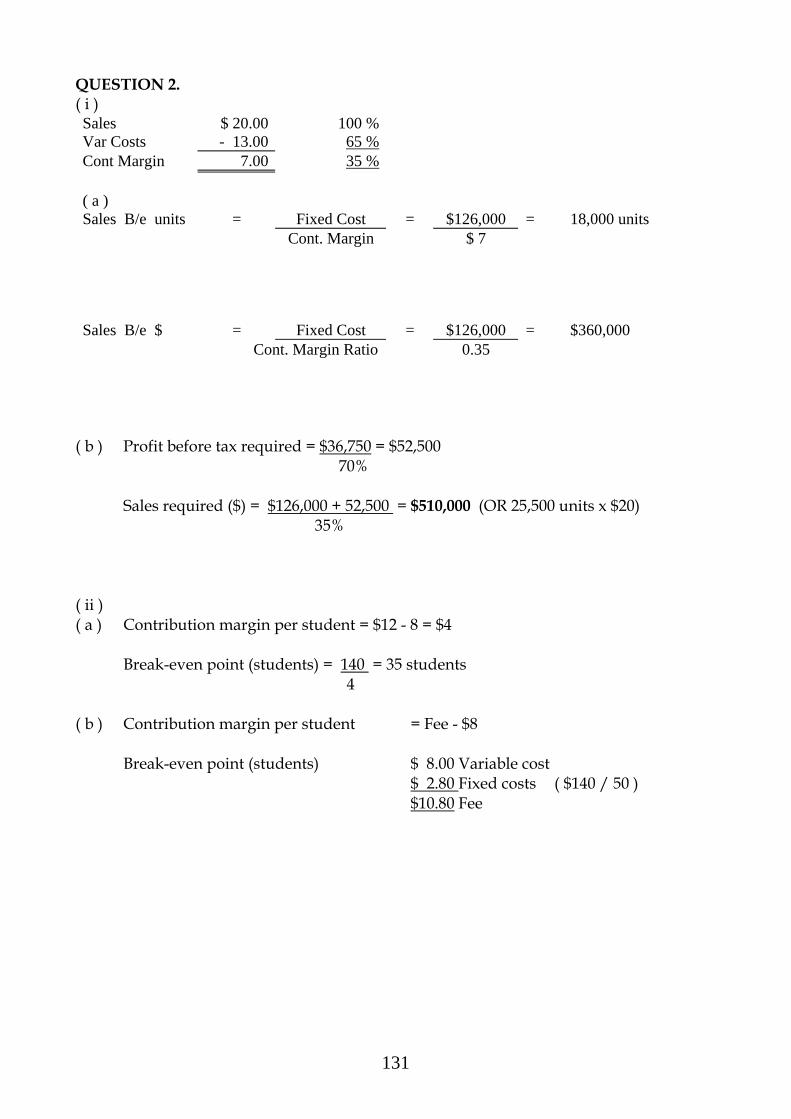
131
QUESTION 2. ( i ) Sales $ 20.00 100 % Var Costs - 13.00 65 % Cont Margin 7.00 35 % ( a ) Sales B/e units = Fixed Cost = $126,000 = 18,000 units Cont. Margin $ 7 Sales B/e $ = Fixed Cost = $126,000 = $360,000 Cont. Margin Ratio 0.35
( b ) Profit before tax required = $36,750 = $52,500 70%
Sales required ($) = $126,000 + 52,500 = $510,000 (OR 25,500 units x $20) 35%
( ii ) ( a ) Contribution margin per student = $12 - 8 = $4
Break-even point (students) = 140 = 35 students 4 ( b ) Contribution margin per student = Fee - $8
Break-even point (students) $ 8.00 Variable cost $ 2.80 Fixed costs ( $140 / 50 ) $10.80 Fee
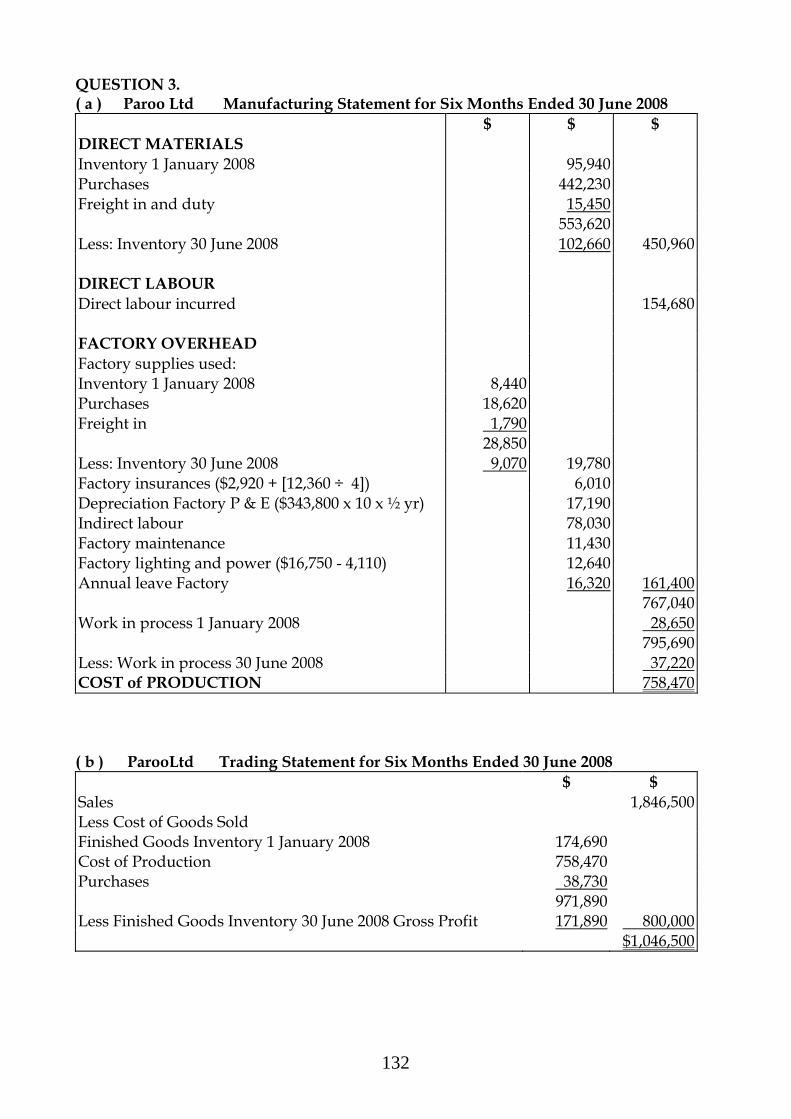
132
QUESTION 3. ( a ) Paroo Ltd Manufacturing Statement for Six Months Ended 30 June 2008 $ $ $ DIRECT MATERIALS Inventory 1 January 2008 95,940 Purchases 442,230 Freight in and duty 15,450 553,620 Less: Inventory 30 June 2008 102,660 450,960 DIRECT LABOUR Direct labour incurred 154,680 FACTORY OVERHEAD Factory supplies used: Inventory 1 January 2008 8,440 Purchases 18,620 Freight in 1,790 28,850 Less: Inventory 30 June 2008 9,070 19,780 Factory insurances ($2,920 + [12,360 ÷ 4]) 6,010 Depreciation Factory P & E ($343,800 x 10 x ½ yr) 17,190 Indirect labour 78,030 Factory maintenance 11,430 Factory lighting and power ($16,750 - 4,110) 12,640 Annual leave Factory 16,320 161,400 767,040 Work in process 1 January 2008 28,650 795,690 Less: Work in process 30 June 2008 37,220 COST of PRODUCTION 758,470 ( b ) ParooLtd Trading Statement for Six Months Ended 30 June 2008 $ $ Sales 1,846,500 Less Cost of Goods Sold Finished Goods Inventory 1 January 2008 174,690 Cost of Production 758,470 Purchases 38,730 971,890 Less Finished Goods Inventory 30 June 2008 Gross Profit 171,890 800,000 $1,046,500
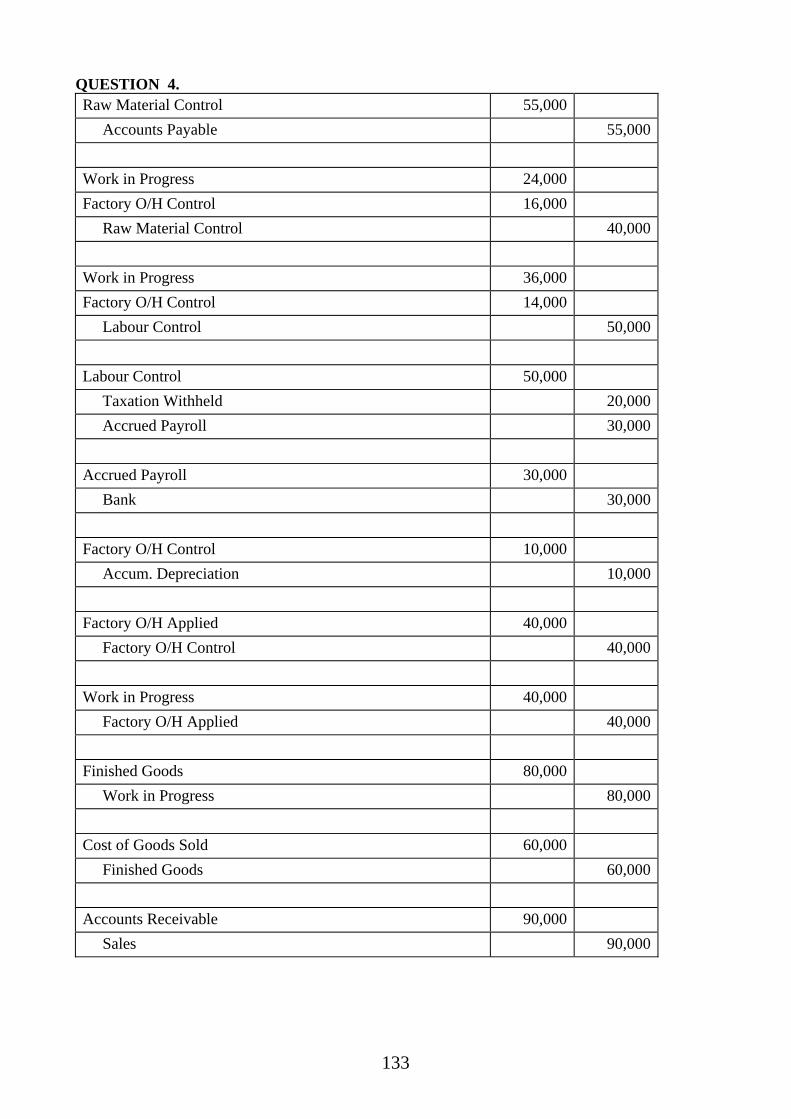
133
QUESTION 4. Raw Material Control 55,000 Accounts Payable 55,000 Work in Progress 24,000 Factory O/H Control 16,000 Raw Material Control 40,000 Work in Progress 36,000 Factory O/H Control 14,000 Labour Control 50,000 Labour Control 50,000 Taxation Withheld 20,000 Accrued Payroll 30,000 Accrued Payroll 30,000 Bank 30,000 Factory O/H Control 10,000 Accum. Depreciation 10,000 Factory O/H Applied 40,000 Factory O/H Control 40,000 Work in Progress 40,000 Factory O/H Applied 40,000 Finished Goods 80,000 Work in Progress 80,000 Cost of Goods Sold 60,000 Finished Goods 60,000 Accounts Receivable 90,000 Sales 90,000

134
QUESTION 5. ( a )
Purchases Issues Balance Qty Unit$ Total
$ Qty Unit $ Total
$ Qty Unit $ Total
$ June 1 Balance 240 6.00 1,440
240 6.00 1,440
5 Purchase 160 5.50 880 160 5.50 880 400 2,320
9 Issue Job 562 140 6.00 840 100 6.00 600 160 5.50 880 260 1,480
15 Issue Job 566 80 6.00 480 20 6.00 120 160 5.50 880 180 1,000
19 Issue Job 571 20 6.00 120 80 5.50 440 80 5.50 440 100 560 80 5.50 440
21 Purchase 240 6.00 1,440 240 6.00 1,440 320 1,880
29 Issue Job 580 80 5.50 440 20 6.00 120 220 6.00 1,320 100 2,440
( b )
GENERAL JOURNAL June 30 Work in process 2,440 Raw Materials control 2,440 Issue of direct materials ( c )
GENERAL JOURNAL June 30 Cost of Goods Sold 120 Raw Materials Control 120 Stocktake adjustment 20 x $6
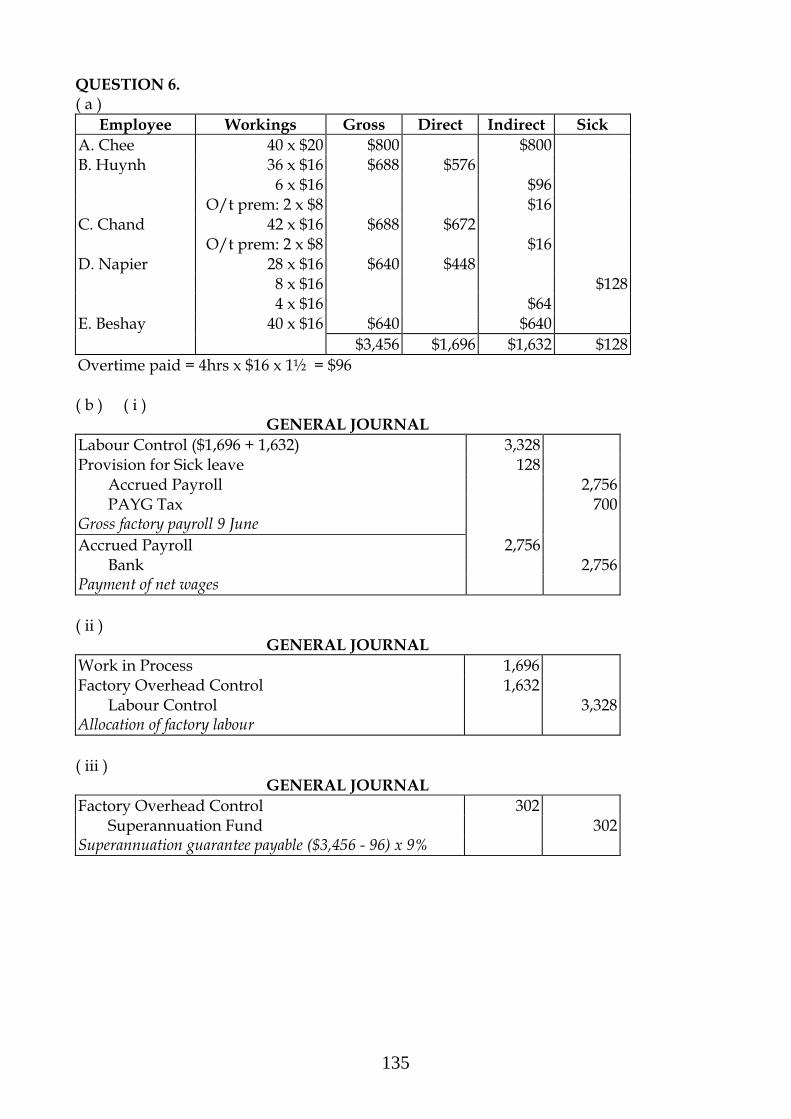
135
QUESTION 6. ( a )
Employee Workings Gross Direct Indirect Sick A. Chee 40 x $20 $800 $800 B. Huynh 36 x $16 $688 $576 6 x $16 $96 O/t prem: 2 x $8 $16 C. Chand 42 x $16 $688 $672 O/t prem: 2 x $8 $16 D. Napier 28 x $16 $640 $448 8 x $16 $128 4 x $16 $64 E. Beshay 40 x $16 $640 $640 $3,456 $1,696 $1,632 $128 Overtime paid = 4hrs x $16 x 1½ = $96 ( b ) ( i )
GENERAL JOURNAL Labour Control ($1,696 + 1,632) 3,328 Provision for Sick leave 128 Accrued Payroll 2,756 PAYG Tax 700 Gross factory payroll 9 June Accrued Payroll 2,756 Bank 2,756 Payment of net wages ( ii )
GENERAL JOURNAL Work in Process 1,696 Factory Overhead Control 1,632 Labour Control 3,328 Allocation of factory labour ( iii )
GENERAL JOURNAL Factory Overhead Control 302 Superannuation Fund 302 Superannuation guarantee payable ($3,456 - 96) x 9%
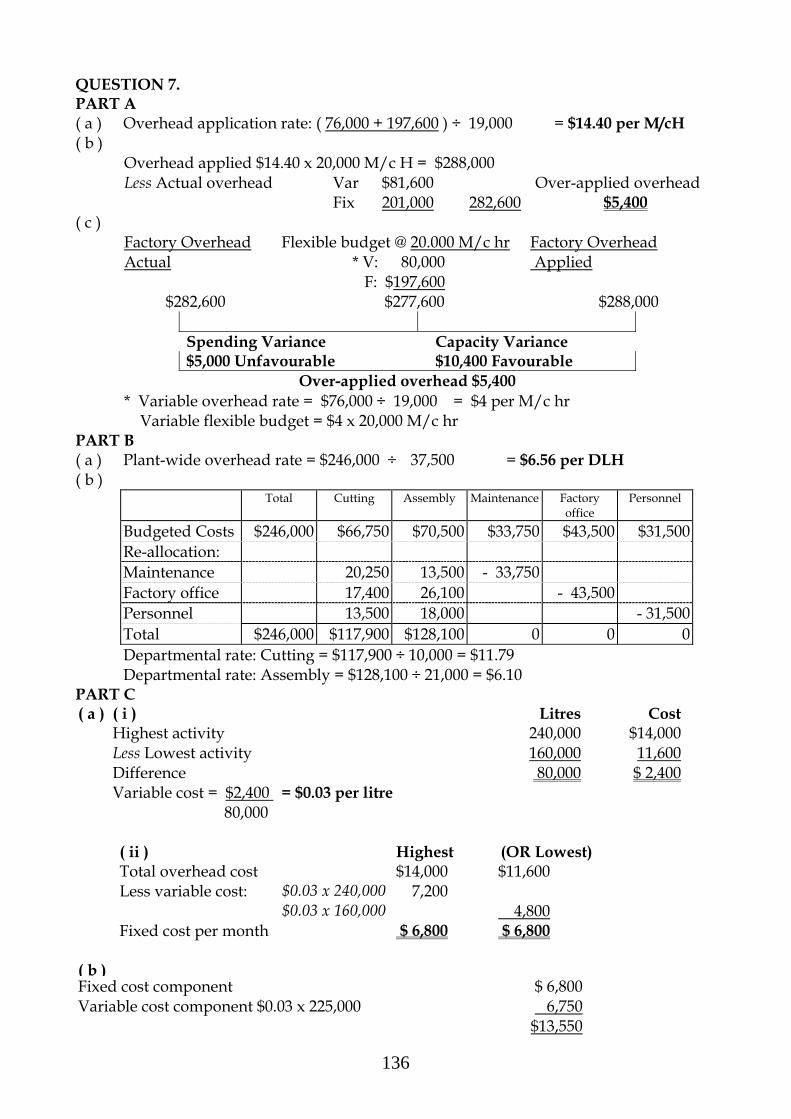
136
QUESTION 7. PART A ( a ) Overhead application rate: ( 76,000 + 197,600 ) ÷ 19,000 = $14.40 per M/cH ( b )
Overhead applied $14.40 x 20,000 M/c H = $288,000 Less Actual overhead Var $81,600 Over-applied overhead Fix 201,000 282,600 $5,400
( c ) Factory Overhead Actual
$282,600
Flexible budget @ 20.000 M/c hr * V: 80,000 F: $197,600 $277,600
Factory Overhead Applied
$288,000
Spending Variance Capacity Variance $5,000 Unfavourable $10,400 Favourable
Over-applied overhead $5,400 * Variable overhead rate = $76,000 ÷ 19,000 = $4 per M/c hr Variable flexible budget = $4 x 20,000 M/c hr
PART B ( a ) Plant-wide overhead rate = $246,000 ÷ 37,500 = $6.56 per DLH ( b )
Total Cutting Assembly Maintenance Factory office
Personnel
Budgeted Costs $246,000 $66,750 $70,500 $33,750 $43,500 $31,500 Re-allocation: Maintenance 20,250 13,500 - 33,750 Factory office 17,400 26,100 - 43,500 Personnel 13,500 18,000 - 31,500 Total $246,000 $117,900 $128,100 0 0 0 Departmental rate: Cutting = $117,900 ÷ 10,000 = $11.79 Departmental rate: Assembly = $128,100 ÷ 21,000 = $6.10
PART C ( a ) ( i ) Litres Cost Highest activity 240,000 $14,000 Less Lowest activity 160,000 11,600 Difference 80,000 $ 2,400 Variable cost = $2,400 = $0.03 per litre
80,000
( ii ) Highest (OR Lowest) Total overhead cost $14,000 $11,600 Less variable cost: $0.03 x 240,000 7,200 $0.03 x 160,000 4,800 Fixed cost per month $ 6,800 $ 6,800 ( b ) Fixed cost component $ 6,800 Variable cost component $0.03 x 225,000 6,750 $13,550
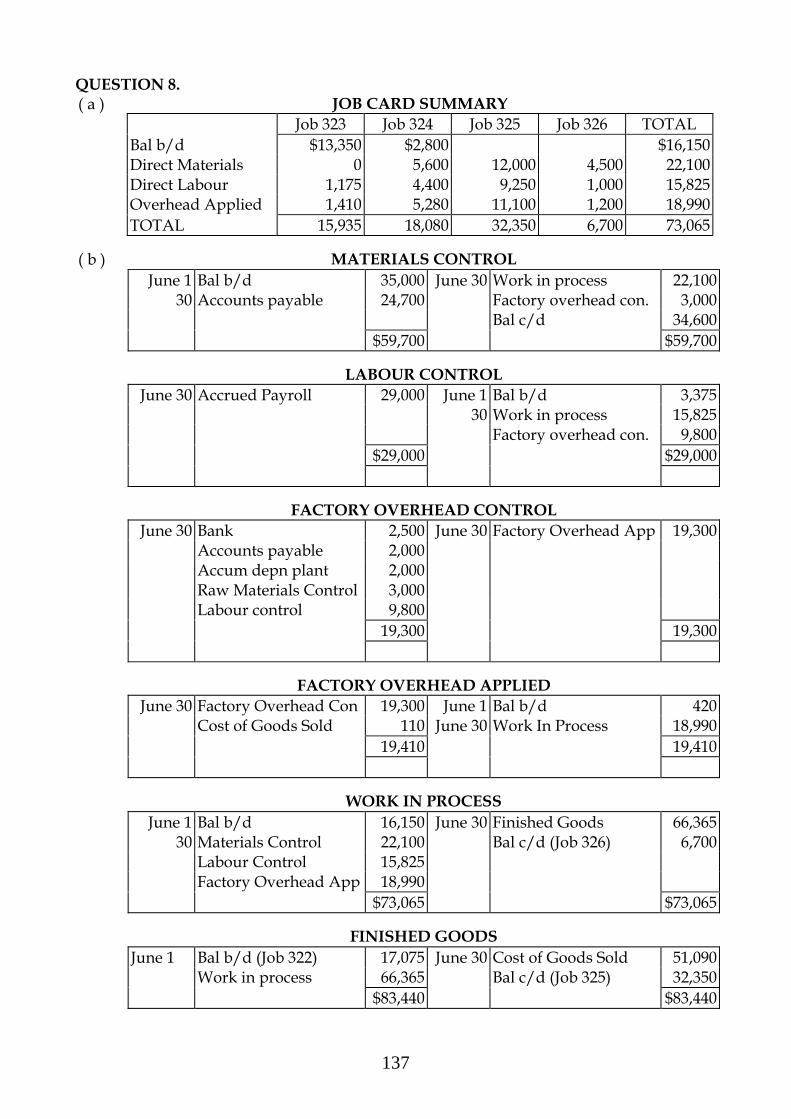
137
QUESTION 8. JOB CARD SUMMARY
Job 323 Job 324 Job 325 Job 326 TOTAL Bal b/d $13,350 $2,800 $16,150 Direct Materials 0 5,600 12,000 4,500 22,100 Direct Labour 1,175 4,400 9,250 1,000 15,825 Overhead Applied 1,410 5,280 11,100 1,200 18,990
( a )
TOTAL 15,935 18,080 32,350 6,700 73,065
( b ) MATERIALS CONTROL June 1 Bal b/d 35,000 June 30 Work in process 22,100 30 Accounts payable 24,700 Factory overhead con. 3,000 Bal c/d 34,600 $59,700 $59,700
LABOUR CONTROL June 30 Accrued Payroll 29,000 June 1 Bal b/d 3,375 30 Work in process 15,825 Factory overhead con. 9,800 $29,000 $29,000
FACTORY OVERHEAD CONTROL June 30 Bank 2,500 June 30 Factory Overhead App 19,300 Accounts payable 2,000 Accum depn plant 2,000 Raw Materials Control 3,000 Labour control 9,800 19,300 19,300
FACTORY OVERHEAD APPLIED June 30 Factory Overhead Con 19,300 June 1 Bal b/d 420 Cost of Goods Sold 110 June 30 Work In Process 18,990 19,410 19,410
WORK IN PROCESS June 1 Bal b/d 16,150 June 30 Finished Goods 66,365 30 Materials Control 22,100 Bal c/d (Job 326) 6,700 Labour Control 15,825 Factory Overhead App 18,990 $73,065 $73,065
FINISHED GOODS June 1 Bal b/d (Job 322) 17,075 June 30 Cost of Goods Sold 51,090 Work in process 66,365 Bal c/d (Job 325) 32,350 $83,440 $83,440

138
Paper 3 Solutions
QUESTION 1. ( a ) Direct Labour: Conversion Costs $ 150,000 Fixed manufacturing overhead 56,000 Variable manufacturing overhead 20,000 - 76,000 $ 74,000 ( b ) Variable Conversion Cost: Direct labour $ 74,000 Variable manufacturing overhead 20,000 $ 94,000 ( c ) Product Cost: Prime Cost $237,000 Fixed manufacturing overhead 56,000 Variable manufacturing overhead 20,000 76,000 $ 313,000 ( d ) Period cost: Fixed selling and administration $130,000 Variable selling 45,000 $175,000 ( e ) Manufacturing overhead cost @ 25,000 units: Fixed manufacturing overhead $ 56,000 Variable manufacturing overhead (20,000 / 20,000) x 25,000 25,000 $ 81,000 QUESTION 2. $ % ( a ) Contribution margin: Sales $80 100
Var Costs $60 75 Contribution Margin $20 25
( i ) Break-even point (units) = $142,500 = 7,125 units $20 ( ii ) Sales required ($) = $142,500 + 50,000 = 9,625 units
$ 20 ( iii ) Profit before tax required = $42,000 = $60,000 70%
Sales required ($) = $145,500 + 60,000 = 10,125 units $ 20
( i ) ( a ) $40,000 ( ii ) ( c ) If sales fall by 25%, net profit will be nil.
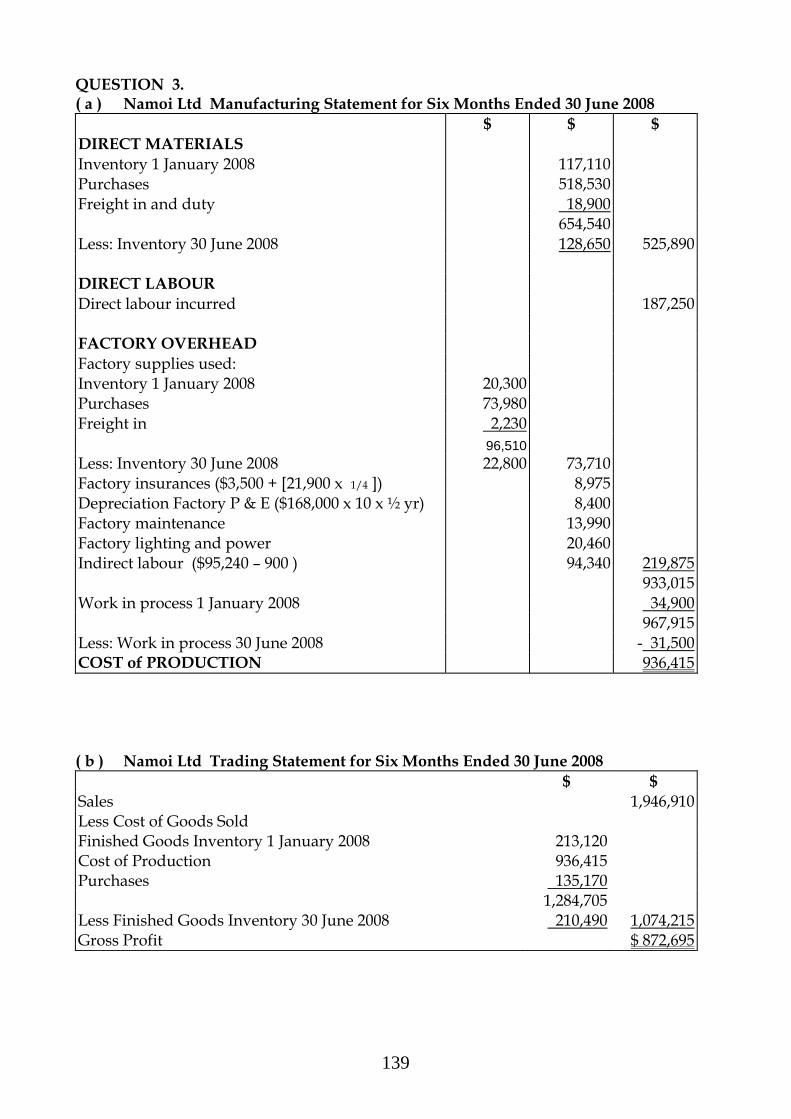
139
QUESTION 3. ( a ) Namoi Ltd Manufacturing Statement for Six Months Ended 30 June 2008 $ $ $ DIRECT MATERIALS Inventory 1 January 2008 117,110 Purchases 518,530 Freight in and duty 18,900 654,540 Less: Inventory 30 June 2008 128,650 525,890 DIRECT LABOUR Direct labour incurred 187,250 FACTORY OVERHEAD Factory supplies used: Inventory 1 January 2008 20,300 Purchases 73,980 Freight in 2,230 96,510 Less: Inventory 30 June 2008 22,800 73,710 Factory insurances ($3,500 + [21,900 x 1/4 ]) 8,975 Depreciation Factory P & E ($168,000 x 10 x ½ yr) 8,400 Factory maintenance 13,990 Factory lighting and power 20,460 Indirect labour ($95,240 – 900 ) 94,340 219,875 933,015 Work in process 1 January 2008 34,900 967,915 Less: Work in process 30 June 2008 - 31,500 COST of PRODUCTION 936,415 ( b ) Namoi Ltd Trading Statement for Six Months Ended 30 June 2008 $ $ Sales 1,946,910 Less Cost of Goods Sold Finished Goods Inventory 1 January 2008 213,120 Cost of Production 936,415 Purchases 135,170 1,284,705 Less Finished Goods Inventory 30 June 2008 210,490 1,074,215 Gross Profit $ 872,695
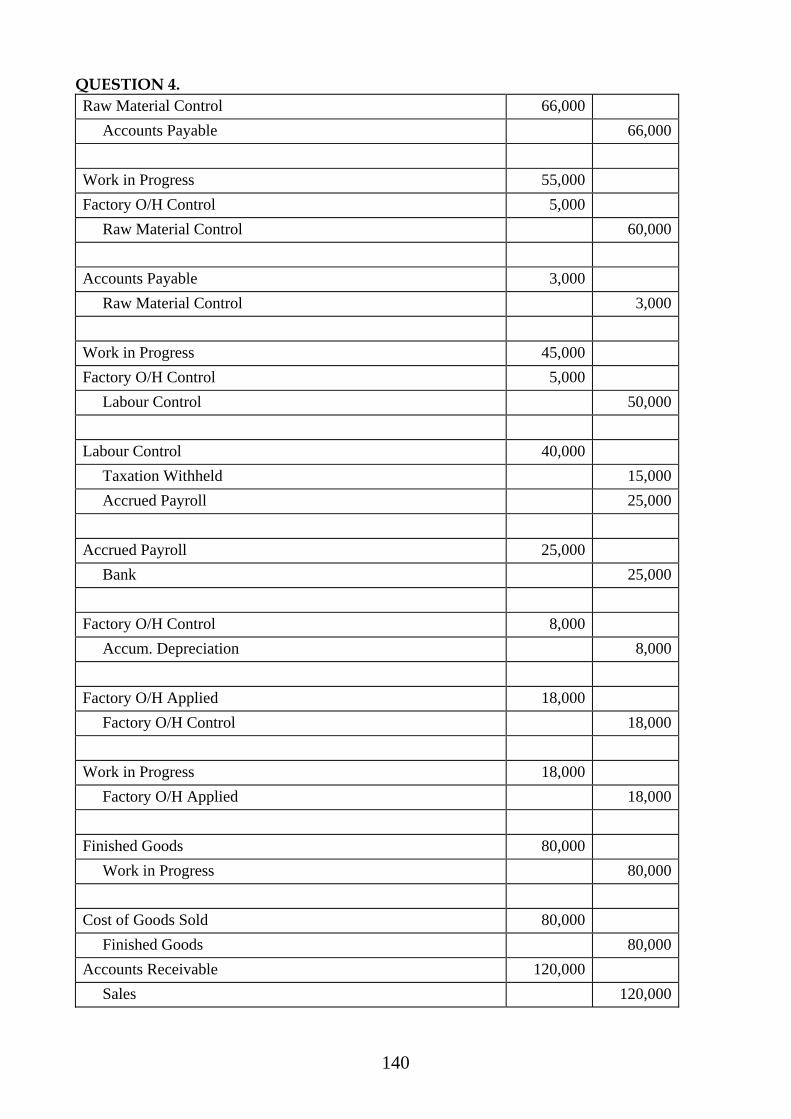
140
QUESTION 4. Raw Material Control 66,000 Accounts Payable 66,000 Work in Progress 55,000 Factory O/H Control 5,000 Raw Material Control 60,000 Accounts Payable 3,000 Raw Material Control 3,000 Work in Progress 45,000 Factory O/H Control 5,000 Labour Control 50,000 Labour Control 40,000 Taxation Withheld 15,000 Accrued Payroll 25,000 Accrued Payroll 25,000 Bank 25,000 Factory O/H Control 8,000 Accum. Depreciation 8,000 Factory O/H Applied 18,000 Factory O/H Control 18,000 Work in Progress 18,000 Factory O/H Applied 18,000 Finished Goods 80,000 Work in Progress 80,000 Cost of Goods Sold 80,000 Finished Goods 80,000Accounts Receivable 120,000 Sales 120,000
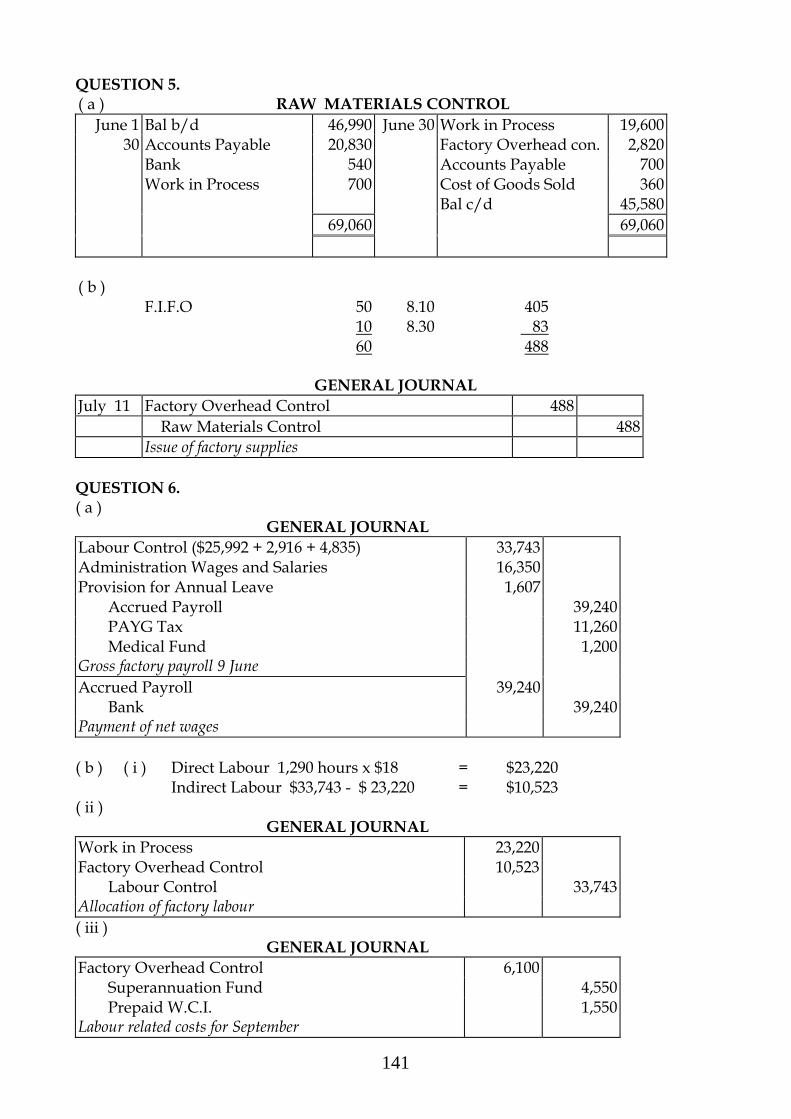
141
QUESTION 5. ( a ) RAW MATERIALS CONTROL
June 1 Bal b/d 46,990 June 30 Work in Process 19,600 30 Accounts Payable 20,830 Factory Overhead con. 2,820
Bank 540 Accounts Payable 700 Work in Process 700 Cost of Goods Sold 360 Bal c/d 45,580 69,060 69,060
GENERAL JOURNAL
July 11 Factory Overhead Control 488 Raw Materials Control 488 Issue of factory supplies QUESTION 6. ( a )
GENERAL JOURNAL Labour Control ($25,992 + 2,916 + 4,835) 33,743 Administration Wages and Salaries 16,350 Provision for Annual Leave 1,607 Accrued Payroll 39,240 PAYG Tax 11,260 Medical Fund 1,200 Gross factory payroll 9 June Accrued Payroll 39,240 Bank 39,240 Payment of net wages ( b ) ( i ) Direct Labour 1,290 hours x $18 = $23,220 Indirect Labour $33,743 - $ 23,220 = $10,523 ( ii )
GENERAL JOURNAL Work in Process 23,220 Factory Overhead Control 10,523 Labour Control 33,743 Allocation of factory labour ( iii )
GENERAL JOURNAL Factory Overhead Control 6,100 Superannuation Fund 4,550 Prepaid W.C.I. 1,550 Labour related costs for September
( b ) F.I.F.O 50 8.10 405
10 8.30 83 60 488

142
QUESTION 7. PART A ( a ) i Overhead application rate: 88,500 + 159,000 = $16.50 per M/cH
15,000 ( b ) ii
Overhead applied $16.50 x 16,000 M/c H = $264,000 Less Actual overhead Var $92,800 Fix 160,000 252,800 Over-applied overhead $ 11,200
Factory Overhead Applied $ 11,200 Cost of Goods Sold $ 11,200 Transfer of over applied overhead ( b )
Factory Overhead Actual $252,800
Flexible budget @ 16.000 M/c H * V: 94,400 ( 16,000 x 5.90 )
F: $159,000 $253,400
Factory Overhead Applied
$264,000
Spending Variance Capacity Variance $ 600 Favourable $10,600 Favourable
Over-applied overhead $ 11,200 * Variable overhead rate = $76,000 = $4 per M/c H 19,000
PART B ( a ) Plant-wide overhead rate = $187,000 ÷ 22,000 = $8.50 per DLH ( b )
Total Brewing Bottling Maintenance Factory office Budgeted Costs $187,000 $49,500 $71,920 $28,700 $36,880 Re-allocation: Maintenance 8,200 20,500 - 28,700 Factory office 23,050 13,830 - 36,880 Total $187,000 $ 80,750 $106,250 0 0 Departmental rate: Brewing = $80,750 ÷ 12,500 = $ 6.46 Departmental rate: Bottling = $106,250 ÷ 8,500 = $12.50
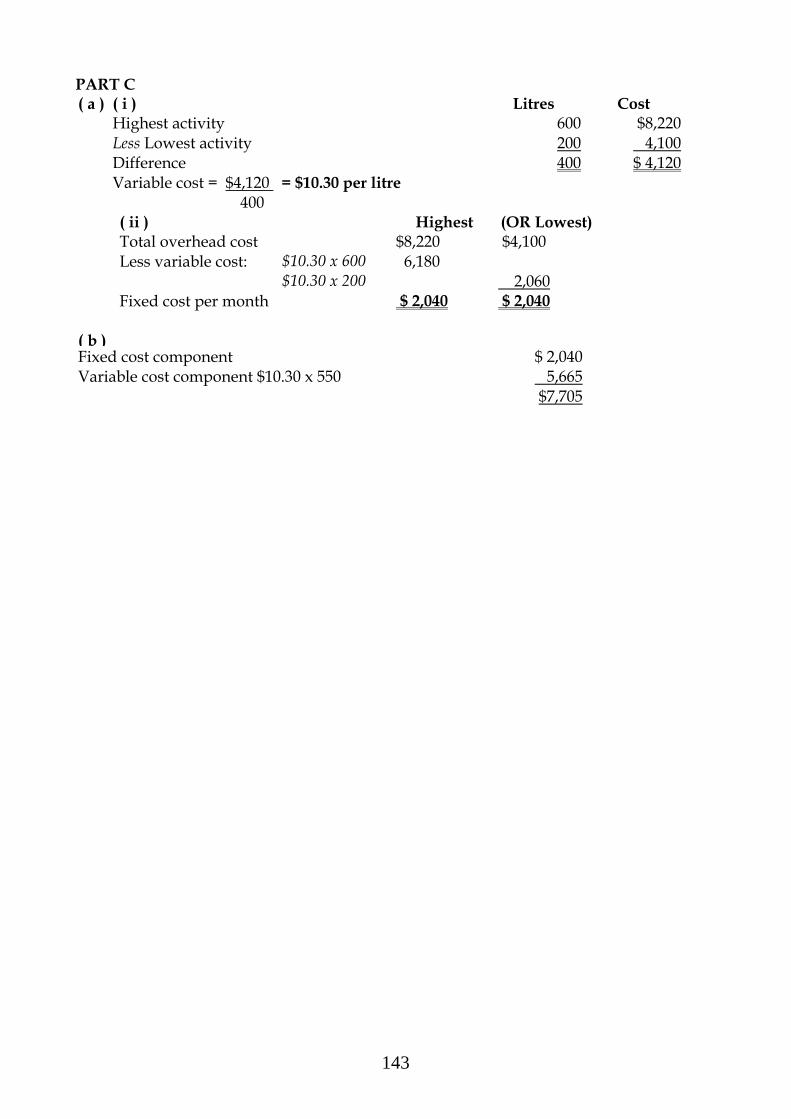
143
PART C ( a ) ( i ) Litres Cost Highest activity 600 $8,220 Less Lowest activity 200 4,100 Difference 400 $ 4,120 Variable cost = $4,120 = $10.30 per litre
400
( ii ) Highest (OR Lowest) Total overhead cost $8,220 $4,100 Less variable cost: $10.30 x 600 6,180 $10.30 x 200 2,060 Fixed cost per month $ 2,040 $ 2,040 ( b ) Fixed cost component $ 2,040 Variable cost component $10.30 x 550 5,665 $7,705
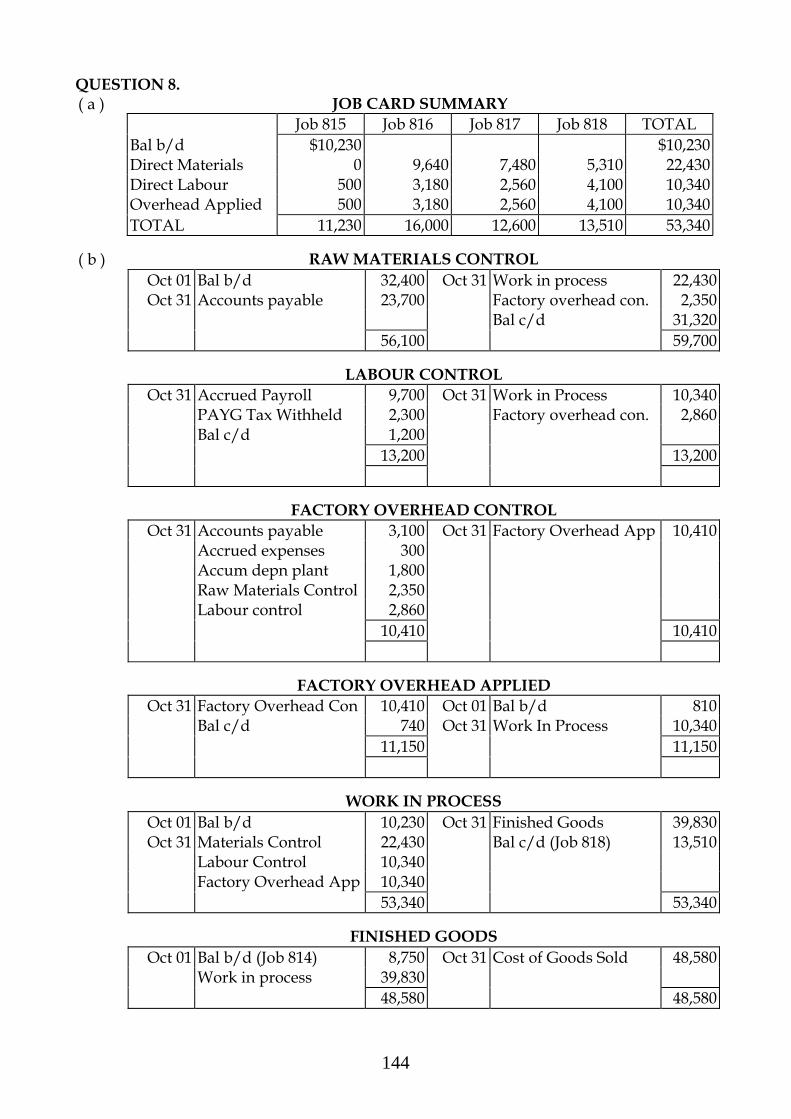
144
QUESTION 8. JOB CARD SUMMARY
Job 815 Job 816 Job 817 Job 818 TOTAL Bal b/d $10,230 $10,230 Direct Materials 0 9,640 7,480 5,310 22,430 Direct Labour 500 3,180 2,560 4,100 10,340 Overhead Applied 500 3,180 2,560 4,100 10,340
( a )
TOTAL 11,230 16,000 12,600 13,510 53,340
( b ) RAW MATERIALS CONTROL Oct 01 Bal b/d 32,400 Oct 31 Work in process 22,430 Oct 31 Accounts payable 23,700 Factory overhead con. 2,350 Bal c/d 31,320 56,100 59,700
LABOUR CONTROL Oct 31 Accrued Payroll 9,700 Oct 31 Work in Process 10,340 PAYG Tax Withheld 2,300 Factory overhead con. 2,860 Bal c/d 1,200 13,200 13,200
FACTORY OVERHEAD CONTROL Oct 31 Accounts payable 3,100 Oct 31 Factory Overhead App 10,410 Accrued expenses 300 Accum depn plant 1,800 Raw Materials Control 2,350 Labour control 2,860 10,410 10,410
FACTORY OVERHEAD APPLIED Oct 31 Factory Overhead Con 10,410 Oct 01 Bal b/d 810 Bal c/d 740 Oct 31 Work In Process 10,340 11,150 11,150
WORK IN PROCESS Oct 01 Bal b/d 10,230 Oct 31 Finished Goods 39,830 Oct 31 Materials Control 22,430 Bal c/d (Job 818) 13,510 Labour Control 10,340 Factory Overhead App 10,340 53,340 53,340
FINISHED GOODS Oct 01 Bal b/d (Job 814) 8,750 Oct 31 Cost of Goods Sold 48,580 Work in process 39,830 48,580 48,580

145
Class Tests
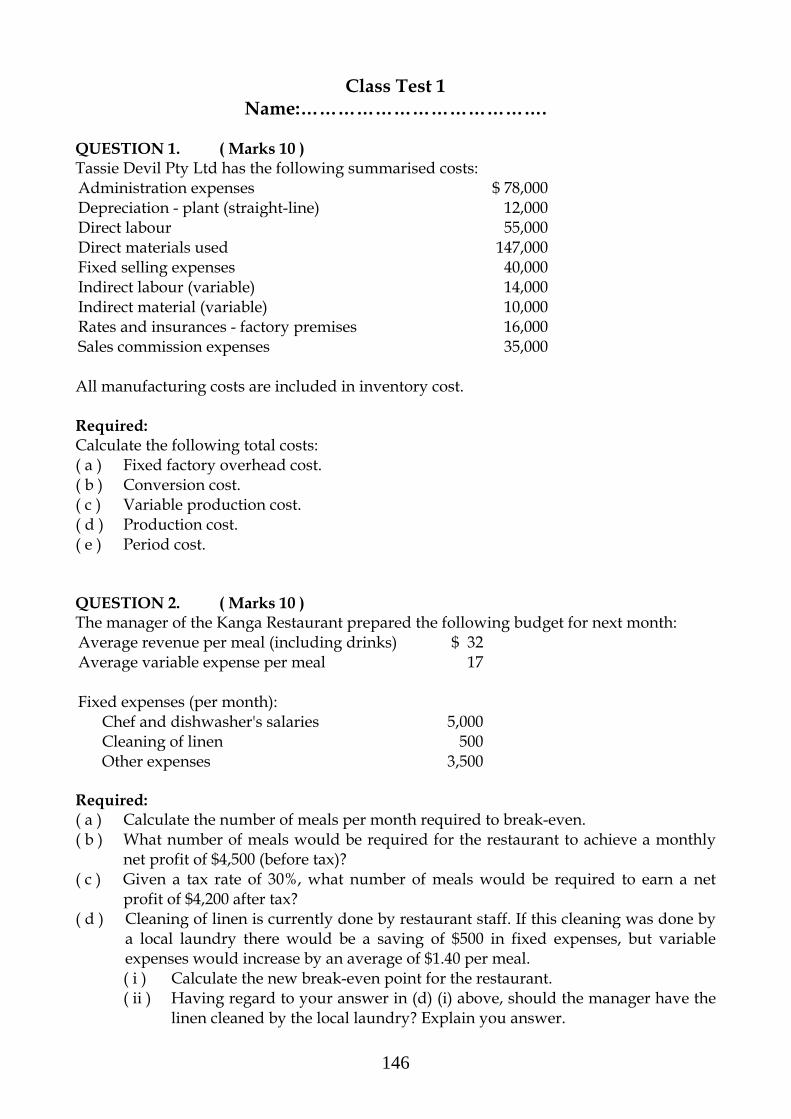
146
Class Test 1 Name:………………………………….
QUESTION 1. ( Marks 10 ) Tassie Devil Pty Ltd has the following summarised costs: Administration expenses $ 78,000 Depreciation - plant (straight-line) 12,000 Direct labour 55,000 Direct materials used 147,000 Fixed selling expenses 40,000 Indirect labour (variable) 14,000 Indirect material (variable) 10,000 Rates and insurances - factory premises 16,000 Sales commission expenses 35,000 All manufacturing costs are included in inventory cost. Required: Calculate the following total costs: ( a ) Fixed factory overhead cost. ( b ) Conversion cost. ( c ) Variable production cost. ( d ) Production cost. ( e ) Period cost. QUESTION 2. ( Marks 10 ) The manager of the Kanga Restaurant prepared the following budget for next month: Average revenue per meal (including drinks) $ 32 Average variable expense per meal 17 Fixed expenses (per month): Chef and dishwasher's salaries 5,000 Cleaning of linen 500 Other expenses 3,500 Required: ( a ) Calculate the number of meals per month required to break-even. ( b ) What number of meals would be required for the restaurant to achieve a monthly
net profit of $4,500 (before tax)? ( c ) Given a tax rate of 30%, what number of meals would be required to earn a net
profit of $4,200 after tax? ( d ) Cleaning of linen is currently done by restaurant staff. If this cleaning was done by
a local laundry there would be a saving of $500 in fixed expenses, but variable expenses would increase by an average of $1.40 per meal. ( i ) Calculate the new break-even point for the restaurant. ( ii ) Having regard to your answer in (d) (i) above, should the manager have the
linen cleaned by the local laundry? Explain you answer.

147
QUESTION 3. ( Marks 15 ) Thai Ltd produces conveyor belts. Rubber, polyester fabric and steel cord are coated with direct materials. The following financial information is for the year to 30 June 2009: 01/07/08 30/06/09 Inventories: Raw Material $ 29,900 $ 33,730 Indirect Materials 2,840 3,270 Work in Process 13,590 18,520 Finished Goods 51,510 47,350 Prepaid factory insurance 1,850 ? Accrued electricity: Factory 2,480 2,600 Administration 380 420 Sales 906,810 Other operating income 6,250 Customs duty – Raw Material 5,470 Discount allowed 9,540 Electricity paid: Factory 15,240 Administration 2,400 Factory insurance - annual premium due and paid 1/12/08 4,560 Freight inwards: Raw Material 8,040 Indirect Materials 690 Finished Goods 3,870 Freight outwards 18,050 Interest on bank loan 11,090 Purchases: Raw Material 206,230 Indirect Materials 15,760 Finished Goods 39,810 Other selling and administrative expenses 105,880 Repairs to plant & machinery 8,790 Wages and salaries: Productive labour 82,340 Non Productive labour 29,520 Selling and administration 65,100 Other information: Factory plant & machinery at cost 1/7/08 (depreciated straightline @ 15% p.a.) 143,000 Required: Prepare the following classified statements for the year ended 30 June 2009: ( a ) Manufacturing statement. ( b ) Trading statement.
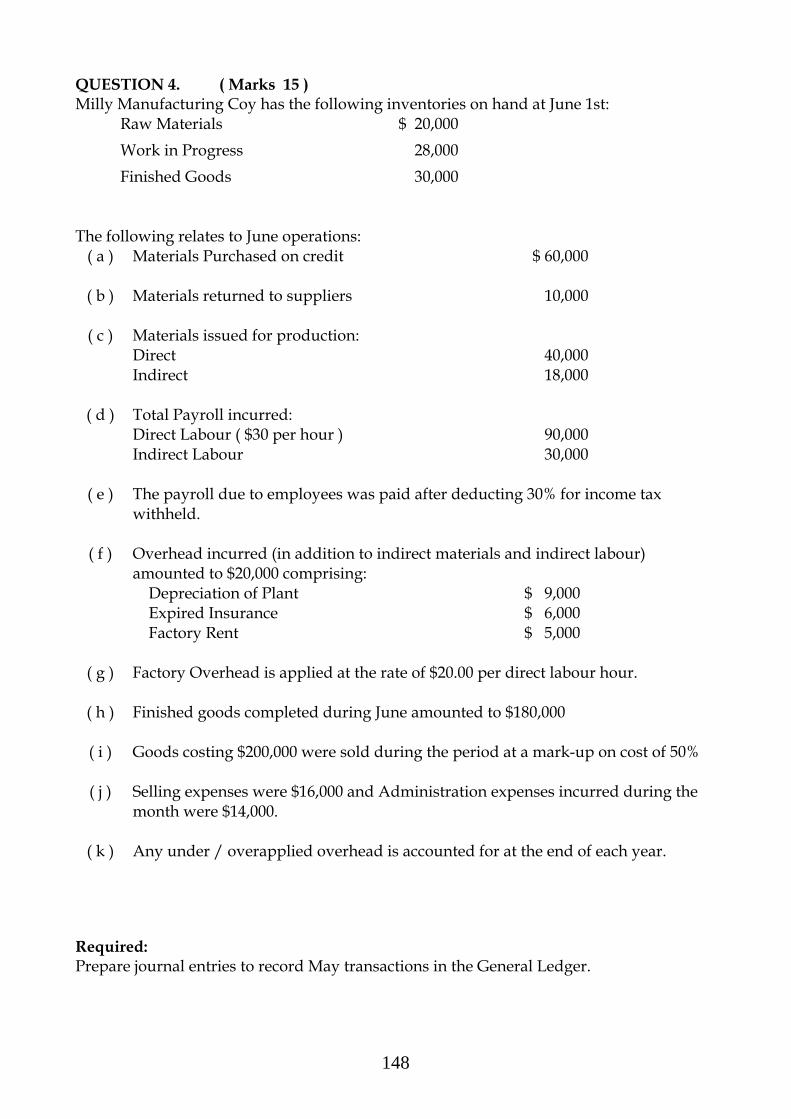
148
QUESTION 4. ( Marks 15 ) Milly Manufacturing Coy has the following inventories on hand at June 1st: Raw Materials $ 20,000 Work in Progress 28,000 Finished Goods 30,000
The following relates to June operations:
( a ) Materials Purchased on credit $ 60,000
( b ) Materials returned to suppliers 10,000
( c ) Materials issued for production: Direct 40,000 Indirect 18,000
( d ) Total Payroll incurred: Direct Labour ( $30 per hour ) 90,000 Indirect Labour 30,000
( e ) The payroll due to employees was paid after deducting 30% for income tax withheld.
( f ) Overhead incurred (in addition to indirect materials and indirect labour)
amounted to $20,000 comprising: Depreciation of Plant $ 9,000 Expired Insurance $ 6,000 Factory Rent $ 5,000
( g ) Factory Overhead is applied at the rate of $20.00 per direct labour hour.
( h ) Finished goods completed during June amounted to $180,000
( i ) Goods costing $200,000 were sold during the period at a mark-up on cost of 50%
( j ) Selling expenses were $16,000 and Administration expenses incurred during the month were $14,000.
( k ) Any under / overapplied overhead is accounted for at the end of each year.
Required: Prepare journal entries to record May transactions in the General Ledger.

149
Class Test 1 Name:……………………………… QUESTION 1
( a )
( b )
( c )
( d )
( e )

150
QUESTION 2. Workings ( a ) ( b ) ( c ) ( d ) ( i )
( ii )

151
QUESTION 3. ( a ) ( b )
152
QUESTION 4.
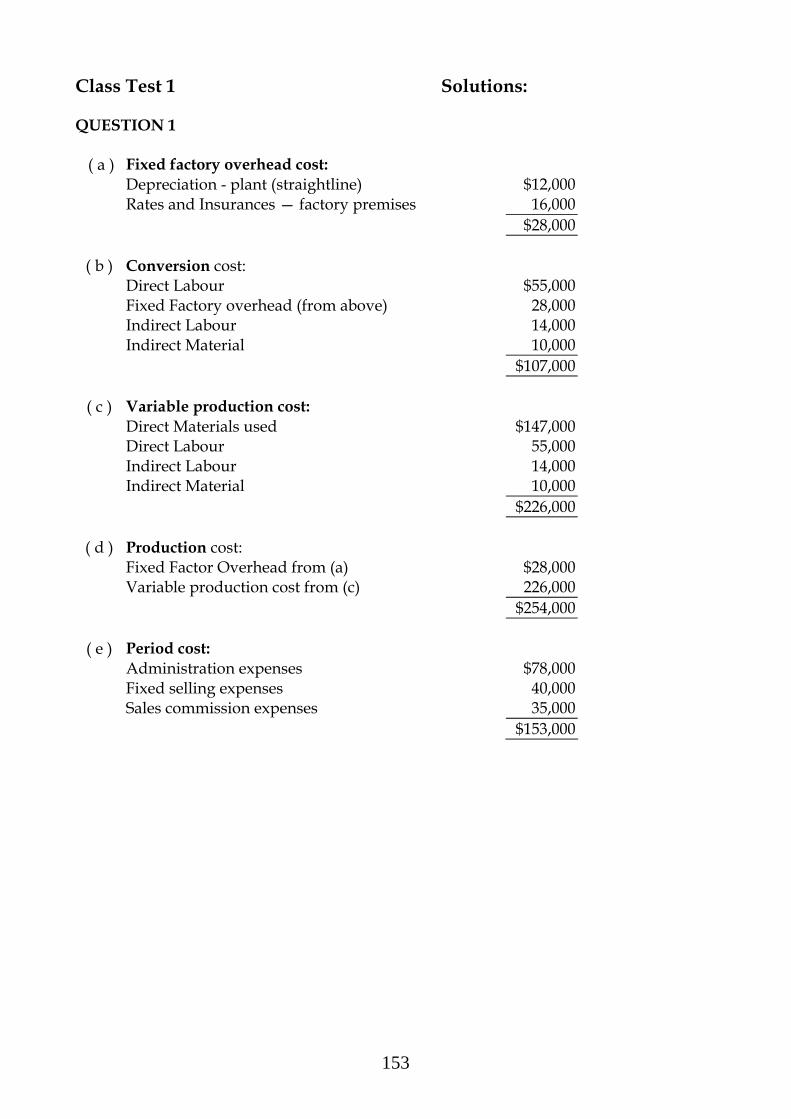
153
Class Test 1 Solutions: QUESTION 1
( a ) Fixed factory overhead cost: Depreciation - plant (straightline) $12,000 Rates and Insurances — factory premises 16,000 $28,000
( b ) Conversion cost: Direct Labour $55,000 Fixed Factory overhead (from above) 28,000 Indirect Labour 14,000 Indirect Material 10,000 $107,000
( c ) Variable production cost: Direct Materials used $147,000 Direct Labour 55,000 Indirect Labour 14,000 Indirect Material 10,000 $226,000
( d ) Production cost: Fixed Factor Overhead from (a) $28,000 Variable production cost from (c) 226,000 $254,000
( e ) Period cost: Administration expenses $78,000 Fixed selling expenses 40,000 Sales commission expenses 35,000
$153,000
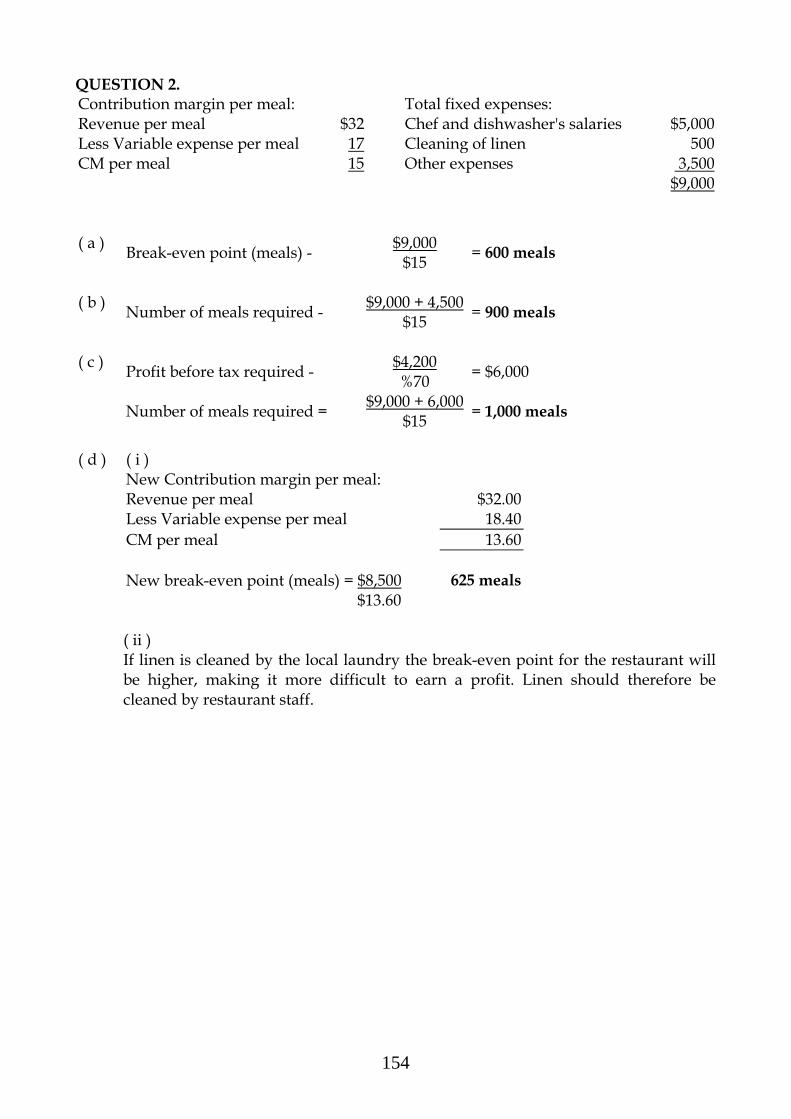
154
QUESTION 2. Contribution margin per meal: Total fixed expenses: Revenue per meal $32 Chef and dishwasher's salaries $5,000 Less Variable expense per meal 17 Cleaning of linen 500 CM per meal 15 Other expenses 3,500 $9,000 ( a ) Break-even point (meals) - $9,000
$15 = 600 meals
( b ) Number of meals required - $9,000 + 4,500
$15 = 900 meals
( c ) Profit before tax required - $4,200
%70 = $6,000
Number of meals required = $9,000 + 6,000
$15 = 1,000 meals
( d ) ( i ) New Contribution margin per meal: Revenue per meal $32.00 Less Variable expense per meal 18.40 CM per meal 13.60 New break-even point (meals) = $8,500 625 meals $13.60
( ii ) If linen is cleaned by the local laundry the break-even point for the restaurant will be higher, making it more difficult to earn a profit. Linen should therefore be cleaned by restaurant staff.
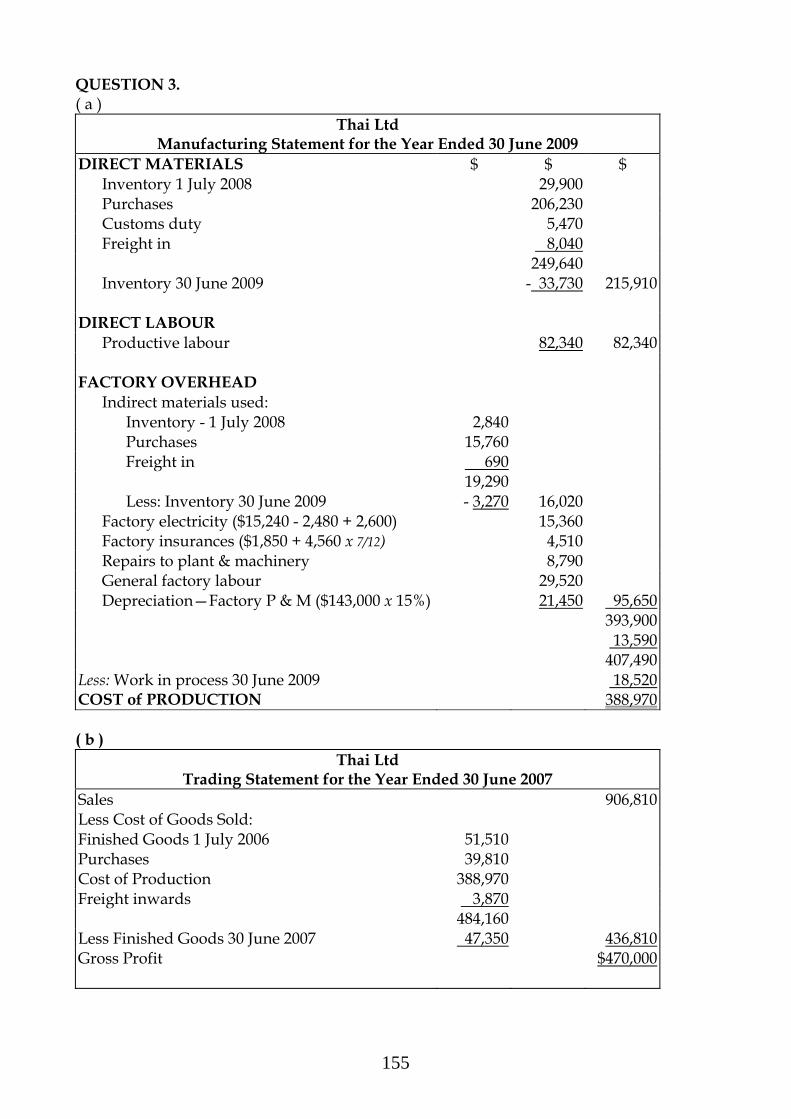
155
QUESTION 3. ( a )
Thai Ltd Manufacturing Statement for the Year Ended 30 June 2009
DIRECT MATERIALS $ $ $ Inventory 1 July 2008 29,900 Purchases 206,230 Customs duty 5,470 Freight in 8,040 249,640 Inventory 30 June 2009 - 33,730 215,910 DIRECT LABOUR Productive labour 82,340 82,340 FACTORY OVERHEAD Indirect materials used: Inventory - 1 July 2008 2,840 Purchases 15,760 Freight in 690 19,290 Less: Inventory 30 June 2009 - 3,270 16,020 Factory electricity ($15,240 - 2,480 + 2,600) 15,360 Factory insurances ($1,850 + 4,560 x 7/12) 4,510 Repairs to plant & machinery 8,790 General factory labour 29,520 Depreciation—Factory P & M ($143,000 x 15%) 21,450 95,650 393,900 13,590 407,490 Less: Work in process 30 June 2009 18,520 COST of PRODUCTION 388,970 ( b )
Thai Ltd Trading Statement for the Year Ended 30 June 2007
Sales 906,810 Less Cost of Goods Sold: Finished Goods 1 July 2006 51,510 Purchases 39,810 Cost of Production 388,970 Freight inwards 3,870 484,160 Less Finished Goods 30 June 2007 47,350 436,810 Gross Profit $470,000
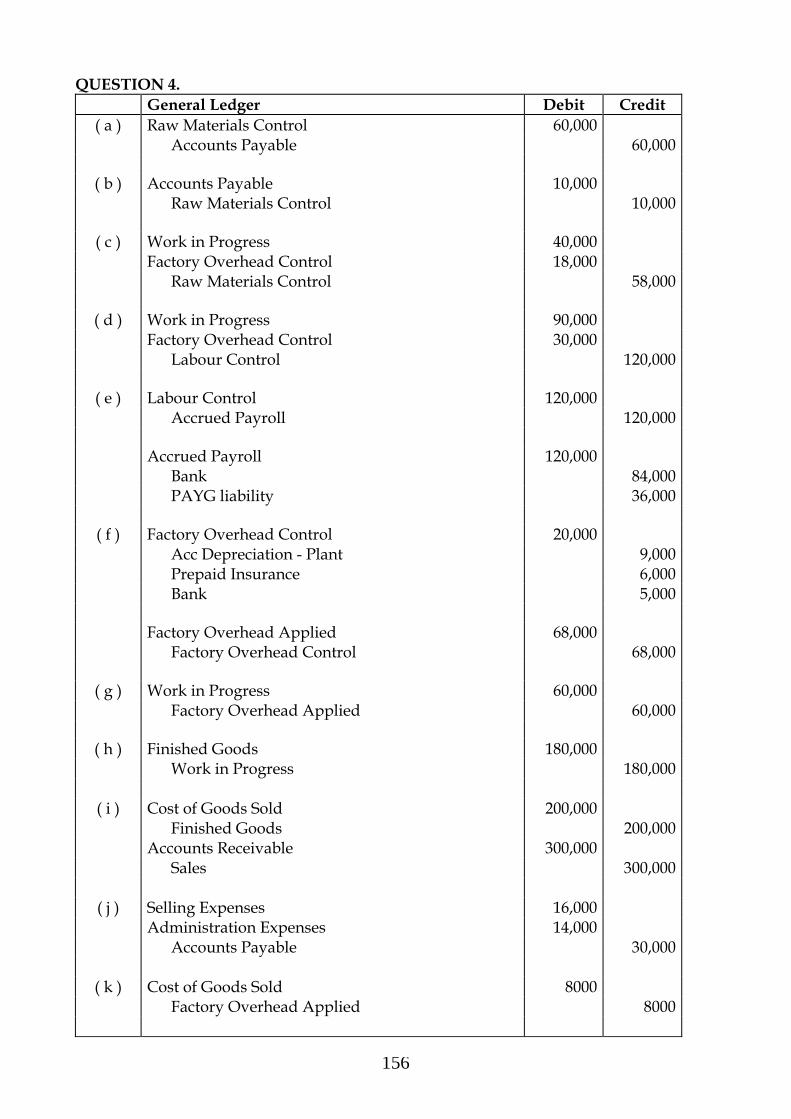
156
QUESTION 4. General Ledger Debit Credit
( a ) Raw Materials Control 60,000 Accounts Payable 60,000
( b ) Accounts Payable 10,000 Raw Materials Control 10,000
( c ) Work in Progress 40,000 Factory Overhead Control 18,000 Raw Materials Control 58,000
( d ) Work in Progress 90,000 Factory Overhead Control 30,000 Labour Control 120,000
( e ) Labour Control 120,000 Accrued Payroll 120,000 Accrued Payroll 120,000 Bank 84,000 PAYG liability 36,000
( f ) Factory Overhead Control 20,000 Acc Depreciation - Plant 9,000 Prepaid Insurance 6,000 Bank 5,000 Factory Overhead Applied 68,000 Factory Overhead Control 68,000
( g ) Work in Progress 60,000 Factory Overhead Applied 60,000
( h ) Finished Goods 180,000 Work in Progress 180,000
( i ) Cost of Goods Sold 200,000 Finished Goods 200,000 Accounts Receivable 300,000 Sales 300,000
( j ) Selling Expenses 16,000 Administration Expenses 14,000 Accounts Payable 30,000
( k ) Cost of Goods Sold 8000 Factory Overhead Applied 8000
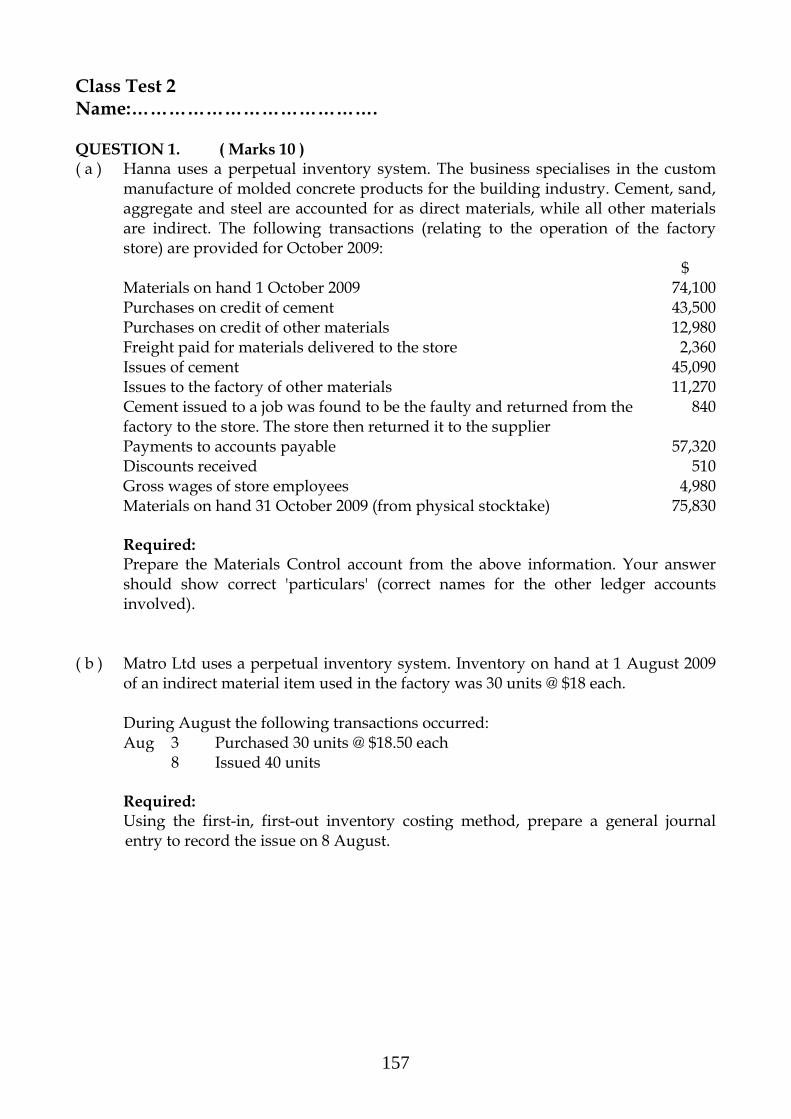
157
Class Test 2 Name:…………………………………. QUESTION 1. ( Marks 10 ) ( a ) Hanna uses a perpetual inventory system. The business specialises in the custom
manufacture of molded concrete products for the building industry. Cement, sand, aggregate and steel are accounted for as direct materials, while all other materials are indirect. The following transactions (relating to the operation of the factory store) are provided for October 2009: $ Materials on hand 1 October 2009 74,100 Purchases on credit of cement 43,500 Purchases on credit of other materials 12,980 Freight paid for materials delivered to the store 2,360 Issues of cement 45,090 Issues to the factory of other materials 11,270 Cement issued to a job was found to be the faulty and returned from the factory to the store. The store then returned it to the supplier
840
Payments to accounts payable 57,320 Discounts received 510 Gross wages of store employees 4,980 Materials on hand 31 October 2009 (from physical stocktake) 75,830
Required: Prepare the Materials Control account from the above information. Your answer should show correct 'particulars' (correct names for the other ledger accounts involved).
( b ) Matro Ltd uses a perpetual inventory system. Inventory on hand at 1 August 2009
of an indirect material item used in the factory was 30 units @ $18 each. During August the following transactions occurred: Aug 3 Purchased 30 units @ $18.50 each
8 Issued 40 units
Required: Using the first-in, first-out inventory costing method, prepare a general journal entry to record the issue on 8 August.
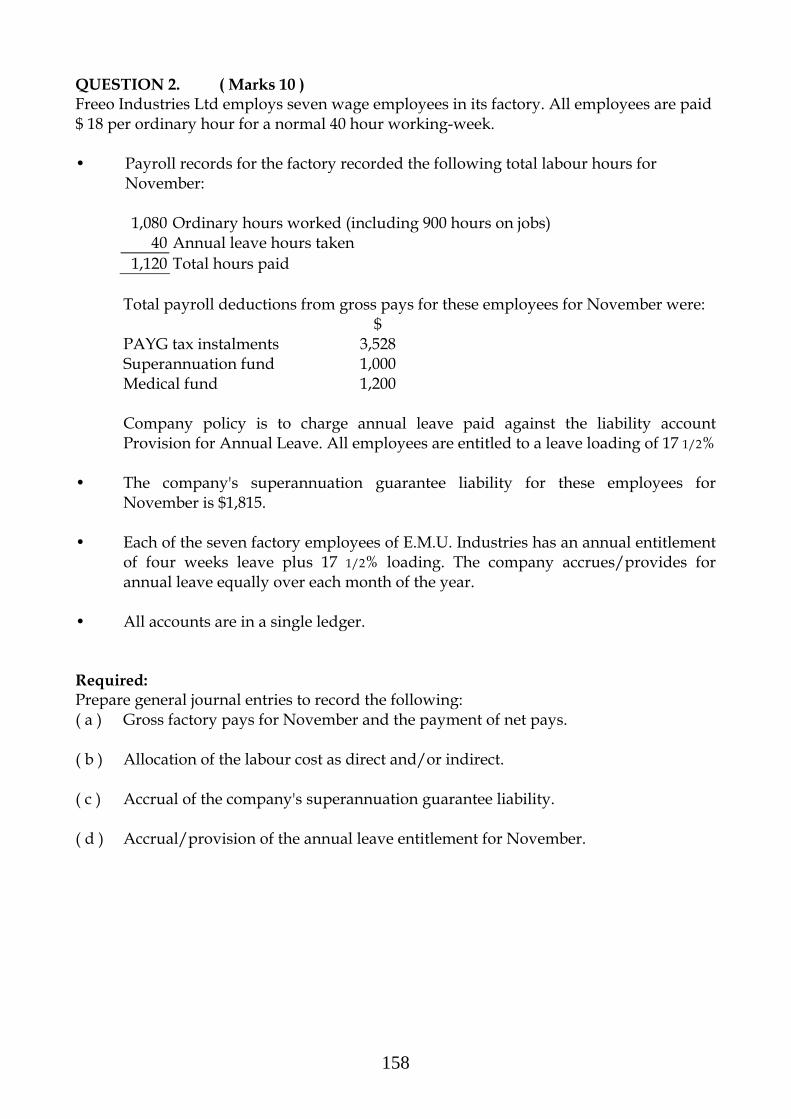
158
QUESTION 2. ( Marks 10 ) Freeo Industries Ltd employs seven wage employees in its factory. All employees are paid $ 18 per ordinary hour for a normal 40 hour working-week. • Payroll records for the factory recorded the following total labour hours for
November:
1,080 Ordinary hours worked (including 900 hours on jobs) 40 Annual leave hours taken
1,120 Total hours paid
Total payroll deductions from gross pays for these employees for November were: $ PAYG tax instalments 3,528 Superannuation fund 1,000 Medical fund 1,200
Company policy is to charge annual leave paid against the liability account Provision for Annual Leave. All employees are entitled to a leave loading of 17 1/2%
• The company's superannuation guarantee liability for these employees for
November is $1,815. • Each of the seven factory employees of E.M.U. Industries has an annual entitlement
of four weeks leave plus 17 1/2% loading. The company accrues/provides for annual leave equally over each month of the year.
• All accounts are in a single ledger. Required: Prepare general journal entries to record the following: ( a ) Gross factory pays for November and the payment of net pays. ( b ) Allocation of the labour cost as direct and/or indirect. ( c ) Accrual of the company's superannuation guarantee liability. ( d ) Accrual/provision of the annual leave entitlement for November.
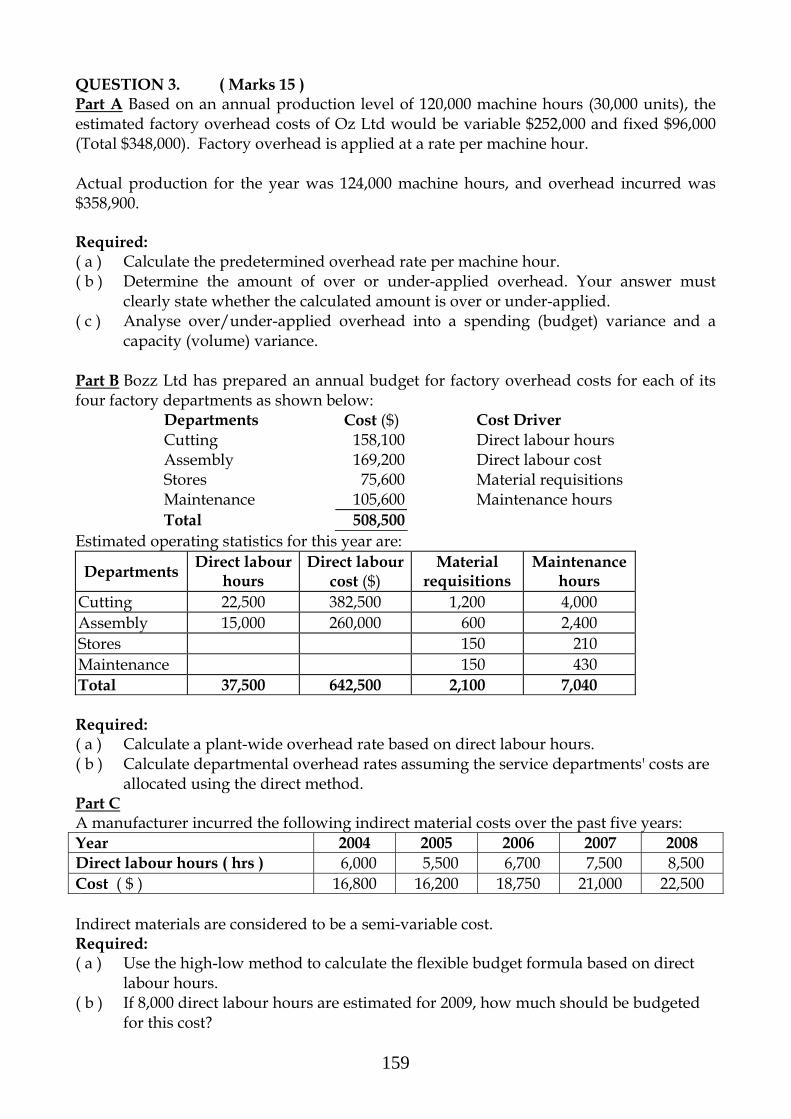
159
QUESTION 3. ( Marks 15 ) Part A Based on an annual production level of 120,000 machine hours (30,000 units), the estimated factory overhead costs of Oz Ltd would be variable $252,000 and fixed $96,000 (Total $348,000). Factory overhead is applied at a rate per machine hour. Actual production for the year was 124,000 machine hours, and overhead incurred was $358,900. Required: ( a ) Calculate the predetermined overhead rate per machine hour. ( b ) Determine the amount of over or under-applied overhead. Your answer must
clearly state whether the calculated amount is over or under-applied. ( c ) Analyse over/under-applied overhead into a spending (budget) variance and a
capacity (volume) variance. Part B Bozz Ltd has prepared an annual budget for factory overhead costs for each of its four factory departments as shown below:
Departments Cost ($) Cost Driver Cutting 158,100 Direct labour hours Assembly 169,200 Direct labour cost Stores 75,600 Material requisitions Maintenance 105,600 Maintenance hours Total 508,500
Estimated operating statistics for this year are:
Departments Direct labour hours
Direct labour cost ($)
Material requisitions
Maintenance hours
Cutting 22,500 382,500 1,200 4,000 Assembly 15,000 260,000 600 2,400 Stores 150 210 Maintenance 150 430 Total 37,500 642,500 2,100 7,040 Required: ( a ) Calculate a plant-wide overhead rate based on direct labour hours. ( b ) Calculate departmental overhead rates assuming the service departments' costs are
allocated using the direct method. Part C A manufacturer incurred the following indirect material costs over the past five years: Year 2004 2005 2006 2007 2008 Direct labour hours ( hrs ) 6,000 5,500 6,700 7,500 8,500 Cost ( $ ) 16,800 16,200 18,750 21,000 22,500 Indirect materials are considered to be a semi-variable cost. Required: ( a ) Use the high-low method to calculate the flexible budget formula based on direct
labour hours. ( b ) If 8,000 direct labour hours are estimated for 2009, how much should be budgeted
for this cost?
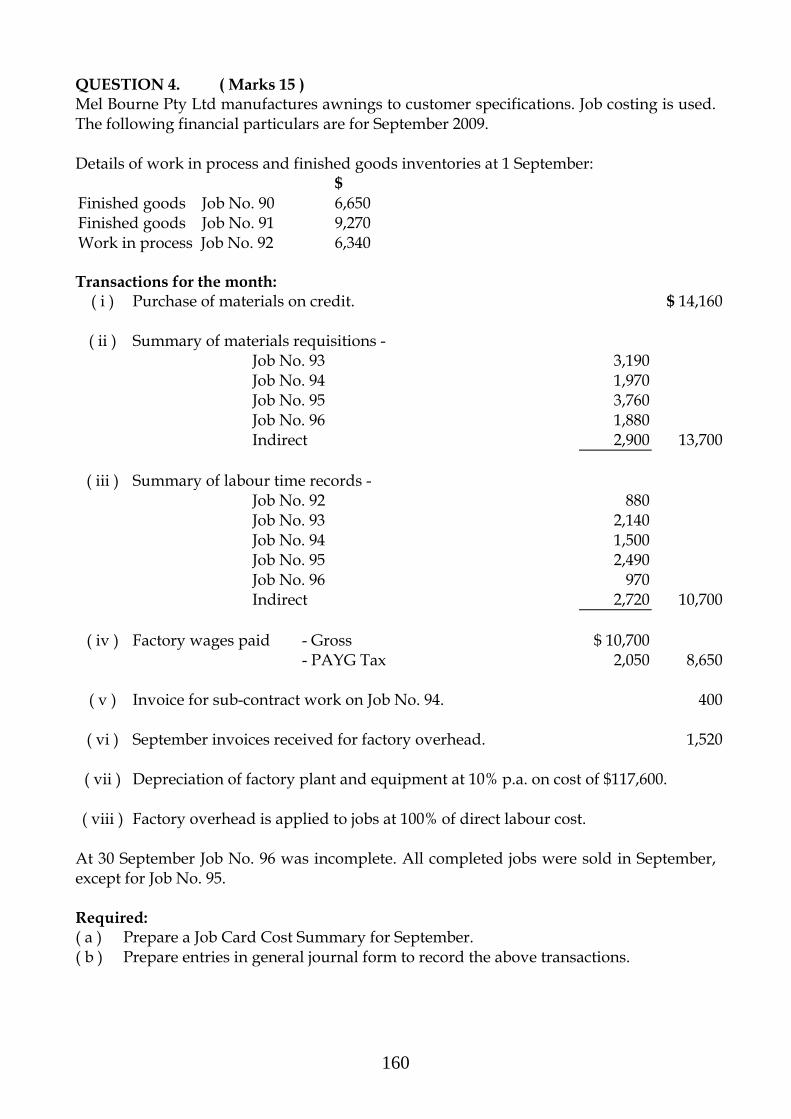
160
QUESTION 4. ( Marks 15 ) Mel Bourne Pty Ltd manufactures awnings to customer specifications. Job costing is used. The following financial particulars are for September 2009. Details of work in process and finished goods inventories at 1 September: $ Finished goods Job No. 90 6,650 Finished goods Job No. 91 9,270 Work in process Job No. 92 6,340 Transactions for the month:
( i ) Purchase of materials on credit. $ 14,160
( ii ) Summary of materials requisitions - Job No. 93 3,190 Job No. 94 1,970 Job No. 95 3,760 Job No. 96 1,880 Indirect 2,900 13,700
( iii ) Summary of labour time records - Job No. 92 880 Job No. 93 2,140 Job No. 94 1,500 Job No. 95 2,490 Job No. 96 970 Indirect 2,720 10,700
( iv ) Factory wages paid - Gross $ 10,700 - PAYG Tax 2,050 8,650
( v ) Invoice for sub-contract work on Job No. 94. 400
( vi ) September invoices received for factory overhead. 1,520
( vii ) Depreciation of factory plant and equipment at 10% p.a. on cost of $117,600.
( viii ) Factory overhead is applied to jobs at 100% of direct labour cost. At 30 September Job No. 96 was incomplete. All completed jobs were sold in September, except for Job No. 95. Required: ( a ) Prepare a Job Card Cost Summary for September. ( b ) Prepare entries in general journal form to record the above transactions.

161
Class Test 2 Name:…………………………….. QUESTION 1 ( a )
( b )
QUESTION 2.

162
QUESTION 3 PART A ( a ) ( b ) ( c ) PARTB ( a ) ( b ) Total Cutting Assembly Stores Maintenance Budgeted Costs $508,500 $158,100 $169,200 $75,600 $105,600 Re-allocation: Stores Maintenance Total

163
PART C ( a ) ( b ) QUESTION 4. ( a ) JOB CARD SUMMARY

164
( b )
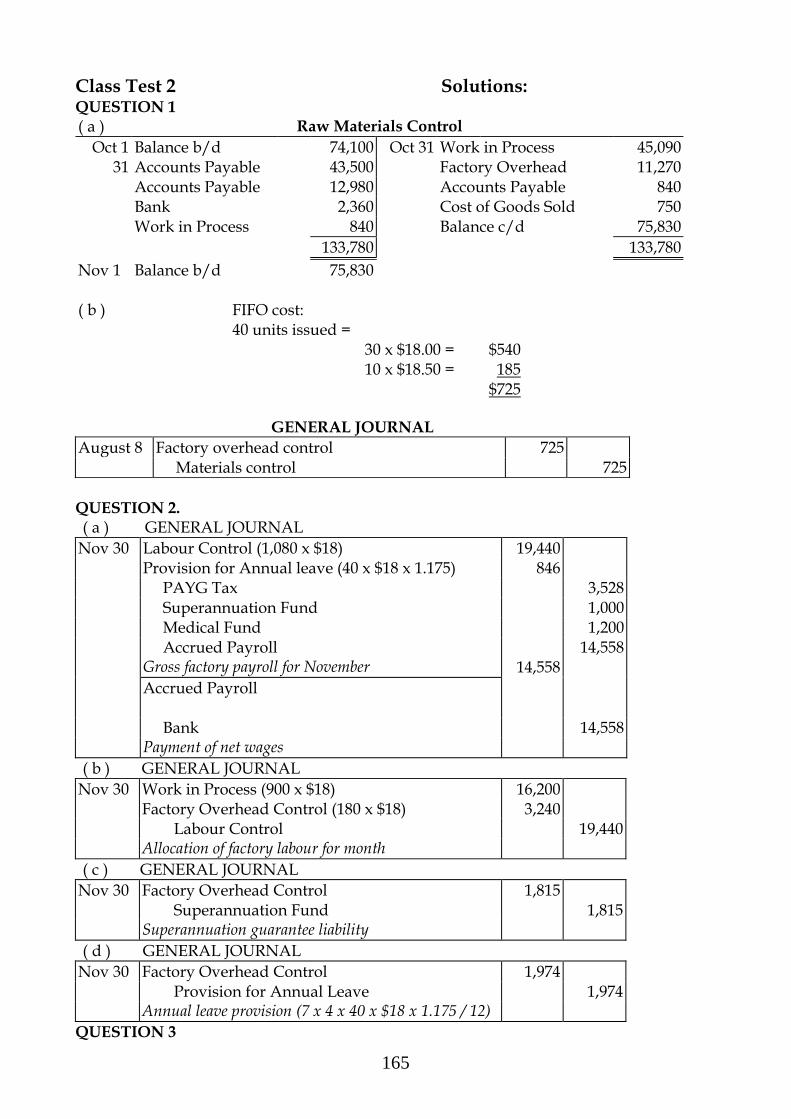
165
Class Test 2 Solutions: QUESTION 1 ( a ) Raw Materials Control
Oct 1 Balance b/d 74,100 Oct 31 Work in Process 45,090 31 Accounts Payable 43,500 Factory Overhead 11,270
Accounts Payable 12,980 Accounts Payable 840 Bank 2,360 Cost of Goods Sold 750 Work in Process 840 Balance c/d 75,830 133,780 133,780 Nov 1 Balance b/d 75,830 ( b ) FIFO cost: 40 units issued = 30 x $18.00 = $540 10 x $18.50 = 185 $725
GENERAL JOURNAL August 8 Factory overhead control 725 Materials control 725 QUESTION 2. ( a ) GENERAL JOURNAL
Nov 30 Labour Control (1,080 x $18) 19,440 Provision for Annual leave (40 x $18 x 1.175) 846 PAYG Tax 3,528 Superannuation Fund 1,000 Medical Fund 1,200 Accrued Payroll 14,558 Gross factory payroll for November 14,558
Accrued Payroll
Bank 14,558 Payment of net wages ( b ) GENERAL JOURNAL
Nov 30 Work in Process (900 x $18) 16,200 Factory Overhead Control (180 x $18) 3,240 Labour Control 19,440 Allocation of factory labour for month ( c ) GENERAL JOURNAL
Nov 30 Factory Overhead Control 1,815 Superannuation Fund 1,815 Superannuation guarantee liability ( d ) GENERAL JOURNAL
Nov 30 Factory Overhead Control 1,974 Provision for Annual Leave 1,974 Annual leave provision (7 x 4 x 40 x $18 x 1.175 / 12) QUESTION 3

166
PART A ( a )
Overhead recovery rate: $348,000 120,000 = $2.90 pet M/c H
( b ) Overhead applied $2.90 x 124,000 M/c H = $359,600 Less Actual overhead $358,900 Over-applied overhead $ 700 ( c )
Annual O/h
$358,900
Flexible budget @ 124,000 M/c H
F: $ 96,000 *V: 260,400 $356,400
Applied O/h
$359,600
Spending Variance $2,500 Unfavourable
Capacity Variance $3,200 Favourable
Over-applied overhead $700
* Variable overhead rate = $252,000 - 120,000 = $2.10 per M/c Hr Variable flexible budget = $2.10 x 124,000 M/c H
PARTB ( a ) Plant-wide overhead rate = $508,500 + 37,500 = $13.56 per DLH ( b ) Total Cutting Assembly Stores Maintenance Budgeted Costs $508,500 $158,100 $169,200 $75,600 $105,600 Re-allocation: Stores 50,400 25,200 - 75,600 Maintenance 66,000 39,600 - 105,600 Total $508,500 $274,500 $234,000 0 0 Departmental rate: Cutting = $274,500 = $12.20 per DLH
22,500
Departmental rate: Assembly = $234,000 = 90 % of Direct Labour Cost $260,000
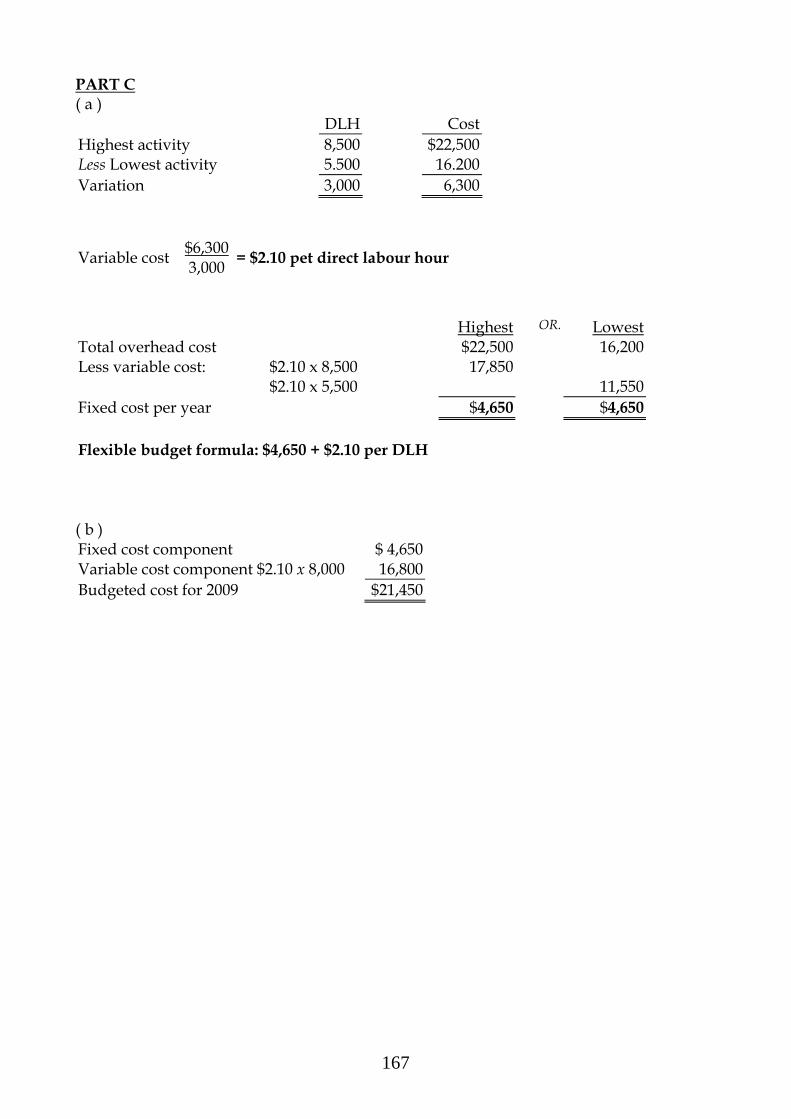
167
PART C ( a ) DLH Cost Highest activity 8,500 $22,500 Less Lowest activity 5.500 16.200 Variation 3,000 6,300
Variable cost $6,300 3,000 = $2.10 pet direct labour hour
Highest OR. Lowest Total overhead cost $22,500 16,200 Less variable cost: $2.10 x 8,500 17,850 $2.10 x 5,500 11,550 Fixed cost per year $4,650 $4,650 Flexible budget formula: $4,650 + $2.10 per DLH ( b ) Fixed cost component $ 4,650 Variable cost component $2.10 x 8,000 16,800 Budgeted cost for 2009 $21,450
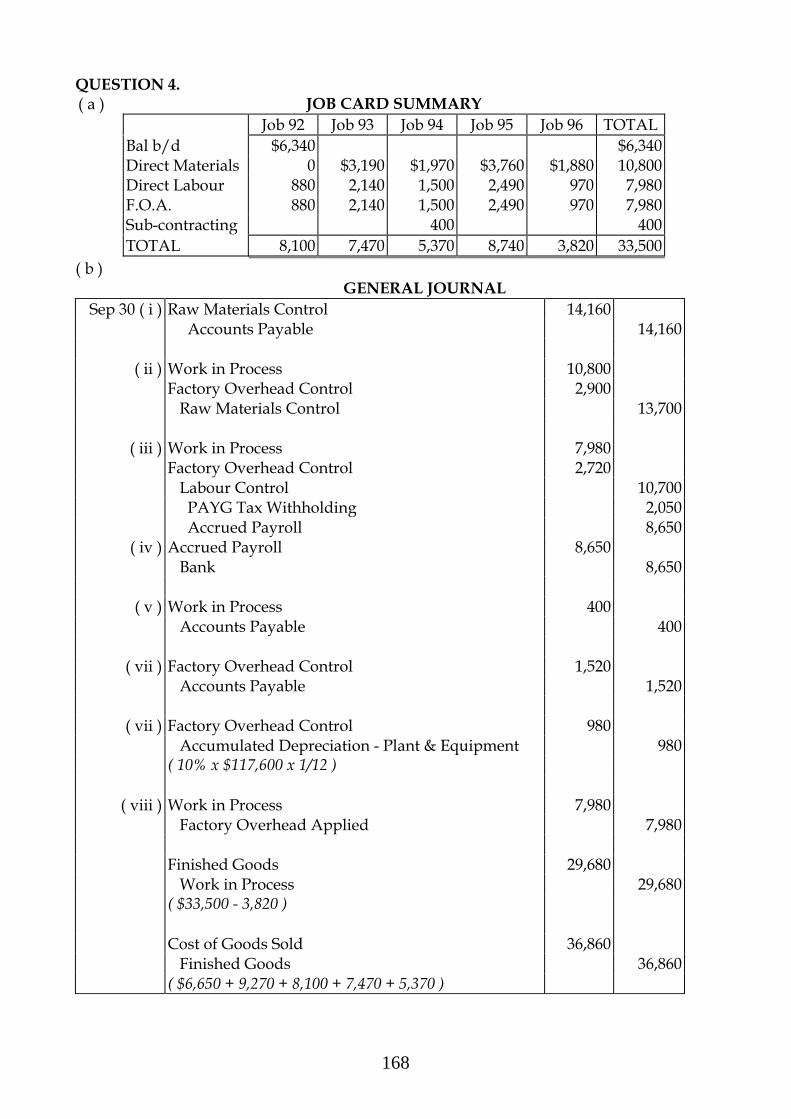
168
QUESTION 4. ( a ) JOB CARD SUMMARY Job 92 Job 93 Job 94 Job 95 Job 96 TOTAL Bal b/d $6,340 $6,340 Direct Materials 0 $3,190 $1,970 $3,760 $1,880 10,800 Direct Labour 880 2,140 1,500 2,490 970 7,980 F.O.A. 880 2,140 1,500 2,490 970 7,980 Sub-contracting 400 400 TOTAL 8,100 7,470 5,370 8,740 3,820 33,500 ( b )
GENERAL JOURNAL Sep 30 ( i ) Raw Materials Control 14,160
Accounts Payable 14,160
( ii ) Work in Process 10,800 Factory Overhead Control 2,900 Raw Materials Control 13,700
( iii ) Work in Process 7,980 Factory Overhead Control 2,720
Labour Control 10,700 PAYG Tax Withholding 2,050 Accrued Payroll 8,650
( iv ) Accrued Payroll 8,650 Bank 8,650
( v ) Work in Process 400 Accounts Payable 400
( vii ) Factory Overhead Control 1,520 Accounts Payable 1,520
( vii ) Factory Overhead Control 980
Accumulated Depreciation - Plant & Equipment 980 ( 10% x $117,600 x 1/12 )
( viii ) Work in Process 7,980
Factory Overhead Applied 7,980 Finished Goods 29,680 Work in Process 29,680 ( $33,500 - 3,820 ) Cost of Goods Sold 36,860
Finished Goods 36,860 ( $6,650 + 9,270 + 8,100 + 7,470 + 5,370 )


![LOGISTICS COSTING IN MANUFACTURING COMPANIES · inventory) into manufacturing costing models can also be found in the literature [3]. Nevertheless, no comprehensive solutions of logistics](https://img.dokumen.tips/doc/110x75/60488493443ad73449623400/logistics-costing-in-manufacturing-companies-inventory-into-manufacturing-costing.jpg)