Embed Size (px)
Citation preview

Solomon Islands Government
Ministry Of Environment, Climate Change, Disaster Management & Meteorology Post Office Box 21, Honiara, Solomon Islands
Solomon Islands Climate Change Assistance Project (SICAP)
CLIMATE CHANGE DIVISION GEORGRAPHICAL
INFORMATION SYSTEM (GIS) DEVELOPMENT
MAY TO SEPTEMBER 2013
FINAL REPORT
Prepared By: Bryan PITAKIA
GIS/IT Consultant

SICAP GIS Report September 2013 Page 2
Acronyms ......................................................................................................................... 3
Acknowledgement ........................................................................................................... 4
Background ..................................................................................................................... 5
Introduction .................................................................................................................... 6
What is Geographical Information System? ................................................................... 6
DATA RECONNAISSANCE .................................................................................................. 7
SICAP GIS Hardware/Software .......................................................................................... 7
SICAP GIS Database Design ............................................................................................... 8 a) Baseline Map ................................................................................................................................................................ 8 b) Socio-economic ............................................................................................................................................................ 8 c) Biophysical data ......................................................................................................................................................... 8
SICAP DATA STRUCRURE OVERVIEW ................................................................................. 9
Data Compatibility ......................................................................................................... 10
SICAP GIS DATA CAPTURED ............................................................................................ 10
SICAP SQL/MapBasic/Database ...................................................................................... 13
SICAP GIS Workshop ....................................................................................................... 13
Examples of SICAP Data Analysis output ......................................................................... 14 a) Basic output ............................................................................................................................................................... 14 b) Advance output ........................................................................................................................................................ 14
GIS Training. ................................................................................................................... 14
The challenge ................................................................................................................. 15
Lesson Learnt ................................................................................................................. 15
Data update required CCD immediate attention ............................................................. 15
Recommendations ......................................................................................................... 16
Conclusion ...................................................................................................................... 16
Appendix ........................................................................................................................ 18 Appendix 1 - Query retrieve total population in each wards ......................................................................... 18 Appendix 2 – Query retrieve total number of household along 60m buffers of major rivers in Guadalcanal .......................................................................................................................................................................... 18 Appendix 3 – 35km buffer of earth epicenters ...................................................................................................... 19 Appendix 4 – Cyclone tracks .......................................................................................................................................... 19 Appendix 5 – 70km buffer along Cyclone tracks .................................................................................................. 20 Appendix 6 – Query retrieves total number of household located in fertile land in each ward .... 20 Appendix 7 – MS Access Interface to load NDMO disaster activity (Links with the GIS) .................. 21 Appendix 8 – Proposed MS Access Interface for SICAP GIS ............................................................................ 21 Appendix 9 – Participants in the GIS Workshop .................................................................................................. 22

SICAP GIS Report September 2013 Page 3
Acronyms
SICAP Solomon Islands Climate Change Assessment Project
MECDM Ministry of Environment, Climate Change, Disaster Management &
Meteorology
CCD Climate Change Division
GIS Geographical Information System
ESRI Environment Systems Research Institute
SEMRICC Strengthening Environment Management and Reducing the Impact of
Climate Change
SOPAC South Pacific Applied Geoscience Commission
HIE Household Income and Expenditure
MPA Marine Protected Area
TNC Total Nature Conservation
SQL Structured Query Language
NDMO National Disaster and Management Office
NGO Non-Government Organization
GPS Global Positioning System
DTM Digital Terrain Model
DEM Digital Elevation Model
UNDP United Nation Development Program
MAL Ministry of Agriculture and Livestock
MOF Ministry of Finance
MERE Ministry of Energy and Rural Electrification
MRD Ministry of Rural Development
LLEE Live and Learn Environmental Education Solomon Islands
LAN Local Area Network
RS Remote Sensing
HCC Honiara City Council
PS Permanent Secretary

SICAP GIS Report September 2013 Page 4
Acknowledgement
The successful implementation a Geographical Information System (GIS) for Climate
Change Division (CCD) of the Ministry Environment, Climate Change, Disaster
Management and Meteorology (MECDM) brings a new chapter in mapping the national
climate change vulnerability assessment to aid the process of strategic planning to response to
challenge of climate change. The establishment of this GIS in this ministry enhances the
sustainability of the Governments development and economic reform program through
appropriate climate change adaptation and mitigation, and disaster risk reduction policies and
build resilience across the country.
Planning, designing and the actual development for the GIS system were done under the
guidance of terms of reference and the CCD directors. This report would also like to
acknowledge contributions and inputs from different sectors, ministries, institution and
individuals by way of providing data, past reports, advices, directions and computer hardware
equipment and software etc. Firstly, would like commend the Permanent Secretary (PS) of
MECDM, Dr Melchior. Although the PS took office half-way through SICAP GIS
development, but has contributed very important statistical data of whole country as well as
medical statistical data for Choiseul province. Secondly, to the Director and Deputy of
Climate Change division, Doulas Yee and Hudson K and their staffs for supporting the
development of this very important tool and the engagement of a local consultant through the
SICAP.
Thirdly, to the different government ministries that have been visited and obtain data from,
this includes, Ministry of Infrastructure and Development (MID), Ministry of Agriculture and
Livestock (MAL), Ministry of Lands and Survey (MLS), Ministry of Mines, Energy and
Rural Electrification (MMERE). Ministry of Forestry, Ministry Environment, Climate
Change, Disaster Management and Meteorology (MECDM), Statistics division of the
Ministry of Finance (MOF), Live and Learn Environmental Education (LLEE), Honiara City
Council’s (HCC) Health and Medical office, Rural Water Supply and Sanitation (RWSS),
Total Nature Conservation (TNC), Save the Children, SOPAC, SEMRICC

SICAP GIS Report September 2013 Page 5
CLIMATE CHANGE DIVISION OPERATIONAL GEORGRAPHICAL
INFORMATION SYSTEM (GIS)
Background
The Climate Change Division (CCD) of MECDM, through Solomon Islands Climate Change
Assistance Project (SICAP), is developing a National Climate Change Vulnerability
Assessment of the Solomon Islands. This is in line with the Government’s priority to enhance
the sustainability of its development and economic reform program through appropriate
climate change adaptation and mitigation, and disaster risk reduction policies and to build
resilience within the country.
The Climate Change Department through the support of SICAP has taken the first step to
develop a national climate change vulnerability assessment through a Geographical
Information System (GIS) to enhance strategic planning in response to climate change
challenges.
The specific objective of this GIS assignment according to the TOR is to support the ministry
in particular the Climate Change Division (CCD) to develop a methodology for a national
climate change vulnerability assessment.
The initial contract duration was 45 days however, due to more work still to be done, a
request for additional 45 days extension on work was approved by the project. This report
covers work done through the 90 days
IMPORTANT: This assignment takes advantage of the existing data and is not intending to
undertake field survey for new raw data.

SICAP GIS Report September 2013 Page 6
Introduction
One of the major issues in the Solomon Islands today is climate change, Sea level rise,
drought, extreme weather events, flood, land degradation and deforestation and diseases, etc.
According to Climate Change office at MECDM, the country has adopted 14 global climate
models to predict and monitor climate change. However, the ministry is now implementing a
major national project to collect and compile local data that will depict the real pattern and
effects of climate change in the country.
Now the Solomon Islands Climate Change Assessment Project (SICAP) is supporting CCD
to implement a GIS system that captured data already available within different sectors. The
system will become a very important tool that performs data analysis and produce a national
risk and vulnerability assessment maps. Having this tool will greatly assist MECDM through
CCD to perform complex climate change data analysis taking advantage of raster and vector
data.
This modern technology and skills on GIS/RS system will enable these sectors to monitor,
evaluate, and understand the threats and possible extent of climate/disaster risk in the country.
Given the geographical location of Solomon Islands communities, only GIS and RS (Remote
Sensing) can make things easier, cost effective, saves time. For example, it will provide the
agriculture sectors information required for intervention plan in rural farming system
What is Geographical Information System?
According world leading GIS developer and vendor, ESRI, Mapping geography is one of
humanity’s most ancient arts, but today it is the cutting edge of information ANALYSIS.
Technology enables maps created by GIS help people from many lands and occupations
make better DECISIONS for their communities. Whether business, government, education,
or science, from the largest enterprise to single worker, GIS offers boundless possibilities.
IMPORTANT: GIS is computer base software program that links WHERE THINGS ARE
with WHAT THINGS ARE LIKE. On the other hand flat paper maps WHAT YOU SEE IS
WHAT YOU GET, but GIS generated maps have many layers of information for many ways
of thinking about a geographic space.

SICAP GIS Report September 2013 Page 7
Figure 1 Example of GIS many layers.
DATA RECONNAISSANCE
Within the first two weeks of this SICAP GIS development, reconnaissance on available data
among different stakeholders was carried out. This reconnaissance also to identify which
organizations has an active GIS system running. These stakeholders visited includes;
Ministry Infrastructure and Development (MID), Ministry of Mines Energy, and Rural
Electrification (MERE), Ministry of Lands and Surveying (MAL), Ministry of Agriculture
and Livestock (MAL), Statistics Division of the Ministry of Finance (MOF), NDMO, Live
and Learn Environmental Education Solomon Islands (LLEESI), Honiara City Council
Health Centre and Solomon Islands Electricity Authority (SIEA).
Other stakeholders who were later visited after the GIS-workshop are Ministry of Rural
Development (MRD), Rural Water Supply and Sanitation (RWSS), Meteorology division of
MECDM and TNC.
In addition to data collected from stakeholders stated above, data relating to Vulnerability
and Adaptation to climate change captured by previous projects, SEMRICC, UN-Habitat
(UNDP Projects), Choiseul Province Climate Change Vulnerability and Adaptation
Assessment Report (2013), were also take into consideration.
SICAP GIS Hardware/Software
After visiting the different organizations, it was noted that most common GIS software used
are MapInfo Professional and ArcInfo. SICAP GIS setup is currently running in MECDM
GIS unit located within the Project Office. MECDM GIS is running MAPINFO v.11 single
user License. Both the hardware and software were supplied by UNDP SEMRICC project in
2012. MECDM GIS runs on a standalone desktop computer.
SICAP GIS database will be shifted into the CCD office as soon as the division purchases its
new desktop computer. Additional software programs were also installed and used to carry
out further analysis on the GIS data. The software includes Global Mapper, Vertical Mapper,
MapBasic.

SICAP GIS Report September 2013 Page 8
SICAP GIS Database Design
SICAP GIS database is designed to capture vector and raster data under three major
categories,
a) Baseline Map
This includes the Solomon Islands topographical map, national administration
boundaries (wards, constituencies and provincial boundaries), elevation maps,
contour/topography maps, watercourses, forestry inventories, geology, soil map,
Infrastructures (bridges, roads, airfields, wharves, marine navigation lights) etc. These
data have been sourced from the following; Ministry of Lands and Housing, Ministry
of Agriculture and Livestock, Ministry of Forestry, Statistics division of the Ministry
of Finance, Ministry of Infrastructure Development and Ministry of Environment,
Climate Change, Disaster Management and Meteorology and SOPAC. These raw data
are either geo-referenced or non geo-referenced. All data have been checked and
loaded into the SICAP GIS system. (See users manual more details).
b) Socio-economic
Includes population data, household income & expenditure (HIE), Solomon Islands
settlements, and government facilities (education and health). The latest Socio-
economic data available from 2009 national census data sets does not include
household population, only summary of population within each ward. However, I
managed to get hold of the latest household geo-reference data of the country from
the 2009 census without population data. The household data enable the GIS system
to run various data analyses to reflecting populations within communities, wards,
constituencies, and provinces that are likely to be affected by climate change or are
vulnerable to other forms of disaster events.
NOTE: The core of 2009 census data is yet to be officially released therefore it is not
possible to access the household population data.
Taking advantage of the MapInfo SQL program, SICAP GIS system can retrieve the
total number of households, infrastructure, and government facilities, communities
and population (male & female) within a particular ward. It can also identify
households, infrastructure, clinics and schools that are constructed below 5-meter
contour interval. The system can also as well as identifying these facilities that are
located within 20 meters along major rivers. (More SQL results in User manual).
Socio-economic data also includes, MPA data compiled by TNC. These are geo-
reference data with every details related to MPA in the country recorded by TNC.
Some of MPA activities were also part of climate change programs and activities and
so both activities are mapped in the SICAP GIS.
c) Biophysical data
Includes NDMO historical data on natural disaster cyclone events, tsunami, flooding,
and earthquake. NDMO data available in an International online database called
Desinventar. Unfortunately, this online database has not been updated for some years.
Biophysical data also includes, rainfall and temperature fro Meteorology division, and
earthquake data obtained from the MERE, identifying all earthquakes geo-referenced
epicenters, depth, magnitude and year.

SICAP GIS Report September 2013 Page 9
DATA ANALYSIS
- Results various SQL query
- Flood risks
- Land-slide risk
- Cyclone risk
- Earthquake
- Social vulnerability
- Economic vulnerability
Additional vital data that are also required in the system includes medical data, food
security, plant pests and diseases. The only Medical data currently available in SICAP
GIS is for Choiseul province provided by Dr Melchior (PS MECDM).
Combinations of data from these three categories allow the GIS software program to run SQL
queries that produces vital information that can enhance proactive planning and development
planning etc. Information generated from data captured reveals various communities or wards
that are exposed to various risks such as sea level rise, tsunami, tidal waves, flooding and
landslides.
SICAP DATA STRUCRURE OVERVIEW
Figure 2 SICAP GIS Data Structure.
BASE MAP
- SI MAP - Soil features
- Administration boundary - Forest cover
- Constituency/Ward boundaries
- Elevation
- Contour
- Rivers/watercourses etc.
-
SOCIO-ECONOMIC
- Population data
- Household
Income &
Expenditure
- ….. etc
BIOPHYSICAL
- Cyclone
- Earth Quake
- Climate data
(rainfall and
temperature)
- ….. etc
- Medical
data
- Plant Pets
- Food
security
- Council
data
- … and
more.

SICAP GIS Report September 2013 Page 10
Data Compatibility
There are two types of data captured into the SICAP GIS. Both types were translated into a
format compatible with the GIS database formats.
a) Geo-reference data – these are data digitized from geo-referenced rectified maps
(raster image) as well as raw field data captured by survey instruments such as
GPS or Surveyors Total Stations etc.
b) Non geo-reference data – these data are either stored in a spreadsheet, external
object relational database. Similar data may also be extracted from past reports.
To produce a more accurate National Climate Change Vulnerability Assessment in the
context of the Solomon Islands, it is very important to capture as many data across different
sectors. Data collected by a sector can be enhanced further when they are combined with data
collected by another sector. For example; by combining population data captured by statistic
division, topographical data from the ministry of lands, and disaster data from NDMO will
produce a better picture of our how vulnerable communities are to climate change within
their respective wards. Such information may also support relevant sectors addressing climate
change adaption.
In addition to physical vulnerability, the SICAP GIS can also produce results on social
vulnerability. The only insufficiency social vulnerability result now is due to statistic division
refusal to share its data. Examples of such data are, who is the head in a household,
community, education level, type of building material used etc.
SICAP GIS DATA CAPTURED
1. SICAP GIS’s object is to capture every available data retain by various governments
ministries, NGO as well as private sectors and trusted individuals. Digitizing and
setting up of a GIS baseline maps from the available data was done without less
difficulty because most of these data are readily available. However, its data structure
with the GIS must be properly designed. Government ministries such Forestry and
Lands refuse to share their data. However, SICAP GIS has accessed some of these
data through other sectors.
2. Only a 20-meters contour interval is available for the whole Solomon Islands. The
SICAP GIS assignment, however, requested a 5-meter contour interval as baseline to
work on. Have enquired for a 5-meter contour of Solomon Islands within the region,
but there is none. To develop an accurate 5-meter contour interval;
a) Requires high-resolution satellite imagery, conducting field survey using
survey grade GPS etc. This exercise will take time and is very costly.
b) Alternatively, the other option available is to interpolate a 5-meter contour
interval from the available 20-meter contour interval using a software program.
The software program available to do such interpolation is the Vertical
Mapper software program.
Vertical mapper is very powerful GIS software compatible with MapInfo. When it is
properly installed, vertical mapper appears within MapInfo drop down menu. Vertical
mapper can produce grid files and 3 dimensional (3D) views where it is necessary to

SICAP GIS Report September 2013 Page 11
view data in such formats. Fig. 3 and Fig 4 below depict a 5-meter contour interval
and a 3D view of Santa Cruz Island respectively generated from Vertical mapper.
0
.
Figure 3 5-meter contour intervals.
c) Most biophysical data are made available from MECDM divisions (NDMO,
Meteorology, and Climate Change Division) therefore; they are easily
accessed and uploaded into the system.
Earthquake data ranging from 5 to 8 rector scale since 1900 to 2009 from
seismology divisions of the ministry of mines is was also captured. With these
data SICAP GIS can produce a buffer to see with communities or provinces
vulnerable to landslide, tsunami etc. More knowledge on the behavior of
earthquake is required to refine analysis and ensure results produce by the GIS
efficient.
d) Socio-economic data are the most important data for the SICAP GIS.
Particularly the population data. Unfortunately accessing the latest population
data of 2009 census is not possible. Despite several attempt by CCD
requesting the population data, it was made available. According to statistic
division, this data is yet to be officially release to the public. We however,
have access to a report base on the 2009 census that provides population
summary data for each electoral ward, consistency and provinces. These
population summaries do not give us good result for our assessments because
we want to see the affect of climate change on total number of people within a
settlement in a particular ward.
The lowest statistics unit data available in the SICAP GIS system now are the
household geo-reference data. In the absence household population data,
SICAP GIS Report September 2013 Page 12
various analyses in the GIS are based on the number of households with in
each ward.
e) The Household Income and Expenditure (HIE) data from 2006 survey was
made available but again, it is only summaries for each province. Up to the
end of this contract the HIE sample data collected by statistics are yet to be
supplied
f) Soil map – Soil Map is very important to identify what type of soil is
vulnerable to landslide, or is fertile and favorable for farming. Soil data of the
whole country loaded into SICAP GIS were made available by SOPAC.
g) Forestry data – Solomon Islands forestry types and the land cover of all the
provinces including concession boundaries identified by relevant ministry up
to 2003 data have been uploaded into the SICAP GIS.
h) Reefs – Known reefs in all provinces are also captured into the SICAP GIS
system. Information about the reefs may be vital for MPA database.
i) Digital Terrain Model (DTM) or Digital Elevation Model (DEM) such as in
Fig. 4 below is generated from the SICAP GIS using Vertical Mapper
software program. DTM data enables users to better visualize and evaluate
elevations and by using additional software such as ERDAS together with the
existing database, it is possible to determine elevations that are vulnerable to
landslides.
Additional data such as settlements and households can be included into this
3D model. For example, reports on the recent tsunami disaster in Temotu
reveals that, the vicinities indicated by arrows in the image blow have
experienced massive destructions because they are locate in low line coastal
areas. Result from an SQL shows that within these settlements, there is a
higher number of houses constructed below 5-meter contour intervals.
Figure 4 Example of GIS 3D Model of Santa Cruz Island.
SICAP GIS Report September 2013 Page 13
j) SICAP GIS also captured all Government facilities as educational and clinics
facilities in all provinces.
k) Bathymetry map of the ocean floor of Solomon Islands clearly reveals the
earthquake belt and also the ocean floors where various existing tenements
have been mapped.
SICAP SQL/MapBasic/Database
Apart from locating and digitizing existing, SQL and MapBasic Scripts have been written to
automate data analyses and reporting. The SQL scripts are simple (uses human language
scripts) and can easily be understood up by non-programmers. All SQL written for this
project are saved in SICAP GIS directory and can be reused amended or upgraded from time
to time depending on the types information required from the system. More about the SQL
will be made available in the user manual.
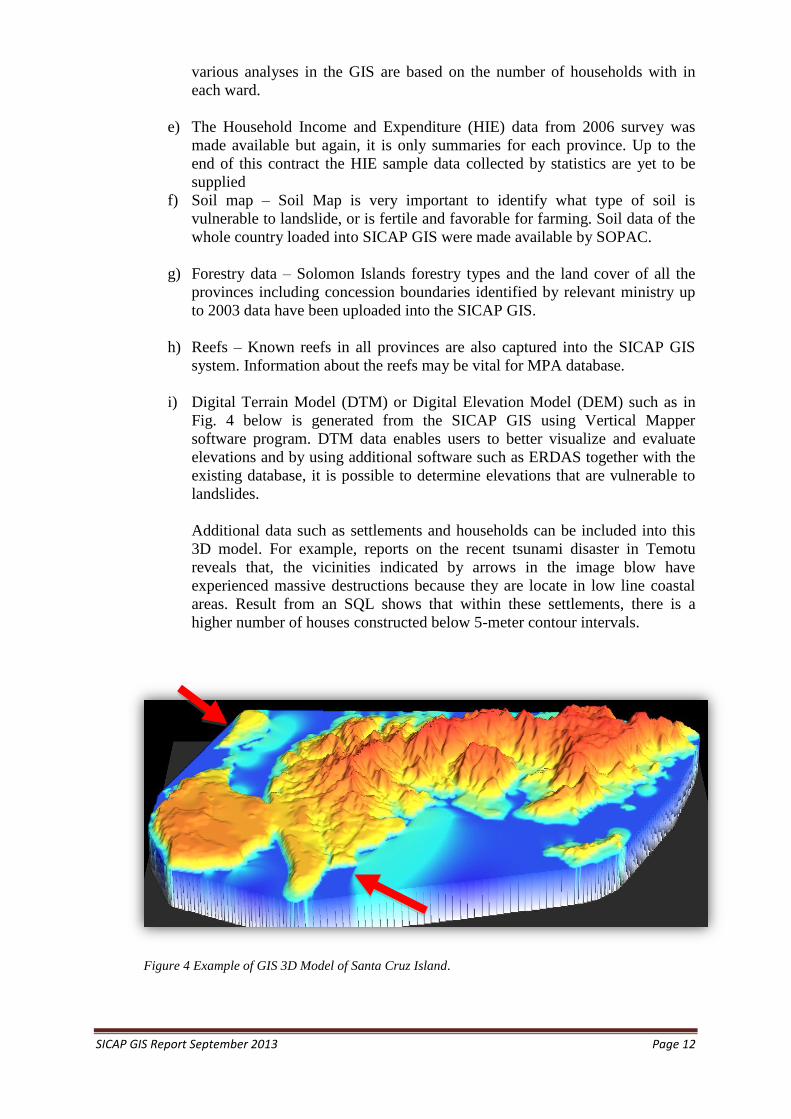
MapBasic programming language is a bit advance for non-programmers. It takes time to be
thought as a result this was left out from our GIS training. However, there are few Mapbasic
programs written for SICAP GIS that are currently running. These programs automate and
reduce some steps required to retrieve various maps.
Figure 5 MapBasic program creates SICAP menus
The existing database holding all the data uploaded in this SICAP GIS are developed within
in the MapInfo system itself. As the SICAP GIS further develops, Microsoft Access
relational database should be used to store and exchange data within MapInfo. MS Access
provides excellent reporting facilities and can be linked with the GIS database in MapInfo.
Within SICAP GIS, all the data coming from NDMO are loaded in an MS Access interface
that link with the MapInfo. When new data are entered through the MS Access Interface, the
GIS database is automatically updated. (See appendices for MS Access Interface).
SICAP GIS Workshop
During SICAP GIS implementation, CCD organized a GIS workshop and invited different
stakeholders. SICAP GIS development and its purpose were present at the workshop
followed an open for discussion to get some inputs from all stakeholders. Stakeholders
present at the workshop commend CCD for developing this very important tool. For many,
SICAP GIS Report September 2013 Page 14
what SICAP GIS is capable of doing is new and were interested to have their data loaded in
the system. Most participants at the works have agreed to share their data with SICAP GIS
and looking forward to get some support from the system. It was revealed during the
workshop that, information generated from this GIS system is available to other the sectors,
provided they request it through the MECDM.
Examples of SICAP Data Analysis output (See sample outputs from the SICAP GIS in the Appendix at the bottom)
With the current data captured, this GIS system is capable of combining several data layers
from the three categories to highlight various aspects of vulnerability, hazard or other
information. For instance,
a) Basic output
- How many villages or households and number of males and females, in a ward for
particular provinces
- Identifying households close to steep slopes that vulnerable to landslides
- How many tropical cyclones pass through the provides and possible damages that
have been recorded
- Number of male and female in different ages groups within wards in different
provinces (see appendix 1)
b) Advance output
- Which provinces are subjected to frequent cyclone risk or earthquake
- Which wards or provinces have the highest number of households living under 5m
contour
- How many households or government facilities (schools/clinics) are constructed
adjacent to major rivers within 20m and 60m buffer that might be at risk during
flood and landslides. (See appendix 2)
Note: There are unlimited ways of developing these analyses, provided we have clean data in
the system. As the GIS database is further developed and updated with new layers, better
results shall be obtained. Explanations on these data analysis can be seen in the user manual.
GIS Training.
Two MECDM staffs (Mr Theddeus Siota & Geoffery Maunasi) have been given basic GIS
training in between their busy work schedules throughout this assignment. So far they have
good knowledge on the GIS software and how GIS database within the GIS software
program are design and updated. Their GIS knowledge and skills has been further enhance in
a weeks GIS training facilitated by UNDP. The staffs will need to improve their GIS skills by
continuously working on the SICAP GIS system each week.
Most demanding tasks from now and onwards in SICAP GIS system are updating of existing
database as well as digitizing new data to create new map layers as well as retrieving required
information from the system. Both staffs have been trained on the different methods of
capturing new data into the system and updating the GIS database using GPS, digitizing from
existing maps and Google Earth Image.

SICAP GIS Report September 2013 Page 15
To make sure that both staffs gained confidence in manning the SICAP GIS system, I will be
available to support them. This support will be at no cost. Both staffs are now included in the
local GIS users group who meet ones a month so this is also an opportunity for them learn
form other users and improve their skills.
The challenge
The biggest challenges SICAP GIS implementation faced throughout the assignment is
accessing data held by others sectors. Some data, especially census data containing personal
bio-data, according to the statistic division it is be confidential. However, for a GIS system to
produce a good representation of population affected by climate change, it is very important
to get the latest population data.
Secondly, it was noted during visitation to several departments that, there are valuable data
not compatible with the GIS database that needs to be translated to a compatible format. For
example, data from hardcopy reports.
Thirdly, many sectors do not appreciate keeping or recording of their data in a systematic and
consistently manner. As a result so many vital data are missing.
Lesson Learnt
SICAP GIS has started a very important chapter in bringing data from different sectors in a
central GIS data system. To some organizations sharing data is not normally practiced.
Because they spend so much to collect data therefore do not want to share what they have.
During the GIS workshop, participants saw a glimpse of what GIS can do and the importance
of sharing data. Some participants in the workshop have supported sharing of data and they
themselves are willing to share their data.
Following the GIS workshop, staffs from the Ministry of education and Save the Children
have visited SICAP GIS and are planning to share what they have. Rather than duplicating
what SICAP GIS has they believe that sharing data would be the best.
Data update required CCD immediate attention
a) Agriculture data (food security, pest & diseases, land use etc). SICAP GIS is yet to
capture any data related food security, pest & diseases, land use etc. In the ministry
concern does not have a proper database for these. CCD needs to follow up with the
Ministry of Agriculture and Livestock
b) Follow up with Forestry for up-to-date Forestry data. The director has given approval
already during the GIS workshop.
c) Continue liaise with medical authority for Medical data (eg. all cases recorded in
clinics)
d) Continuous liaise with MID for Infrastructure data
e) It is important to get hold of the 2009 Census/statistic data when it is released
f) Follow up with Ms Francis (Ministry of Education) and Ms Melissa Mathews (Save
the Children) for school data relating vulnerability and climate change.

SICAP GIS Report September 2013 Page 16
Recommendations
To ensure SICAP GIS database potential is maximized, it must be populated and with new
data layer continuously. The following are highly recommend for SICAP GIS in the future.
1. All CCD staff must be able to access and view GIS data remotely from their own PCs.
This means, CCD must have its own GIS server installed in LAN that enables staff to
access
2. Every CCD staff or MECDM going on field trips must be taught how to collect data
using GPS.
3. To make certain information captured in SICAP GIS are appreciated and fully utilized
it is important to avail the information to others sectors and institutions. This may
encourage them to share their data.
4. CCD or MECDM, through SICAP GIS set up must promote awareness to other
divisions, ministries, sectors and stakeholders on the value data they have captured.
5. CCD staff(s) responsible for the GIS system must be allowed to attend monthly GIS
users meeting or further GIS training when it is available
6. SICAP GIS must Contributing to climate change adaptation and reduction of
vulnerability of people and community of Solomon Islands.
7. CCD must look into
8. It is highly recommended that CCD staff working on GIS must have a continuous
communication with the GIS Consultant, especially when in doubt.
9. It is very important that the GIS data is backed up on a external hard drive. Currently
I have a copy the your data and will continue to work on some MapBasic
programming and MS Access database interface.
Conclusion
SICAP GIS has opened a new chapter for CCD in terms of mapping data depicting the effects
of Climate Change in the context of Solomon Islands. Geographical Information System is a
cutting edge technology, a very powerful tool available for use across different disciplines
and sectors. This system can holds unlimited number of data and map layers and it may only
become ineffective users stop using it.
A baseline map in Geographical Information System format is now available in CCD and is
capable of holding many more data layers. The system will become a very powerful tool as
more and more data are being captured. It was stated during the GIS workshop in this report
that data is the key to the effectiveness of any GIS system; otherwise, a GIS system will not
fulfill its purpose.
More than 20 organizations participated in the GIS workshop are now aware of the SICAP
GIS. Some have already enquire about having their data loaded into the system and retrieving
information from its. Others have requested further details had a chance of having a look at
the system to learn more about that SICAP GIS can do in relation to their requirement. This
is an opportunity for CCD to build on the GIS baseline that has already been developed.

SICAP GIS Report September 2013 Page 17

SICAP GIS Report September 2013 Page 18
Appendix
Appendix 1 - Query retrieve total population in each wards
Appendix 2 – Query retrieve total number of household along 60m buffers of major rivers in Guadalcanal

SICAP GIS Report September 2013 Page 19
Appendix 3 – 35km buffer of earth epicenters
Appendix 4 – Cyclone tracks

SICAP GIS Report September 2013 Page 20
Appendix 5 – 70km buffer along Cyclone tracks
Appendix 6 – Query retrieves total number of household located in fertile land in each ward

SICAP GIS Report September 2013 Page 21
Appendix 7 – MS Access Interface to load NDMO disaster activity (Links with the GIS)
Appendix 8 – Proposed MS Access Interface for SICAP GIS

SICAP GIS Report September 2013 Page 22
Appendix 9 – Participants in the GIS Workshop
Name Institution Contact Attendance
1. Brian Pitakia Consultant 7636358 2. Douglas Yee CCD 24074 3. Hudson Kauhiona CCD 24074
4. Rex Tara SICAP 23031/2 ext 205
5. Thaddeus Siota CCD 23031/2 ext 205
6. Malchai Batee CCD 23031/2 ext 205
7. Nesta Leguvaka SICAP 23031/2 ext 205
8. Gordon Konairamo MOFR 24524
9. Fred Siho UNREDD+ 7498983
10. Susan Sulu MDPAC 38255
11. David Hiba Met/MECDM
12. Agnetha Vave Karamui
ECD/MECDM 23031/2 ext 206
13. Dalton Hone MoLHS 23365
14. Jabin MID 8546323
15. Carlwyn Tengamoana
MID 7586656
16. Marcus Sainsbury MID 31322/7762992
17. Carlos Tatapu MMERE 21522 ext 217
18. Samuel Maeda Wisfort 7416226
19. Leslie Kwaiga Wisfort 7476763
20. Cameron Vudi SI Red Cross 22682
21. Judy Inapi Live and Learn 23697
22. Romano Tarohamia Swock/UNDP 27446
23. Casper Supa PACC 28337
24. Frances Revo MERHD 28803/7712408
25. Simon Uesikoke MRD 25238/7765708
26. Issac Lekelalu MMERE /Water 21522 ext 204
27. Gavin Bare Solomon Water 23985
28. Jimmy Hilly RWSS/MHMS 28166/7493547
29. Hampton Pitukolo NDMO 27937/7469974
30. Sipuru Rove NDMO 27937/7724900
31. Alphonsus Osifo’oa HCC/Physical Planning
23014/7686770
32. Morgan Wairiu Live and Learn 7491443
33. Lorrima Tuke Oxfam 22004
34. Pearson Simi NDMO/PDO 7481232
35. Lawrence Hillary World Vision SI 23092
36. Michael