Embed Size (px)
Citation preview

I
SOLIDIFICATION BEHAVIOUR OF EUTECTIC AND
NEAR EUTECTIC ALUMINUM-COPPER ALLOYS
by
PRADEEP ROHATGI
S.B., Banaras Hindu University, India, 1961
Submitted in Partial Fulfillment of the
Requirements for the Degree of
MASTER OF SCIENCE
at the
Massachusetts Institute of Technology
1963
Signature of Author
Certified by
Accepted by
Department of Metallurgy, January, 1963
Thesis Supeivlsbr
Chairman, Departmental"'Comittee onGraduate Students
/
SOLIDIFICATION BEHAVIOUR OF EUTECTIC AND
NEAR EUTECTIC ALUMINUM-COPPER ALLOYS
by
PRADEEP ROHATGI
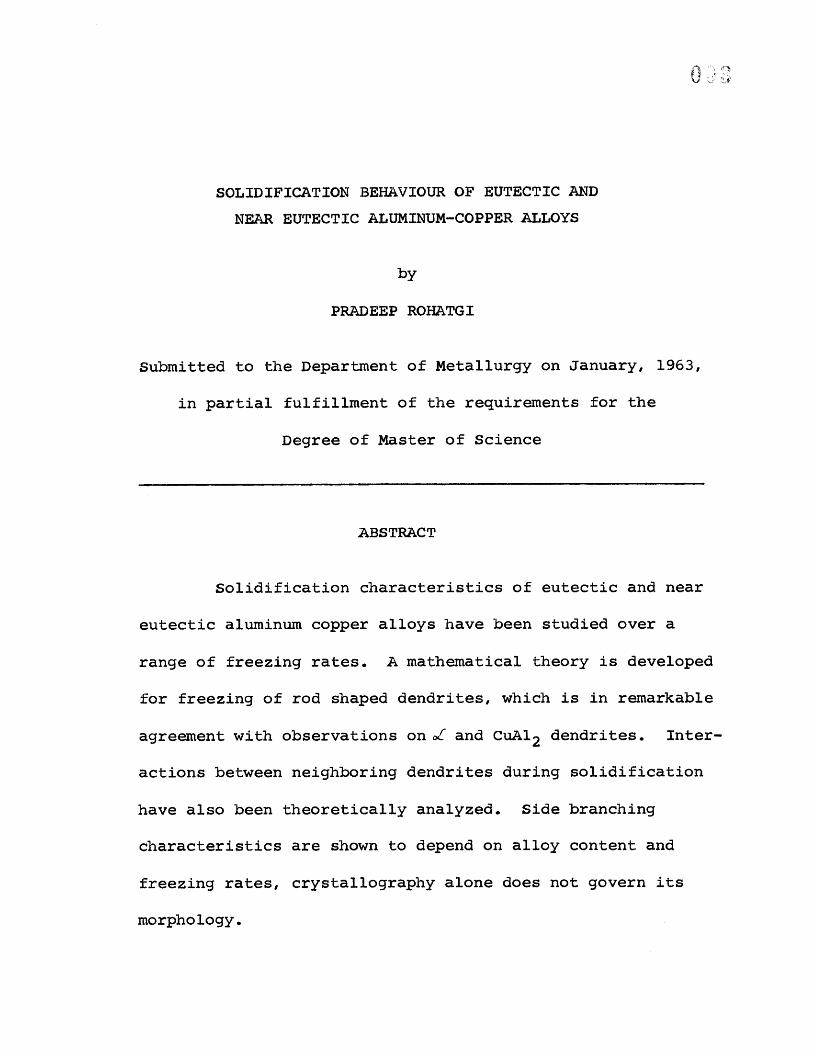
Submitted to the Department of Metallurgy on January, 1963,
in partial fulfillment of the requirements for the
Degree of Master of Science
ABSTRACT
Solidification characteristics of eutectic and near
eutectic aluminum copper alloys have been studied over a
range of freezing rates. A mathematical theory is developed
for freezing of rod shaped dendrites, which is in remarkable
agreement with observations on c& and CuAl2 dendrites. Inter-
actions between neighboring dendrites during solidification
have also been theoretically analyzed. Side branching
characteristics are shown to depend on alloy content and
freezing rates, crystallography alone does not govern its
morphology.

ii
Lamellar eutectic between o( and CuAl2 is found to
exist in dendritic form with side branches in addition to
colonies observed before. A direct evidence has been pre-
sented aggesting that colonies grow with rejection of
certain species. A possibility, that mechanism of eutectic
solidification actually consists of deposition of one phase
in supersaturated form and then precipitation of second from
it, is investigated through theorectical analysis and micro-
structural observations. The model was found to be a possible
explanation of the formation of dendritic interface during
eutectic solidification and presence of cC envelopes around
CuAl2 and eutectic dendrites. An electron microprobe investi-
gation shows that the composition of this oI phase is much higher
than expected normally from equilibrium considerations.
For the first time a long continuous platelet of
CuAl2 with lamellar eutectic on its sides has been observed
in a eutectic colony formed during slow solidification. A
possible explanation for this behaviour is proposed.
Thesis Supervisor: Clyde M. Adams, Jr.
Title: Associate Professor of Metallurgy

iii
TABLE OF CONTENTS
Section No.
ABSTRACT ----------------------------------
LIST OF TABLES ----------------------------
ACKNOWLEDGEMENTS --------------------------
INTRODUCTION ------------------------------
EUTECTIC SOLIDIFICATION -------------------
THEORY ------------------------------------
1. Dendritic Growth --------------------
A. Mass Transport ------------------
B. Heat Flow -----------------------
2. Eutectic Solidification -------------
EXPERIMENTAL PROCEDURES -------------------
A. Preparation of Alloys ---------------
B. Polishing, Etching & Light Microscopy
C. Preparation of Plates ---------------
D. Arc Deposition ----------------------
E. Quantitative Metallography ----------
F. Electron Microprobe Analysis --------
G. Plaster Castings --------------------
H. Studies of Solidification in Flowing
Stream - -------------------------
Page No.
i
v
vi
1
7
9
9
9
12
15
18
18
18
19
19
20
21
22
23
I
II
III
IV

iv
Section No.
V
VI
VII
VIII
Ix
Page No.
RESULTS AND DISCUSSIONS --------------------- 24
A. Hypoeutectic Alloys --------------------- 24
B. Aluminum 38 Percent Copper Alloys ----- 33
C. Eutectic Solidification ----------------- 36
CONCLUSIONS ------------------------------------ 46
SUGGESTIONS FOR FURTHER WORK ------------------ 49
Appendix I - Interactions Between
Neighboring Dendrites -------------------- 49
Appendix II - Mathematical Analysis of the
Proposed Model of Eutectic Solidification 54
TABLES AND ILLUSTRATIONS -------------------- 58
BIBLIOGRAPHY ---------------------------------- 10

V
LIST OF TABLES
Table No.
I
II
III
IV
V
VI
VII
VIII
IK
Title Pa
Composition of Aluminum used for Alloy
Preparation -----------------------------
Calculations of Solidification Parameter
Variation of Dendrite spacing with
Solidification Parameter for 24% Copper -
Variation of Dendrite Spacing with Copper
Content at Solidification Parameter Value
v=l10 ------------------------------
Variation of Growth Constant (3) with
Copper Content --------------------------
Variation of Dendrite Spacing with
Solidification rate for 28% Copper Alloy
Variation of Colony Spacing with Solidi-
fication Rate in Al-Cu Eutectic Alloys --
Variation of Interlamellar spacing with
Solidification rate in Al-Cu Eutectic ---
Results of Solidification Studies in
Flowing Stream --------------------------
ge No.
58
59
60
60
61
61
62
63
64

vi
ACKNOWLEDGEMENTS
The author gratefully acknowledges the able
guidance and encouragement by Professor C. M. Adams, Jr.
during the course of this study.
He also wishes to express his sincere thanks to
the staff of M.I.T. Foundry and Welding Laboratories for
their help in the experimental phases of the program. He
is also very thankful to Miss Frances Gedziun for typing
the thesis.

I. INTRODUCTION
This work includes the studies of solidification
behaviour in aluminum copper alloys of eutectic and near
eutectic composition. The aim was to examine the charac-
teristics of dendritic growth in melts with high solute
content and also to investigate the mechanism of eutectic
solidification. These studies are important from the
practical standpoint as the distribution of individual
phases effects the strength and heat treatment characteris-
tics of a polyphase alloy. The studies on eutectic alloys
are useful as these are quite often present in small amounts
in dilute engineering alloys; moreover, alloys used as
solders are usually of eutectic composition.
Solidification is a two stage process of nucleation
and growth. Unfortunately the nucleation behaviour in alloy
solidification has not been well understood as yet. However,
usually under actual freezing conditions because of the
presence of heterogeneous nuclei, nucleation is not much of
a problem and growth is the important factor governing the

-'I-----
2
ultimate morphology. Factors effecting the growth character-
istics are mainly:
1. Crystallographic considerations.
2. Thermal considerations.
3. Mass transport considerations.
Crystallographic factors are important since now it
is well established that solid grows into liquid by successive
addition of individual atoms. The ease and rate of addition
of one atom to an atomic plane depends upon the atomic
distribution on that plane. Thermal considerations come into
play because it is necessary to remove the latent heat produced
on solidification for continued growth. The overall solidifi-
cation rate depends on the rate of heat extraction irrespective
of the growth mechanism. The problem of mass transport arises
because the solid separating from liquid is of a different
composition and solute is either manufactured or consumed at
the interface depending on the value of distribution coefficient
CsK(C- in Figure 1). Under freezing rates of interest, this
solute is not able to diffuse away into the liquid and a
concentration profile shown in Figure 2, is obtained.

3
In Figure 3 the actual temperature distribution and
liquidous temperature distribution shows that liquid near to
the interface is supercooled. Moreover, the liquid slightly
farther away from the interface is more supercooled than that
immediately adjacent to it. The solid interface reaches out
for this aipercooled liquid by developing protrusions so that
for the same rate of overall mass growth, the interface area
is maximum; hence, the build up of the solute per unit area
is a minimum. Rutter and Chalmers 3 have discussed how the
form of protrusions is effected by the ratio of temperature
gradient (G) to the rate of growth (R). They show that at
small rates of G/R these take the form of dendrites.
Thus we see that the localized growth rate is governed
by the mass transport problem whereas the overall solidifica-
tion rate depends upon rate of heat removal.
Most of the work done on dendritic growth is
qualitative. Three aspects of dendritic growth, namely the
crystallography, the spacing between dendrites (the lateral
growth), and the longitudinal growth rate seem to be the most
important characteristics. It has been well established that
4
dendrites4,5 grow in the direction resulting from the growth
on most densely packed planes. During dendritic growth there
is no simple relation between overall rate of movement of
solid liquid interface and mass freezing rate. However,
quantitative solutions to linear growth rates of individual
dendrites have been presented by several workers. We shall
discuss mainly the problem of spacing between the dendrites.
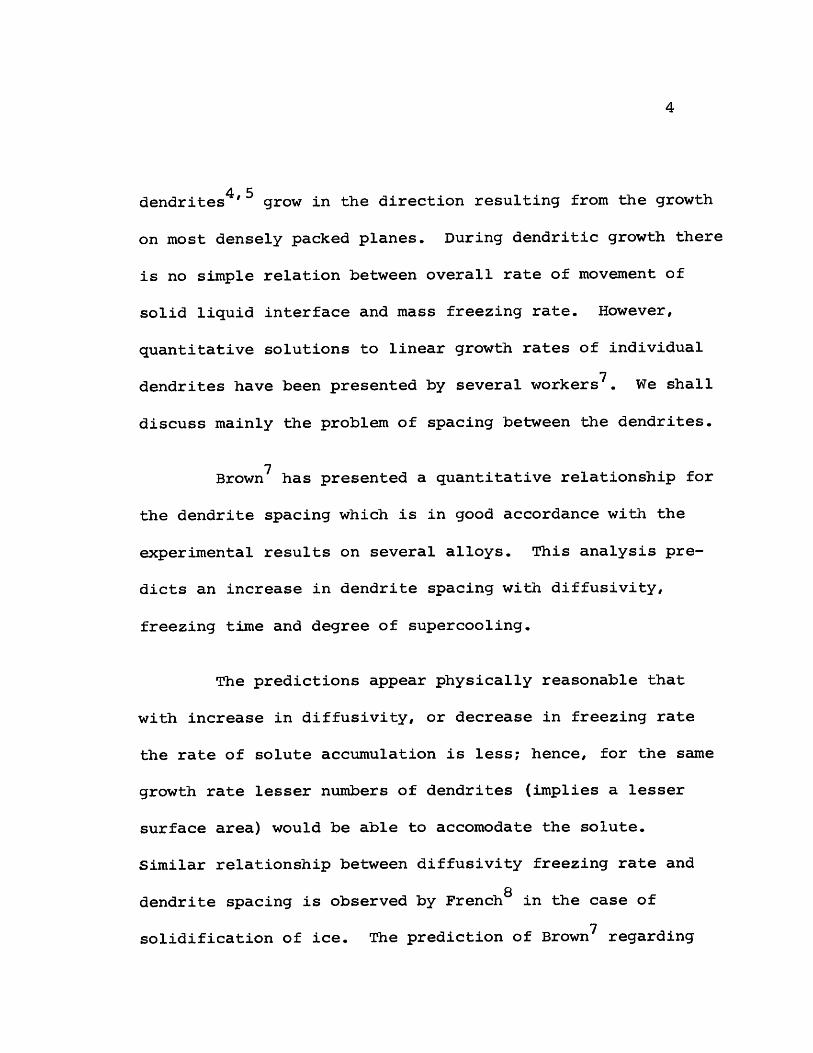
Brown has presented a quantitative relationship for
the dendrite spacing which is in good accordance with the
experimental results on several alloys. This analysis pre-
dicts an increase in dendrite spacing with diffusivity,
freezing time and degree of supercooling.
The predictions appear physically reasonable that
with increase in diffusivity, or decrease in freezing rate
the rate of solute accumulation is less; hence, for the same
growth rate lesser numbers of dendrites (implies a lesser
surface area) would be able to accomodate the solute.
Similar relationship between diffusivity freezing rate and
dendrite spacing is observed by French8 in the case of
solidification of ice. The prediction of Brown7 regarding

5
the effect of supercooling appears to be quite sound, that
more the amount of supercooling liquid can sustain, more
solute it will accomodate and, hence, the farther spaced the
dendrites can be. However, their observation that the super-
cooling is independent of cooling rate is probably because of
the experimental conditions used in which nucleating surface
was already present.
The story of dendritic crystallization is not complete
without understanding the later stages in lateral growth after
the establishment of primary dendrite spacing. The inter-
dendritic liquid goes on getting richer in the solute content
due to separation of primary phase until finally it reaches the
eutectic composition after which probably it solidifies as such.
The exact mechanism of nucleation and growth of this eutectic
is not quite clear; also, in some cases one of the eutectic
phases is nucleated and deposited on the primary dendrites and
we observe only the second phase in the interdendritic region.
However, if during growth, conditions in liquid change in a
manner necessitating a smaller dendritic spacing, secondary
arms develop on these primary dendrites. The quantitative
information regarding these secondary arms is not very satisfactory.

6
In the present work a more sophisticated relationship
for dendrite spacing, considering rod shaped dendrites, has
been developed. Also, attempts have been made to study the
effect of solidification of a dendrite on its neighbor. High
copper, aluminum copper alloys are used to see whether the
relationship holds good in near eutectic compositions and also
to observe the effect of increased concentration on the dendrite
morphology.

-1
7
II. EUTECTIC SOLIDIFICATION
The mechanism of eutectic solidification has not been
well understood in spite of the large number of years which
have elapsed since it was first observed. However, several
classifications9 ,10,11 of eutectics have been developed which
are based either on the shape of the phase particles or on
the degree of association between the two phases. The basic
concepts are still more or less same that the two phases
either nucleate side by side and then grow into the melt or
they nucleate separately, independent of each other and then
come into contact and grow simultaneously. Vadilol2 calls it
as the interlaced dendritic growth of two crystals of different
phases. Tiller14 has treated the problem quantitatively and
has predicted the possible interface shape and the variation
of interlamellar spacing with freezing rates.
Weart and Mackl5 have discussed the difference between
eutectic colonies, grains and lamella. They have found colonies
to be a common growth feature in several eutectics. Interestingly
enough, their observations show that orientation of one phase
(4 in 3J-CuAl2 eutectic) was same over several colonies, an
8
observation comparable to same orientation of several dendrites
in a grain. They have proposed that colony structure is
generated because the plane front breaks down into cellular
interface due to some common impurity rejected by both phases;
these cells grow into colonies. On this postulation, they
have explained the fanning and coarsening of lamella at the
colony boundaries. Craft and Albright16 have also verified
this theory of colony formation and also have observed several
defects in lamellar structure. Above theories seem to be
quite adequate at the surface but do not explain several facts
like the continuity of a certain phase in a eutectic, also the
break down of lamellar structure at the colony boundary and in
the regions between colonies.
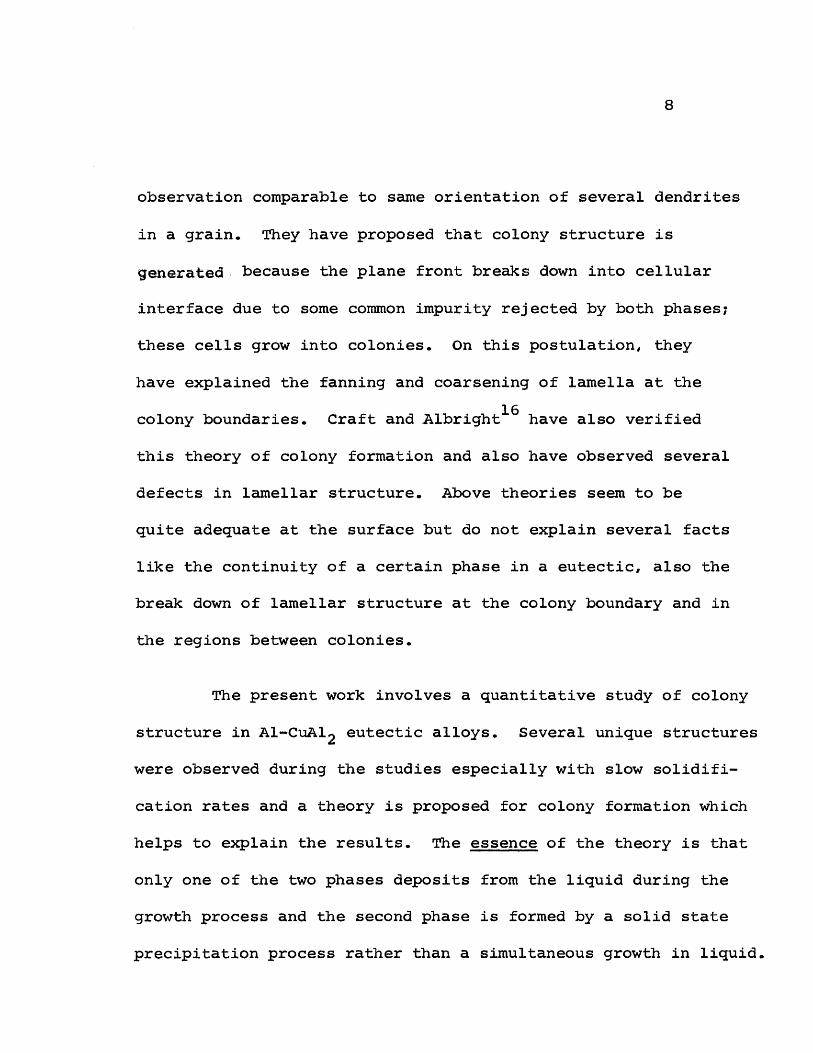
The present work involves a quantitative study of colony
structure in Al-CuAl2 eutectic alloys. Several unique structures
were observed during the studies especially with slow solidifi-
cation rates and a theory is proposed for colony formation which
helps to explain the results. The essence of the theory is that
only one of the two phases deposits from the liquid during the
growth process and the second phase is formed by a solid state
precipitation process rather than a simultaneous growth in liquid.

9
III. THEORY
1. Dendritic Growth
A. Mass Transport.
We have discussed earlier that dendrite formation can
be visualized as sudden development of protrusions in liquid
and their lateral growth in the melt. Thus we can approximate
a dendrite in its initial growth stages as a line source
rejecting solute atoms in an infinite medium. The equation
derived by Carlsaw and Jaeger17 for heat flow in an infinite
medium from a continuous line source is:
q -uT - To - r .- du
4Ak4,1CPL r2) u
where: To
T
q
J9
c pl
(Equation 1)
= Initial temperature of the mass.
= Temperature at radius r.
= Heat quantity liberated per unit time.
= Density.
= Specific heat of liquid.
= Time.
= Diffusivity.

10
By similarity, we can write the equation for mass flow
around a continuous source rejecting solute (Figure 4).
C - Co = n 2 du4D. u
4DO
Where: Co
C
Di
9
n
(Equation 2)
= Initial concentration of liquid.
= Concentration at radius r.
= Diffusivity in liquid.
= Time.
= Number of solute atoms rejected per unit time.
Using rs for the radius at time 9 of the solid region
and assuming a parabolic growth rate, we define a constant,'.
2rs
4DO9
(Equation 3)
We now solve equation number 2 with two boundary
conditions:
1. At r = rs C = CL (In the very initial stages of1U tfreezing. )
2. Mass Balance - Under steady state conditions the

11
amount of solute rejected at the solid liquid interface is
diffused away into the surrounding liquid or
C (1-K) drs - D (ac)L f@'~ l Y r = r
(Equation 4)
Evaluating -a from equation 3 and () = r from
equation number 2 and substituting in equation 4 we get
/ 42CL (1-K) -- n e__
L 4AD A1 7<
(Equation 5)
Evaluating the value of n by applying equation 2 at
r = rs
CL - C =0 4AD
A
/
e d,
(Equation 6)
From equations 5 and 6
CL - CO= Ei ( '2 2
(1-K) CL
(Equation 7)

12
2) 2where: Ei ( )
We can see from equation 7 that the growth constant -
depends on the value of initial concentration Co and the extent
of undercooling which governs CL - C00 Solving equation 7 by
trial and error for different values of undercooling we get a
relationship between and 6 T represented by Figure 5 for
Co = 4.5. This curve shows that 7 increases with supercooling
almost linearly except for very small values of AT.
B. Heat Flow.
The following relationship is obtained by performing
a heat balance between overall rate of heat extraction and
the latent heat librated by dendrites freezing with a growth
constant /. The dendrites are assumed to be arranged at the
centers of a hexagonal network which is a reasonable approxi-
mation for rod shaped dendrites.
C .dT = 8Az5/D/H
(Equation 8)

13
where: X = Dendrite spacing in feet.
D = Diffusivity in ft. 2/ second.
H = Latent heat of freezing B.Th.U./lb.
C = Specific heat B.Th.U.p lb. x sec.
/= Density of solid or liquid in lbs./ft.3
(We neglect density difference between solid and liquid.)
From the above relationship we see that dendritic
spacing X is inversely proportional to the square root of the
rate of heat extraction and directly proportional to the
diffusivity and latent heat of freezing.
In our work the alloys were solidified under a traveling
arc (see details later in the chapter of experimental procedures)
and the rate of heat extraction for that set up is given by1 8
dT= 2 vK()dO 21K q)
where: K
v
Tm
To
q
(Tm - To)2
(Equation 9)
= Thermal conductivity.
= Arc travel speed.
= Melting point, solidous temperature of the metal.
= Initial temperature of the metal before deposition.
= Arc power input.

14
From equations 8 and 9
4/ 2 DH .q
1.73 CpK (Tm-To) 2 v
(Equation 10)
Thus for constant value of D, H, C , K and (Tm-To),
the dendrite spacing should be a linear function of /9 . The
work of Brown7 on several alloys is in accordance with this
theory. A calculation was made by substituting the data of
obtained by him on 2014 alloys in equation 10 (the values of
other constants were taken from reference 7) giving the value
of to be equal to 0.05 (which is a quite small number)
indicating that growth rate of individual dendrite is quite
small as compared to overall growth rate.
It appears necessary to investigate the mutual inter-
action between neighboring dendrites during the solidification
process to check the validity of our assumption. A mathematical
treatment is presented in Appendix I dealing with two neighboring
dendrites freezing simultaneously. It is shown that quite soon
during the solidification process (when fraction of solid is
0.0016) the dendrites become aware of each other and each one

15
should be considered as freezing in a definite zone of liquid
around it, rather in a infinite medium. However, it is evident
that this condition develops only after the primary dendrite
spacing is established; hence, the theory presented for the
same remains uneffected. The other implication of this result
is that it indicates that the conditions in the liquid change
drastically immediately after the protrusion of primary den-
drites and the secondary dendrites can form during very early
stages of solidification. This is probably the reason that
the difference in thicknesses of primary and secondary dendrites
is not very large.
2. Eutectic Solidification.
The theory proposed here for eutectic solidification
postulates that during eutectic solidification only one phase
deposits as a supersaturated solid solution and the second phase
precipitates from this during growth process resulting in the
eutectic structure.
In case of aC (Al)-CuAl2 eutectic, quite often the o6
phase is continuous so it is concluded that probably this is
the phase which nucleates from the eutectic liquid. However,

16
even if both phases are present, there will be a tendency for
this phase to overlap the CuAl phase during the growth process.2
In Figure 8, we consider two phases growing simultaneously into
the liquid. The numbers refer to the copper percentages which
are taken from extended phase boundaries of equilibrium diagram
(Figure 7). (To elucidate the principles, very large super-
cooling is assumed and the numbers are hypothetical.) It can be
seen that copper will try to diffuse out in both liquid and
solid from the interface BC. This will cause it to move faster
in comparison to BD where copper comes from liquid only.
Figure 9 illustrates how this differential growth rate leads
to the enveloping of CuAl2 phase by .
In Appendix II a mathematical analysis of the proposed
model of eutectic solidification (involving the precipitation
of second phase from the supersaturated solid solution of the
first) is presented. The results indicate that the growth rate
of eutectic front by this mechanism is very slow, and therefore,
a large number of such fronts will be needed to get an appreciable
rate (overall) of solidification corresponding to the rate of heat
extraction. This could be a possible explanation for the observed
decrease in the size of eutectic colonies with increase in
freezing rate.
17
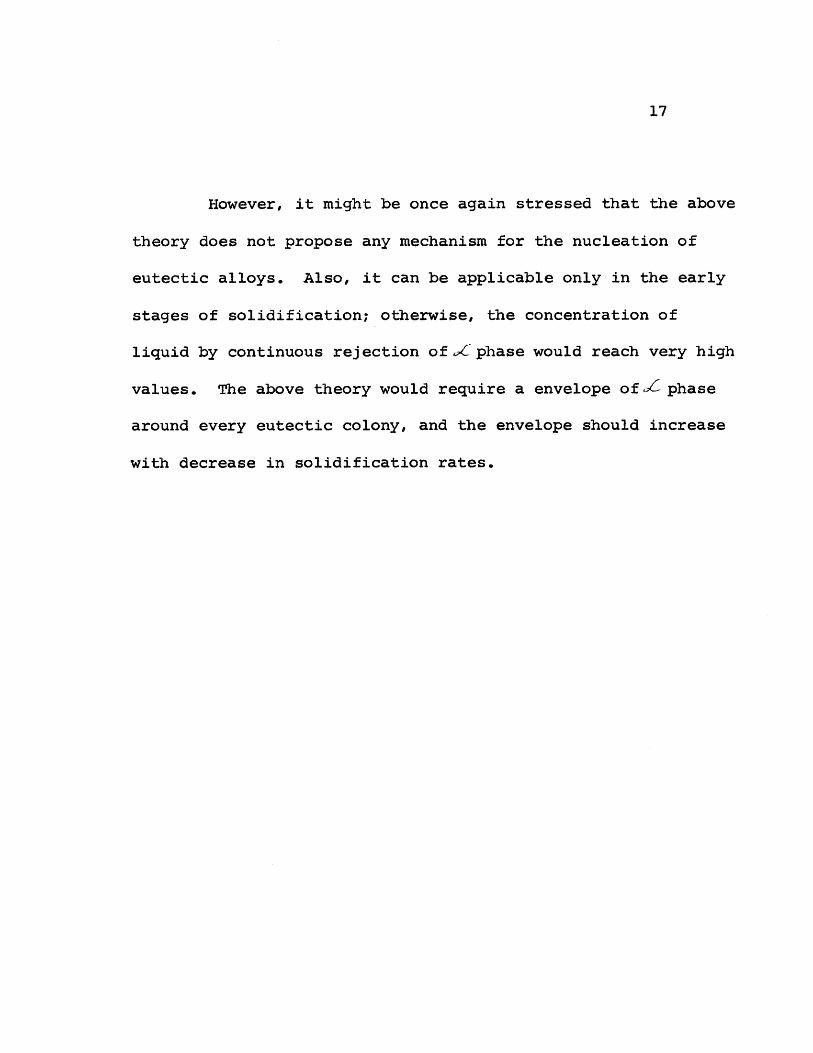
However, it might be once again stressed that the above
theory does not propose any mechanism for the nucleation of
eutectic alloys. Also, it can be applicable only in the early
stages of solidification; otherwise, the concentration of
liquid by continuous rejection of .C phase would reach very high
values. The above theory would require a envelope of Z phase
around every eutectic colony, and the envelope should increase
with decrease in solidification rates.

18
IV. EXPERIMENTAL PROCEDURES
A. Preparation of Alloys.
The alloys investigated were aluminum-copper alloys
with 24, 33 and 38 percent copper respectively. These alloys
were prepared by first making a 50-50 hardener in an induction
furnace using electrolytic copper and aluminum of composition
given in Table I. The hardener was remelted in an induction
furnace and diluted with aluminum to get the required com-
position. Care was taken at every stage to avoid gravity
segregation.
B. Polishing, Etching and Lifnt Microscopy.
Initial polishing was done on standard rough polishing
papers and the final polishing on coarse and fine diamond
wheels or the syntron polisher. The alloys being brittle were
not hard to polish li)je the dilute aluminum alloys. The
specimens were etched with 25 percent Nitric acid which etched
CuAl2 phase dark, thereby, giving a better contrast as compared
to the regular Kellars reagent. Metallography was done on
Riecherts Metallograph, oil immersion lenses used for high
magnifications.

19
C. Preparation of Plates.
The plates for arc deposition were made by melting the
alloy of required composition and pouring it into a mold
1 ft. x 1 ft. x 2 in. which was made by assembling steel
plates 1 inch thick. This arrangement produced chilled plates
with columnar crystals growing from the bottom and the sides.
Horizontal and vertical sections were taken from the plate to
examine the nature of dendritic growth in the plates.
D. Arc Deposition.
Arc deposits were made on the plates described above
to investigate solidification behaviour under fast cooling
rates. An electric arc is produced between the plate surface
and a permanent Tungsten electrode in an atmosphere of Argon
to avoid any oxidation. The Tungsten electrode is then
moved over the plate surface in a straight line. The appara-
tus has been described by RossJ22; a schematic is given in
Figure 11. In this case the metal is melted under the arc
and then allowed to freeze rapidly by heat extraction through
the remaining plate. The arc length is maintained constant
automatically.

20
The time to solidify for the metal melted is propor-
tional to the energy input per unit length of the deposit.
This is dependent on the arc power and travel speed. A suitable
combination of voltage and current was found resulting in a
stable arc. The travel speed was varied between 5 to 95 inches
per minute, thereby, varying the cooling rate by almost 18
times. Table II illustrates the calculation of g/V values for
the conditions used in present work. A microscopic examination
was carried out on specimens taken out of these plates. Sections
of the material parallel to the weld direction and perpendicular
to the plate are referred as vertical sections and those which
are parallel to weld direction and parallel to plate are called
horizontal sections (Figure 12).
E. Quantitative Metallography.
Dendrite spacings and interlamellar spacing were
measured on these arc deposits. All the measurements were made
in the immediate vicinity of weld interface because the cooling
velocity increased with distance from this interface. Spacing
measurements were made on dendrites perpendicular to the inter-
face by counting the number of dendrites along certain length
of the interface. Several sets of observations were taken and
a statistical average was found out.

IF. Electron Microprobe Analysis.
Electron microprobe analysis was performed on the
specimens from chilled cast plates with 38 percent copper.
The aim was to determine the composition of the envelope of
, phase which was invariably found to be present around CuA12
particles in these alloys. Unetched specimen polished on a
syntrci was placed in the probe and irradiated by the electron
beam. The scanning crystal was so adjusted that out of the
emitted copper and aluminum radiations only copper radiations
were reflected and fed into the counter. The geared motor
was switched on which moved the specimen along a straight
line at a fixed speed. This enables us to determine composi-
tion along a certain length of the specimen. The sample when
examined later showed a light streek along the path traversed
by the beam. A light etch clearly revealed its entire path as
well as the structure it had analyzed. Copper percentages
were calculated from the intensity recording chart assuming
the intensity - composition scale to be linear specially at low
copper percentages. The observations on aluminum-copper system
done elsewhere 23 ,24 also support this assumption.
21

22
G. Plaster Castings.
In order to obtain slow solidification rates, plaster
molds were used for freezing the alloys. Circular molds, 5
inches in diameter, 5 inches in height with a cylindrical
cavity 1.6 inches diameter, and 2.8 inches in length in the
top portion, were made from casting plaster by standard
techniques. These molds were preheated in a gas fired furnace
for 48 hours at 500 0F. Alloy chips were kept into the cylin-
drical cavity of the mold and melted by a welding torch. The
melt was superheated sufficiently and stirred by a tungsten
rod to avoid any segregation. The molten pool was then allowed
to solidify. With such an arrangement, a unidirectional soli-
dification is obtained by extraction of heat into air as on
the rest of the sides the melt is surrounded by insulating
plaster. Ingots frozen in this manner showed dendrites growing
from top surface downwards. In some cases, additional heat was
supplied from top by weld torch to obtain still slower
solidification rates. The cast rod was taken out and sectioned
through the center along the length and polished for metallo-
graphic examination.

23
H. Studies of Solidification in Flowing Stream.
An apparatus was developed to study the solidification
behaviour of alloys in a flowing stream. The equipment25
shown in Figure 13 mainly consists of an inclined trough of
steel with a water jacket at the bottom for chilling. Alloy
melts from induction furnace after being sampled were poured
down the trough. The solidified strip was removed and the
overflown metal was collected in another crucible at the
bottom, sampled and repoured again over the trough. The
process continued until no more metal overflowed. Samples
for chemical analysis were taken from the solid strip at one
foot intervals from pouring end. Also the samples collected
from initial liquid and the remains after each pour were
chemically analyzed. Metallographic examination was conducted
on solid strips taking specimens along a plane perpendicular
to the strip along the length of the pour.

24
V. RESULTS AND DISCUSSIONS
A. Hypoeutectic Alloys (24% Copper).
The 24 percent alloy chilled cast plates solidified
directionally from the bottom as shown by Figure 14 which
is a vertical section of the plate showing dendrites of o(
phase with eutectic in between. Some of the dendrites appear
to be well developed having secondary as well as tertiary
branches (Figure L5). The secondary arms appear to almost
perpendicular primary arms, whereas the tertiary ones are
inclined at an angle slightly less than 900. A horizontal
section across the dendrites (Figure 16) indicates that
these have a four fold symmetry. Similar dendrites of the oC
phase have been found in chill cast 4 percent copper alloys26 ,
but without so extensive tertiary branching.
The arc deposits of this alloy show a transition zone
(Figure 17) at the interface between original plate and rapidly
frozen weld deposit. The transition zone contains coarse
primary oC particles, of the same size as in the original plates,
with a very fine eutectic in between. This happened because in
this region only partial melting of plate occurred; only the
eutectic melted and the primary particles remained as such.
25
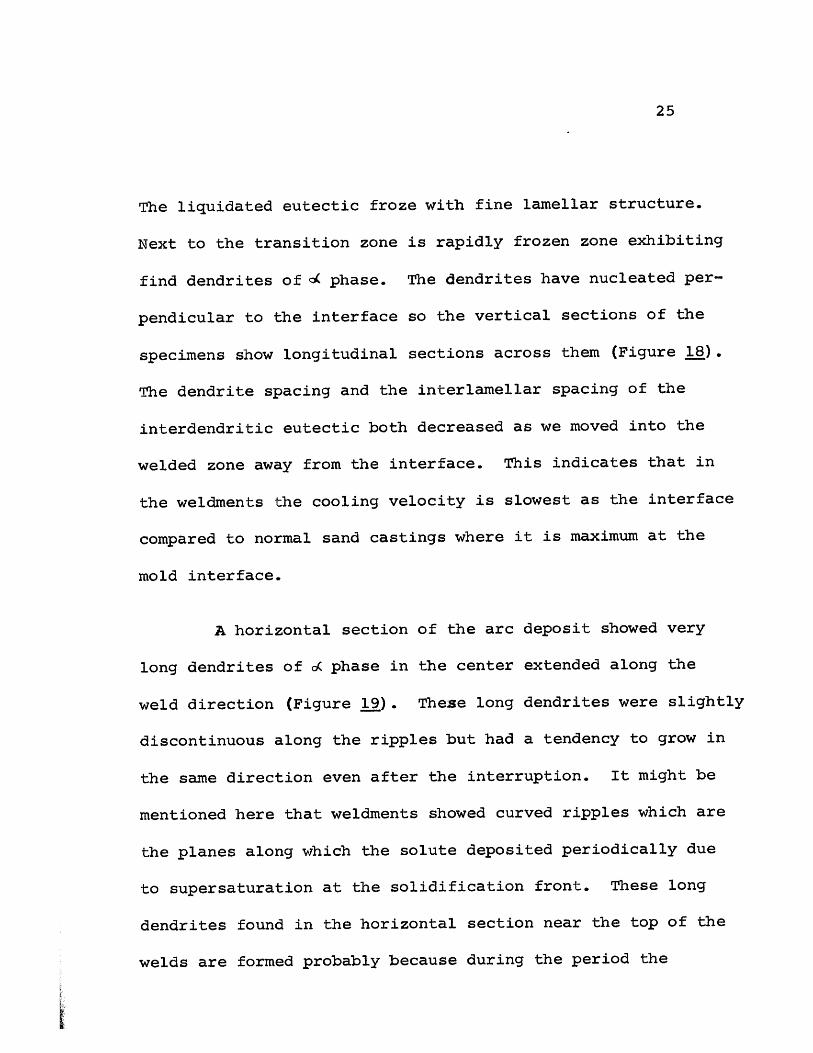
The liquidated eutectic froze with fine lamellar structure.
Next to the transition zone is rapidly frozen zone exhibiting
find dendrites of d phase. The dendrites have nucleated per-
pendicular to the interface so the vertical sections of the
specimens show longitudinal sections across them (Figure 18).
The dendrite spacing and the interlamellar spacing of the
interdendritic eutectic both decreased as we moved into the
welded zone away from the interface. This indicates that in
the weldments the cooling velocity is slowest as the interface
compared to normal sand castings where it is maximum at the
mold interface.
A horizontal section of the arc deposit showed very
long dendrites of o( phase in the center extended along the
weld direction (Figure .9). These long dendrites were slightly
discontinuous along the ripples but had a tendency to grow in
the same direction even after the interruption. It might be
mentioned here that weldments showed curved ripples which are
the planes along which the solute deposited periodically due
to supersaturation at the solidification front. These long
dendrites found in the horizontal section near the top of the
welds are formed probably because during the period the

26
dendrites were growing from all sides of the semicircular
interface, the liquid in the center of the circle near the
top cooled and started freezing before the dendritic solidi-
fication front could reach it. This gave rise to dendrites
which grew parallel to the weld direction independent of the
interface.
The shape of the dendrites in the arc deposits is
different from the cast plates. Here it consists of one long
stem with rods attached to the sides of it making an angle of
almost 600 to the main axis. Twelve of these side branches
appear to project from a point on the main stem arranged at
an angle of 300 to each other as indicated by a transverse
section across a dendrite (Figure 20). Also the side branches
were much smaller in relation to the main stem in this case as
compared to chilled cast plates. Hence, it is concluded that
with increase in solidification rate the primary dendrites
are placed closer; there is an increase in the number of
secondary arms projecting from a point but at the same time a
decrease in relative length of secondary arms. The growth
direction of the secondary arms appears to change to one of
larger fold symmetry with increase in solidification rates.

27
Interesting observations regarding the effect of solute
concentration on dendrite shape are made when dendrites obtained
in the present work are compared to the dendrites obtained by
7 7Brown on 4.5 percent copper alloys. Brown did not observe
any side branching in 4.5 percent copper arc deposits under
similar freezing rates, where as the presence of the side
branching in some alloys under slow freezing conditions has
been mentioned before26 . This observation indicates that
tendency of side branching increases with the solute content.
The absence of side branching in 4.5 percent copper alloy arc
deposits may be due to the fact that rapid freezing rates
reduced the length of side branches to nothing because of
lesser tendency of side branching at low alloy contents.
The quantitative metallography results on arc deposits
of these alloys show a linear variation of dendrite spacing with
the solidification parameter q/v (Figure 22) Table III. This
is in accordance with the proposed theory that dendrite spacing
increases linearly with the square root of freezing time.
Figures 21, 23 and 24 illustrate the decisive role of freezing
rate on dendrite spacing.

28
The values of dendrite spacings at a fixed solidifica-
tion rate ( fv = 10) for several aluminum-copper alloys are
presented in Table IV. A plot of dendrite spacing versus
copper percentage shows a linear relationship between the two
(Figure 25). This result is in accordance with the observations
of Alexander who found increase27 in dendrite spacing, for
several alloys, with solute content. French8 also observed a
similar relationship for ice dendrites during solidification
of water. A plot from his data is presented in Figure 26
showing linear increase in dendrite spacing with KCl content.
The dendrite spacing of CuAl2 in 38 percent alloys is
only 13 microns at solidification parameter value of ten
(same as that of hypoeutectic alloys, Figure 25). This indicates
that the dendrite spacing increases with solute content only till
the eutectic composition. This is also expected because after
eutectic composition the primary phase appearing as dendrites is
different and in this case may have a low characteristic spacing
(the spacing to which the plot between solute content and
dendrite spacing extrapolates at zero solute contents is
referred to as characteristic spacing25 it is probably the
same irrespective of solute considered). However, the dendrite

29
spacing for 38 percent alloy fits the straight line for
hypoeutectic alloys if, instead of copper content, Co-Cs (the
amount of solute to be rejected at the outset of freezing).is
plotted against dendrite spacing. As this change would not
effect the plot for hypoeutectic alloys appreciably (also will
have no effect on ice data since Cs = 0), the spacing for
38 percent alloys is plotted on the original graph (Figure 25).
This indicates that dendrite spacing might be a
function of Co-Cs for the same system independent of the primary
phase separating out. Equal dendrite spacing observed by
Brown in copper-nickel alloys with 30 percent and 60 percent
nickel, respectively, indicates that dendritic spacing does not
depend on impurity content only. Also the fact that these
alloys have almost the same Co-Cs value suggests that dendrite
spacing may be function of composition difference between liquid
and first separating solid in a system. However, it should be
mentioned that these observations might be just a fortunate
coincidence due to interplay of several other factors and more
systematic investigations should be made confirming this
dependence.
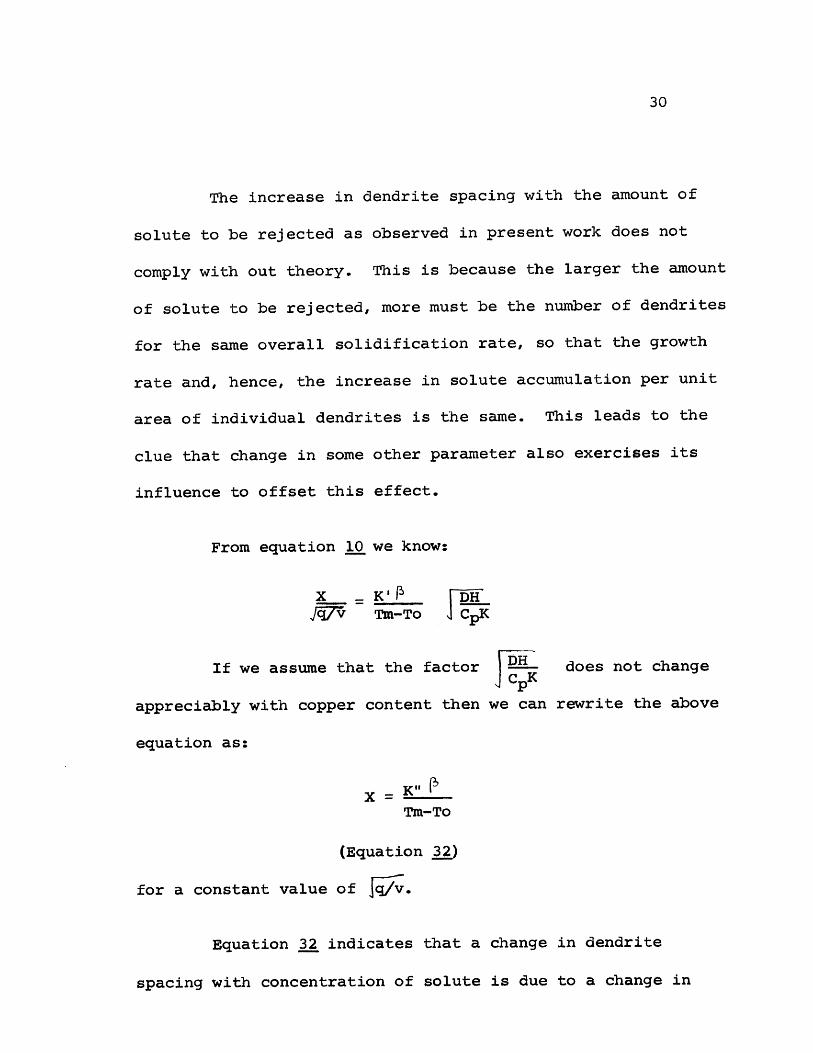
From equation 10 we know:
X K' _
,qv Tm-ToDHCpK
If we assume that the factor PH does not changeCpK
appreciably with copper content then we can rewrite the above
equation as:
X = K"t
Tm-To
(Equation 32)
for a constant value of q/v.
Equation 32 indicates that a change in dendrite
spacing with concentration of solute is due to a change in
L
30
The increase in dendrite spacing with the amount of
solute to be rejected as observed in present work does not
comply with out theory. This is because the larger the amount
of solute to be rejected, more must be the number of dendrites
for the same overall solidification rate, so that the growth
rate and, hence, the increase in solute accumulation per unit
area of individual dendrites is the same. This leads to the
clue that change in some other parameter also exercises its
influence to offset this effect.

31
the value of f (the change in Tm-To with solute concentration
is hardly of the order of 15-20 percent). A calculation taking
the value of constant K" same for all alloys (same as that for
4.5 alloy7) resulted in the values of f (Table IV) showingalmost a five fold increase with change in copper concentration
from 1 to 24 percent.
We know from equation 7:
F( = C-CO ATCL-Cs (CL-Cs)m
(Equation 33)
where F( P) is an increasing function of p n zT the super-
cooling and m the slope of the liquidus. From equation 33, it
is obvious that an increase in with Co-Cs (Co-Cs s CL-Cs),
as observed, is possible only if the supercooling increases
with this parameter. A rough estimate indicates that a three
fold increase in the value of with a five fold increase in
Co-Cs (considering 4 and 24 percent alloys) can result only by
about a twelve fold variation in the value of AT.

32
There is lack of direct experimental data on the
supercoolings in metallic alloy systems 28. However, direct
observations have been made by Grenchyl3 on nonmetallic solu-
tions and melts, showing an increase of supercooling with
solute content. It would be interesting to do some direct
measurements on supercooling of alloy melts without allowing
any heterogeneous nucleation (in this case the effect is
observed in spite of the presence of pre-existing nucleating
surface). The observed effects of increase in supercooling
with difference in solid liquid composition may be due to
increased diffusion requirements which probably offset the
effect of increased free energy difference.
The solidification of the interdendritic liquid will
be discussed during considerations of eutectic solidification
because here we have eutectic in between primary dendrites
rather than CuAl2 as was observed in arc deposits7 of 4.5
percent copper alloy. Also there appears to be a boundary
of CuAl2 between primarycC and the eutectic.

33
B. Hypereutectic Alloys.
The 38 percent copper chilled plate freezes with
a dendritic structure as shown by Figure 27. The fine
structure in the picture is of the arc deposited material in
the plate. The dendrites appear to be very uniformtly
arranged and appear to have a three fold symmetry. Figure 28,
which shows transverse section of a cross the dendrites clearly
reveals the striking three fold symmetry in which the secondary
branches are arranged about the main stem which appears to be a
rod.
Investigation of the arc deposits in these alloys show
a transition zone like 28 percent alloys (Figure 29), however,
in this case the CuAl2 dendrites, in the arc deposits have the
same shape as in plates. A vertical section through the arc
deposits (Figure 30) throws further light on the shape of the
CuAl2 dendrites. It appears that these consist of a long rod
with three secondary branches projecting from points along its
length. The three side branches are inclined to the main stem
at an angle of 600 and are symmetrically arranged around it,
making angles of 1200 with each other. Very small tertiary
branches are also observed.

34
The crystal structure of CuAl2 is complex body centered
tetragonal, a prototype of C16 type29 . Growth on any of the
close packed planes, symmetrical about the tetragonal axis
could have lead to the formation of the main stem. However,
the three fold symmetry of secondary branches is unexpected
because in a tetragonal crystal there is no such symmetry. A
possible explanation could be that this structure represents
growth along directions with four fold symmetry as all the
branches are inclined to each other at 1200. Excessive growth
along one of the four axis due to heat extraction in that
direction could have resulted in the observed structure. Direct
X-ray investigations are necessary to establish the crystallo-
graphy of growth in this system.
At this point, it seems worthwhile to mention an
interesting visual observation. The chilled cast plate of
38 percent alloy showed a peculiar tearing at the top surface
which froze last (Figure 31). The surfaces of 4, 24 and 33
percent copper plates cast under similar conditions were more
or less snooth. This indicates that this occurance is not due
to shrinkage of the interdendritic liquid but is an outcome of
properties of the primary phase. The commonly observed three

35
fold symmetry of the tears indicates a possible correlation to
the dendrite shape, although such a direct dependence appears
unlikely. The tearing is probably cause by the shrinkage of
dendritic network of CuAl2 during cooling.
Coming back to the arc deposits in 38 percent alloy,
the relation between dendrite spacing and the square root of
freezing velocity is linear in this case too (Table VI, Figure
32). Thus the proposed theory holds equally well whether the
solidification front is rejecting or consuming solute.
Figures 33 and 34 show the effect of cooling rate on dendrite
spacing and the remarkable uniformity in the pattern of
arrangement. Figures 35 and 36 represent two unusual structures
observed during the metallography. Figure 35 shows abnormally
large secondary branches with well developed tertiaries and
Figure 36 shows unusually long dendrites running across the
picture.
Another interesting feature of CuAl2 dendrites in 38
percent alloys is that they are usually surrounded by an
envelope of cC phase (Figures 29 and 37) . The thickness of the
envelope appears to decrease with increase in solidification
rate. An electron-probe beam was run across the CuAl2

36
dendrites in order to investigate the copper content of theo(
envelopes (Figures 38 and 39). The white streak represents
the path of the beam. Surprisingly enough, the composition
of the a phase in these structures was 8-9 percent copper
instead of 4.5 percent. It appears that the presence of these
envelopes is not an outcome of dendritic crystallization but
probably is associated with the mechanism of the solidification
of the interdendritic liquid.
C. Eutectic Solidification.
The chilled cast plates of 33 percent alloys froze with
eutectic colonies growing upwards from the base of the chill.
Figure 40, a vertical section of the plate, shows the eutectic
grown exactly in a manner similar to dendritic crystallization
(the white portion in the picture is the unresolvable structure
in the arc deposited zone). Side branching from main stem can
also be seen. Examination at a higher magnification (Figure
42) reveals that these are colonies arranged in a fir tree
pattern, characteristic of dendrites. A horizontal section of
the plate show the plan of these dendrite-like colonies (Figure
43). The structure of eutectic in between these colonies is
quite coarse and irregular.
37
A very slow cooled plaster case of 33 percent alloy also
showed dendrite-like arrangement of eutectic colonies but with
lesser side branching (Figure 41). In this case colonies are
still farther apart and the amount of coarse eutectic with
irregular particle distribution is considerable.
The arc deposits on the 33 percent plates show eutectic
colonies grown perpendicular to the interface (Figure 44). The
transition zone is not present in this case because there was
no partial melting. However, colony formation is not quite
obvious in the immediate vicinity of the interface (Figure 45)
which shows lamella grown perpendicular to the interface with-
out any colony formation. Only a little farther away these
lamella appear to arrange themselves in colonies.
A quantitative study of variation in the colony spacing
with square root of freezing rate showed a linear relationship
like the dendrites (Table VII, Figure 46). A comparison of
Figure 44 and Figure 47 shows the effect of solidification rate
of colony spacing and lamellar spacing as well. A plot between
interlamellar spacing and the square root of freezing rate is
shown in Figure 48A(Table VIII). Interlamellar spacing increases
38
with square root of freezing rate but the variation is not
exactly linear as predicted by Tillerl1 , especially at slower
freezing rates.
The boundaries of the colonies are arranged in a
direction parallel to the direction of heat extraction, but
the lamella apparantly does not seem to be aligned in any
particular direction (Figures 45 and 48) . Moreover, lamella
within a colony appears to differ in spacing and growth
direction. Figures 50 and 51 elaborate these facts; in
addition, show that in certain colonies the lamella have a
tendency to bend about a certain axis. This tendency may'be a
primary stage in formation of continuous CuAl2 platelet along
the length of the colony (Figure _) observed in slow cooled
eutectics.
The lamellar arrangement in two colonies in Figure 50
seems to support the overlapping mechanism of eutectic growth
14proposed by Tiller1 . Figure 50 also shows some of the defects
16in lamellar structure discussed by Craft and Albright1. one
can clearly note the splitting up of one lamella into two at
some places; at others, the lamella are discontinuous. It

39
might be mentioned that Figure 44 shows transverse banding effect
even at very rapid freezing rates, hence, it is a defect asso-
ciated not only with slow freezing rates 16 as suggested before.
One can easily note in these pictures that colonies
appear to be separated by an envelope of L phase from each other.
The CuAl2 lamella become coarse at the colony boundaries and
are separated by a layer of ot phase from the lamella of another
colony. All the above unusual observations cannot be attributed
as sectioning effects, as proposed elsewherel3 , and need an
investigation in the light of present concepts of eutectic
crystallization.
The occurance of colonies perpendicular to interface in
the arc deposits seems to comply with the theory of colony
formation proposed by Weart and Mackl5. The tendency of
lamella to arrange themselves into colonies at a small distance
away from the interface is because initially they grow with a
plane front but quite soon the impurities accumulated and cause
formation of cellular interface giving rise to colonies. The
fact, that colony spacing obeys remarkably well the theory pro-
posed the dendrite spacing, is also an indirect support because

40
basically the cell formation and dendrite formation are similar
phenomenon, only different in degree.
However, the existence of lamellar eutectic (Figures 40
and AJ) in classical dendritic form with side branches cannot
be explained simply on a basis of formation of cellular inter-
face. Instead it appears that solidification front breaks
down in the form of dendrites which later on developed side
branches. The theory of cell formation is inadequate to explain
the occurance of large amount of irregular eutectic in between
these dendrite-like particles (Figure 43). Therefore, it
appears that eutectic grows in dendritic form like primary
phase of any other alloy complying to the heat extraction
requirements and the interdendritic liquid, which is also of
the eutectic composition, freezes later giving rise to an
irregular coarse eutectic.
Coming to the cause of dendritic breakdown of the
solidification front, it could be any foreign impurity
rejected by both eutectic phases. A similar proposal is made
for colony formation1 5 , also the absence of colonies in eutectic
made from zone refined material30 offers a strong support to the

41
viewpoint. However the presence of J, envelopes around CuAl2
dendrites of 38 percent copper alloy; the presence of o.
enveloped around the eutectic colonies gave rise to the sus-
picion that probably it is the o( phase which deposits from
the liquid during solidification, and the 0 phase precipitates
from this supersaturated oC in such a manner so as to give rise
to a eutectic type structure. It was thought that the rejec-
tion of copper due to the formation of this supersaturated
lead to the breakdown of solidification front giving rise to
dendrite shaped particles of eutectic.
The electron probe results, that the d envelopes
around 9 particles in 38 percent copper alloy plates (Figures
38 and 39) contain 9 percent copper, seem to support this
model. The interdendritic eutectic liquid in 38 percent alloys
pobably froze with supersaturated a( at the solidification
front which constitutes these envelopes. A slow cooled plaster
cast of 38 percent alloy showed very large envelopes of o
phase with almost no eutectic in between (Figure 52). However,
the slow cooled eutectic alloys did not show large envelopes
of dc around the eutectic dendrites, but coarse eutectic with
irregular particles instead (Figure 54).
42
Solidification of 33 percent alloys in a flowing stream
was studied in order to examine the above proposed mechanism.
It was expected that if supersaturated J( separates out from
this liquid, then the liquid adjacent to the solidification
front which is swept out by the flowing stream should have a
higher copper content. Also, it was expected that a continuous
supply of 33 percent liquid at the front would let this
mechanism operate continuously and resultant structure might
give a good support for the proposal. The results of the
chemical analysis of this experiment for all the alloys are
presented in Table IX. The variation in chemical composition
is quite haphazard probably because of turbulence during the
pours and also the overlapping of one solid layer over another.
The composition of the 33 percent liquid seems to decrease
instead of expected increase on pouring.
A vertical section along the pour direction (Figure .2)
shows some primary dendrites and eutectic colonies. The
eutectic colonies appear to grow upstream like dendrites and
columnar31 grains in other alloys. This indicates that colonies
definitely grow with rejection of some species and preferrential
growth occurs in the direction where these are removed

43
continuously. An indirect outcome of this experiment was the
comparison of fluidity of the three alloys. The fluidity varied
inversely with the freezing range, the 33 percent alloy was
most fluid and 24 percent the least as predicted elsewhere3 2
Considering the mechanism proposed in this work for the
solidification of eutectics, these experimental observations do
not offer a very strong support to it. It has been indicated
in the theory section that continued operation of this
mechanism will result in a tremendous build up of copper con-
centration in liquid and also necessitate a large amount of
in the final structure. Therefore, it appears that this
mechanism if at all operates, does so in the initial stages of
freezing and then gives way to a different mechanism in the
later stages. This could be the reason why we do not get
large envelopes of OCaround slow cooled eutectic colonies
(Figure 54).
Figure 54, a section from the plaster cast eutectic,
shows another interesting feature that the eutectic colony
running across has a long plate of 0 near its axis all along
its length, to which are attached all other lamella of * and
CuAl2 . No such observation has been reported before in
i

44
literature, to the authors knowledge, in an aluminum-copper
eutectic structure. Figure 55, a view of the same colony at
a higher magnification shows a discontinuity in the main stem
and also slight thinning of side lamella at the point where
they are attached to this main plate. Interdendritic eutectic
in the slow cooled plaster cast ingots of 24 percent and 38
percent alloys also showed similar eutectic structure (Figures
56, 57, and 58). No such structure was observed in the faster
frozen samples of either of these alloys.
It is obvious that this structure is not produced by
simultaneous growth of nuclei of the two phases placed side by
side. It appears that at slower freezing rates the eutectic
grew as a anamalous eutectic and the nucleation and growth of
the two phases was not so well coupled. The long platelet of
9 phase probably grew without nucleating any o(. Only when
the 0 side branches started forming the supersaturation rose
high enough for nucleation of C phase and then the coupled
growth resulted in lamellar structure.
A careful examination of Figure 52, in the light of
this mechanism appears to lead to an explanation of envelopes

45
of around 9 phase. The picture shows very little amount of
CuAl2 present as long plates in between thick CuAl2 dendrites.
It appears that after the formation of primary CuAl2 dendrites,
the interdendritic eutectic liquid started freezing by deposi-
tion of 9 on the ptimary dendrites themselves. This divorcement
of the eutectic caused a depletion of adjacent liquid in copper
and brought its composition nearer to QC . But before the
process could be completed, nucleation of CuA12 occurred in the
liquid away from the dendrites. This CuA12 could lead to the
formation of a very small amount of eutectic as the surrounding
liquid was already depleted in copper, hence, giving rise to an
envelope of cA around primary 9 particles.
Similar mechanism appears to be responsible for the
continuous boundary of CuAl2 around 0- particles of 24 percent
alloy (Figure 58). However, in this case the envelope of 9
is very thin, whereas it should have been larger from the
considerations of composition difference.

46
VI. CONCLUSIONS
1. The dendrite spacing varies linearly with square root of
freezing time even at very high solute concentrations,
irrespective of the fact whether solute is rejected or
consumed at the solidifying interface. The above behaviour
is in accordance with the theory developed for growth of rod
shaped dendrites.
2. Theorectical considerations show that solidification of a
dendrite is effected by the presence of neighboring dendrites
at very early stages of solidification process, but only after
the primary dendrite spacing is established.
3. The tendency of side branching increases with the solute
content, and its morphology cannot be predicted on purely
crystallographic considerations. With increasing freezing rate
the side branches appear to form along axie with larger fold
symmetry (i.e., their number increases). However, the length
of side branches decreases with increased freezing rates, and
in low solute alloys these may completely vanish at very high
freezing rates.
4. The increase of dendrite spacing with solute content if
probably due to increase in super cooling of the liquid with
the amount of solute to be rejected.

47
5. The lamellar eutectic between Al and CuAl2 arranges itself in
typical dendritic form with side branches indicating that
during eutectic solidification the plane front actually breaks
down into dendritic protrusions. The colony spacing varies in
the same fashion with the freezing rate as the dendrite spacing.
The eutectic present between these colonies is coarse and
irregular, and appears to form by a different mechanism.
6. The formation of eutectic colonies appears to be accompanied
by rejection of certain species and they grow preferably in
the direction where there is continuous supply of fresh liquid.
7. The presence of envelope of A phase around eutectic colonies
and CuAl2 dendrites leads to the suspicion that probably during
eutectic solidification only one phase deposits in a super-
saturated form and the second precipitates from this. This
seemed to offer an identification of species rejected during
the colony growth (if supersaturated o( separates, copper will
be continuously rejected), and also an explanation of close
similarity between colonies and dendrites.
8. Both the theoretical arguements and experimental observations
indicate that this mechanism probably operates only in the
very early stages of solidification and gives way to some
other mode during later stages of growth.

48
9. The 4. - CuAl2 eutectic behaves somewhat like a anamalous
eutectic at slow growth rates, having a long platelet of
CuAl2 along the length of the colony with lamellar eutectic
on both sides of it. It appears that simultaneous growth
of the two phases occurred only after a dendrite of CuAl2
had formed.
10. The presence of oC envelope around CuAl2 dendrites appears
to be an outcome of eutectic divorcement.
11. The properties and mode of occurence of dendritic particles
in an alloy can radically effect the macroscopic properties
of a casting even if the interdendritic liquid remains the
same.
12. Fluidity of aluminum-copper alloys varies inversely with
the freezing range.

49
VII. SUGGESTIONS FOR FURTHER WORK
1. More systematic investigations should be performed to
determine the dependence of dendrite spacing on solute
content and the freezing range. Suitable systems should
be selected which clearly bring about the difference in
the role of these two parameters.
2. Direct experimental observations on supercooling in alloys
are necessary to establish its dependence on solute content
indicated by the present work. Also nucleation theories
should be developed to explain this relationship.
3. Crystallography of side branching in dendrites needs investi-
gation and its dependence of solute content and freezing rate
appears to be an important aspect of dendritic growth.
Studies of CuAl2 dendrites should be continued because it
appears to be an interesting system due to its regularity and
unique side branching characteristics.
4. Mathematical theories taking into account interactions of
initial dendrites should be developed to predict at what
stage of solidification side branching occurs, and its
experimental confirmation based on relative thickness of
side branches.

50
5. The present concepts oz eutectic solidification do not appear
to be satisfactory in explahing all the features of the growth
process. Further work with purer materials should be conducted
attempting to interrupt the process at different stages and
examining the characteristics of growth. Direct investigation
of compositions by electron microprobe in different regions
(of eutectic within and in between the colonies) appears to be
a promising tool for understanding the mechanism of solidifi-
cation.
6. The lamella found in eutectic structure show some unusual
characteristics. Further work need be conducted with controlled
solidification conditions using several sections in order the
understand the three dimensional aspects of lamellar growth.
16Electron microscope studies appear to be very helpful in
actually understanding the details of lamellar arrangement
and defect structures there in.
7. The unique structures obtained on slow solidification of
eutectics indicate the important role of cooling rate in
changing the character of a eutectic. Systematic studies
should be conducted to investigate the role of freezing rate
on the mechanism of eutectic formation.
51
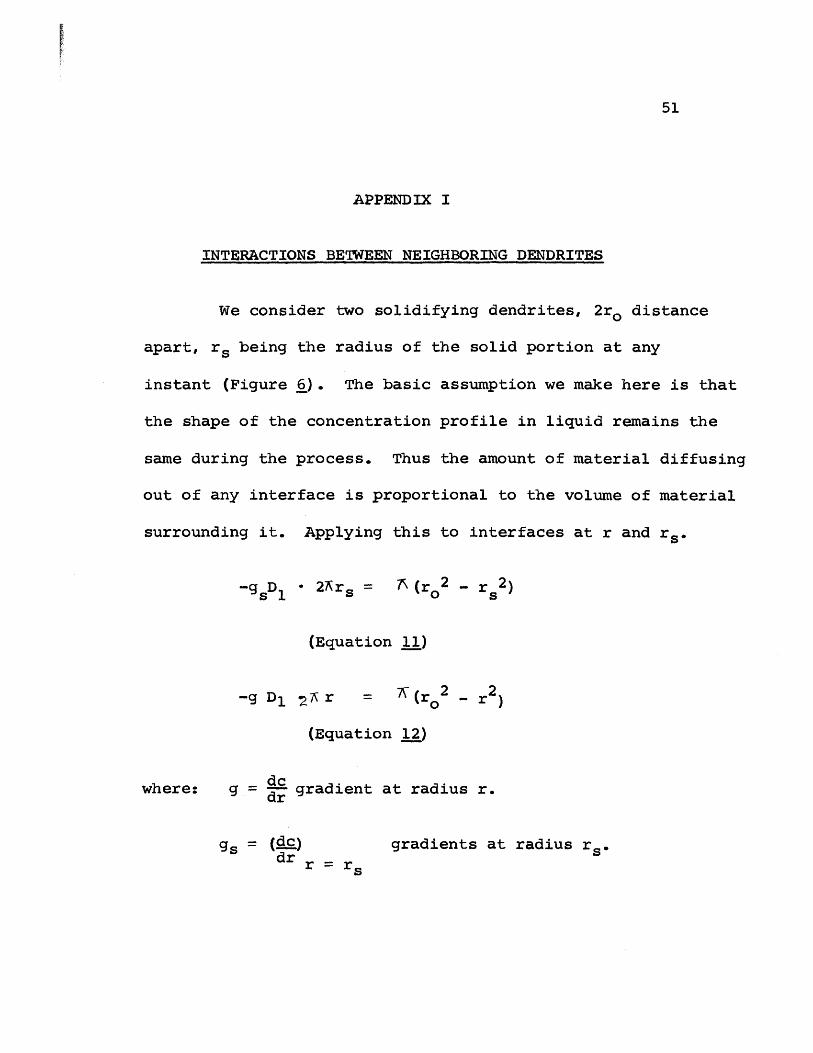
APPENDIX I
INTERACTIONS BETWEEN NEIGHBORING DENDRITES
We consider two solidifying dendrites, 2r0 distance
apart, rs being the radius of the solid portion at any
instant (Figure 6). The basic assumption we make here is that
the shape of the concentration profile in liquid remains the
same during the process. Thus the amount of material diffusing
out of any interface is proportional to the volume of material
surrounding it. Applying this to interfaces at r and r.
- 2Ars = A (r 02 - r s2)
(Equation 11)
-g D1 27 r = 7 (r2
(Equation 12)
where: g = d gradient at radius r.
g = a(dc.)dr r = rs
gradients at radius rs'
-gs 1
- r2

52
From (11) and (12) we get:
(r02 - rs 2) dc = rs2 - r2_____ .dcr 2 -r
rs gs drr
(Equation 13)
This equation on integration leads to the result
Co - CL = s9 s
2ro2
Lro 2rs2)ln 0
(Equation 14)
Taking the material balance across the freezing interface:
dr(1-K) CL d@ 9 Ds
(Equation 15J)
Evaluating drs from the relationship 2 = 2- and~d~ P 4DO
substituting the relation1 9 f = -gs = (Co ) 1/1-Kro 0CL
(where f is fraction of liquid) in equation 15 we get:
2 r 2 1-Kr g = -2(1-K) Crs s r 2-r2
(Equation 16)

53
From equations 14 and 16:
CL - CO = (1-K) C0 L in .( f) - 1
(Equation 17)
Previously we have derived the equation for a dendrite
rejecting solute, in a infinite medium.
2we have taken e = 1
CL - 0 = (1-K) C 0 2 [E(i) as P is a small numberand CO-: CL
(Equation 7A)
Comparing equations 7A and 17 it is obvious that a
dendrite becomes aware of its neighbor at that value of f for
which the functions in square brackets in the two equations
become equal. A calculation using the value of P = 0.05
obtained from Browns7 observations shows that this happens
when the value of f equals0.9984, in other words, quite early
during the process of solidification.

54
APPENDIX II
MATHEMATICAL ANALYSIS OF THE PROPOSED MODEL
OF EUTECTIC SOLIDIFICATION
Figure 10 represents the model of eutectic growth in
which only d( phase is shown to be in contact with the liquid
and (<{ + o ) - o( interface is shown following the o+ L
interface. The solid lines represent the actual concentration
gradients (assumed to be error function curves for convenience)
in the solid and liquid and the dotted lines represent the
extrapalations of these gradients. The solutions of the error
20function concentrations gradients are given by following
equations.
In Liquid: C" = eytf X
Cr;s-e 2)B79
(Equation 18)
In Solid: C -C's ejf XC' e-C's 2)S
(Equation 19J
where: C = Concentration at distance X and time (9).
C"s = Intersection of concentration gradient curve inliquid at X = o.
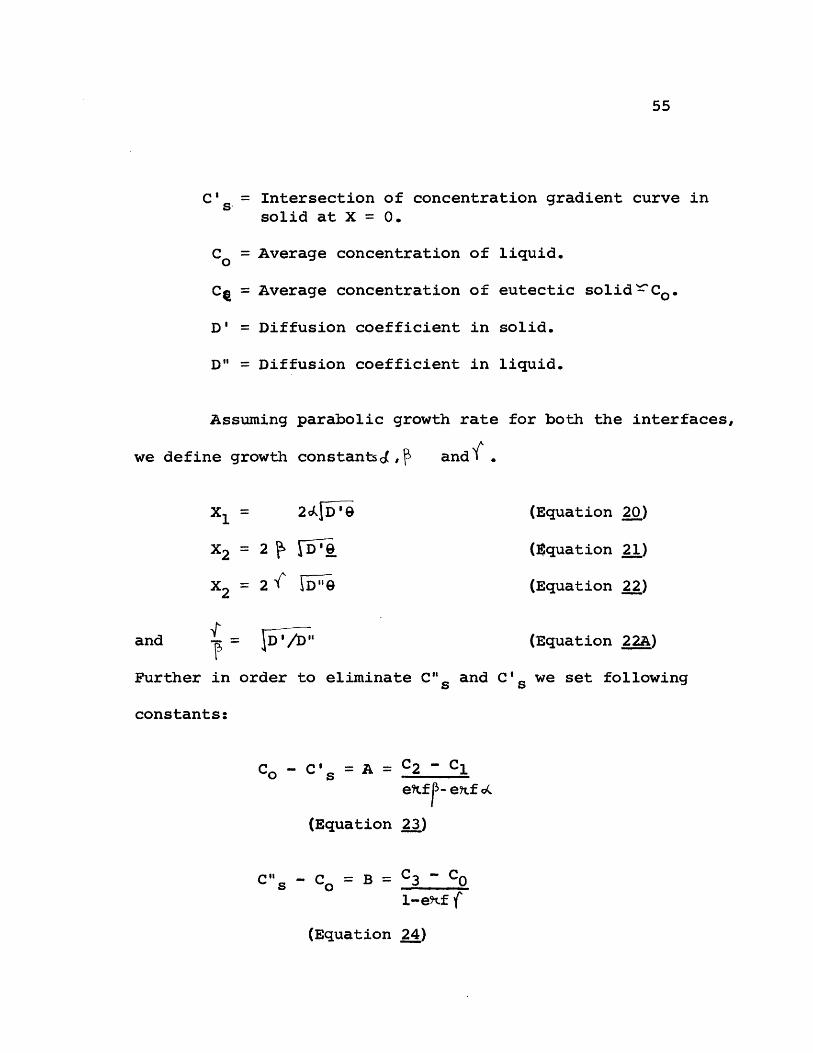
C' ,= Intersection of concentration gradient curve insolid at X = 0.
C = Average concentration of liquid.
Cq = Average concentration of eutectic solid'LC o .
D' = Diffusion coefficient in solid.
D" = Diffusion coefficient in liquid.
Assuming
we define growth
Xl =
X2 2
X2 2 2
parabolic growth rate for both the interfaces,
constantsj , and( .
2 4
_9 Q
(Equation 20)
(Zquation 21)
(Equation j2)
and (Equation 22)
Further in order to eliminate C"s and C's we set following
constants:
Co -C s = A = C2 Cl
ertf -exf o
(Equation 23)
C" - C 0 = B = C3 -CO1-etf f
(Equation 24)
55

56
Also we can write concentration gradients at the
interfaces both in liquid and solid:
-_ 2
(ac =Ae
(Equation 2,5)
2
(ac.) =Aex X2 17\ D"O
(Equation 2.6)
J2(2.) - e~
X2 IRD"9
(Equation _27)
In the above equations on the left hand side first
subscript refers to the phase the second to the interface.
Applying the first boundary condition that movement
of interface I is governed by diffusion of copper to it:
(C0 1 1/d* 2
(Equation 22.8)
substituting the value of gradients from previous equations:

57
C 2 - C(C - C L) JN C =2 .CI(Ce C c'e (e ff [-erfo()
(Equation 29)
Applying the second boundary condition that movement
of II is governed by diffusion both in liquid and in solid:
(C3 - C2) dx2/d@ = D' (2 ) X D l' 1 2
(Equation 30)
substitution from previous equations leads to following
results:
C 2 - Cl C - C(C 22 1+ 3 0
( e (erf f - erfo() fef 2 (1-erf 1)
(Equation 31)
Equations 29 and 31 were solved by trial and error
0
for and taking the value of r as 10 and undercooling .10C.
The values of r and O were found to be quite small (J3 = 4.9
x 10-2 and c = 4-. x 10-2 ), indicating that the rate of growth
of such a front is very small. This implies that for a
required growth rate a large number of such fronts would be
needed and their number would increase with increased rate of
heat extraction.

VIII. TABLES AND ILLUSTRATIONS
TABLE I
COMPOSITION OF ALUMINUM USED FOR ALLOY PREPARATION
Element Aluminum Silicon Iron Zinc
Percent 99.72 0.12 0.14 0.02
58

TABLE II
CALCULATIONS OF SOLIDIFICATION PARAMETER
Voltage -
Current -
10 Volts
350 Amps.
Power 350 x 10 Watts
- 350 x 10 x .0569 B*T.U./min.Watts
- 350 x 10 x .0569 x 60 B.T.U.hour
- 11900 B.T.U.hour
Speed of Arc Parameter Parameter
High Scale Inches Feet per q/v vNo. Setting per min. minute
1 150 91.5 457.5 26 5.10
2 140 83.5 417.5 28.4 5.35
3 130 76.0 380.0 31.4 5.60
4 120 68.0 340.0 35.0 5.92
5 110 60.0 300.0 39.6 6.30
6 100 52.25 262.25 45.20 6.73
7 90 44.50 222.50 53.40 7.30
8 80 36.50 182.50 65.10 8.09
9 70 28.00 160.00 74.40 8.60
10 60 21.00 105.00 113.00 10.60
11 50 13.00 65.00 183.00 13.50
12 40 5.00 25.00 475.00 21.80
I
59

TABLE III
VARIATION OF DENDRITE SPACING WITH SOLIDIFICATIONPARAMETER FOR 24% COPPER ALLOY
r Dendrite SpacingNo. Solidification Parameter v in Microns
1 5.10 10.42 5.35 11.03 5.60 12.104 5.92 15.005 6.30 14.526 6.73 14.507 7.30 16.28 8.09 17.499 8.60 18.50
10 10.60 24.6011 13.50 30.0012 21.80 49.00
TABLE IV
VARIATION OF DENDRITE SPACING WITH COPPER CONTENTAT SOLIDIFICATION PARAMETER VALUE sq/v = 10
No. Percentage Copper Dendritic Spacing inMicrons
1 0.98% 4.1* micron2 0.44% 6.8* micron3 24.00% 22.254 38.00% 14.5
* Data from Browns7 Work.
60

TABLE VI
VARIATION OF DENDRITE SPACING WITH SOLIDIFICATION
RATE FOR 2W/# COPPER ALLOY
No. Solidification Parameter v Dendritic Spacing inw4 Microns
1 5.10 7.00
2 5.35 7.25
3 5.60 8.90
4 5.92 8.02
5 6.30 9.98
6 6.73 10.20
7 7.30 10.50
8 8.09 10.80
9 8.60 11.20
10 10.60 15.25
11 13.50 20.00
12 21.80 22.25
61
TABLE V
VARIATION OF GROWTH CONSTANT ( ) WITH COPPER CONTENT
No. Percent Copper Values
1 1 .037
2 4.5 .050
3 24 .153

62
TABLE VII
VARIATION OF COLONY SPACING WITH SOLIDIFICATION RATE INALUMINUM COPPER EUTECTIC ALLOY
No. Solidification Parameter / Colony Spacing inJq/v Microns
1 5.10 6.12 5.35 5.33 5.60 6.04 5.92 6.755 6.30 6.506 6.73 7.37 7.30 7.458 8.09 7.859 8.60 9.70
10 10.60 10.9011 13.50 13.9012 21.80 19.20

63
TABLE VIII
VARIATION OF INTERLAMELLAR SPACING WITH SOLIDIFICATION RATEIN ALUMINUM COPPER EUTECTIC
ALLOY
No. r*/v Interlamellar Spacing x 10'1 Microns
1 5.102 5.35 Unresolvable at 2500X3 5.604 5.925 6.32 3.26 6.73 3.357 7.30 3.58 8.03 3.629 8.60 4.176
10 10.60 4.26811 13.50 4.50012 21.80 5.40

64
64
TABLE IX
RESULTS* OF SOLIDIFICATION STUDIES IN FLOW<ING STREAM
Nominal Composition Average Composition
No. Alloy of Liquid Compositions Along the Length of Frozen Strip Solid of RemainingComposition Poured (12" Intervals) Composition Liquid
I 24
II 33
III 38
24.6824.42
32.6032.63
32.4 + 0.2
38.7538.6738.87
24.25 24.2724.62 24.74
32.49 32.1132.54 32.0632.47 32.64
38.67 38.4339.36 39.0637.18 38.05
24.52 24.19 24.7329.72 23.96 24.36
32.09 32.34 32.4432.11 32.27 31.6132.51 32.16 32.41
39.41 39.17 38.2239.29 38.29 37.97
24.51 24.6624.34 23.81
31.7832.04
36.8437.68 37.74
24.4424.36
32.29432.0632.38
38.8738.4837.61
24.42N.A.
32.6332.4 + 0.2N.A.
38.6738.87
* All Numbers Represent Precentage oF Copper

Figure 1: Schematic Phase diagram for the case Ki repre-senting the concentrations of liquid and solidin equilibrium.
Figure 2: Schematic representation of solute concentrationprofile near a Solid-Liquid interface.
Figure 3: Representationof the relation between actualtemperature gradient and liquidous temperaturecorresponding to solute concentration build upin Figure 2.
65

K. 0
T ACTUAL
4T LIQUIDuS
SUPERCOOLIINe
LIQUID
DISTANCE-+-
(
a
" 0vi
j DEGRE E OF

Figure 4: Solute concentration profile in the liquid sur-rounding a growing rod shaped dendrite.
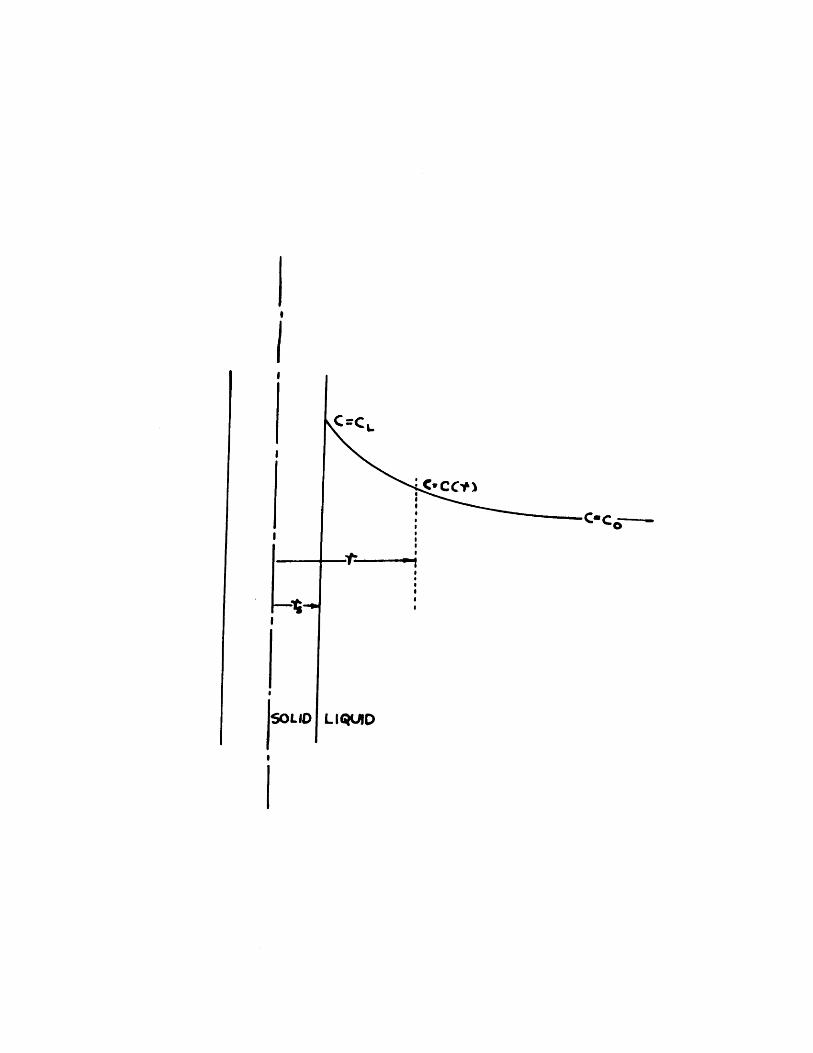
C.CCY)
c-c0----
LIQUID
Figure 5: Relation between growth constant (P ) and super-cooling in liquid for a aluminum-copper alloywith 4.5 percent copper.

0
6
I-
O
z
0 0-05 0-10 $-i5 N-2 0-25 0-30 0-35 0-40 0-45SUPE RCOOLING CAT) IN *C
pop- q" W-

Figure 6: Representation of two neighboring dendritesduring growth process. The sectioned area
represents the solid rod shaped dendriteswhich are surrounded by liquid on all sides.

II

I
Figure 7: Copper rich end of the aluminum-copper phasediagram. Dotted lines represent the extensionsof actual phase boundaries followed in case ofsupercooling.
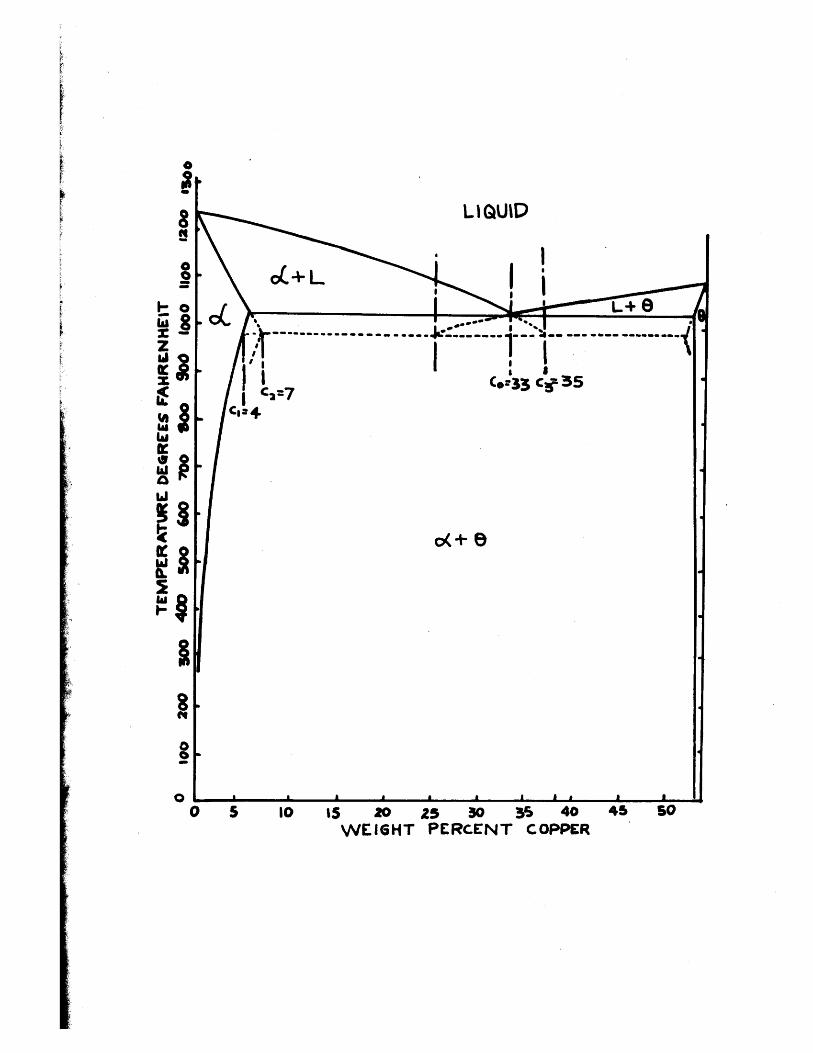
20 25 30 3S 40WEIGHT PERCENT COPPER
0
a
0
1
laI
0a
O

iAf
Figure 9: Shows the overlapping of O phase around 9 lamellabecause of differential growth rates of the inter-faces in Figure 8.
Figure 8:; Representation of the lamella ofo(and CuAl2 placedside by side during eutectic growth. The numbersrepresent the approximate copper concentrationstaken from Figure 7.

C
35
LIQUIDCa33
30
C
LIQUIDCv33A
P

7'
Figure 10: Representation of the proposed model for eutecticgrowth, showing& - d+ interface following theo(-liquid interface. The solid lines represent
the actual concentration gradients in liquid andsolid. The dotted lines are just the extensionsof these concentration profiles.

CS
I.
E U
a
1%Iac., L IGAID C
TECTIC Cc - -
I
c c
C .
--0 acC
-- LI
x~o DISTANCE
zU
LAJ
C0
,CRC5
Avc)
X-L
D15TANCE

I
Figure 11: Diagram of the permanent tungsten electrode inert gas
equipment used to produce arc deposits.
'.4N

I
COOLANT PRESSURE SWITCHAND SOLENOID.
-3 CONTROLBOX
TO CONTACTOR IN POWERSOURCE

73
Figure 12: Schematic diagram showing the position of arcdeposits on the cast plates, also indicatingthe planes along which specimens for metallo-graphic examination were taken.

<C.;%**v

74
Figure 13: Diagram showing the chilling trough used forstudying the solidification behaviour in aflowing stream.

usC
-)

75
Figure 14s Vertical *ection tharough cast plate of 24 percentcopper alloy shaing dendritic nature of theplat*. X50 Steh HMO 3
Figure 15 Vertical section through 24 percent copper alleyplate shaing typical oc dendrites. X50 itch mo3
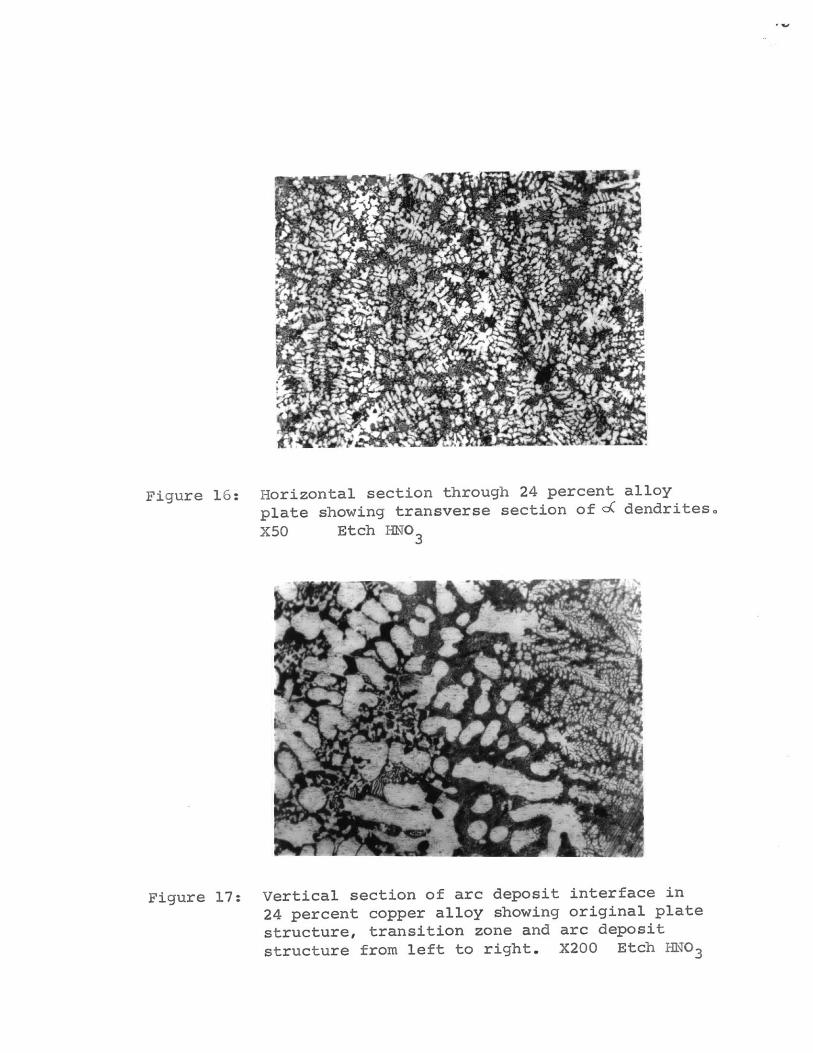
Figure 16: Horizontal section through 24 percent alloyplate showing transverse section of oC dendrites.X50 Etch HNO 3
Figure 17: Vertical section of arc deposit interface in24 percent copper alloy showing original platestructure, transition zone and arc depositstructure from left to right. X200 Etch IO 3

77
Figure 18: Vertical section of arc deposit in 24 percentcopper alloy showing parallel dendrites of 0(nucleated at the interface. X150 Etch HNO 3
Figure 19: Horizontal section of arc deposit far frominterface showing long oC dendrites along the lengthof the weld. X 500 Etch HNO 3

fgureO 20: A tresvenrn ctton acrs an oC dsmdrtte in arcdeselt ef 34 prcmt coppr *I Roy sbnsta th*rwra mwnt of std0 brendws .rwd cntrl ste.
x £500 etedM03
Fiure Ai a ertnal stin throgh sleast tooled arc deposit toA6 percent ppor alloy shiag peel ldondritos of oi.E150 Itch nI

Figure 22: Relationship between dendrite spacing andfreezing rate in 24 percent copper alloy arcdeposits.

U2
w
0z
- FREEZIN. RATE
0 2 4 6 s 10 IZ 14 16 Is 20 22 24
5OLIDIFICATION PARAMETER (j)

8O
Figure 23: Vertical section through arc deposit in 24 percentcopper alloy at Wv = 5 showing finely spaceddendrites. X500 Etch HNO3
Figure 24: Vertical section through arc deposit of 24 percentcopper alloy at I-j/v = 21 showing larger dendritespacing compared to Figure 23. X500 Etch HNO 3

r
Figure 25: Relationship between dendrite spacing and coppercontent in aluminum-copper alloys for freezingrates corresponding to solidification parameter.
Jq*/v - 10.
Figure 26: Diagram showing variation in spacing of icedendrites with KCl content in water at afreezing time of one minute. (Data fromreference 8).
831

PERCENT COPPER
I 2 3 4Y.KM IN V^TER
Sn
U
V
I-0 5 6 7

Figure 27: Vertical section of 38 percent copper alloychilled plate showing parallel dendrites grownperpendicular to chill surface. Fine structure6n the right is section through arc deposit inthe same plate. X 13 Etch HNO3
Figure 28: Horizontal section through 38 percent copper alloychilled cast plate showing three fold symmetryin arrangement of side branches in CuAl2 dendrites.X 50 Etch HNO3

Figure 29: Vertical section near arc deposit interfacein 38 percent copper alloy plate showing ontop original chilled cast plate, the transitionzone and then fine structure in the arc depositedregion. X50 Etch HNO 3
Figure 30: Vertical section of arc deposit in 38 percentcopper alloy showing the arrangement ofattachment of side branches to main stem inCuAl2 dendrites. X 500 Etch HNO 3
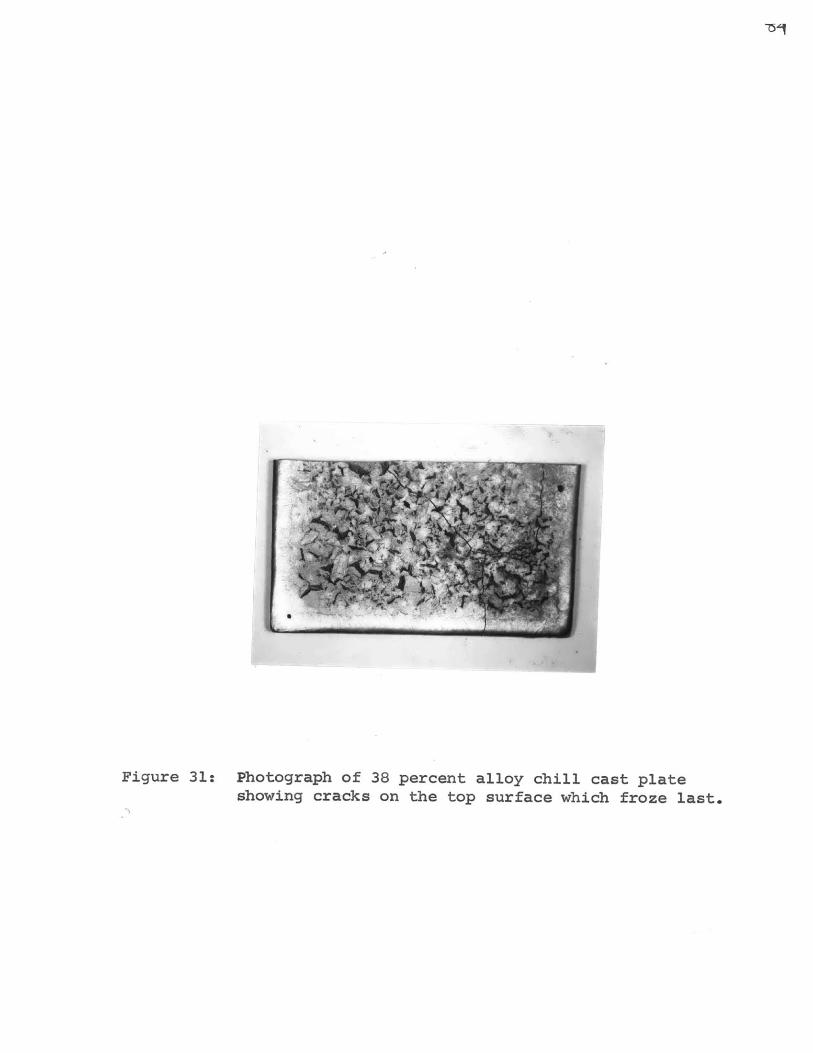
Figure 31: Photograph of 38 percent alloy chill cast plateshowing cracks on the top surface which froze last.

Figure 32: Relationship between CuAl2 dendrite spacing andfreezing rate in 38 percent copper alloy arcdeposits.

8 10 12 14 16 185OLIDIFICATION PARAMETER (Fi)
ILA
zw

Figure 33: A vertical section through arc depositin 38 percent copper alloy at Wv = 5.X 500 Etch HNO3
Figure 34: A vertical section through arc deposit in 38 percentcopper alloy at yv = 20. Note the large dendritespacing compared to Figure 33. X 500 Etch HNO3

SI
Figure 35: Vertical section of a arc deposit in 38 percentcopper alloy showing unusually large secondaryarms. Such arrangement was not commonly observed.X500 Etch HNO 3
Figure 36: Vertical section of a arc deposit in 38 percentcopper alloy showing unusually long dendrites ofCuAl2 running parallel to each other. X 150Etch HNO3

Figure 37: Vertical section through arc deposit of 38percent copper alloy showing envelope ofaround CuAl dendrite. X 50 Etch HNO3
2
Figure 38: Vertical sections through arc deposit of 38& 39 percent copper alloy showing the trace of
electron beam after the electrotb microprobeanalysis. X250 Etch HNO3
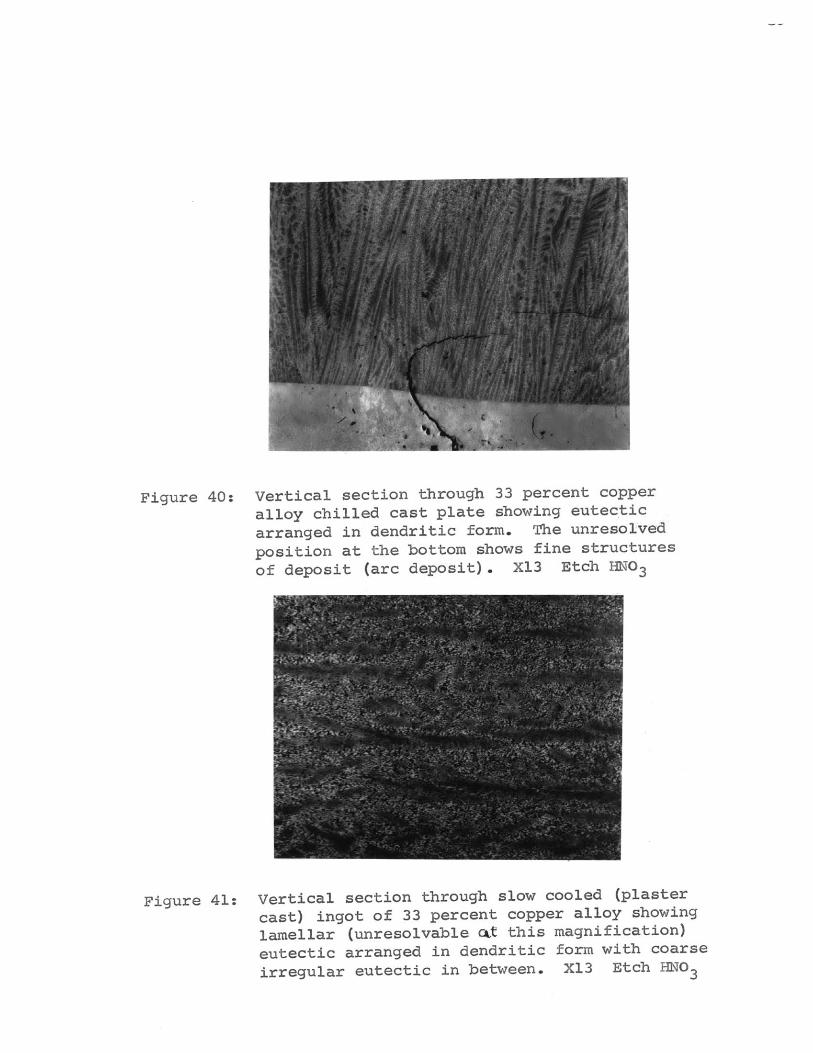
Figure 40: Vertical section through 33 percent copperalloy chilled cast plate showing eutecticarranged in dendritic form. The unresolvedposition at the bottom shows fine structuresof deposit (arc deposit). X13 Etch HNO 3
Figure 41: Vertical section through slow cooled (plastercast) ingot of 33 percent copper alloy showinglamellar (unresolvable cat this magnification)eutectic arranged in dendritic form with coarseirregular eutectic in between. X13 Etch HNO3

Figure 42: Vertical section through 33 percent copper alloychilled cast plate showing eutectic arranged ina fir-tree pattern with coarse eutectic in between.X50 Etch HNO
3
Figure 43: Horizontal section through 33 percent copper alloychill cast plate showing transverse section ofeutectic colonies arranged in dendritic patternin Figure 42. X75 Etch HNO 3

9 I
Figure 44: Vertical section through the base of arc depositin 33 percent copper alloy showing colonies grownperpendicular to the interface. Also note 2
bands running across the picture ( jbv =5).X1000 Etch HNO3
Figure 45: Vertical section near the base of deposit in 33percent copper alloy showing eutectic lamellagrown perpendicular to the interface. X2500Etch HNO3

Figure 46: Variation of colony spacing with freezing ratein 33 percent copper (eutectic) alloy arc deposits.

z0
u o
N . FREEZING R AT E
0 2 4 6 8 10 12 14 is 1SOLIDIFIC AT ION PA RAME TER

93
Figure 47: Vertical section through the base of arc depositof 33 percent copper alloy ( j7-v = 8) showscolonies grown perpendicular to the interface.Note the coarseness of colonies and lamellacompared with those in Figure 44. X1000 Etch HNO 3

In
Figure 48(A) Variation of interlamellar spacing with freezing
rate in 33 percent copper (eutectic) alloy arc
deposits.

8 (0 12 14 16 58 20 22
SOLIDIFICATION PARAMETER (f9v)
2
(A
ac
Lai
(
z

95
Figure 48a Vertical section through arc deposit in 33percent copper alloy showing parallel growncolonies. Some of them appear to have bentlamella. X2000 liN3.3
Figure 49: Vertical section through arc deposit in 33percent copper alloy showing parallel colonieswith a layer of phase between them. Also notethe defects in lamellar structure, one lamellasplitting into two, also discontinuity in ceqttan.lamella. X2500 Etch HM03

Figure 50: Vertical section through arc deposit in 33percent copper alloys showing variation inlamellar structure in parallel colonies. Oneof the colony shows bending of lamella along acertain axis. Two other colonies appear to begrown by a overlapping mechanisml4. X2500Etch HNO3
Figure 51: Vertical section through arc deposit in 33percent alloy shows coarse lamellar arrangementof eutectic in between two colonies. Here alsolamella appear to be bent around a certain axis.X2500. Etch HNO3

T3
Figure 52: Vertical section through directionally slowcooled 38 percent copper alloy ingot showingcoarse dendrites of CuA12 without any sidebranching surrounded by largec( phase envelopes.X50 Etch HNO 3
Figure 53: Vertical section along direction of flow(shown by arrow) of solid strip collectedduring freezing in flowing stream of 33percent copper alloy showing coloniesgrown upstream.

Figure 54: Vertical section through slow cooled (plastercast) ingot of 33 percent alloy showing eutecticcolony with a continuous CuAl2 platelet alongits length with lamella on both sides. Note
coarse eutectic outside the colony. X50Etch HNO-
Figure 55: Shows the colony in Figure 52 at a higher
magnification. Note the discontinuity in the
CuAl2 platelet and also thinning of lamella
at junctions to this plate. X200 Etch HNO3

Figure 56: Vertical section through directionally slowcooled ingot (plaster cast) of 38 percentcopper alloy showing dendrites of CuAl2 witheutectic in between. Note the continuousplatelet of CuAl2 in the eutectic colonies.X50 Etch HNO3
Figure 57: Vertical section through directionally slowcooled ingot of 38 percent copper alloy. Notethe tendency of CuAl2 to arrange itself indendritic form with side branches. Behaviourlike anamolous eutectic appears to be the cause.X40 Etch HNO3

to
Figure 58: Vertical section through directional slowcooled 24 percent copper alloy ingot (plastercast) showing primary oc surrounded by a thinboundary of CuAl2 and interdendritic eutecticwith long continuous CuAl2 platelets.X50 Etch HNO 3

1ol
IX. BIBLIOGRAPHY
1. W. C. Winegard, Metallurgical Reviews, 1961, v. 6, 21, 57.
2. D. D. Saratovkin, Dendritic Crystallization, Consultant Bureau,
Inc., New York, 1959.
3. J. W. Rutter and B. Chalmers, Canad. Jl. of Physics, 1953, 31, 15.
4. F. Weinberg and B. Chalmers, Canadian Ji. Physics, 1951, 29, 370.
5. D. Walton and B. Chalmers, Trans. Met. Society, AIME, 1959, 215, 447
6. G. Haroy and J. W. Cahn, Acta Met., v. 9, 1961, p. 695.
7. P. E. Brown, Sc. D. Thesis, Dept. of Met., MIT, 1960.
8. D. N. French, Sc. D. Thesis, Dept. of Met., MIT, May, 1962.
9. F. L. Brady, J. Institute of Metals, 1922, 28, 369.
10. A. M. Protevin Ibid, 1923, 29, 239.
11. L. M. Hogan, J. of the Australian Institute of Metals, 1961, v. 6,
4, 279.
12. P. S. Vadilo, Growth of Crystals, Moscow Conference, 1956,
Consultants Bureau, Inc., p. 109.
13. Ya. V. Grenchy, Ibid, p. 65.
14. W. A. Tiller, Ligqid Metals and Solidification, ASM, Cleveland,
1958, p. 276.
15. H. W. Weart and D. J. Mack, Trans. Met. Society, AIME, 1961, v. 221
95.
16. R. W. Craft and D. L. Albright, Trans. Metallurgical Society, AIME
February 1961, v. .21, 95-102.
102|
17. H. S. Carlsaw and J. C. Jaegar, Conduction of Heat Through Solids,
Clareudon Press, Oxford, 1959.
18. C. M. Adams, Jr., the Welding Journal, 37, (5), Research Suppl.,
210-S (1958).
19. W. G. Pfann, Liquid Metals and Solidification, ASM, Cleveland,
1958, 218.
20. J. Crank, Mathematics of Diffusion Clarendon Press, Oxford.
21. Keller, Metals Progress, 1944, 46, 806.
22. B. E. Rossi, Welding Engineering, McGraw Hill, New York, 1954.
23. R. Castaing, "Advances in Electronics and Electron Physics", 1960,
v. 8, p. 317, Acedemic Press.
24. D. M. Poole and P. M. Thomas, Jl. Inst. Metals, Feb. 1962, v. 20.,
228.
25. R. F. Palermo, S. B. Thesis, Metallurgy Dept., M.I.T., Jan. 1962.
26. W. Y. Yodelus, J. V. Macewan and J. S. KirkAldy, "Physical
Chemistry of Process Metallurgy", Part II, Interscience Publishers,
1960, 865.
27. R. F. Mehl, The Solidification of Metals and Alloys, AIgE, New York,
1951, 46.
28. J. H. Holloman and D. Turnbull Ibid, p. 1.
29. R. W. Craft, Trans. Met. Soc., AIME, Feb. 1962, v. 224, 65.
30. J. P. Chilton and W. C. Winegard, Jl. Inst. Metals, Jan. 1961, 162.
31. M. C. Flemings, C. M. Adams, E. E. Hucke, and H. F. Taylor,
A.F.S., Trans, 1956, v. 64, 636.

32. D. V. Ragone, C. M. Adams, and H. F. Taylor, Ibid., 653.