Embed Size (px)
Citation preview

IOP Conference Series: Materials Science and Engineering
OPEN ACCESS
Solidification and the δ/γ phase transformation ofsteels in relation to casting defectsTo cite this article: Suk-Chun Moon et al 2012 IOP Conf. Ser.: Mater. Sci. Eng. 27 012061
View the article online for updates and enhancements.
You may also likeAnalysis of the DRT as Evaluation Tool forEIS Data AnalysisMarkus Nohl, Gaurav Raut, StephanieElisabeth Wolf et al.
-
Correct use of Lorentz - Einsteintransformation equations forelectromagnetic fieldsOleg D Jefimenko
-
Research on the Influencing Factors ofManufacturing Transformation andUpgrading Based on Grounded TheoryYang Shuili, Lv Xiang and Yang Yi
-
Recent citationsNumerical Analysis on Crack GenerationBehavior of Hypo Peritectic Steel inContinuous Casting ProcessJun-hyun Jo et al
-
Phase Transformation Modeling for HypoPeritectic Steel in Continuous CoolingJun-hyun Jo and Kyung-woo Yi
-
This content was downloaded from IP address 92.39.44.138 on 11/01/2022 at 12:14
Solidification and the δ/γ phase transformation of steels in relation to casting defects
Suk-Chun Moon1, Rian Dippenaar2 and Sang-Hyeon Lee3 1, 3 POCEM R&DE Project Department, POSCO, Korea 2 Materials Engineering, University of Wollongong, Australia E-mail: [email protected] Abstract. Many advanced steels fall within the peritectic composition range, which are notoriously difficult to cast due to cracking and breakout problems in the continuous casting process especially at high casting speeds. In this study an attempt was made to obtain practical understanding of the solidification and the δ→γ phase transformation of various commercial steels using high-temperature laser-scanning confocal microscopy. Under rapid cooling conditions the transformation morphology showed a massive-type of transition rather than a classical diffusion-controlled transformation.
1. Introduction Kerr [1] suggested that the peritectic phase transition comprises two stages: firstly, the peritectic reaction occurs (Liq+δ→γ), followed by the peritectic phase transformations (δ→γ and Liq→γ). Shibata et al [2] used high-temperature laser-scanning confocal microscopical techniques to provide the first in-situ experimental evidence that the peritectic reaction initiates, and propagates at high speed by the growth of a thin austenite layer along the liquid/δ-ferrite (hereafter L/δ) interface. Once the reaction is completed and the L/δ interface is covered by austenite, the peritectic transformations start. Stefanescu [3] proposed that in practice, this growth of the austenite layer occurs along δ-ferrite dendrites (peritectic reaction), and subsequently the newly formed austenite layer grows into the liquid (normal solidification) and back into δ-ferrite by the δ→γ phase transformation.
Shibata et al [2] found that austenite grew into the liquid, and into the δ-ferrite, respectively, with parabolic growth laws in the case of an Fe-0.42%C alloy, consistent with diffusion-controlled growth. However, an Fe-0.14%C alloy displayed growth kinetics, too rapid to be explained by carbon diffusion control. Phelan et al [4] also indicated that in an Fe-0.18%C alloy, the δ→γ phase transition occurs at rates far higher than can be explained by carbon diffusion models. The mechanism and rate of the δ→γ phase transition in low carbon steel is strongly dependent on the cooling rate. At cooling rates of the order of 5 to 40 K/min, the phase transformation occurs by a normal nucleation and growth process, but at cooling rates in excess of 70 K/min, the transformation rate is very high and occurs by a massive-like transformation [5].
Volume shrinkage accompanies the δ→γ transformation since the body-centred-cubic δ is 2.5-3.0% larger in molar volume than face-centre-cubic γ. Assuming isotropic behaviour, Konishi et al [6] calculated the shrinkage of steel in one dimension from the density changes as a function of temperature employing lattice parameter relationships. A 0.10wt% carbon steel shrinks very rapidly due to the δ→γ phase transformation that occurs within 50 K of the solidification temperature. This temperature range corresponds to the so-called zero-ductility-temperature range where the ductility is
The 3rd International Conference on Advances in Solidification Processes IOP PublishingIOP Conf. Series: Materials Science and Engineering 27 (2011) 012061 doi:10.1088/1757-899X/27/1/012061
Published under licence by IOP Publishing Ltd 1

less than 0.3% [7]. The shrinkage of more than 0.3% due to the phase transformation, might very well lead to crack formation. Murakami et al [8] concluded that surface cracks are most serious in the carbon range 0.1-0.2wt% C.
Significant stresses due to solidification shrinkage and the δ→γ transformation are generated when peritectic steels solidify. Because the shell is very thin at the initial stages of solidification in continuous casting process, these stresses deform the shell and the shell detaches from the mould surface and the heat transfer rate in mould is decreased. Apart from surface cracks that may form due to this problem, breakouts can occur when this abnormally grown shell in the mould cannot support the ferrostatic pressure in the secondary cooling zone.
2. Experiment In the high-temperature laser-scanning confocal microscope observed images are recorded on a computer at a rate of 30 frames per second. Cylindrical specimens with 10 mm diameter and approximately 0.25 mm thick were subjected to a concentric solidification technique developed by Reid et al [9]. Because a radial temperature gradient develops in a specimen situated in the microscope, a liquid pool can be generated in the centre of a specimen while the outer rim remains solid as shown in figure 1. This arrangement provides an elegant way of studying the progression of solidification as well as the subsequent solid-state phase transitions.
A sample is heated until a liquid pool of 6 mm in diameter is formed and then the temperature is kept constant for 3 minutes to stabilize the liquid pool. It is then cooled down using different cooling rates 5, 20, and 50 K/min. Table 1 shows specimen composition analyses of the steels studied. The steels were classified with respect to peritectic transformation by using ThermoCalc software.
Tabel 1. Analyses of specimen compositions (in wt%) Type C Mn Si Al Nb Ti
Low carbon
A 0.050 < 0.01 <0.005 0.016 <0.001 <0.003 B 0.051 0.305 0.016 0.029 0 0 C 0.051 1.507 0.512 0.032 0 0.002
Hypo- peritectic
D 0.080 1.55 0.30 0.025 0.020 0.010 E 0.100 0.50 0.01 0.020 0.001 0
Hyper- peritectic
F 0.182 0.352 0.030 0.023 0.002 0.002 G 0.085 2.820 1.013 0.027 0.020 0.0158 H 0.234 1.621 0.036 0.019 0 0.036 I 0.439 0.693 0.191 0.018 0.001 0.001
3. Results and Discussions
3.1. Progression of the L/δ interface A detailed understanding of the progression of the L/δ interface is fundamentally important since it is the rate at which this initial solidification front progresses that will determine the thickness of the solidifying shell in the meniscus region of a continuous caster.
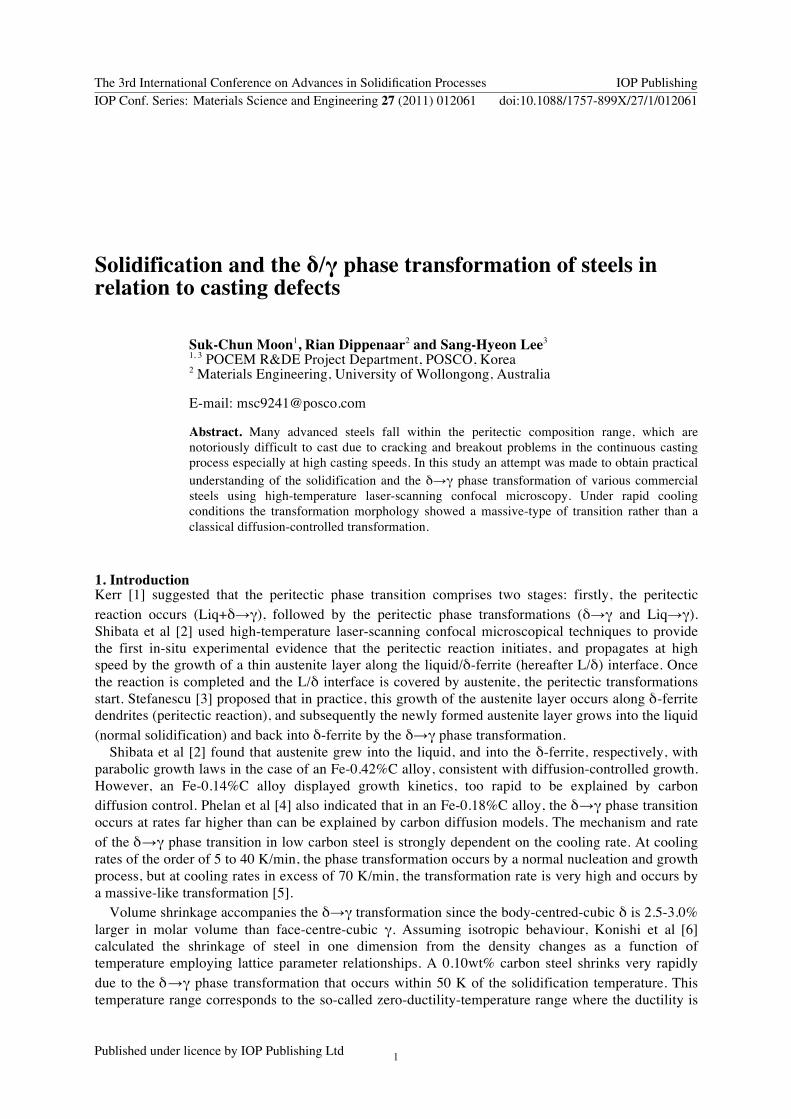
The solidification rate increased in all steel grades as the cooling rate is increased. It is also instructive to evaluate the distance progressed by the L/δ interface per unit temperature drop as shown in figure 2. It follows that the progression of the L/δ interface per unit temperature becomes lower as the cooling rate increases in all the steel grades, and it differs in all steel grades.
For understanding these observations, consider firstly the effect of cooling rate on the initial velocity. The fact that the velocity decreases at an increased cooling rate is possibly due to the fact that more solute elements build up in the liquid ahead of the L/δ interface at increased cooling rates.
Figure 1. Concentric solidification arrangement
10㎜ 6㎜
Temperature profile
Liquid Pool
0.25㎜
The 3rd International Conference on Advances in Solidification Processes IOP PublishingIOP Conf. Series: Materials Science and Engineering 27 (2011) 012061 doi:10.1088/1757-899X/27/1/012061
2
0
20
40
60
80
A B C D E F G H I
0.05C 0.05C-0.3Mn-0.02Si
0.05C-1.5Mn-0.5Si
0.08C-1.6Mn-0.3Si-0.012Ti
0.10C-0.5Mn-0.01Si
0.18C-0.4Mn-0.03Si
0.085C-2.8Mn-1.0Si-0.016Ti
0.23C-1.6Mn-0.04Si
0.44C-0.7Mn-0.2Si
L/δ
inte
rface
mov
emen
t per
uni
t tem
pera
ture
(㎛/℃)
-5℃/min-20℃/min-50℃/min
Not
cle
ar
Not
test
ed
)
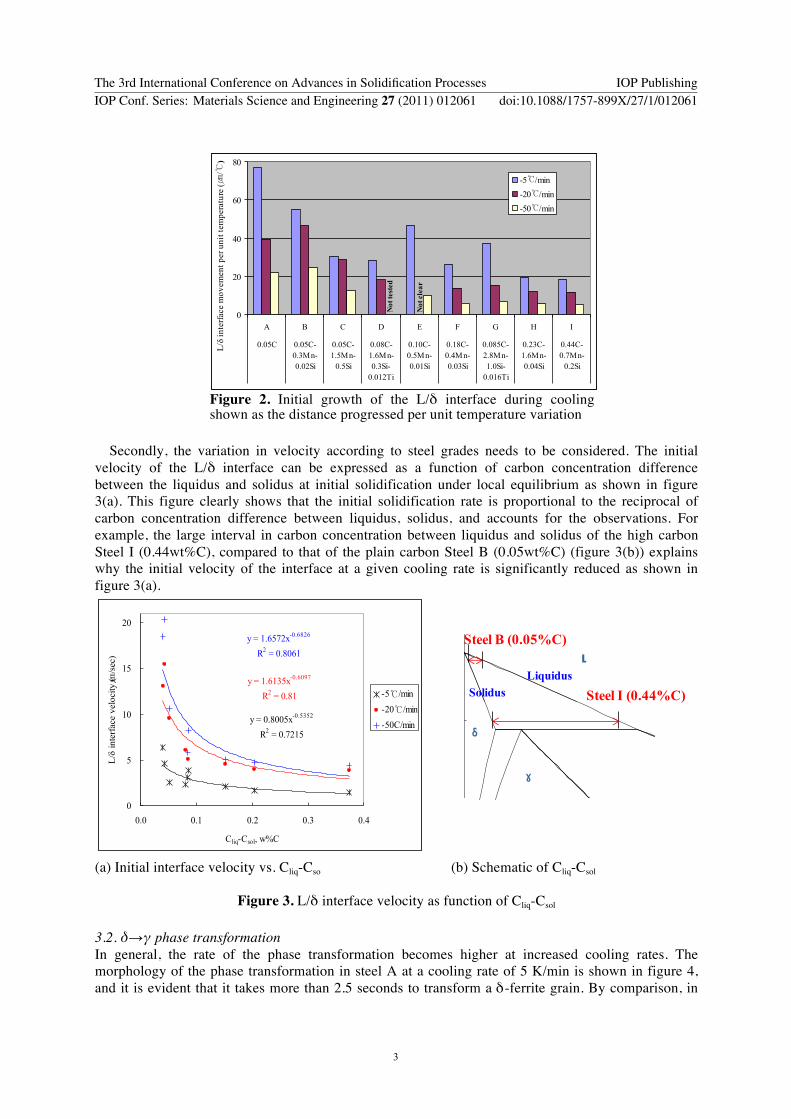
Secondly, the variation in velocity according to steel grades needs to be considered. The initial
velocity of the L/δ interface can be expressed as a function of carbon concentration difference between the liquidus and solidus at initial solidification under local equilibrium as shown in figure 3(a). This figure clearly shows that the initial solidification rate is proportional to the reciprocal of carbon concentration difference between liquidus, solidus, and accounts for the observations. For example, the large interval in carbon concentration between liquidus and solidus of the high carbon Steel I (0.44wt%C), compared to that of the plain carbon Steel B (0.05wt%C) (figure 3(b)) explains why the initial velocity of the interface at a given cooling rate is significantly reduced as shown in figure 3(a).
y = 0.8005x-0.5352
R2 = 0.7215
y = 1.6135x-0.6097
R2 = 0.81
y = 1.6572x-0.6826
R2 = 0.8061
0
5
10
15
20
0.0 0.1 0.2 0.3 0.4
Cliq-Csol, w%C
L/δ
inte
rfac
e ve
loci
ty (㎛
/sec
)
-5℃/min-20℃/min-50C/min
1400
1450
1500
1550
0.0 0.1 0.2 0.3 0.4 0.5 0.6
[C], wt%
Tem
p, ℃
Steel B (0.05%C)
Steel I (0.44%C)Liquidus
Solidus
γ
δ
L
(a) Initial interface velocity vs. Cliq-Cso (b) Schematic of Cliq-Csol
Figure 3. L/δ interface velocity as function of Cliq-Csol 3.2. δ→γ phase transformation In general, the rate of the phase transformation becomes higher at increased cooling rates. The morphology of the phase transformation in steel A at a cooling rate of 5 K/min is shown in figure 4, and it is evident that it takes more than 2.5 seconds to transform a δ-ferrite grain. By comparison, in
Figure 2. Initial growth of the L/δ interface during cooling shown as the distance progressed per unit temperature variation
The 3rd International Conference on Advances in Solidification Processes IOP PublishingIOP Conf. Series: Materials Science and Engineering 27 (2011) 012061 doi:10.1088/1757-899X/27/1/012061
3

the case of steel G and a cooling rate of 20 K/min, the transformation was completed within just 0.07 seconds in the area under observation as shown in figure 5.
In order to establish a relationship between cooling rate and the rate of transformation of δ→γ, frame by frame analysis was conducted of the video recordings and the findings are summarised in figure 6. In interpreting these results, it is important to bear in mind that a very small area is under observation and in some instances the rate of progression of the interface is very high so that a clear pattern has not emerged and, therefore, care has to be taken. However, it is quite evident that at cooling rates 20 K/min and higher, the rate of transformation is very high.
Figure 4. δ→γ transformation of Steel A at 5K/min
Figure 5. δ→γ transformation of Steel G at 20K/min
-
5
10
15
20
25
A B C D E F G
0.05C 0.05C-0.3Mn-0.02Si
0.05C-1.5Mn-0.5Si
0.08C-1.6Mn-0.3Si-0.012Ti
0.10C-0.5Mn-0.01Si
0.18C-0.4Mn-0.03Si
0.085C-2.8Mn-1.0Si-0.016Ti
δ/γ
inte
rface
vel
ocity
(mm
/sec
) -5℃/min-20℃/min-50℃/min
Not
test
ed
Not
clea
r
Not
clea
r
LC Hyper-p.Hypo-p. Figure 6. δ/γ interface velocity of steels with different cooling rates
0.00 sec
γ δ δ L L
δ
γ
0.03 sec 0.07 sec sec
0.0 sec
δ
δ
1.0 sec
γ δ
δ
2.5 sec
δ
γ
The 3rd International Conference on Advances in Solidification Processes IOP PublishingIOP Conf. Series: Materials Science and Engineering 27 (2011) 012061 doi:10.1088/1757-899X/27/1/012061
4

Generally, in the case of cooling rate higher than 20K/min the transformation displayed massive morphology. It is interesting to note that hypo-peritectic steels exhibit relatively very high transformation rates compared to other steels even at low cooling rate of 5 K/min.
A massive phase transformation is often described as a kind of composition-invariant nucleation and growth formation of one solid phase from another solid phase [10]. If, by rapid cooling, the parent phase is brought into the phase field of the new phase, no long-range diffusion is required and the transformation can occur in a composition-invariant fashion. The thermodynamic conditions required for a composition-invariant transformation may even be fulfilled when the parent phase is cooled below T0, the temperature at which the Gibbs free energy is the same for the two phases. Nucleation will not be much affected and nucleation will still primarily occur on grain boundaries, but the growth rate of the new phase will increase dramatically. It is expected that the resulting morphology would form larger, blocky shapes because their growth would not be retarded by the build-up of a composition gradient ahead of the migrating interface.
The direction of transformation in the observed frame positioned as shown in figure 7 is summarized in table 2. The δ→γ transformation usually initiates at the L/δ interface and the growth direction is the same as the heat flow direction. In other words, the austenite nucleates at the L/δ interface, which is hotter than the outer region of the specimen, and will grow from towards low temperature region. In the case of steel B (0.05wt% C), this is also the case at a cooling rate of 50 K/min. However, at a cooling rate of 5°/min, the new austenite phase nucleates somewhere in the outer regions of the specimen and grows towards the centre in the direction opposite to the heat flow. Table 2. Direction of the δ/γ interface movement in the
frame of observation (NC:Not clear)
These interesting and important observations need to be explained. Consider the Fe-C phase diagram, shown in figure 8(a) as well as the geometry of the concentric solidifying specimen, shown
Steel Cooling Grade
Rate Low carbon Hypo-
peritectic Hyper-peritectic A B D E F G H
5K/min ↖ ← ↗ → → NC → 20K/min ↗ ↑ ↗ → → ↗ ↗ 50K/min NC → - - → NC -
Tem
pera
ture
①
②
③
④
ⅰ Position
Temperature profile in sample
ⅰ ⅱ
1400
1450
1500
1550
0.00 0.05 0.10 0.15 0.20 0.25 0.30
[C], wt%
Tem
p,
℃
①
②
③
④
ⅰ ⅱ
T0
ⅲ
L
δ
γ
Figure 7. Observed area of specimen
Observed area
Initial position of L/solid interface
(a) Schematic Fe-C phase diagram for steel B
(b) Schematic of specimen during solidification
(c) Condition of δ→γ transformation of steel
B
Initial position of L/δ interface
Figure 8. Hypothesis for the mechanism of the δ/γ phase transformation pertinent to the concentric solidification specimen
ⅱ
The 3rd International Conference on Advances in Solidification Processes IOP PublishingIOP Conf. Series: Materials Science and Engineering 27 (2011) 012061 doi:10.1088/1757-899X/27/1/012061
5

in figure 8(b) (the position of the original L/δ interface). Upon cooling from the liquid, δ -ferrite of composition i (figure 8(a)) will form at the position ⅰ in figure 8(b). With further cooling the δ-ferrite will grow to point ⅱ in figure 8(b) and the composition will change to ⅱ in figure 8(a) and all the liquid would have transformed. If we assume that there is a temperature gradient in the sample along the line ⅰ-ⅱ (which there is in the course of the experiment) and that the temperature difference between ⅰ and ⅱ is larger than temperature difference between ① and ② (in figure 8(a), the temperature along which the γ-phase will precipitate), the situation shown in figure 8(c) will result.
Position ⅰ is the first place which satisfies the requirement for nucleation of γ phase because it firstly meets with the line ①-② during cooling. As a result, the first γ phase will form at point ⅰ and the δ/γ interface will then move towards the centre of the specimen. Should the cooling rate be too high for γ phase precipitation to occur by diffusional growth, and the temperature of the specimen at position ⅰ is beneath the T0 line, a rapid massive transformation will occur and the transformation front will move from position ⅰ to position ⅱ. In the discussion above, it was assumed that no segregation occurs. However, even if segregation occurs ahead of the L/δ interface, the transformation front will progress from position ⅰ to position ⅱ under slow cooling conditions. In this instance, i.e. when segregation is prevalent, the composition of the last solid to form (point ⅱ in figure 8(a)) moves toward ⅲ so that a liquid pool will still be present when the δ to γ transformation occurs.
This hypothesis cannot be validated as yet because there are many unknown factors such as the temperature gradient of specimen, the extent of solute diffusivity in each phase and the value of the driving forces for each type of transformation.
In this study, it was consistently found that the δ→γ phase transformation occurs by a massive type of morphology, even at cooling rates lower than those reported by Niknafs [5]. If massive transformations occur in a continuous caster, the very thin solidifying shell is likely to detach from the mould due to its high stress, thereby exacerbating the risks of crack formation and in the extreme, breakouts. It is therefore important to consider the theoretical framework as well as practical aspects of a massive phase transformation in the meniscus region of a continuous caster. 4. Conclusions § Significant segregation of elements occurs ahead of the growing L/δ liquid interface and the extent
of segregation increases with increased cooling rate. § At cooling rates in excess of about 20K/min, this δ→γ phase transformation occurs by a massive
(diffusionless) type of reaction. § The implication of this massive type of transformation is that the thin solidifying shell in the
meniscus region of a continuous casting mould can instantly detach from the mould due to the shrinkage as a result of the δ→γ phase transformation, thereby increasing the risk of crack formation and in the extreme, breakouts.
§ It is not only the transformation rate, which decides the extent of thin shell deformation, but also the thickness of shell when the transformation occurs, the fraction of δ-ferrite to transform and the transformation stress.
Acknowledgements The authors wish to thank POSCO for providing the opportunity to conduct this research and University of Wollongong for the provision of laboratory facilities.
References [1] Kerr H W, Cisse J and Bolling C F 1974 Acta Metall. 22 677-686 [2] Shibata H, Arai Y, Suzuki M and Emi T 2000 Metall. and Mat. Trans. B 31B 981-991
The 3rd International Conference on Advances in Solidification Processes IOP PublishingIOP Conf. Series: Materials Science and Engineering 27 (2011) 012061 doi:10.1088/1757-899X/27/1/012061
6

[3] Stefanescu D M 2006 ISIJ International 46(No. 6) 786-794 [4] Phelan D, Reid M and Dippenaar R 2006 Metall. and Mat. Trans. A 37A 985-994 [5] Niknafs S 2007 ME(Res) Thesis-University of Wollongong [6] Konishi J, Militzer M, Brimacombe J K and Samarasekera I V 2002 Metall. And Mat. Trans. B
33B 413-423 [7] V G, vom Ende H 1972 Iron Steel Inst. 210 889-894 [8] Murakami H, Suzuki M and Miyahara S 1990 Proceeding of The 6th International Iron and
Steel Congress, Nagoya, ISIJ 689-696 [9] Reid M, Phelan D, Dippenaar R 2003 ISIJ Int. 44 565 [10] Hillert M 2004 Metall. and Mat. Trans. A 35A 351-352
The 3rd International Conference on Advances in Solidification Processes IOP PublishingIOP Conf. Series: Materials Science and Engineering 27 (2011) 012061 doi:10.1088/1757-899X/27/1/012061
7