Embed Size (px)
Citation preview

JOURNAL OF MATERIALS SCIENCE 33 (1998) 2153 – 2163
Solid particle erosion resistance of ductile wroughtsuperalloys and their weld overlay coatings
B. F. LEVIN, J. N. DUPONT, A. R. MARDERLehigh University, Energy Research Center, Bethlehem, PA 18015, USAE-mail: [email protected]
The elevated temperature (400 °C) erosion behaviour of six weld overlay coatings andwrought alloys of similar compositions, was analysed and the relative ranking of theirerosion resistance has been developed. Microhardness tests performed on eroded samplesshowed that all materials experienced significant plastic deformation. No relationship wasobserved between hardness of the coatings at 400 °C and their erosion resistance. A newtoughness parameter was developed based on the measured area under the microhardnessprofile curve, which represents the ability of a material to absorb impact energy. Thisparameter correlated well with erosion resistance for both weld overlays and wroughtalloys. Also, for the wrought alloys, an increase in area under the true stress—strain curve ortensile toughness, corresponded to an increase in erosion resistance. The physicalsignificance of the toughness parameter is discussed along with relationships betweenhardness, tensile properties and erosion resistance. 1998 Chapman & Hall
1. IntroductionSolid particle erosion (SPE) is a loss of material duringrepetitive impacts of solid particles and is one of theprimary reasons for the damage of power-generationcomponents. Damage associated with SPE costs theutility industry at least $150 million annually in re-duced efficiency of power generation [1]. One methodto combat SPE is to select erosion resistant materialsfor use in components that are subject to an erosiveenvironment. Therefore, the design and proper selec-tion of erosion resistant materials can significantlyreduce the operating cost of power-generationfacilities.
Depending upon its mechanical properties, a mater-ial may erode by different mechanisms or a com-bination of mechanisms. Several researchers [2—4]established that the erosion mechanism for ductilematerials shows certain common features, irrespectiveof the alloy type. In all cases, severe plastic deforma-tion occurs in a localized region surrounding the pointof particle impact. The description of material re-moval for ductile materials in terms of the mechanicalproperties was presented by Bitter [5]. During theimpact, when the yield strength of the material islocally exceeded, plastic deformation takes place inthe vicinity of the impact. After multiple impacts,a plastically deformed surface layer may form near theeroded surface, and therefore, the yield strength of thematerial increases due to strain hardening. Upon fur-ther deformation, the yield strength at the surface ofthe material will eventually become equal to its frac-ture strength and no further plastic deformation willoccur. At this point, the material surface becomesbrittle and its fragments may be removed by the sub-
0022—2461 ( 1998 Chapman & Hall
sequent impacts. Sundararajan and Shewmon [6] sug-gested that erosion of ductile materials can be accom-panied by accommodation of the strain underneaththe eroded surface. When a critical strain is exceededin the deformation volume beneath the surface, mater-ial is detached from the eroded surface by ductilefracture.
Because the mechanical properties of a material area reflection of its composition and microstructure,many attempts have been made to correlate erosionresistance to readily measurable mechanical proper-ties. Some of these properties include hardness, ductil-ity, yield strength, strain-hardening coefficient, andfatigue strength coefficient [7, 8]. For pure metals,some correlation between erosion rate and hardnesshas been shown [9]. However, several other observa-tions have shown that the erosion rate is not depen-dent of material hardness [10—12]. Levy and Jahamir[12] demonstrated that an increase in the hardness ofa plain carbon steel by microstructural modificationscan lead to an increase in the erosion rate. Hutchings[13] emphasized that the effect of hardness on erosionresistance must be considered in relation to theerodent properties and erosion-test conditions.
In an attempt to correlate erosion resistance tovarious mechanical properties, several erosion modelswere developed [7]. Hutchings [14] proposed thatcyclic fatigue is the dominant mechanism of materialremoval during erosion and derived an equation topredict erosion resistance. In this model, the erosionresistance is proportional to H3@2e2
#, where H is the
dynamic hardness of a material and e#
is the criticalstrain to fracture. Other models were proposed tocorrelate erosion resistance to ductility [15], fatigue
2153

strength [8], and yield strength [16]. Although thesemodels showed a reasonable correlation with erosionresistance for different alloys, their major simplifica-tion is a neglect of the work hardening of ductilematerials during particle impacts. However, becauseof work hardening, these materials exhibit a change inmechanical properties within the plastically deformedzone and therefore, modelling of the erosion behav-iour becomes complex. The efforts to model erosionbehaviour of ductile materials without considering theeffect of work hardening do not accurately representthe mechanism of material removal.
Only a few attempts have been made to measure theplastic zone size that forms in ductile materials in thevicinity of the eroded surface [17—20]. It is parti-cularly surprising, because the size of the plasticallydeformed region may represent a measure of energyabsorbed before fracture during erosion. Only oneerosion model [19] accounted for the plastic zone size.Assuming that the plastic zone depth is proportionalto the size of the crater that forms during impact, theresearchers concluded that erosion rate is propor-tional to ¸3 (¸ is the plastic zone depth). However, thismodel contains several parameters that are not readilymeasurable, and therefore its applicability for selec-tion of erosion resistant materials is limited. It was thepurpose of this research to investigate the effect ofmechanical properties on erosion resistance of variousductile alloys and coatings.
2. Experimental procedureSix weld overlay coatings were selected for erosiontesting. Their nominal chemical compositions areshown in Table I. Also, five wrought alloys with com-positions similar to weld overlays (Ultimet, Inconel-625, Hastelloy-C22, 316L SS, and Stellite-6) weretested. A fully automatic welding laboratory was usedfor applying the weld alloys and the plasma transfer-red arc welding (PTAW) process was employed forcoating deposition. All coatings were deposited on1018 carbon steel substrates (30.5 cm]30.5 cm]
TABLE I Nominal chemical composition (wt %) of the selectedalloys
Weld Co Ni Fe Cr C Other
Stellite-6 Bal. 3! 3 28—32 0.9—1.4 3.5—5.5W,1.5Mo, 2Mn
Ultimet Bal. 9 3 26 0.058 2W, 5MoHastelloy-C22 — Bal. 2—6 22—22.5 0.015 2.5—3.5W,
12.5—14.5Mo0.35V
Inconel-625 — Bal. 5 20—23 0.01 3.1—4.15
(Ta#Nb),8—10Mo
Iron—aluminide — — Bal. 2.1 0.023 14.8Al316L SS — 10—14 Bal. 16—18 0.03 2—3Mo,
1.5—2.5Mn
!All the single values are the maximum values.
2154
0.64 cm thick). After deposition, the coatings weresectioned into 1.3 cm]1.3 cm samples for erosiontests. The welding parameters such as voltage, travelspeed, current, and filler metal feed rate were opti-mized in order to provide good fusion between thecoating and substrate. Although coating thicknessesranged from 1.8—4.3 mm, it did not affect relativeerosion ranking of the welds because erosion resist-ance was determined based upon the volume loss ofthe coatings.
The erosion tester used in this study is describedelsewhere [21]. The standard test conditions that werechosen for this study are seen in Table II. It should benoted that, because the erodent size was different forthe wrought and weld alloys, a direct quantitativecomparison between the erosion resistance of thesematerials cannot be made. The sample temperaturewas chosen to be 400 °C, similar to the temperature ofa fireside boiler tube surface. Four or five differenterosion exposure times were used in this study toadequately obtain the weight loss versus time plot foreach material. One sample was used for each erosiontime, and therefore, four or five samples from eachmaterial were used to obtain the weight loss versuserosion time plots, the slopes of which yield thesteady-state erosion rate. To quantify weight loss dur-ing the erosion experiments, the erosion specimenswere ultrasonically cleaned in acetone and weighedbefore and after the erosion tests to the nearest 0.1 mg.The volumetric erosion rates for each alloy were ob-tained by dividing weight loss rate by the density ofthe alloy.
In order to investigate the effect of hardness onerosion resistance at elevated temperature (400 °C),high-temperature microhardness tests were performedon a Nikon Microhardness Tester. The measurementswere obtained on a transverse section of each weldoverlay. Before testing, each sample was mechanicallypolished to a 0.3 lm surface finish. High-temperaturehardness tests were made with a 500 g load usinga Vickers indentor. Measurements were taken at 25 °Cand 400 °C under 1 mPa (10~5 torr) pressure. Averagemicrohardness numbers and standard deviations werecalculated from at least ten indentations.
To determine the size of the deformed region be-neath the eroded surface, microhardness tests wereperformed on a transverse section of each materialafter the longest exposure time (100 or 120 min) at
TABLE II Erosion tests conditions
Eroded sample planar 1.27 cm]1.27 cmdimensionsSample temperature 400 °CErodent particle velocity 40$5 m s~1
Erodent particles flux 8.56 mgmm~2 sImpingement angle 90°Erodent Angular alumina (Al
2O
3)
Erodent size range 300—425 and 300—600 lmfor wrought and weld alloys,respectively
Average diameter of the 350 and 450 lm for wroughterodent and weld alloys, respectively

a 90° particle impact angle. As a result of erosion, thematerial beneath the eroded surface may experienceplastic deformation and the coating hardness mayincrease directly below the surface. A plastic zone sizecan be estimated by obtaining a microhardness profilefrom the eroded surface into the base material. Incontrast to the hot hardness measurements for whichthe Vickers indentor was used, the plastic zone depthmeasurements were performed using a Knoop inden-tor with a test load of 10 g. The Knoop indentorminimizes the specimen edge effect on microhardnessresults, allowing the tests to begin at 10 lm from theeroded surface. The microhardness tests were conduc-ted according to ASTM E 384 standard [22]. Three tofive microhardness profiles were obtained in differentlocations of each material in order to improve thestatistical significance of the data. From these profiles,the size of the plastic zone for each coating was esti-mated.
Tensile tests at 400 °C were performed for Ultimet,Inconel-625, C-22, 316L SS, and Stellite-6 wroughtmaterials to investigate the effect of mechanical prop-erties on erosion resistance at elevated temperature.The true stress—strain curves were obtained from thegenerated load—displacement data by using the con-version equations [23]. It should be noted that themechanical properties of the wrought alloys and weldoverlay coatings are different. However, the effect ofmechanical properties on erosion resistance for thewrought materials should be similar to weld alloysand may yield information which is invaluable forselecting erosion resistant coatings and alloys basedon their known mechanical properties. Tensile testswere performed according to the ASTM E-8 standard[24] at 400 °C in laboratory air. One small-sizesample, 0.6 cm diameter and 2.4 cm gauge length, wastested for each material at the strain rate of 10~3 s~1.
The area under the true stress—strain diagram rep-resents the amount of energy per unit volume a mater-ial can absorb before fracture. This parameter is alsocalled tensile toughness. In order to determine thetensile toughness for each material, the area under thetrue stress—strain diagram was calculated. The tensilebehaviour in the fully plastic region (up to fracturestress) can be approximated by the following powerlaw expression [23]
r"Ken (1)
where K and n are the strength and strain-hardeningcoefficients of the material, respectively. Unfortunate-ly, no simple single equation describes the entirestress—strain behaviour of the material. Therefore, inorder to calculate the area under the stress—straincurve, the best-fit power law expression that describesplastic region and best-fit curve that describes theelastic and transition (elastic—plastic) region werefound for each alloy. Then, these expressions wereintegrated to give the total area under thestress—strain curve or tensile toughness.
The as-welded and wrought samples were cross-sectioned and mounted in cold curing, thermosettingepoxy. Each sample was mechanically polished toa 0.3 lm surface finish and etched. All alloys are com-
mercially available and their microstructures havebeen fully documented elsewhere [25—32]. Therefore,only light optical microscopy (LOM) analysis wasperformed in order to determine any differencesin material microstructures. However, for theiron—aluminide weld overlay coating, electron probemicroanalysis (EPMA) was performed to determinechemical composition across the weld. An EPMAtrace was conducted across the entire overlay thick-ness from the fusion line area to the weld metal surfaceat accelerating voltage of 15 kV and beam current of+20 nA. Raw data were reduced to weight percent-ages using the ZAF algorithm [33].
3. Results and discussion3.1. Microstructural characterizationTypical weld metal microstructures are presented inFig. 1. The nickel base (Hastelloy C-22 and Inconel-625), cobalt base (Stellite-6 and Ultimet) and iron base(316L SS) overlays contain primary dendrites withinterdendritic secondary phases. The interdendriticphases in Inconel-625 are typically NbC and/or Laves,depending mainly on the relative amounts of iron,niobium and carbon in the final overlay deposit[25—27]. In overlay application where the Inconel-625weld metal composition is enriched in iron due todilution from the substrate, Laves is the predominantsecond phase [26]. Stellite-6 typically forms M
7C
3in
the interdendritic regions at the terminal stages ofsolidification [28], whereas Hastelloy C-22 containsmolybdenum-rich intermetallic r, l, and P phases[29]. The 316 stainless steel overlay contains a two-phase ferrite/austenite structure. The starting powderused for deposition of the iron aluminide exhibited thenominal Fe
3Al composition (Table I). However,
microprobe data obtained on the as-deposited overlayrevealed a reduced aluminium content of approxim-ately 9 wt% due to dilution from the substrate. Refer-ence to the Fe—Al binary diagram [30] suggests thiscomposition is a solid solution of a-(Fe,Al). Theiron—aluminide coating microstructure is significantlydifferent from all the other coatings studied and theequiaxed grain morphology with fine precipitates canbe seen from Fig. 1d. Little information is available inthe open literature in microstructural evolution ofwelds in Ultimet [31].
Ultimet, Inconel-625, Hastelloy-C22, and 316L SSwrought alloys were annealed austenitic solid solu-tions and their microstructures were documented else-where [31, 32]. As an example, the microstructure ofthe wrought 316L SS with equiaxed grains is shown inFig. 2. Microstructure of the wrought Stellite-6 alloyconsists of hard carbide particles dispersed in aus-tenitic matrix [32].
3.2. Erosion testsA typical erosion weight loss versus time plots forStellite-6 and Ultimet weld overlay coatings at 90°impact are shown in Fig. 3. For these coatings, erosionreached steady state after approximately 20 and 5 minexposure for Stellite-6 and Ultimet, respectively.
2155

Figure 1 As-welded microstructure of the weld overlay coatings: (a) Inconel-625; (b) Hastelloy-C22; (c) Stellite-6, (d) Iron—Aluminide, (e) 316LSS, and (f ) Ultimet.
The Stellite-6 coating showed a higher steady-stateerosion rate (0.10 mgmin~1) than the Ultimet coating(0.072 mgmin~1). The relative ranking of weld overlaycoatings and wrought alloys based upon their vol-umetric erosion rates at 400 °C are shown in Table III.The weld overlays such as Ultimet, Inconel-625, and316L SS exhibited steady-state erosion rates that arelower than the erosion rates for the remaining coat-ings. Stellite-6 an alloy that is commercially used forabrasion protection, showed a relatively high erosionrate compared with Inconel-625 and 316L SS, coat-ings that are often selected for corrosion protection.
2156
Among the wrought alloys, Inconel-625 and Hastel-loy-C22 offered the best erosion resistance, while Stel-lite-6 showed the worst erosion resistance.
3.3. Plastic deformation and erosionresistance
Microhardness tests were performed to measure thesize of the deformed region beneath the eroded sur-face. It was found that, for both coatings and wroughtalloys, microhardness significantly increases near theeroded surface (Figs 4 and 5, respectively). These

Figure 2 Microstructure of wrought 316L stainless steel showingequiaxed grains (etchant: 60% HNO
3—40% H
2O electrolytic solu-
tion at 4 V).
results show that, for all tested materials, a portion ofthe impacting particles kinetic energy is absorbedthrough plastic deformation with a subsequent in-crease in hardness at the eroded surface. To illustratethe importance of the material to absorb plastic defor-mation, a backscattered electron image of the erodedStellite-6 wrought alloy is shown in Fig. 6. In thiscross-section, it can be seen that the surface carbide(A) showed severe cracking due to the particle im-
TABLE III Volumetric erosion rates for tested weld overlay coat-ings and wrought alloys at 400 °C and 90° impact angle
Weld overlay Erosion ratecoatings/wrought (103 mm3min~1)alloys!
Weld overlay Wrought alloy
Ultimet 8.5$0.3 3.6$0.2Inconel-625 9.4$0.1 2.8$0.1316L SS 10.0$0.4 6.9$0.3Iron—aluminide 11.0$0.4 —Hastelloy-22 11.4$0.7 3.0$0.1Stellite-6 11.9$0.4 8.9$0.2
!Because the erodent size was different for the wrought and weldalloys, a direct quantitative comparison between the erosion resis-tance of weld overlays and wrought alloys cannot be made.
pacts. It can also be seen that a carbide located belowthe eroded surface (B) cracked due to the strain im-posed by the plastically deformed layer. The carbidesbelow the plastically deformed layer (20—25 lm) didnot exhibit cracking. Although hardness determinesthe materials resistance to plastic deformation, nocorrelation was found between the volumetric erosionrates of weld overlay coatings at 400 °C and hardnessat 400 °C (Fig. 7). Furthermore, the Stellite-6 weldoverlay that exhibited the highest hardness alsoshowed the highest erosion rate (0.0119 mm3min~1)among weld overlays. Clearly, the ability of the ductilecoatings to resist plastic deformation did not contrib-ute to erosion resistance. Therefore, hardness is notthe only material property that controls erosion resist-ance. These results show that, for all the studied ma-terials, the erosion involves significant plasticdeformation and, therefore, erosion resistance is con-trolled by the ability to absorb impact energy throughplastic deformation.
Figure 3 Weight loss as a function of time for Stellite-6 and Ultimet weld overlay coatings at 400 °C and 90° angle (Al2O
3erodent).
2157
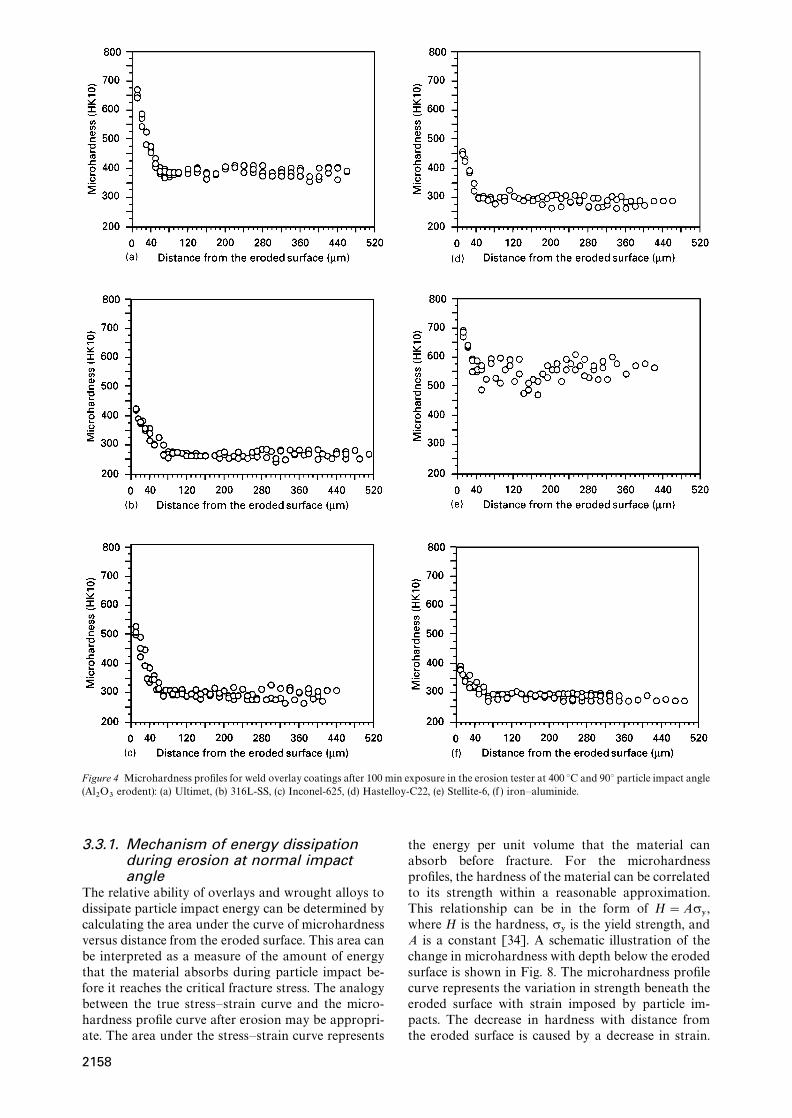
Figure 4 Microhardness profiles for weld overlay coatings after 100 min exposure in the erosion tester at 400 °C and 90° particle impact angle(Al
2O
3erodent): (a) Ultimet, (b) 316L-SS, (c) Inconel-625, (d) Hastelloy-C22, (e) Stellite-6, (f ) iron—aluminide.
3.3.1. Mechanism of energy dissipationduring erosion at normal impactangle
The relative ability of overlays and wrought alloys todissipate particle impact energy can be determined bycalculating the area under the curve of microhardnessversus distance from the eroded surface. This area canbe interpreted as a measure of the amount of energythat the material absorbs during particle impact be-fore it reaches the critical fracture stress. The analogybetween the true stress—strain curve and the micro-hardness profile curve after erosion may be appropri-ate. The area under the stress—strain curve represents
2158
the energy per unit volume that the material canabsorb before fracture. For the microhardnessprofiles, the hardness of the material can be correlatedto its strength within a reasonable approximation.This relationship can be in the form of H"Ar
:,
where H is the hardness, r:is the yield strength, and
A is a constant [34]. A schematic illustration of thechange in microhardness with depth below the erodedsurface is shown in Fig. 8. The microhardness profilecurve represents the variation in strength beneath theeroded surface with strain imposed by particle im-pacts. The decrease in hardness with distance fromthe eroded surface is caused by a decrease in strain.

Figure 5 Microhardness profiles for wrought alloys after 100 minexposure in the erosion tester at 400 °C and 90° particle impactangle (Al
2O
3erodent): (a) Ultimet, (b) 316L-SS, (c) Inconel-625, (d)
Hastelloy-C22, (e) Stellite-6.
A typical microhardness profile curve, with 316Lweld overlay as an example, is presented in Fig. 9 toillustrated the calculation of the area under this pro-file. The data used to determine the average hardnessof the undeformed material was taken from the regionbetween 120 lm and 500 lm depth (line AF in Fig. 9).This region was well below the depth of plastic defor-mation. The standard deviation is given by the solid
Therefore, hardness versus distance from the erodedsurface curve can be qualitatively correlated to thestress—strain curve (see Fig. 8). By analogy with thetrue stress—strain curve, the area under the hard-ness—distance curve may be interpreted as a measureof energy that a material can absorb during erosionbefore it will experience localized fracture and weightloss at the surface. It should be noted that the analogybetween the true stress—strain diagram and the micro-hardness profile is only qualitative because the con-ventional stress—strain diagram is obtained by loadingat low strain rates while microhardness profiles wereobtained after particle impacts that impose high strainrates.
lines. Two lines were drawn that encompassed thedata in the plastic zone region given by BD and CE inFig. 9. These lines envelope the hardness data withinthe plastic zone. The minimum and maximum areasunder the curve were found by calculating areas ABDand ACE, respectively (Area
ABD"0.5]AB]AD and
AreaACE
"0.5]AC]AE). From these data, an aver-age area under the curve was calculated.
3.3.2. Area under the microhardness curveand erosion resistance
The volumetric erosion rates for coatings and wroughtalloys are plotted versus the average area underthe microhardness profile curves in Fig. 10a and b,respectively. It can be seen that, as the area under thecurve increases, the volumetric erosion rate decreases.The ‘‘area under the curve’’ parameter includes the
2159

Figure 6 Backscattered electron image of the cross-section oferoded Stellite-6 wrought alloy (400 °C, 90° impact angle, Al
2O
3erodent).
increase in surface hardness (H463&!#%
!H"6-,
) due toparticle impacts and the distance over which this in-crease occurred (plastic zone size). An increase in sur-face hardness due to erosion represents the material’sability to strain harden, while the plastic zone sizeshows the depth over which strain hardening occurs.For example, materials with a high ability to strainharden — high (H
463&!#%!H
"6-,) — require a higher
applied stress to exceed the critical fracture strengththan materials with a low ability to strain harden— small (H
463&!#%!H
"6-,). However, if this increase in
strength (due to strain hardening) occurs over a smallvolume, fracture will occur fairly easily because defor-mation is localized and fracture strength can be reach-
Figure 7 Effect of hardness at 400 °C on volume erosion rates at400 °C for plastically deformed weld overlay coatings (90° impactangle, Al
2O
3erodent).
2160
Figure 8 A schematic diagram of change in microhardness withdistance from the eroded surface. Correlation between the truestress—strain diagram and microhardness profile is only qualitative.
Figure 9 A typical example of the microhardness profile (316L SSCoating) from which the area under the curve can be determined.AF, average base hardness; OG, minimum plastic zone; OJ, max-imum plastic zone; ABD, minimum area under the curve; ACE,maximum area under the curve; AD, minimum *HK; AE, max-imum *HK.
ed after relatively few impacts. On the other hand, ifthe material has a large plastic zone size but has lowability to strain harden — low (H
463&!#%!H
"6-,) — it will
also fracture after relatively few impacts. In this case,fracture may occur because only a small applied stressis needed to exceed the fracture strength of the mater-ial. To illustrate that a large plastic zone size is nota sufficient requirement for erosion resistance, thevolume erosion rates are plotted versus plastic zonesize in Fig. 11. No correlation can be seen betweenthese two parameters. These measurements showed

Figure 10 Effect of calculated area under the curve of microhard-ness versus distance from the eroded surface on volume erosionrates for (a) weld overlay coatings and (b) wrought alloys (90°impact angle, Al
2O
3erodent).
Figure 11 Effect of the measured plastic zone size on volume ero-sion rates for weld overlay coatings (90° impact angle, Al
2O
3erodent).
that a large plastic zone size does not necessarily leadto a high erosion resistance. The calculated area underthe curve is a better representation of erosion resis-tance because it includes both strain hardening andplastic zone depth. If the energy to fracture increases(‘‘area under the curve’’ increases), erosion resistancealso increases.
It is important to note that the effect of ‘‘area underthe microhardness curve’’ was similar for weld over-lays and wrought alloys, suggesting that this para-meter may be used to explain erosion behaviour ofvarious ductile alloy systems. Although the ‘‘area un-der the microhardness curve’’ showed good correla-tion with erosion resistance, it is not easily measurableand requires post-erosion analysis of the material.Therefore, it is essential to find a mechanical propertyor combination of properties that correlate to the‘‘area under the microhardness curve’’ and representthe energy that a material absorbs during erosion. Byaccomplishing this task, erosion resistant materialscan be selected based upon mechanical properties.
3.3.3. Tensile toughness and erosionresistance
Considering the similarities between true stress—straincurves and microhardness profile curves, tensiletoughness may contribute to the erosion resistance ofductile materials. The tensile toughness values forwrought alloys at 400 °C were determined by integrat-ing the area under true stress—strain curves thatare presented in Fig. 12. The effect of tensile toughnesson the erosion resistance of wrought alloys is shown inFig. 13. It can be seen that alloys with the lowesttensile toughness (Stellite-6) showed the lowest
Figure 12 True stress—strain curves for wrought alloys at 400 °C.
Figure 13 Effect of tensile toughness at 400 °C on volume erosionrates at 400 °C for wrought alloys (90° impact angle, Al
2O
3erodent).
2161

erosion resistance while materials with much highertensile toughness (Ultimet, Inconel-625, and C-22)showed much higher erosion resistance. The equationfor the tensile toughness of the material can be foundby integrating the stress—strain function (Equation 1)from zero to failure strain. Therefore, tensile tough-ness can be described as
¹"K Aen`1f
n#1B (2)
where ¹ is the tensile toughness, n is the strain-hardening coefficient and e
fis the failure strain. This
equation shows that the toughness of a materialrepresents the combined effect of strength, strain-hardening coefficient, and ductility on energy absorp-tion during the deformation process. Therefore,toughness is a better indicator of the behaviour ofa material during erosion than any single propertythat contributes to toughness.
Although a trend of an increase in erosion resis-tance with an increase in tensile toughness wasobserved, the Inconel-625 alloy, that had a lowertoughness than Ultimet and C-22 alloys, showed bet-ter erosion resistance than these alloys. To considerthe validity of the qualitative analogy between truestress—strain curve and microhardness profile curve,the area under the stress—strain diagram is plottedagainst the area under the microhardness curve inFig. 14. It can be seen that a reasonable correlationexists between these two parameters. However, In-conel-625 alloy deviated from this correlation possiblybecause of a strain-rate effect. Hutchings [35] cal-culated that strain rates during erosion range between103 and 107 s~1, while strain rates during quasi-statictensile or compression tests vary between 10~4 and10~1 s~1. Therefore, if the tested materials are strain-rate sensitive the toughness measured from tensiletests might be different from the toughness duringsolid particle erosion. Therefore, at high strain rates,Inconel-625 may have a higher toughness than theother tested alloys. In addition, Inconel-625 alloy hasa higher yield strength than Ultimet and C-22 alloy(630, 450, and 320 MPa, respectively). Therefore,a higher applied stress is needed to cause plastic defor-
Figure 14 Effect of tensile toughness at 400 °C on the calculatedarea under the microhardness curve after erosion at 400 °C forwrought alloys (90° impact angle, Al
2O
3erodent).
2162
mation for this alloy. Thus a combination of (1) highyield strength, to prevent plastic deformation, and (2)tensile toughness, to absorb plastic deformation, isresponsible for the excellent erosion resistance.
4. Conclusions1. The relative ranking of erosion resistance of weld
overlay coatings and wrought alloys at 400 °C hasbeen developed. The Ultimet, Inconel-625, and 316LSS coatings showed considerably lower erosion ratesthan the remaining coatings. Among the wroughtalloys, the Inconel-625 and Hastelloy-C22 alloys ex-hibited the lowest erosion rates.
2. A new toughness parameter, ‘‘area under themicrohardness curve’’, that represents the ability ofa material to absorb impact energy, was developedand correlated well with erosion resistance.
3. For both coatings and wrought alloys, an in-crease in the area under the microhardness profilecurve led to an increase in their erosion resistance.Ductile materials that are able to strain harden — high(H
463&!#%!H
"6-,) — over large distances (large plastic
zone) may have a higher energy to fracture and, there-fore, good erosion resistance. For the wrought alloys,an increase in area under the true stress—strain curveor tensile toughness corresponded to an increase inerosion resistance.
AcknowledgementsThis work was made possible by financial supportfrom the US Department of Energy Under GrantDE-FG22-92PS92542 and Air Products and Chem-icals Inc. The authors also thank Mr A. O. Benscoter,Dr B. Lindsley and Dr B. J. Smith for their help insample preparation and helpful discussions.
References1 L. LAMMARRE, J. EPRI, October/November (1990) 31.2. I. M. HUTCHINGS, R. E . WINTER and J. E. FIELD, Proc.
R. Soc. ¸ond. Ser. A 348 (1976) 379.3. I. M. HUTCHINGS and A. V. LEVY, ¼ear 131 (1981)
105.4. P. VEERABHADRA RAO, S. G. YOUNG and D. H. BUCK-
LEY, ibid. 85 (1983) 223.5. J . G. A. BITTER, ibid. 6 (1963) 5.6. G. SUNDARARAJAN and P. G. SHEWMON, ibid. 84 (1983)
237.7. H. C. MENG and K. C. LUDEMA, ibid. 181–183 (1995)
443.8. R. H. RICHMAN and W. P. McNAUGHTON, ibid. 140
(1990) 63.9. I. FINNIE, J. WOLAK and Y. KABIL, J. Mater. 2 (1967)
682.10. A. V . LEVY, ‘‘Solid Particle Erosion and Erosion-Corrosion
of Metals’’ (ASM International, Materials Park, OH, 1995)p. 43.
11. B. F. LEVIN, J . N. DUPONT and A. R. MARDER, ¼ear181–183 (1995) 810.
12. A. LEVY and D. JAHAMIR, in ‘‘Corrosion-Erosion Behav-iour Of Materials’’, edited by K. Natesan (Metallurgical So-ciety of AIME, New York, 1980) p. 177.
13. I. M. HUTCHINGS, J. Appl. Phys. 25 (1986) A212.14. Idem., ¼ear 70 (1981) 269.15. T. FOLEY and A. V. LEVY, ibid. 91(1) (1983) 45.

16. I. FINNIE, ibid. 3 (1960) 87.17. S. SODERBERG, S. HOGMARK and H. SWAHN, AS¸E
¹rans. 26(2) (1982) 161.18. A. V. REDDY, G. SUNDARARAJAN, R. SIVAKUMAR and
P. RAMA RAO, Acta Metall. 32 (1984) 1305.19. A. V. REDDY and G. SUNDARARAJAN, ¼ear 111 (1986)
313.20. M. RAO and J . R. KEISER, Report. ORN¸/¹M-11946, Pre-
pared for the US Department of Energy, Oak Ridge NationalLaboratory, Oak Ridge, TN, March 1992.
21. B. LINDSLEY, K. STEIN and A. R. MARDER, Meas. Sci.¹echnol. 6 (1995) 1169.
22. ASTM E 384 Standard, Annual Book of ASTM Standards,Vol. 03.01, ‘‘Metals Tests Methods and Analytical Procedures’’(American Society for Testing and Materials, Philadelphia,PA, 1988).
23. W. F. HOSFORD and R. M. CADELL, ‘‘Metal FormingMechanics and Metallurgy’’, (Prentice-Hall, Englewood Cliffs,NJ, 1983) p. 80.
24. ASTM E 8 Standard, Annual Book of ASTM Standards, Vol.03.01, ‘‘Metals Tests Methods and Analytical Procedures’’(American Society for Testing and Materials, Philadelphia,PA, 1988).
25. M. J. CIESLAK, T. J. HEADLEY, T. J. KOLLIE and A. D.
ROMIG Jr, Metall. ¹rans. 19A (1988) 2319.26. J . N. DUPONT, Metall. ¹rans 27A (1996) 3612—3620
27. Q. H. ZHAO, Y. P . GAO, J. H. DEVLETIAN, J. M. Mc-
CARTHY and W. E. WOOD, in ‘‘International Trends inWelding Science and Technology’’, Proceedings of the 3rdInternational Conference, S. A. David and J. M. Vitek (ASM,Materials Park, OH, 1992) p. 339.
28. W. L. SILENCE, ¼ear Mater. Vol. I (1985) 77.29. M. J. CIESLAK, T. J . HEADLEY and A. D. ROMIG Jr,
Metall. ¹rans 17A (1986) 2035.30. ‘‘Alloy Phase Diagrams’’, ASM Handbook, Vol. 3 (American
Society for Metals, Materials Park, OH, 1992) p. 2044.31. S. J . MATHEWS, P. CROOK, L. H. FLASCHE and J. W.
TACKET, ¼eld. J. 70 (1991) 331s.32. ‘‘Metallography and Microstructures’’, ASM Handbook, 9th
Edn, Vol. 9 (American Society for Metals, Materials Park, OH,1985) p. 279.
33. K. F. J . HEINRICH, in ‘‘Microbeam Analysis’’, Proceedingsof the 21st International Conference, edited by A. D. Romig Jrand W. F. Chambers (Albuquerque, New Mexico, 1986)p. 279.
34. D. TABOR, ‘‘The Hardness of Metals’’ (Clarendon Press,Oxford, 1951).
35. I. M. HUTCHINGS, J. Phys. D Appl. Phys. 10 (1977) L179.
Received 22 November 1996and accepted 5 December 1997
2163


![28119167 Corrosion of Superalloys[1]](https://img.dokumen.tips/doc/110x75/577d2ae91a28ab4e1eaa6cd2/28119167-corrosion-of-superalloys1.jpg)