Embed Size (px)
Citation preview

2 0 1 7 R e s u l t s
N e w s R e l e a s e
Page 1 of 17
Solid 2017 earnings
Strong fourth quarter
Revenue: Up 6.7% at constant exchange rates, up 3.1% like-for-like
Robust growth in the United States and e-commerce activities
Adjusted contribution from operations: 18.3% of revenue
Healthy free cash flow generation
Charenton-le-Pont, France (March 1, 2018 – 6:30 am) – The Board of Directors of Essilor International met
on February 28, 2018 to approve the financial statements for 2017. These statements have been audited and
the auditors are in the process of issuing their report.
Financial Highlights
€ millions 2017
Adjusted(f) 2016
Reported % Change
2017 Reported
Revenue 7,490 7,115 +5.3% 7,490
Contribution from operations(b) (% of revenue)
1,367 18.3%
1,321 18.6%
+3.5%
1,361 18.2%
Operating profit 1,248 1,230 +1.5% 1,074
Profit attributable to equity holders (% of revenue)
833 11.1%
813 11.4%
+2.5%
789 10.5%
Earnings per share (in €) 3.85 3.79 +1.6% 3.64
There are two main types of adjustment items. First, expenses associated with the proposed combination with Luxottica, and, second, the positive effects of tax changes in the United States and France. These items are non-recurring adjustments (see page 3).
“Essilor continued its mission to improve vision across the globe in 2017, and delivered another year of
earnings growth. Our ambition to eradicate poor vision drives a development strategy that is supported more
than ever by our powerful innovation capacity, our acquisition model and the quality of our governance, in
which an increasing number of group employees are involved. The momentum created by the rollout of new
products, notably in the fourth quarter, together with the numerous transformative initiatives undertaken in
2017, allow us to look ahead to 2018 with confidence.
Once completed, the combination with Luxottica will open a new chapter for us, allowing us to grow in a way
that benefits consumers and the optical industry” commented Hubert Sagnières, Essilor Chairman and CEO.

2 0 1 7 R e s u l t s
N e w s R e l e a s e
Page 2 of 17
In 2017, Essilor continued to provide an ever-growing number of solutions to respond to unmet visual needs
by pursuing a strategy of expanding its scope of operations in sunwear and online sales.
In prescription lenses, a strategy geared to innovation, consumer marketing, partnerships and new, inclusive
business models led to launches in all price ranges of a variety of products for correcting and protecting
eyesight and preventing visual health risks. Custom services were also developed for a growing number of
eyecare professionals, and the Company continued to expand geographically.
The rollout of Essilor’s portfolio of sunwear brands continued, particularly in China, and the Company boosted
its presence and organization in online retailing.
More importantly, Essilor began writing a new chapter in its history in 2017 with the announcement on January
16 of its proposed combination with Luxottica. Major strides were made during the year toward finalizing the
combination. After shareholders approved the combination at the General Meeting of May 11, 2017, Essilor
completed the hive-down of its activities on November 1, 2017, paving the way for it to become the holding
company at the top of the combined group that will house Essilor and Luxottica. The two companies also filed
notices with antitrust authorities in several jurisdictions, 13 of which have approved the deal unconditionally as
of today.
Highlights of the 2017 fiscal year included:
A sharp acceleration in fourth quarter like-for-like revenue growth at 5.1%;
Good overall performance at the Lenses and Optical Instruments division, primarily reflecting
accelerated growth in the United States in the second half and strong online sales. These positive
trends offset weakness in some countries, particularly Australia and Brazil;
Global rollouts of the new Varilux® X series™ progressive lens, the new Crizal® Sapphire™ 360° anti-
reflective lens and the Eye Protect System™ lens, which sets a new standard for protection against
UV rays and harmful blue-violet light;
Further development of the Sunglasses & Readers division characterized by solid growth in the United
States and the integration of Photosynthesis Group in China;
Robust growth at the Equipment division, driven by positive momentum in the optical industry and the
appetite of many players for new lens manufacturing technologies;
The completion of nine partnerships or acquisitions representing combined full-year revenue of close
to €87 million;
Significant free cash flow generation at €925 million that allowed Essilor to make significant progress
in reducing its net debt.
Dividend
The Board of Directors will recommend that shareholders at the Annual Meeting of April 24, 2018 approve the
payment of a dividend of €1.53 per share, an increase of 2% from 2016. This dividend will be paid as from
April 30, 2018 (ex-date April 26, 2018).

2 0 1 7 R e s u l t s
N e w s R e l e a s e
Page 3 of 17
Outlook
The solid performance in 2017 and the ongoing deployment of growth initiatives enable Essilor to target, in
2018, revenue growth of around 4% like-for-like(a) and a contribution from operations(b) greater than or equal to
18.3%(g) of revenue.
The finalization of the proposed Essilor and Luxottica combination is planned for the first part of 2018 after
obtaining all necessary authorizations.
------------------------------
A conference call in English will be held today at 10:30 a.m. CET.
The meeting will be available live and may also be heard later at:
http://hosting.3sens.com/Essilor/20180301-C40B296B/en/webcast/startup.php
Forthcoming investor events
April 24, 2018: Annual Shareholder’s Meeting at “La Maison de la Mutualité”, Paris, France
April 27, 2018: First-quarter 2018 revenue
Notes
a - Like-for-like growth: Growth at constant scope and exchange rates. See definition provided in Note
2.3 to the consolidated financial statements of the 2016 Registration Document.
b - Contribution from operations: Revenue less cost of sales and operating expenses (research and
development costs, selling and distribution costs and other operating expenses).
c - Bolt-on acquisitions: Local acquisitions or partnerships.
d - Operating cash flow: Net cash from operating activities before working capital requirement.
e - Free cash flow: Net cash from operating activities less purchases of property, plant and equipment and
intangible assets, according to the IFRS consolidated cash flow statement.
f - Adjusted: There are two main types of adjustment items. First, expenses associated with the proposed
combination with Luxottica, and, second, the positive effects of tax changes in the United States and
France. These non-recurring adjustments cover:
- Transaction costs related to the proposed combination with Luxottica for €109 million;
- An additional cost of €45million principally linked to the lifting of performance conditions for two
employee shareholding plans;
- A one-time contribution for €19 million to mission-related programs focused on eradicating poor
vision worldwide;
- A gain from the refund of the 3% dividend tax in France, net of one exceptional tax, for €19 million;
- A one-time gain linked to tax reform passed in the United States in December 2017 for €73 million.
The reported accounts and a reconciliation of the reported accounts to the adjusted accounts are provided
in chapter 1.6.1.
g - Excluding any new strategic acquisition.

2 0 1 7 R e s u l t s
N e w s R e l e a s e
Page 4 of 17
About Essilor
The world's leading ophthalmic optics company, Essilor designs, manufactures and markets a wide range of lenses to
improve and protect eyesight. Its mission is to improve lives by improving sight. To support this mission, Essilor allocates
more than €200 million to research and innovation every year, in a commitment to continuously bring new, more effective
products to market. Its flagship brands are Varilux®, Crizal®, Transitions®, EyezenTM, Xperio®, Foster Grant®, BolonTM and
Costa®. It also develops and markets equipment, instruments and services for eyecare professionals.
Essilor reported consolidated revenue of around €7.5 billion in 2017 and employs approximately 67,000 people worldwide.
It markets its products in more than 100 countries and has 34 plants, 481 prescription laboratories and edging facilities, as
well as 4 research and development centers around the world. For more information, please visit www.essilor.com.
The Essilor share trades on the Euronext Paris market and is included in the Euro Stoxx 50 and CAC 40 indices.
Codes and symbols: ISIN: FR0000121667; Reuters: ESSI.PA; Bloomberg: EI:FP.
CONTACTS
Investor Relations
Véronique Gillet - Sébastien Leroy
Ariel Bauer - Alex Kleban
Tel.: +33 (0)1 49 77 42 16
Corporate Communications
Laura Viscovich
Tel.: +33 (0)1 49 77 45 02
Media Relations
Maïlis Thiercelin
Tel.: +33 (0)1 49 77 45 02

2 0 1 7 R e s u l t s
N e w s R e l e a s e
Page 5 of 17
EXCERPTS FROM THE MANAGEMENT REPORT
BY THE BOARD OF DIRECTORS – FEBRUARY 28, 2018
2017 CONSOLIDATED REVENUE
Revenue
€ millions 2017 2016
Change
(reported)
Change
(like-for-like(a))
Scope
effect
Currency
effect
Lenses and Optical Instruments 6,498 6,218 +4.5% +3.4% +2.4% -1.3%
North America 2,805 2,707 +3.6% +4.1% +1.4% -1.9%
Europe 2,015 1,905 +5.7% +2.4% +4.0% -0.6%
Asia/Pacific/Middle East/Africa 1,192 1,138 +4.7% +5.1% +2.0% -2.3%
Latin America 486 468 +4.0% -0.9% +2.8% +2.0%
Sunglasses & Readers 766 685 +12.0% +0.1% +14.8% -3.0%
Equipment 226 212 +6.4% +5.8% +2.0% -1.4%
TOTAL 7,490 7,115 +5.3% +3.1% +3.6% -1.4%
In 2017, consolidated revenue totaled €7,490 million, an increase of 6.7% excluding currency effects.
On a like-for-like basis(a), sales increased by 3.1%, with momentum picking up between the first half (+2.5%)
and second half (+3.8%).
The consolidation scope effect (+3.6%) reflected contribution from bolt-on acquisitions(c) completed primarily in
2016, but also in 2017.
More than half of the exchange rate effect (negative 1.4%) reflected the US dollar’s depreciation against the
euro during the year. The rest was mostly due to declines in the value of the British pound, Chinese yuan and
Turkish lira, partially offset by the strengthening of the Brazilian real and Russian ruble.

2 0 1 7 R e s u l t s
N e w s R e l e a s e
Page 6 of 17
REVENUE BY OPERATING SEGMENT AND BY REGION
Lenses and Optical Instruments
The Lenses & Optical Instruments division delivered like-for-like growth(a) of 3.4% in 2017 for total sales of
€6,498 million.
North America
Like-for-like growth(a) was 4.1% in North America, which represented an improvement over prior year levels.
Performance was driven primarily by Company initiatives as market conditions remained subdued throughout
the year.
In the United States, the Company’s core lens business gained momentum through the launch of innovative
products and the ongoing deployment of strategic initiatives that allowed for enhanced customer engagement.
In conjunction with the launch of the Varilux® X series™ lens, Essilor introduced in the latter part of the year
the “Ultimate Lens Package”1, a premium solution intended both for progressive and single-vision lens
wearers. It was very well received by independent eyecare professionals and consumers alike. Strategic
initiatives focused on independent eyecare professionals, including alliances (Vision Source, PERC/IVA and
Optiport) and business solutions (Essilor Experts), further boosted performance. Essilor’s key account
business continued to experience strong demand for innovative lens offerings, including blue-light-filtering
technology, as well as integrated supply chain solutions. The Company also benefited from exposure to faster
growing retail groups. Contact lens distribution activities contributed to growth throughout the year.
In Canada, revenue rose slightly.
Europe
Like-for-like(a) revenue growth of 2.4% in Europe was fueled mainly by new products, an effective multi-
network strategy and good results from the instruments and e-commerce activities.
The primary drivers of this growth included the launch during the spring of the new Varilux® X series™
progressive lens, which translated into sustained gains for premium and custom products, as well as strong
volume growth for Transitions® photochromic lenses.
Results were mixed across different countries and distribution channels. Alongside Eastern Europe, Russia
and Scandinavia, Italy was among the countries that saw the strongest growth in the region thanks to a better
product mix with independent opticians. Revenue was flat in Germany, Benelux and France, where the market
was affected by longer optical services reimbursement frequencies. In these countries, distribution networks
like Novacel and Nika were particularly buoyant. Sales in the United Kingdom and Spain were slightly
dampened by a less supportive economic environment.
--------------------------- 1 Varilux® X series™ lenses + Crizal® Sapphire™ 360° UV +Transitions® Signature® VII for progressive wearers
Eyezen™ lenses + Crizal® Sapphire™ 360° UV + Transitions® Signature® VII lenses for single-vision wearers

2 0 1 7 R e s u l t s
N e w s R e l e a s e
Page 7 of 17
Asia/Pacific/Middle East/Africa
In the Asia/Pacific/Middle East/Africa region, like-for-like growth(a) of 5.1% reflected robust domestic sales in
fast-growing markets, partly offset by slower export growth and declining activity in Australia. In China,
domestic sales rose by more than 10% driven by strong growth in mid-range product lines, lenses offering
protection from harmful blue-violet light and Eyezen™ lenses. India delivered more mixed results in its
domestic market, with buoyant sales of progressive and photochromic lenses achieved against a backdrop of
monetary and fiscal upheaval. In Korea, the Company’s commercial initiatives drove sales of progressive
lenses and Transitions® products. Growth in Southeast Asia and Turkey was very strong, while trends in the
Middle East and Africa were more mixed. Japan benefited, quarter after quarter, from an improvement in sales
and product mix with independent opticians and optical chains.
Latin America
Revenue in Latin America was broadly flat in 2017 (-0.9% like-for-like(a)), with a sharp decline in sales in Brazil
cancelling out increases in Spanish-speaking countries in the region.
Due to unfavorable economic conditions in Brazil, the country’s optical industry was hit by sharply lower foot
traffic in optical shops, notably impacting the premium segment. For Essilor, this translated into a decline in
sales of Crizal antireflective lenses and Varilux progressive lenses, though momentum picked up for the latter
in the second half of the year. The repositioning of the Transitions® photochromic lenses with a more
attractive value proposition helped sustain sales volumes and enhanced the brand’s presence. Under these
challenging market conditions, the prescription laboratories saw a small increase in revenue.
Spanish-speaking countries, which now contribute more than half of revenue in the region, continued to post
strong gains despite some setbacks. For instance, steady sales growth in Mexico throughout the first half of
the year was hindered by the impact of natural disasters on local retailers and the Company’s supply chain
starting in September. Growth in Colombia was close to 10%, driven in part by increased sales of value-added
lenses. Argentina delivered the best performance in the region, and Chile and Costa Rica both kept a healthy
dynamic .
Instruments
A part of the Lenses and Optical Instruments division, the Instruments business markets tools for use by
optometrists and opticians. It achieved like-for-like(a) revenue growth of 8.5% in 2017 thanks to strong sales
momentum across all geographies and product lines.
The lens edging-mounting business saw record sales of edgers. The business was boosted by the success of
entry-level and mid-range machines, particularly in fast-growing markets with the Delta 2™ compact edging
station, and by the launch of the new Pro-E™ 600 edger designed for labs managing high volumes, including
online sellers.
Business was very brisk on the optometry side (refraction and diagnostic devices) thanks to new contracts for
diagnostic machine sales to key accounts and the launch of a new diagnostic and refraction instrument, Wave
Analyzer Cornea 700. This new instrument allows opticians to customize optical equipment thanks to

2 0 1 7 R e s u l t s
N e w s R e l e a s e
Page 8 of 17
comprehensive exams of the anterior chamber of the eye (measurement of visual performance by day and
night, symptoms of visual fatigue, glare sensitivity, etc.).
Sales of in-store measurement instruments were also very strong, notably the measurement columns marketed by
French company IVS that enable stores to offer personalized lenses.
E-commerce businesses
Also part of the Lenses and Optical Instruments division, the e-commerce businesses delivered like-for-like
growth(a) of around 13% in 2017. Growth in North America reflected the continued success of the
EyeBuyDirect™ business model for prescription lenses in the United States as well as a rebound in Clearly™
sales during the second half. In Europe, robust sales growth was recorded by Vision Direct™ for contact
lenses and by Glasses Direct™ for prescription glasses. In Scandinavia, the activities of online contact lens
retailers LensOn® (acquired in 2016 with MyOptique Group) and LensWay™ were combined during the year.
The online businesses in Brazil (eÓtica and e-lens), China (Coastal Vision™) and India (Coolwinks™) all
continued to experience rapid growth.
Sunglasses & Readers
The Sunglasses & Readers division saw like-for-like(a) sales growth of 0.1% in 2017.
In North America, revenue ended the year up slightly at FGX International. Sales to consumers measured in
stores trended higher both for readers and sunglasses. FGX also renewed contracts with several major
customers and enjoyed shelf space gains. Lastly, FGX’s international sales were buoyant.
Costa delivered the best performance of the existing Sunwear brands in the American market in 2017. Despite
the toll of the hurricanes that swept through the regions of the United States where the brand is widely sold, a
proactive policy of developing ties with new customers and independent opticians continued to pay off. Costa
also expanded further into the northeast and central part of the country and positioned itself to step up its
growth in California in 2018.
In China, Xiamen Yarui Optical (Bolon™) saw its revenue contract in 2017. The company continued to
implement its strategic action plan during the year to improve its situation and bolster the Bolon™ and
Molsion™ brands. This action plan involves reducing and optimizing inventories at distributors, redefining
terms of sale and leveraging greater insight into consumer purchases from retailers. Additional human
resources were brought on board, and the Company continued to expand its business in ASEAN and on the
internet. Meanwhile, Photosynthesis Group (MJS) delivered good results for its first year as part of the group
and opened 250 new stores, bringing the year-end total to 1,200.
In Turkey, Merve continued to do well with its Ossé™ and Mustang™ brands.
Equipment
Revenue at the Equipment division increased by 5.8% like-for-like(a). This growth was driven primarily by sales
of VFT-Orbit 2™ digital generators and Multi-FLEX™ polishers in Europe, which were buoyed by fresh
investments and upgrades to existing production lines. In Asia, the addition of new production capacity,

2 0 1 7 R e s u l t s
N e w s R e l e a s e
Page 9 of 17
notably in the form of complete laboratories, fueled strong sales of digital surfacing machines, polishers and
coating machines as well as a surge in services business. Gains were recorded in Latin America after several
midsize labs switched to digital surfacing. Sales in the United States were flat for the year, though a sharp
increase in orders for generators and polishers in the last quarter drove up the backlog for the division, which
bodes well for the early months of 2018.
FOURTH-QUARTER 2017 CONSOLIDATED REVENUE
€ millions 2017 2016
Change
(reported)
Change
(like-for-like(a))
Scope
effect
Currency
effect
Lenses and Optical Instruments 1,557 1,549 +0.5% +5.2% +1.2% -5.9%
North America 665 657 +1.2% +8.8% +1.1% -8.7%
Europe 490 480 +2.2% +2.4% +0.5% -0.7%
Asia/Pacific/Middle East/Africa 285 286 -0.6% +4.8% +2.0% -7.4%
Latin America 117 126 -6.8% -2.0% +2.5% -7.3%
Sunglasses & Readers 201 192 +4.8% +3.1% +9.0% -7.4%
Equipment 71 68 +4.1% +9.0% -0.1% -4.9%
TOTAL 1,829 1,809 +1.1% +5.1% +2.0% -6.0%
In the fourth quarter, revenue rose 7.1% excluding currency effects with like-for-like(a) accelerating from the
third quarter, to 5.1%.
Sales were up on a like-for-like basis(a) at all businesses: Lenses and Optical Instruments (+5.2%),
Sunglasses & Readers (+3.1%) and Equipment (+9.0%).
The 2.0% consolidation scope effect reflected contribution from acquisitions completed earlier in the year.
The negative currency impact (-6.0%) mainly resulted from considerable depreciation of the US dollar against
the euro.
By region and division, the period saw:
A sharp acceleration in business growth in the United States, notably fueled by the launch of the
Varilux® X series™ and Crizal® Sapphire™ 360° lenses
Continued momentum in Europe
Good performances in fast-growing countries with the exception of Brazil and India
Recovery at the Sunglasses & Readers division driven by good results at FGX and Costa in the United
States and Photosynthesis Group (MJS) in China
An anticipated rebound at the Equipment division.

2 0 1 7 R e s u l t s
N e w s R e l e a s e
Page 10 of 17
ACQUISITIONS AND PARTNERSHIPS
The Company completed nine transactions in 2017, representing combined full-year revenue of close to €87
million.
Company Country Business Full-year
revenue % held
Consoli-
dated from
Lenses & Optical Instruments – North America
Partners In Vision, Inc. United
States Service platform for eyecare
professionals
N.D.1 100% May 1, 2017
Vision Associates, Inc. United
States N.D. 60% May 1, 2017
Lenses & Optical Instruments – Europe
CFE Optique France
Distributor of optical products
(ophthalmic lenses, frames
and instruments) to opticians
in Central and Western Africa
c.€2.5 million 100% Sept. 1,
2017
Optitrade Logistics
Center (OLC) Netherlands
Distribution platform for
Optitrade, a purchasing
alliance representing some
650 optical stores in the
Netherlands
N.D. 50.2% February 1,
2017
Lenses & Optical Instruments – Asia/Pacific/Middle East/Africa
Sun Optical
Technologies Ethiopia Prescription laboratory €1 million 51%
January 1,
2018
Mangalsons Optics PTE
Ltd India
Distributor of plastic and glass
lenses, sunglasses and
prescription frames
c.460 million
Indian rupees 50%
February 1,
2017
Topcon Visioncare
Japan (TVJ) Japan
Distributor of Topcon’s
optometry line and Essilor’s
lens finishing line to opticians
in Japan
N.D.
Raised
from 10%
to 51%
March 1,
2017
Lenses & Optical Instruments – Latin America
Visolab Produtos
Opticos Ltda Brazil
Prescription laboratory located
in the State of Sergipe
c.22 million
Brazilian real 51%
February 1,
2017
Opticas Exclusivas Guatemala
Integrated prescription
laboratory operating around 50
optical stores
N.D. 70% April 1,
2017
All of the above companies will be fully consolidated by Essilor from the date they are added to the scope of
consolidation.
--------------------------- 1 Not disclosed

2 0 1 7 R e s u l t s
N e w s R e l e a s e
Page 11 of 17
STATEMENT OF INCOME
INCOME STATEMENT, REPORTED/ADJUSTED(f)
€ millions 2017
Adjusted(f) Adjustment
items 2017
Reported 2016
Reported
Revenue 7,490 7,490 7,115
Gross profit 4,346 4,346 4,181
Contribution from operations(b) 1,367 (6) 1,361 1,321
Other income/expenses (119) (168) (287) (91)
Operating profit 1,248 (174) 1,074 1,230
Income tax expense (262) 131 (132) (285)
Net profit
Attributable to equity holders
922 833
(44)
(44)
878
789
880 813
Earnings per share (in €) 3.85 3.64 3.79
(b) Revenue less cost of sales and operating expenses (research and development costs, selling and distribution costs and other
operating expenses).
(f) There are two main types of adjustment items. First, expenses associated with the planned combination
with Luxottica, and, second, the positive effects of tax changes in the United States and France.
These non-recurring adjustments include:
- Transaction costs related to the proposed combination with Luxottica for €109 million;
- An additional cost of €45 million principally linked to the lifting of performance conditions for two
employee shareholding plans;
- A one-time contribution for €19 million to mission-related programs focused on eradicating poor vision
worldwide;
- An exceptional gain from the refund of the 3% dividend tax in France, net of one additional tax, for €19
million;
- A one-time gain linked to tax reform passed in the United States in December 2017 for €73 million.

2 0 1 7 R e s u l t s
N e w s R e l e a s e
Page 12 of 17
CONDENSED ADJUSTED(f) INCOME STATEMENT
€ millions 2017
Adjusted(f) 2016
Reported % change
Revenue 7,490 7,115 +5.3%
Gross profit (% of revenue)
4,346 58.0%
4,181 58.8%
+3.9% --
Operating expenses 2,979 2,860 +4.2%
Contribution from operations(b) (% of revenue)
1,367 18.3%
1,321 18.6%
+3.5% --
Other income and expenses from operations
(119) (91)
Operating profit (% of revenue)
1,248 16.7%
1,230 17.3%
+1.5% --
Finance costs, net (64) (66) --
Income tax expense Effective tax rate
(262) 22.1%
(285) 24.5%
-- --
Net profit Attributable to equity holders (% of revenue)
922 833
11.1%
880 813
11.4%
+4.8% +2.5%
--
Earnings per share (in €) 3.85 3.79 +1.6%
(b) Revenue less cost of sales and operating expenses (research and development costs, selling and distribution costs and other
operating expenses).
ADJUSTED(f) NET PROFIT ATTRIBUTABLE TO EQUITY HOLDERS UP 2.5%
3.9% increase in gross profit
Gross profit (revenue less cost of sales) reached €4,346 million in 2017, or 58.0% of revenue, compared with
58.8% in 2016. Despite the operating efficiency gains achieved, gross margin contracted due to two main
factors: a shift in the mix of distribution channels, notably reflecting the rapid growth of the online activities
where gross margin tends to be below the group average, and a decline in sales of Transitions® lenses to
manufacturers outside the group.
Adjusted(f) operating expenses: up 4.2%
Adjusted(f) operating expenses amounted to €2,979 million, which was 39.8% of revenue versus 40.2% in
2016.

2 0 1 7 R e s u l t s
N e w s R e l e a s e
Page 13 of 17
These charges mainly included:
R&D and engineering costs, which totaled €217 million, up slightly from 2016;
Selling and distribution costs, which rose to €1,845 million from €1,750 million in 2016 mainly because of
sales force expansion.
Adjusted(f) contribution from operations(b): 18.3% of revenue
The adjusted(f) contribution from operations(b) rose 3.5% (of which 2.7% like-for-like(a)) to €1,367 million,
representing 18.3% of revenue, and was slightly down from 2016 (18.6%) due to:
Dilution resulting from bolt-on acquisitions(c);
Significant investments to reinforce the organization in China as well as economic situations, including the
one in Brazil, that offset the positive operating leverage effects.
Adjusted(f) operating profit: up 1.5% to €1,248 million or 16.7% of revenue
“Other income and expenses from operations” represented a net expense of €119 million, up from €91 million
in 2016. The total for 2017 mainly included:
€33 million of restructuring provisions, mainly related to the streamlining of some production sites and the
restructuring of certain trade flows;
€82 million of compensation costs for share-based payments (particularly performance share plans),
which was higher than 2016 because of the Company’s proactive employee share ownership policy;
€17 million of net expense associated with the settlement of litigation ;
A €9 million profit from the sale of certain real estate assets in France.
Finance costs and other financial income and expenses, net
This item came to a net expense of €64 million, compared with €66 million in 2016. The improvement was
attributable to debt reduction in the second half of 2017.
Adjusted(f) net profit up 4.8% to €922 million
Adjusted(f) net profit includes €262 million in income tax expense compared with €285 million in 2016, for an
effective tax rate of 22.1% versus 24.5% in 2016. The reduced rate was mainly due to the continued
application over the full year of the advance pricing agreement (APA) on royalty rates signed between France
and the United States in 2016.
The adjusted(f) net profit attributable to equity holders of Essilor amounted to €833 million, an increase of 2.5%
over the prior year. This included €89 million in non-controlling interests, up from €67 million in 2016. This
increase resulted from the consolidation of Photosynthesis Group beginning January 1, 2017 and from the
contribution of results delivered by the Company’s partners.
Adjusted(f) earnings per share came to €3.85, an increase of 1.6% versus 2016.

2 0 1 7 R e s u l t s
N e w s R e l e a s e
Page 14 of 17
BALANCE SHEET AND CASH FLOW STATEMENT
NET DEBT LOWERED TO 1.7 BILLION EUROS
Capital expenditure and investments
Purchases of property, plant and equipment and intangible assets reached €308 million in 2017, primarily
comprising capital expenditure to support the Company’s growth.
Financial investments amounted to €317 million. This total mainly included acquisitions made during the year
as well as subsequent, ancillary payments on transactions from previous years.
Change in working capital requirement
Working capital requirement rose by €58 million in 2017, consistent with underlying revenue growth.
Operating cash flow(d)
Operating cash flow(d) rose to €1,291 million, driving a 2.8% increase in free cash flow to €925 million. Free
cash flow(e) increased by 4.0% when adjusted for non-recurring items related to the German competition
authority (BKA) in 2016 and to 2017 items including costs linked to the proposed transaction with Luxottica
along with litigation settlements.
Net debt
Essilor’s net debt reached €1,661 million at end-December 2017 versus €2,062 at end-December 2016,
leading to a material reduction in the financial leverage.
CASH FLOW STATEMENT
€ millions
Net cash from operations (before change in WCR1)
1,291 Capital expenditure 308
Proceeds from share issues 34 Change in WCR1 58
Other items3 122 Dividends 364
Acquisition of investments, net of
disposals2 317
Reported change in net debt 400
1 - WCR: working capital requirement 2 - Financial investments net of cash acquired, plus debt of newly-consolidated companies
3 - Other items include an €96 million currency effect

2 0 1 7 R e s u l t s
N e w s R e l e a s e
Page 15 of 17
PROPOSED COMBINATION OF ESSILOR AND LUXOTTICA
On January 16, 2017, Essilor and Delfin, the majority shareholder in Luxottica, announced that they had
signed an agreement to create an integrated global player in the eyewear industry with the combination of
Essilor and Luxottica. The transaction is subject to satisfaction of several conditions precedent.
In March 2017, employee representative bodies at Essilor issued favorable opinions on the combination. On
April 12, 2017, the French market authority (AMF) waived Delfin’sobligation to file a mandatory tender offer for
Essilo'rs shares.
On May 11, 2017, shareholders at the General Meeting and double voting rights holders at the Special
Meeting approved the combination.
On November 1, 2017, Essilor completed the hive-down of its activities. Essilor will be renamed “Essilor
Luxottica” once the other conditions precedent to completing the contribution of Luxottica shares to Essilor
have been satisfied, and it will become the holding company at the top of the combined group housing Essilor
International and Luxottica.
Essilor and Luxottica have also jointly filed notices with the antitrust authorities in several countries, notably in
five jurisdictions (Brazil, Canada, China, the United States and Europe) whose approval is a condition to
complete the combination. To date, the deal has been unconditionally approved in Canada and twelve other
countries: Australia, Chile, Colombia, India, Japan, Mexico, Morocco, New Zealand, Russia, South Africa,
South Korea and Taiwan.
SUBSEQUENT EVENTS
None.

2 0 1 7 R e s u l t s
N e w s R e l e a s e
Page 16 of 17
APPENDIX 1
ESSILOR INTERNATIONAL REPORTED STATEMENT OF INCOME
€ millions 2017
Reported
2016
Reported
% change
Revenue 7,490 7,115 +5.3%
Gross profit
(% of revenue)
4,346
58.0%
4,181
58.8%
+3.9%
--
Operating expenses 2,985 2,860 +4.4%
Contribution from operations (b)
(% of revenue)
1361
18.2%
1,321
18.6%
+3.0%
--
Other income (expense) (287) (91) --
Operating profit
(% of revenue)
1,074
14.3%
1,230
17.3%
-12.7%
--
Financial income (expense), net (64) (66) --
Income tax
Effective tax rate
(132)
13.0 %
(285)
24.5%
--
--
Net profit
Attributable to equity holders of
Essilor International
(% of revenue)
878
789
10.5%
880
813
11.4%
-0.1%
-3.0%
--
Earnings per share (in €) 3.64 3.79 -4.0%
(b) Contribution from operations corresponds to revenue less cost of sales and operating expenses (research and development costs,
selling and distribution costs and other operating expenses).

2 0 1 7 R e s u l t s
2 0 1 7 C o n s o l i d a t e d F i n a n c i a l S t a t e m e n t s
Page 1 of 5
2017 CONSOLIDATED
FINANCIAL STATEMENTS
2 0 1 7 R e s u l t s
2 0 1 7 C o n s o l i d a t e d F i n a n c i a l S t a t e m e n t s
Page 2 of 5
CONSOLIDATED INCOME STATEMENT
Year Year
€ millions, excluding per share data 2017 2016
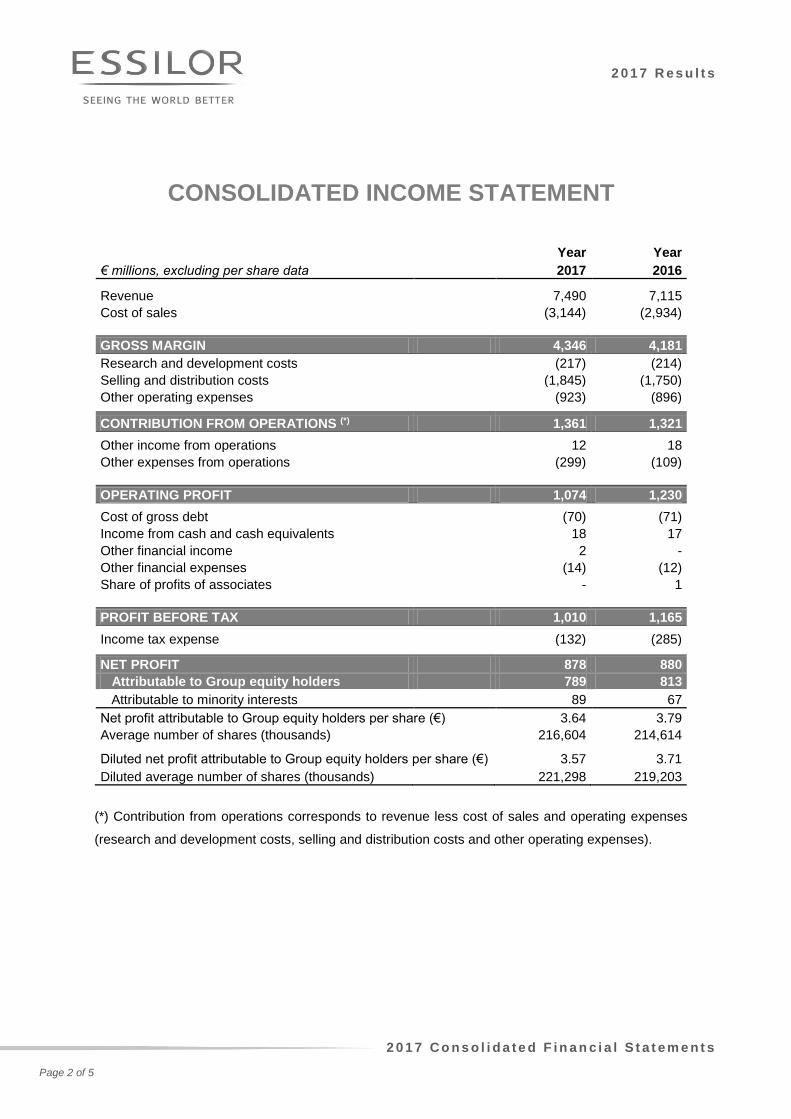
Revenue
7,490 7,115
Cost of sales
(3,144) (2,934)
GROSS MARGIN 4,346 4,181
Research and development costs
(217) (214)
Selling and distribution costs
(1,845) (1,750)
Other operating expenses
(923) (896)
CONTRIBUTION FROM OPERATIONS (*) 1,361 1,321
Other income from operations
12 18
Other expenses from operations
(299) (109)
OPERATING PROFIT 1,074 1,230
Cost of gross debt
(70) (71)
Income from cash and cash equivalents
18 17
Other financial income
2 -
Other financial expenses
(14) (12)
Share of profits of associates
- 1
PROFIT BEFORE TAX 1,010 1,165
Income tax expense
(132) (285)
NET PROFIT 878 880
Attributable to Group equity holders 789 813
Attributable to minority interests 89 67
Net profit attributable to Group equity holders per share (€) 3.64 3.79
Average number of shares (thousands)
216,604 214,614
Diluted net profit attributable to Group equity holders per share (€) 3.57 3.71
Diluted average number of shares (thousands) 221,298 219,203
(*) Contribution from operations corresponds to revenue less cost of sales and operating expenses
(research and development costs, selling and distribution costs and other operating expenses).

2 0 1 7 R e s u l t s
2 0 1 7 C o n s o l i d a t e d F i n a n c i a l S t a t e m e n t s
Page 3 of 5
CONSOLIDATED BALANCE SHEET
(ASSET)
€ millions December 31, 2017 December 31, 2016
Goodwill
5,583 6,191
Other intangible assets
1,682 1,825
Property, plant and equipment
1,116 1,214
Investments in associates
20 8
Non-current financial assets
111 136
Deferred tax assets
211 187
Long-term receivables
41 37
Other non-current assets
47 56
TOTAL NON-CURRENT ASSETS 8,811 9,654
Inventories
1,097 1,125
Prepayments to suppliers
30 31
Short-term receivables
1,685 1,618
Tax receivables
74 81
Other receivables
3 25
Derivative financial instruments recognized in assets
29 45
Prepaid expenses
87 67
Cash and cash equivalents
484 517
CURRENT ASSETS 3,489 3,509
TOTAL ASSETS 12,300 13,163

2 0 1 7 R e s u l t s
2 0 1 7 C o n s o l i d a t e d F i n a n c i a l S t a t e m e n t s
Page 4 of 5
CONSOLIDATED BALANCE SHEET
(EQUITY AND LIABILITIES)
€ millions December 31, 2017 December 31, 2016
Share capital
39 39
Issue premiums
635 591
Consolidated reserves
5,432 4,936
Own shares
(111) (168)
Hedging and revaluation reserves
(155) (159)
Translation differences
(125) 636
Net profit attributable to Group equity holders
789 813
EQUITY ATTRIBUTABLE TO PARENT COMPANY OWNERS
6,504 6,688
Equity attributable to non-controlling interests 423 366
TOTAL CONSOLIDATED EQUITY 6,927 7,054
Provisions for pensions
337 344
Long-term borrowings
1,674 1,364
Deferred tax liabilities
257 383
Other non-current liabilities
153 300
NON-CURRENT LIABILITIES 2,421 2,391
Provisions
394 393
Short-term borrowings
491 1,246
Customer prepayments
44 33
Short-term payables
1,515 1,431
Tax payables
81 73
Other current liabilities
378 509
Derivative financial instruments recognized in liabilities
15 22
Deferred income
34 11
CURRENT LIABILITIES 2,952 3,718
TOTAL LIABILITIES 12,300 13,163

2 0 1 7 R e s u l t s
2 0 1 7 C o n s o l i d a t e d F i n a n c i a l S t a t e m e n t s
Page 5 of 5
CONSOLIDATED CASH FLOW STATEMENT
Year Year
€ millions 2017 2016
CONSOLIDATED NET PROFIT (a) 878 880
Adjustments to reconcile net income (loss) to funds generated from operations Depreciation, amortization and other non-cash items
549 360
Provision charges (reversals)
(23) (50)
Gains and losses on asset disposals, net
(4) (6)
Finance costs, net (b) 49 54
Tax expenses (including deferred taxes) (a) 132 285
Other net cash out Share of profits of associates, net of dividends received
- (1)
Taxes paid
(234) (264)
Interest (paid) and received, net
(56) (56)
Change in working capital requirement
(58) (8)
NET CASH FROM OPERATING ACTIVITIES 1,233 1,194
Purchases of property, plant and equipment and intangible assets
(308) (294)
Acquisitions of subsidiaries, net of the cash acquired
(334) (706)
Change in other non-financial assets
18 (43) Proceeds from the sale of other financial assets, property, plant and equipment and intangible assets
26 21
NET CASH USED IN INVESTING ACTIVITIES (598) (1,022)
Capital increase (c) 44 41
Capital reduction paid to minority shareholders (c) (10) -
Net sale (net buyback) of treasury shares (c) - (31)
Dividends paid: - to ESSILOR shareholders (c) (325) (79)
- to minority shareholders of the consolidated subsidiaries (c) (39) (40)
Increase/(Decrease) in borrowings other than finance lease liabilities
(303) (31)
Repayment of finance lease liabilities
(2) (3)
NET CASH USED IN FINANCING ACTIVITIES (635) (143)
NET (DECREASE) INCREASE IN CASH AND CASH EQUIVALENTS - 29
Net cash and cash equivalents at January 1
460 431
Effect of changes in exchange rates
(34) -
NET CASH AND CASH EQUIVALENTS AT PERIOD-END 426 460
Cash and cash equivalents
484 517
Bank credit facilities
(58) (57)
(a) See income statement (b) Finance costs net is defined as the cost of gross debt minus the income of cash and cash equivalents
(c) See statement of changes in equity

2 0 1 7 R e s u l t s
N e w s R e l e a s e
Page 17 of 17
APPENDIX 2
CONSOLIDATED REVENUE BY QUARTER
€ millions 2017 2016
First Quarter
Lenses & Optical Instruments 1,713 1,567
North America 767 710
Europe 508 470
Asia/Pacific/Middle East/Africa 311 283
Latin America 127 104
Sunglasses & Readers 199 173
Equipment 50 44
TOTAL First Quarter 1,962 1,784
Second Quarter
Lenses & Optical Instruments 1,669 1,562
North America 715 668
Europe 529 495
Asia/Pacific/Middle East/Africa 304 282
Latin America 121 117
Sunglasses & Readers 218 187
Equipment 60 50
TOTAL Second Quarter 1,947 1,799
Third Quarter
Lenses & Optical Instruments 1,559 1,541
North America 658 671
Europe 487 461
Asia/Pacific/Middle East/Africa 293 288
Latin America 121 121
Sunglasses & Readers 148 132
Equipment 45 50
TOTAL Third Quarter 1,752 1,723
Fourth Quarter
Lenses & Optical Instruments 1,557 1,549
North America 665 657
Europe 490 480
Asia/Pacific/Middle East/Africa 285 286
Latin America 117 126
Sunglasses & Readers 201 192
Equipment 71 68
TOTAL Fourth Quarter 1,829 1,809