Embed Size (px)
Citation preview

SOLICITATION #:
2017000265
Appendix CC
Health Maintenance Organization Rate Development

www.Optumas.com Schramm Health Partners, LLC 7400 East McDonald Dr, Suite 101
Scottsdale AZ 85250 480.588.2499 main
480.315.1795 fax
April 19, 2016 Sarah Campbell Managed Care Rates Section Manager Department of Health Care Policy and Financing 1570 Grant Street Denver, CO 80203
PROPRIETARY AND CONFIDENTIAL
Subject: Health Maintenance Organization Rate Development for July 1, 2016 – June 30, 2017 Dear Sarah: Thank you for the opportunity to assist the Department of Health Care Policy and Financing (HCPF) with the development of the Medicaid Health Maintenance Organization (HMO) managed care capitation rates for use in contracting with Denver Health and Hospital Authority (DHHA). It was a pleasure to work with your team throughout this project. The following report summarizes the methodology for the development of the capitation rates, effective July 1, 2016 – June 30, 2017. We have also provided our actuarial certification for these updated capitation rates, compliant with CMS guidelines and requirements. Please send me an e-mail at [email protected] or call me at 480.588.2494, or email Barry at [email protected] or call at 480.588.2492 if you have any questions. Sincerely, Tim Doyle, FSA, MAAA Barry Jordan, ASA, MAAA CC: Shane Mofford, HCPF Ling Cui, HCPF Scott Campbell, Optumas Kyle Butler, Optumas Steve Schramm, Optumas

State of Colorado
HMO Actuarial Certification
July 1, 2016 – June 30, 2017 Capitation Rates

Executive Summary Optumas
1 | P a g e
Table of Contents
1. EXECUTIVE SUMMARY 2
2. RATE DEVELOPMENT PROCESS 3
2.01 OVERVIEW 3 2.02 BASE DATA 4 2.03 BASE DATA ADJUSTMENTS 6 2.04 TREND 10 2.05 PROGRAM CHANGES 11 2.06 EXPANSION POPULATIONS 12 2.07 NON-MEDICAL LOAD 13 2.08 RATE RANGES 13 2.09 RISK SHARING ARRANGEMENTS 14
3. RATE CERTIFICATION 16
4. APPENDICES 17
APPENDIX I. RATE DEVELOPMENT 18 APPENDIX I.A: CMS RATE SETTING CHECKLIST 19 APPENDIX I.B: 2016 MANAGED CARE RATE SETTING CONSULTATION GUIDE CHECKLIST 22 APPENDIX I.C: BASE DATA 39 APPENDIX I.D: BASE DATA ADJUSTMENTS 40 APPENDIX I.D: BASE DATA ADJUSTMENTS CONTINUED 41 APPENDIX I.E: PENT-UP DEMAND 42 APPENDIX I.F: BASE DATA BLEND: NON-EXPANSION 43 APPENDIX I.F: BASE DATA BLEND CONTINUED: EXPANSION COHORTS 44 APPENDIX I.F: BASE DATA BLEND CONTINUED: FINAL BLENDED PMPMS 45 APPENDIX I.G: UTILIZATION TREND (RETROSPECTIVE) 46 APPENDIX I.G: UTILIZATION TREND CONTINUED (PROSPECTIVE) 47 APPENDIX I.H: UNIT COST TREND (RETROSPECTIVE) 48 APPENDIX I.H: UNIT COST TREND CONTINUED (PROSPECTIVE) 49 APPENDIX I.I: PROSPECTIVE REIMBURSEMENT 50 APPENDIX I.J: NON-MEDICAL LOAD 51
APPENDIX II. SFY17 RATES 52 APPENDIX II.A: DHHA RATES – DETAILED RATING COHORTS 53 APPENDIX II.A: DHHA RATES CONTINUED – FINAL RATING COHORTS AND RATE CHANGE 54

Executive Summary Optumas
2 | P a g e
1. Executive Summary This report provides documentation of, and actuarial certification for, the development of Health Maintenance Organization (HMO) capitation rates effective July 1, 2016 – June 30, 2017 (SFY2016-17). The State of Colorado provides acute care services under the Medicaid HMO Program. Services are provided via one managed care entity known as Denver Health and Hospital Authority (DHHA). The program operates in the Denver metropolitan region. As the consulting actuaries to HCPF, Optumas ensured that the methodology used to develop the capitation rates complied with the Centers for Medicare & Medicaid Services (CMS) guidance for the development of actuarially sound capitation rates. Optumas worked with HCPF to identify the rate development components for July 1, 2016 – June 30, 2017, accounting for the covered services and populations as described in the DHHA contract. The final results were developed according to actuarially sound principles and reasonably reflect the experience projected for the HMO program. This report presents the capitation rate development process and its results in three sections, as described in Figure 1 below. Figure 1. Report Structure
Section Contents
Rate Development Process Overview of methodology used when developing the capitation rates, including applicable data, adjustments, analyses, and assumptions
Rate Certification Optumas’ actuarial certification that the capitation rates comply with guidelines set forth by CMS
Appendices Detailed tables showing results of data summaries, analyses, and assumptions used within the capitation rate development methodology

Rate Development Process Optumas
3 | P a g e
2. Rate Development Process
2.01 Overview In developing the SFY2016-17 HMO capitation rate methodology, Optumas adhered to guidance provided by CMS in accordance with 42 CFR §438.6(c), the standards for developing actuarially sound capitation rates for Medicaid managed care programs. CMS defines actuarially sound capitation rates as meeting the following criteria:
1. They have been developed in accordance with generally accepted actuarial principles and practices,
2. They are appropriate for the populations to be covered and the services to be furnished under the contract, and
3. They have been certified by an actuary who meets the qualification standards established by the American Academy of Actuaries and follows practice standards established by the Actuarial Standards Board.
Optumas specifically applied these criteria in the development of the methodology for calculating HMO capitation rates for the contract period. The base data used to develop the HMO capitation rates consisted of the SFY2013-14 and SFY2014-15 DHHA encounter data. Optumas additionally used SFY2012-13 DHHA encounter data to help inform trend development, as noted in section 2.04. Once the base data was compiled, HCPF and Optumas worked in partnership to determine all adjustments needed to ensure that the adjusted base data constituted an appropriate proxy for the expected contract year experience. The adjustment categories are presented below in Figure 2. Figure 2. Rate Development Process Adjustments
Adjustment Overview
Base Data Adjustments Necessary adjustments to ensure that the base data is an appropriate proxy for the enrolling population
Trend Factors to account for the forecasted change in utilization and unit costs from the base data to the contract period
Program Changes Historical and prospective program (population and benefit) changes not reflected in the adjusted base data
Expansion Populations Development of anticipated medical expenses for newly eligible expansion populations
Non-Medical Loading Loading to account for non-medical expenditures incurred by an HMO as well as a profit margin
The remainder of this report provides further detail on each of the adjustment categories noted above.

Rate Development Process Optumas
4 | P a g e
2.02 Base Data The base data used for the SFY2016-17 HMO capitation rate development comprises two years of DHHA encounter data spanning SFY2013-14 and SFY2014-15, with the exception of the expansion populations, whose base data only reflects the last six months of SFY2013-14 (January – June 2014) and all of SFY2014-15, since this population became eligible January 1, 2014. The raw claims data was provided by DHHA to HCPF; HCPF and Optumas then worked simultaneously to validate and summarize the DHHA encounter data. The two years of base data were then blended after the adjustments described in section 2.03. The re-priced SFY2013-14 and SFY2014-15 base data, prior to any additional adjustments, can be found in Appendix I.C.
Covered Services The HMO program covers a range of medically necessary acute care services to the eligible members summarized in the following table:
Covered Services
Drugs
Durable Medical Equipment (DME)
Early and Periodic Screening, Diagnostic, and Treatment (EPSDT)
Emergency Room (ER)
Emergency Transport (ET)
Family Planning (FP)
FQHC & Rural Health (RHC)
Home Health (HH)
Inpatient Hospital (IP)
Laboratory & X-Ray
Other
Outpatient Hospital (OP)
Physician (PHYS)
Categories of Aid The DHHA base data was summarized into rating cohorts that represent different levels of risk, referred to as the following Categories of Aid (COA). Note that the final capitation rates include a blended rate for institutionalized and non-institutionalized cohorts as well as AFDC Expansion male and female cohorts, where applicable (i.e., OAP-A-N and OAP-A-I have one final capitation rate):
COA Description
AFDC-A-F Categorically Eligible Low Income Adult Females
AFDC-A-M Categorically Eligible Low Income Adult Males
BCKC-A Baby Care Program - Adults
Child-C Eligible Children Over Age One

Rate Development Process Optumas
5 | P a g e
COA Description
Child-U Eligible Children Under Age One
FC Foster Care Children
OAP-A - N Non-Institutionalized Adults 65 and Older
OAP-A - I Institutionalized Adults 65 and Older
OAP-B/AND - NN Non-Dual, Non-Institutionalized Disabled Adults Under 65
OAP-B/AND - NT Dual, Non-Institutionalized Disabled Adults Under 65
OAP-B/AND - IN Non-Dual, Institutionalized Disabled Adults Under 65
OAP-B/AND - IT Dual, Institutionalized Disabled Adults Under 65
Buy-In Disabled Dual Dual, Working Disabled Adults and Children
Buy-In Disabled Non-Dual Non-Dual, Working Disabled Adults and Children
AFDC Expansion Adults - F - < 108% FPL Categorically Eligible Low Income Adult Females <108% FPL
AFDC Expansion Adults - M - < 108% FPL Categorically Eligible Low Income Adult Males <108% FPL
AFDC Expansion Adults - F - 109% + FPL Categorically Eligible Low Income Adult Females 109% + FPL (Up to 138% FPL)
AFDC Expansion Adults - M - 109% + FPL Categorically Eligible Low Income Adult Males 109% + FPL (Up to 138% FPL)
AwDC Adults without Dependent Children 0-138% FPL
Delivery Maternity Kick Payment that covers the delivery and post- partum care (facility and professional)
The following table shows how the above detailed cohorts are grouped together to create the final rating cohorts:
COA Final Rating COA
AFDC-A-F AFDC-A-F
AFDC-A-M AFDC-A-M
BCKC-A BCKC-A
CHILD-C CHILD-C
CHILD-U CHILD-U
FC FC
OAP-A - N OAP-A
OAP-A - I OAP-A
OAP-B/AND - NN OAP-B/AND - N
OAP-B/AND - NT OAP-B/AND - T
OAP-B/AND - IN OAP-B/AND - N
OAP-B/AND - IT OAP-B/AND - T
Buy-In Disabled Dual OAP-B/AND - T
Buy-In Disabled Non-Dual OAP-B/AND - N
AwDC AwDC
AFDC Expansion Adults - F - < 108% FPL AFDC Expansion Adults - F
AFDC Expansion Adults - M - < 108% FPL AFDC Expansion Adults - M
AFDC Expansion Adults - F - 109% + FPL AFDC Expansion Adults - F

Rate Development Process Optumas
6 | P a g e
COA Final Rating COA
AFDC Expansion Adults - M - 109% + FPL AFDC Expansion Adults - M
Delivery Delivery
2.03 Base Data Adjustments
Re-Pricing: Optumas worked with HCPF to validate the encounter data and to ensure that only valid state-plan services and services defined in the DHHA benefit package were included in the base data. DHHA contracts with internal and external providers to offer benefits to its members. DHHA pays its external providers on a fee-for-service basis, so the actual expenditures present in the base claims data were utilized. Since DHHA employs a staff model, meaning that their internal providers are employees receiving a fixed salary as opposed to traditional fee-for-service reimbursement, the encounters for internal providers were re-priced at Colorado’s Medicaid Fee Schedule. The following methodology was used to re-price internal provider claims:
Inpatient Hospital: The State of Colorado began transitioning its Inpatient reimbursement methodology to APR-DRG weighted reimbursement beginning January 1, 2014. While the APR-DRG is included on inpatient claims after this date, communications with DHHA revealed that the severity level in the data is not always reliable because they are retroactively adjusted. Therefore, all internal provider Inpatient claims in the SFY2013-14 and SFY2014-15 DHHA encounter data were assigned an APR-DRG classification and severity level, using version 30 of the 3M APR-DRG Core Grouping Software. HCPF provided its APR-DRG weights, effective January 1, 2014, as well as its latest provider base rates, effective July 1, 2015. These two components were utilized to re-price the SFY2013-14 and SFY2014-15 internal provider Inpatient claims.
Outpatient Hospital and Emergency Room: The latest Medicare Cost-to-Charge Ratio (CCR) was provided by HCPF and used to re-price internal provider Outpatient Hospital and Emergency Room claims. However, the following services, when provided as part of an Outpatient Hospital or Emergency Room claim, are reimbursed at the lesser of the Medicaid fee schedule and the submitted charges: Transportation, Lab Services, and Occupational/Physical Therapy services. These services were re-priced using the July 1, 2015 Medicaid fee schedule or the submitted charges, whichever was lower. For all other Outpatient Hospital and Emergency Room services, the Medicare CCR was applied at a provider-specific level to both the SFY2013-14 and SFY2014-15 DHHA encounter data. In FFS, Colorado applies an additional Medicaid “Percentage” or “Deflator” that adjusts the Medicare CCR to reflect Medicaid reimbursement levels. The latest Medicaid “Deflator” provided by HCPF was 72.0%, effectively applying a 28.0% reduction in addition to the Medicare CCR.

Rate Development Process Optumas
7 | P a g e
Home Health: The latest available Home Health rates provided by HCPF, effective July 1, 2015, were used to re-price Home Health services. The SFY2013-14 and SFY2014-15 DHHA encounters were re-priced on a revenue code and procedure code basis, per the Home Health fee schedule.
FQHC & Rural Health: HCPF provided FQHC and RHC encounter rate schedules effective January 1, 2015. The FQHC/RHC APM rates have been built into the re-priced base data and were applied to each internal provider FQHC and RHC visit.
DME, EPSDT, Family Planning, Laboratory & X-Ray, Physician, and Other: These services were re-priced using the July 1, 2015 Medicaid fee schedule at the procedure code and procedure code modifier level. While the State had previously reimbursed select primary care services at Section 1202 enhanced levels effective January 1, 2015, this provision will no longer be in effect during the SFY2016-17 contract period. Many of these services are reverting to pre-1202 Medicaid levels, while some are being reduced to a percentage of Medicare. Each of the services that had previously been reimbursed at the higher 1202 fee level was first adjusted to reflect the pre-1202 fees. A separate adjustment has been applied to increase the select procedures that will increase to a percent of Medicare; this adjustment is described in the” Sunset of 1202 Physician Fees” section of this report.
As mentioned above, the DHHA encounter data already reflects true reimbursement to external providers; therefore, these claims have not been re-priced.
Incurred but not reported (IBNR): Estimates of IBNR expenditures were developed for the DHHA encounter data. The base data used to develop the HMO rates comprised SFY2013-14 and SFY2014-15 with three months of runout (paid through September 30, 2015). Optumas developed IBNR factors for both years of data which produced an overall increase of 0.02% for SFY2013-14 and 1.84% for SFY2014-15. Please see Appendix I.D for the impact of IBNR by COA.
Reinsurance Recoveries: The DHHA Medicaid Choice reinsurance contract provides protection to DHHA against excessive costs for certain eligible services incurred on a per-member per-year basis. The deductible/retention for these members is $225,000, in which reinsurance pays 90% above the retention up to a maximum of $2,000,000 per member per year. DHHA has indicated that reinsurance recoveries received for its Medicaid line of business totaled $229,910 in SFY2013-14 and $1,712,393 in SFY2014-15. Since these recoveries were not available by COA, Optumas reviewed the detailed encounter data to identify members whose costs exceeded the $225,000; costs in excess of this amount were then identified, and used to distribute the total reinsurance recoveries by COA and SFY. This resulted in an overall adjustment to the base data of -0.19% in SFY2013-14 and -1.23% in SFY2014-15. The total adjustment for reinsurance recoveries can be found in Appendix I.D.

Rate Development Process Optumas
8 | P a g e
Child-U (Newborn) Cost Correction: In review of the DHHA encounter data, Optumas identified claims incurred for a newborn member, but which contained a Medicaid ID that reflects the mother of the newborn. As a result of discussion with HCPF and DHHA, it was determined that this occurs because the newborn is not assigned a State ID immediately after birth. Rather, the State ID is retroactively created along with enrollment for the first 60 days of life. While the eligibility for the newborn is then appropriately updated, meaning that an enrollment span exists that contains the first 60 days, the encounter claims are not updated to reflect the corrected Medicaid ID. To adjust for costs that are truly associated with the Child-U (newborn) cohort, Optumas identified all such claims, and a budget neutral adjustment was made to shift the costs from the mother’s cohort into the newborn’s cohort. Please see Appendix I.D for the impact of this adjustment by COA.
Hepatitis C Therapies: Optumas reviewed the DHHA base data for utilization of both ‘Old’ (Interferon, Incivek, Ribavirin, and Victrelis) and ‘New’ (Harvoni, Olysio, and Sovaldi) Hepatitis C treatment therapies in both the SFY2013-14 and SFY2014-15 data. A durational analysis was conducted to understand the DHHA-specific costs and utilization related to these therapies over time. As a result of this review, Optumas has made the following adjustments for the Hepatitis C emerging drugs:
1. Costs from the OAP-B/AND - NT cohort were removed. A single member received one ‘old’ Hepatitis C therapy in August 2013; no other experience was observed during the two-year period encompassing the base data used in rate development. Given the lack of other experience and the fact that it occurred within a dual cohort, this experience has been removed from the base data as it is not expected to re-occur during the contract period.
2. With the exception of the OAP-B/AND - IN cohort, no experience involving the ‘old’ therapies was observed in SFY2014-15. Since the experience for the OAP-B/AND - IN population was observed only in the last three months of SFY2014-15, the base data for this COA was adjusted to reflect the corresponding PMPM for that three-month time period.
3. Experience involving ‘new’ therapies was reviewed in the SFY2013-14 and SFY2014-15 data; one month of experience for the OAP-A-N cohort was observed in SFY2013-14, and two months of experience (two utilizers in May 2015 and three in June 2015) were observed in SFY2014-15. In addition to the DHHA experience, FFS data was reviewed for the population residing in the Denver metropolitan region, but not enrolled in DHHA. As a result of this review, the following adjustments have been made:
a. AFDC-A-F, AFDC-A-M, Child-C, AwDC, AFDC-Expansion-F, and AFDC-Expansion-M:
i. Lower Bound: Assume zero utilizers (no impact) ii. Upper Bound: Assume one utilizer of a six-month Harvoni treatment will occur
b. OAP-B/AND- NN: i. Lower Bound: Assume one utilizer of a six-month Harvoni treatment will occur
throughout the year (six months of total utilization) ii. Upper Bound: Assume three utilizers of a six-month Harvoni treatment will
occur throughout the year (18 months of total utilization)

Rate Development Process Optumas
9 | P a g e
c. OAP-A-N: i. Lower Bound: Assume zero utilizers (reduction to experience observed in
SFY2013-14) ii. Upper Bound: Assume one utilizer of a six-month Harvoni treatment will occur
throughout the year (six months of total utilization) The net adjustment to the base data for #1-3, by COA, can be found in Appendix I.D.
AFDC (Non-Expansion) Acuity: Inherent in the AFDC male and female cohorts prior to January 1, 2014 was a mix of members that fell between 0-108% FPL because Colorado had already offered coverage to the AFDC population up to 108% FPL. However, the rates developed for the SFY2016-17 contract period include separate rates for AFDC expansion and non-expansion cohorts (expansion being inclusive of members between 69-138% FPL). Therefore, a consideration was necessary for the AFDC non-expansion base data to reflect the removal of the 69-108% FPL members from the population since they could not be separately identified during the entire base data period. An acuity adjustment was developed to reflect the cost differential between the AFDC 0-68% and 69-108% FPL populations. Optumas reviewed the costs associated with the AFDC 0-68% FPL (non-expansion) and AFDC 69-108% FPL cohorts during the last six months of SFY2013-14 (January 1, 2014 – June 30, 2014). The AFDC 69-108% FPL members were, on average, less costly than the AFDC 0-68% FPL members. The acuity adjustment was calculated as an upward adjustment to the AFDC non-Expansion male and female cohorts. This adjustment impacts the first six months of SFY2013-14; the overall impact by COA and SFY can be found in Appendix I.D.
Sunset of 1202 Physician Fees: Colorado is sunsetting its current enhanced fees for certain 1202 enhanced physician procedures, effective July 1, 2016; while many of these services are reverting to historical Medicaid FFS reimbursement levels, a select number of these services will be paid at 87.3% of Medicare. Since the internal provider claims were initially re-priced at the most recent physician fee schedule (which reflects the reduction of 1202 services to historical Medicaid FFS levels), an upward adjustment was made to reflect the fact that a number of these services will now be increased to 87.3% of Medicare. Additionally, an adjustment for these specific services has been made for the external provider physician costs. While DHHA separately contracts with its external providers, which is not directly tied to Medicaid FFS reimbursement, the base data reflects 1202 physician fees being paid at the enhanced rate effective January 1, 2015; this is when the Colorado FFS fee schedule was universally adjusted to reflect the enhanced fees. As a result of this dynamic, all 1202 physician procedures in SFY 2013-14 and SFY2014-15 have been adjusted to reflect both the sunset of the 1202 enhanced reimbursement levels, as well as the increase of specific 1202 services to 87.3% of Medicare. The total impact of the sunset of the 1202 enhanced fees is an 0.34% for SFY2013-14 and -0.08% for SFY2014-15. These impacts at the COA level are shown on Appendix I.D.

Rate Development Process Optumas
10 | P a g e
The final base data following each of the adjustments described above, along with the weighted blend of each fiscal year, is shown on Appendix I.F.
Pharmacy Rebates: Since DHHA is not expected to receive pharmacy rebates during the SFY2016-17 contract period, no adjustment has been made to the capitation rates for pharmacy rebates.
Copay, Coinsurance, Deductibles, and Third Party Liability (TPL): With internal provider claims having been re-priced at the Medicaid fee schedule, the resulting base data does include third-party liability (TPL) such as other carrier payments. These have been backed out of the base data to reflect true DHHA costs, net of TPL, based on TPL amounts reported in the claims data. Costs for DHHA’s external providers reflect only the amounts paid by DHHA, net of any TPL. Although DHHA does not charge its members a copay, an adjustment has been made to reflect copays commensurate with the copays charged under FFS. Once the base data has been blended and adjusted for trend and program changes, the latest FFS copay amounts are backed out from the DHHA capitation rates. The overall impact to the SFY2016-17 capitation rates is a 0.41% reduction, which can be seen in detail in Appendix I.I. Since Native Americans are not charged any copays in Colorado Medicaid, a separate rate range was developed that includes no reduction; the payment rate selected falls within both the Native American and non-Native American rate ranges. See section 2.08 for information regarding the rate ranges which capture the DHHA capitation rates. Details regarding the impact of all base data adjustments noted above are included in Appendices I.D and I.I.
2.04 Trend Trend factors were applied retrospectively and prospectively to the blended SFY2013-14 and SFY2014-15 DHHA encounter data following all base data adjustments mentioned above. Retrospective trend was applied for six months to project the midpoint of the 50/50 blended SFY2013-14 and SFY2014-15 base data (July 1, 2014) to the midpoint of SFY2016-17 (January 1, 2017). Based on a review of costs over time by COA, if either SFY2013-14 or SFY2014-15 was determined to be an outlier year, a lower weight would be given to that year. To the extent that particular categories of aid were not blended at a 50/50 rate between fiscal years, their retrospective trend months may vary. For example, if a category of aid received a 25/75 SFY2013-14/SFY2014-15 blend, then the retrospective trend would reflect a SFY2013-14/SFY20014-15 midpoint of October 1, 2014, and therefore be projected three months forward to the midpoint of SFY2014-15. Prospective trend was uniformly applied for 24 months, from the midpoint of SFY2014-15 (January 1, 2015) to the midpoint of the SFY2016-17 contract period (January 1, 2017). DHHA encounter data trends were developed separately for internal and external DHHA providers and applied by major category of service and category of aid. For internal provider costs, trends were developed to account for the change in utilization rate (frequency of services) and case mix over time, since all internal claims were re-priced at the latest Medicaid fee schedule, and are receiving prospective

Rate Development Process Optumas
11 | P a g e
provider increases. For external provider costs as well as pharmacy costs, trend was developed for utilization rate and unit cost (pure price change, technology, acuity/intensity, and mix of services) of services over time. These trend factors were used to project the PMPM costs from the base period to the future contract period. The overall annualized prospective PMPM trend is 2.49%. Details regarding the impact of trend are included in Appendices I.G and I.H.
2.05 Program Changes CMS requires that the development of actuarially sound rates account for program changes. Since the DHHA internal provider encounter data was already re-priced to the most current SFY2015-16 Medicaid fees, Optumas has applied prospective program changes to internal provider costs only. Per Colorado Medicaid policy, there have been no additional program changes that will go into effect for the following HMO-eligible services: DME, Emergency Transport, Emergency Room, Family Planning, Home Health, Inpatient Hospital, Laboratory and X-Ray, and Outpatient Hospital Non-ER. As HCPF has incorporated the full APM rates into the FQHC/RHC portion of the payment rate, no reconciliation is needed outside of the capitation rates for these services. To account for future increases to the APM rates, Optumas reviewed the average annual FQHC/RHC rate change over time for the Denver Health FQHC facility, which was 1.3% over the last five years. FQHC APM rates have been updated every six months over the last two years; the base data reflects the rate effective January 1, 2015, and the updated January 1, 2016 APM rate of $226.96 was made available after the re-pricing was completed. The first step was to adjust for the difference between the amount built into the re-pricing, which reflects an 0.27% reduction to the FQHC/RHC category of service. Based on historical rate changes, it is anticipated that another update will be made on July 1, 2016 and again on January 1, 2017. The 1.3% annualized trend results in a 0.6% increase for January 1, 2016 – July 1, 2016; this annualized trend was then applied to project through the SFY2016-17 contract period. As a result of these adjustments, a downward unit cost adjustment of 1.32% has been made to the FQHC/RHC category of service; this reflects both the reduction due to the drop from the rate built into the encounter data, plus the increase due to projection into the contract period. Since DHHA contracts independently with its external providers and they are not directly tied to Medicaid FFS, only internal providers were given a cost increase commensurate with FFS reimbursement changes. The exception is related to the physician fee increase as noted in section “2.03: Sunset of 1202 Physician Fees”. Additional changes over time in reimbursement for external providers have been captured in the unit cost trend development. The overall impact of prospective program changes results in a 0.27% overall decrease to the blended SFY2013-14 and SFY2014-15 DHHA base data. Additionally, the pharmacy dispensing/fill fee that DHHA reimburses has increased from $2.50 per script to $9.31 per script for all of its internal pharmacies. Optumas has implemented a $6.81 unit cost
Rate Development Process Optumas
12 | P a g e
increase for the portion of pharmacy expenditures that are attributed to DHHA’s internal pharmacies. This adjustment results in an aggregate 1.28% increase. Details regarding the impact of each of these adjustments can be found in Appendix I.I.
2.06 Expansion Populations With the implementation of the Affordable Care Act (ACA) effective January 1, 2014, new populations are eligible for DHHA coverage. Some of these members were already covered by DHHA within the AFDC male and female cohorts (adults with income between 69-108% FPL). Separate rate cells were calculated for these populations in addition to the traditional DHHA rate cells. The expansion adult population is broken out into the following categories of aid:
Adults without Dependent Children (AwDC)
AFDC-A-F - <108% FPL
AFDC-A-M - <108% FPL
AFDC-A-F - 109%+ FPL (Up to 138% FPL)
AFDC-A-M - 109%+ FPL (Up to 138% FPL)
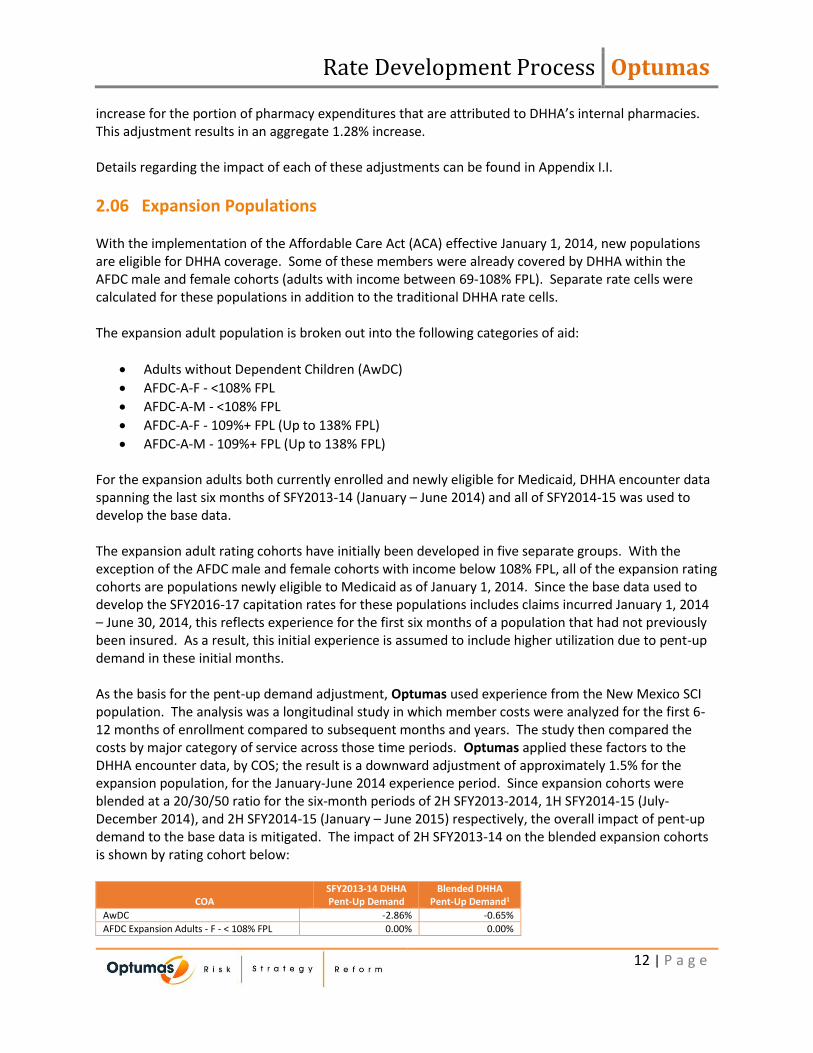
For the expansion adults both currently enrolled and newly eligible for Medicaid, DHHA encounter data spanning the last six months of SFY2013-14 (January – June 2014) and all of SFY2014-15 was used to develop the base data. The expansion adult rating cohorts have initially been developed in five separate groups. With the exception of the AFDC male and female cohorts with income below 108% FPL, all of the expansion rating cohorts are populations newly eligible to Medicaid as of January 1, 2014. Since the base data used to develop the SFY2016-17 capitation rates for these populations includes claims incurred January 1, 2014 – June 30, 2014, this reflects experience for the first six months of a population that had not previously been insured. As a result, this initial experience is assumed to include higher utilization due to pent-up demand in these initial months. As the basis for the pent-up demand adjustment, Optumas used experience from the New Mexico SCI population. The analysis was a longitudinal study in which member costs were analyzed for the first 6-12 months of enrollment compared to subsequent months and years. The study then compared the costs by major category of service across those time periods. Optumas applied these factors to the DHHA encounter data, by COS; the result is a downward adjustment of approximately 1.5% for the expansion population, for the January-June 2014 experience period. Since expansion cohorts were blended at a 20/30/50 ratio for the six-month periods of 2H SFY2013-2014, 1H SFY2014-15 (July-December 2014), and 2H SFY2014-15 (January – June 2015) respectively, the overall impact of pent-up demand to the base data is mitigated. The impact of 2H SFY2013-14 on the blended expansion cohorts is shown by rating cohort below:
COA SFY2013-14 DHHA Pent-Up Demand
Blended DHHA Pent-Up Demand1
AwDC -2.86% -0.65%
AFDC Expansion Adults - F - < 108% FPL 0.00% 0.00%

Rate Development Process Optumas
13 | P a g e
COA SFY2013-14 DHHA Pent-Up Demand
Blended DHHA Pent-Up Demand1
AFDC Expansion Adults - M - < 108% FPL 0.00% 0.00%
AFDC Expansion Adults - F - 109% + FPL -4.06% -0.71%
AFDC Expansion Adults - M - 109% + FPL -3.83% -1.23%
Total1 -1.27% -0.46% 1 Pent-Up Demand total for expansion cohorts only
The pent-up demand factors that have been applied by category of service as well as the impact across all COAs (expansion and non-expansion) can be found in Appendices I.D and I.E. As noted above, the base data was blended with greater weight attributed to the more recent months of experience. As the population begins to stabilize following the initial ramp-up period, the more recent experience is expected to better reflect the risk that will be seen in the SFY2016-17 contract period.
2.07 Non-Medical Load The non-medical load measures the dollars associated with components such as administration, profit, risk, and contingencies, and it is expressed as a percentage of the capitation rate. Optumas utilized administrative costs as reported in DHHA’s financial reporting, as well as experience with non-medical expenses in other states, on both a PMPM and percentage basis. The table in Appendix I.J includes the non-medical load developed for DHHA. Since DHHA is a non-profit organization, the Health Insurance Provider’s Fee (HIPF) is not applicable and no adjustment is necessary.
2.08 Rate Ranges In developing the capitation rates by rate cell, Optumas relied on multiple actuarial assumptions. These assumptions were estimates of the impacts of various components of the rate development methodology. Multiple sources of program-specific information, industry information and in-house proprietary actuarial tools were utilized to ensure that these assumptions were well-informed, unbiased, and as accurate as possible. Per the CMS rate checklist, Optumas’ approach to developing actuarially sound rate ranges required a review of all of the assumptions and adjustments used in the rate development process in order to determine PMPM costs at specific points in the rate ranges, including the lower and upper bounds. The upper and lower bounds of the rate range are intended to represent amounts at which an appropriately managed HMO would be able to meet the access to care and quality of care standards as described in their contract. Optumas examined variations in each component of the rate development process to determine these endpoints. These variations, examined in isolation as well as in combination, resulted in a series of capitation rates that, when combined, defined the rate ranges. To develop the rate ranges, Optumas varied both the trend (±0.75% for Utilization and Unit Cost) and non-medical load (±0.5%) (specific trend values corresponding to the developed capitation rates are shown in Appendices I.G and I.H). The assumptions varied by rating cohort depending on the volatility exhibited in the data. The variations were developed based on experience in other states and outcomes that could potentially materialize in the actual experience. For example, if a midpoint average annual PMPM trend of 5% for

Rate Development Process Optumas
14 | P a g e
AFDC females was developed, then the lower bound (3.5%) represented what Optumas also believed might reasonably occur. The process was repeated to determine the upper bound (6.5%). Assumptions were not developed in isolation, but instead they were designed to reflect interaction with one another. For example, a smaller trend on the lower bound would be coupled with a larger non-medical load assumption since greater medical management efforts would be needed to achieve the lower trend. The developed capitation rates fall within the described rate ranges, and are shown in Appendix II.A. Colorado Revised Statutes C.R.S. 25.5-5-408 (9) contains the following statement: “The rate-setting process referenced in subsection (6) of this section shall include a time period after the MCEs have received the direct health care cost of providing these same services on an actuarially equivalent Colorado Medicaid population group consisting of unassigned recipients and recipients in the primary care physician program provided in section 25.5-5-407, for each MCE to submit to the state department the MCE’s capitation payment proposal, which shall not exceed one hundred percent of the direct health care cost of providing these same services on an actuarially equivalent Colorado Medicaid population group consisting of unassigned recipients and recipients in the primary care physician program provided in section 25.5-5-407”. To comply with the requirement, Optumas separately developed the fee-for-service-equivalent (FFSE) costs to demonstrate that the capitation rates paid to DHHA are both below the FFSE at the aggregate level (across all rating cohorts) and also fall within the actuarially sound rate range. This report provides documentation and actuarial certification that the Colorado HMO capitation rates effective July 1, 2016 – June 30, 2017 fall within this same rate range.
2.09 Risk Sharing Arrangements As a result of the unknown risk level associated with the emerging AwDC population, the State has developed the following risk corridor as a risk-mitigation strategy:
Min Max MCO Share Federal/State Share
0% 98% 50% 50%
98% 102% 100% 0%
102% + 50% 50%
The proposed risk corridor numerator includes the MCO’s medical expenditures plus the pricing assumptions for non-medical loading. The denominator is the premium paid to the MCO. The risk corridor is then the ratio of those two. For the risk corridor calculations, we intend to use the encounter data priced at the Medicaid fee schedule for internal DHHA providers and will benchmark DHHA’s actual costs for external providers to the Medicaid fee schedule to ensure reasonable provider contracting. The AwDC settlement plan for the rate period from July 2016 to June 2017:
1. AwDC service encounter identification and collection a. Use the MO Elig file and/or capitation file to identify the AwDC clients. b. Use the same format as the regular MCO encounters.

Rate Development Process Optumas
15 | P a g e
c. Send the data together with the quarterly MCO encounter submission. d. The complete AwDC encounters with at least four (4) months run-out.
2. Calculate the actual rate and risk sharing amount based on the risk corridors, and capped values in May 2018.
3. Reconcile $ amount with DHHA by June 30th, 2018. The risk corridor applies only to the AwDC expansion cohort. On the top end of the corridor, the Federal Government will not provide financial participation above the Fee-for-Service Equivalent, which will be calculated during the risk corridor process. In addition to the risk corridor specific to the AwDC cohort, all of the expansion adult cohorts (AwDC and AFDC 69-138% FPL cohorts) are subject to a medical loss ratio (MLR)1. To the extent that the actual experience for all expansion adult cohorts is below an 85% MLR, the Federal Government will retain all profits below that threshold. For the calculation of the MLR, the numerator includes only the MCO’s medical expenditures and the denominator is the total capitation made to the MCO. The AFDC/AwDC expansion MLR settlement plan for the rate period from July 2016 to June 2017:
1. AFDC/AwDC expansion service encounter identification and collection a. Use the MO Elig file and/or capitation file to identify the AFDC expansion and AwDC
clients. b. Use the same format as the regular MCO encounters. c. Send the data together with the quarterly MCO encounter submission. d. The complete AFDC/AwDC expansion encounters with at least four (4) months run-out.
2. Calculate the actual rate and risk sharing amount, to the extent necessary based on the 85% MLR threshold in May 2018.
3. Reconcile $ amount, to the extent necessary, with DHHA by June 30th, 2018.
1 The process used for the calculation of the MLR may be subject to change beginning January 1, 2017 pending the finalization of both Federal regulations and State policy.

Rate Certification Optumas
16 | P a g e
3. Rate Certification We, Tim Doyle, Senior Actuary at Optumas and Member of the American Academy of Actuaries (MAAA), and a Fellow of the Society of Actuaries (FSA), and Barry Jordan, Consulting Actuary at Optumas and Member of the American Academy of Actuaries (MAAA), and an Associate of the Society of Actuaries (ASA), are certifying the calculation of the capitation rates. The State’s rate selections, presented in Appendix II.A, fall within the developed rate ranges. We meet the qualification standards established by the American Academy of Actuaries and have followed the practice standards established from time to time by the Actuarial Standards Board. The capitation rates provided with this certification are considered actuarially sound for purposes of the 42 CFR 438.6I, according to the following criteria:
The capitation rate ranges have been developed in accordance with generally accepted actuarial principles and practices;
The capitation rate ranges are appropriate for the populations to be covered, and the services to be furnished under the contract; and
The capitation rate ranges meet the requirements of 42 CFR 438.6(c).
Appendix I.A contains a crosswalk between the CMS ratesetting checklist and this certification letter. The actuarially sound rate ranges that are associated with this certification are effective July 1, 2016 through June 30, 2017 for the HMO program. The actuarially sound capitation rates are based on a projection of future events. Actual experience will vary from the experience assumed in any rate picked within the rate ranges. The capitation rates offered may not be appropriate for any specific HMO. An individual HMO should review the rates in relation to the benefits that it is obligated to provide to the covered population. The HMO should evaluate the rates in the context of its own experience, expenses, capital, surplus, and profit requirements prior to agreeing to contract with the State. The HMO may require rates above, within, or below the actuarially sound rate range associated with this certification. Please feel free to contact Tim at 480.588.2494 or Barry at 480.588.2492 for any additional information. Sincerely, Tim Doyle, FSA, MAAA Barry Jordan, ASA, MAAA Senior Actuary Consulting Actuary

Appendices Optumas
17 | P a g e
4. Appendices THIS PAGE LEFT INTENTIONALLY BLANK

Appendix I. Rate Development Optumas
18 | P a g e
Appendix I. Rate Development THIS PAGE LEFT INTENTIONALLY BLANK

Appendix I. Rate Development Optumas
19 | P a g e
Appendix I.A: CMS Rate Setting Checklist
CMS Item #
Subject Compliance HMO SFY17 Rate Comments
Subsection AA. 1 - General
AA.1.0 Overview of rates being paid under the contract Rate Certification Letter Section 2.01
AA.1.1 Actuarial Certification Rate Certification Letter Section 3.
AA.1.2 Projection of expenditures N/A
AA.1.3 Risk contracts N/A
AA.1.4 Modifications The rates certified in this report are effective July 1, 2016 to June 30, 2017. No modifications are planned during the rate period.
AA.1.5 N/A N/A There is no item AA.1.5 in the CMS Checklist
AA.1.6 Limit on payment to other providers N/A
AA.1.7 Risk and Profit Rate Certification Letter Section 2.07
AA.1.8 Family Planning enhanced match
Consistent with the CMS checklist, the portion of the rate claimed at enhanced match is attributable only to services meeting the definition of family planning in accordance with the authority for the program and provided to enrollees who can receive such services.
AA.1.9 Indian Health Service (IHS) Facility enhanced match
Indian Health Services are provided under the DHHA contract, and are provided via FFS.
AA.1.10 Newly eligible enhanced match Development of rates for newly eligible adults are consistent with CMS guidance.
AA.1.11 Retroactive adjustments
Any retrospective eligibility adjustments are captured in the eligibility data used to develop the base data; both costs and member months have been included for these time periods.
Subsection AA. 2 – Base Year Utilization and Cost Data
AA.2.0 Based only upon services covered under the State plan
Only State Plan Services were included in the base data.

Appendix I. Rate Development Optumas
20 | P a g e
CMS Item #
Subject Compliance HMO SFY17 Rate Comments
AA.2.1 Provided under the contract to Medicaid-eligible individuals
Only HMO program eligibles and cost data have been included in the base data.
AA.2.2 Data sources Rate Certification Letter Section 2.02.
Subsection AA. 3 – Adjustments to the Base Year Data
AA.3.0 Adjustments to the base year data Rate Certification Letter Section 2.03.
AA.3.1 Benefit differences Rate Certification Letter Sections 2.05.
AA.3.2 Administrative cost allowance calculations Rate Certification Letter Section 2.07.
AA.3.3 Special populations’ adjustments Rate Certification Letter Section 2.06.
AA.3.4 Eligibility adjustments Rate Certification Letter Section 2.06.
AA.3.5 Third Party Liability (TPL) Rate Certification Letter Section 2.03.
AA.3.6 Indian Health Care provider payments Indian Health Services are provided under the DHHA contract, and are provided via FFS.
AA.3.7 DSH payments DSH is excluded from the base data.
AA.3.8 FQHC and RHC reimbursement Rate Certification Letter Section 2.03 and 2.05.
AA.3.9 Graduate Medical Education (GME) GME is excluded from the base data.
AA.3.10 Copayments, coinsurance, and deductibles in capitated rates
Rate Certification Letter Section 2.03.
AA.3.11 Medical cost/Trend inflation Rate Certification Letter Section 2.04.
AA.3.12 Utilization adjustments Rate Certification Letter Sections 2.03-2.06 and 2.08.
AA.3.13 Utilization and cost assumptions
The population in the base data is comparable to the population that will be covered in the contract period. See Sections 2.03-2.06 and 2.08.
AA.3.14 Post-Eligibility Treatment of Income (PETI) N/A
AA.3.15 Incomplete data adjustment Rate Certification Letter Section 2.03.
AA.3.16 Primary Care Rate Enhancement Rate Certification Letter Section 2.03 “Sunset of 1202 Physician Fees”.
AA.3.17 Health Homes N/A
Subsection AA. 4 – Establish Rate Category Groupings
AA.4.0 Establish rate category groupings Rate Certification Letter Sections 2.02 and 2.06.

Appendix I. Rate Development Optumas
21 | P a g e
CMS Item #
Subject Compliance HMO SFY17 Rate Comments
AA.4.1 Eligibility categories Rate Certification Letter Sections 2.02 and 2.06.
AA.4.2 Age Rate Certification Letter Sections 2.02 and 2.06.
AA.4.3 Gender Rate Certification Letter Sections 2.02 and 2.06.
AA.4.4 Locality/Region The HMO program only operates in the Denver region so no adjustment is necessary.
AA.4.5 Risk adjustments N/A
Subsection AA. 5 – Data Smoothing, Special Populations and Catastrophic Claims
AA.5.0 Data smoothing
Rate Certification Letter Sections 2.03 “Reinsurance Recoveries”. Reinsurance recoveries were accounted for, to reflect adjustments to high cost claims in the base data.
AA.5.1 Cost-neutral data smoothing adjustment N/A
AA.5.2 Data distortion assessment N/A
AA.5.3 Data smoothing techniques
Rate Certification Letter Section 2.03 “Reinsurance Recoveries”. Reinsurance recoveries were accounted for, to reflect adjustments to high cost claims in the base data.
AA.5.4 Risk-Adjustment N/A
Subsection AA. 6 – Risk Sharing: Stop Loss Limits, Corridors, Reinsurance
AA.6.0 Stop loss, reinsurance, or risk-sharing arrangements
DHHA has a reinsurance contract in place for the HMO population; see Section 2.03 “Reinsurance Recoveries” for more information.
AA.6.1 Commercial reinsurance N/A
AA.6.2 Stop-loss program N/A
AA.6.3 Risk corridor program Rate Certification Letter Section 2.09.
Subsection AA. 7 – Incentive Arrangements
AA.7.0 Incentive arrangements N/A
AA.7.1 Electronic Health Records (EHR) incentive payments
N/A

Appendix I. Rate Development Optumas
22 | P a g e
Appendix I.B: 2016 Managed Care Rate Setting Consultation Guide Checklist
Section Subject HMO SFY17 Rate Comments
Section I. Medicaid Managed Care Rates
General Information
Letter from the certifying actuary Rate Certification Letter Section 3.
Final and certified capitation rates or rate ranges for all rate cells and regions
Appendix II.A.
If rate ranges are certified, assurances that the capitation rate for each rate cell is within the certified rate range
Actuarially Certified at the Capitation Payment Rate
Specific state Medicaid managed care programs covered by certification
Rate Certification Section 1
Rating periods covered by certification Rate Certification Section 1
Medicaid populations covered through managed care programs for which the certification applies
Rate Certification Section 2.02
Any eligibility or enrollment criteria that could have a significant influence on the specific population to be covered within the managed care program
Rate Certification Section 2.02 and 2.06
General description or list of the benefits that are required to be provided by the managed care plan or plans, particularly noting any benefits that are carved out of the managed care program or that are new to the managed care program in that rating period covered
Rate Certification Section 2.02
Data
Types of data used Rate Certification Section 2.02

Appendix I. Rate Development Optumas
23 | P a g e
Section Subject HMO SFY17 Rate Comments
Age or time periods of all data used Rate Certification Section 2.02
Sources of all data used Rate Certification Section 2.02
Description of the data received from subcapitated plans or providers
N/A
Description of how the historical costs related to subcapitated arrangements were developed or verified
N/A
Information related to the availability and the quality of the data used for rate development
Rate Certification Section 2.02
Steps taken by the actuary or others to validate the completeness, quality, and accuracy of the data
Rate Certification Section 2.02. Additionally, utilization was reviewed over time (duration) to ensure no gaps or holes existed in the data.
Summary of the actuary’s assessment of the data
The data was not audited, but was reviewed for consistency, and benchmarked to the data used in prior years’ ratesetting cycles. External provider costs were benchmarked to the reported financial template; while true costs for internal providers were not available, the Medicaid FFS fee schedule was used to reprice the internal providers’ data in lieu of actual costs.
Any other concerns that the actuary has over the availability or quality of the data
In discussions with DHHA, they mentioned that encounter data is complete and accurate. Additionally, as part of the corrective action plan, the Department is currently pursuing a request for funding to contract with an external auditor to focus specifically on increased review of encounter data and financial reporting in Medicaid managed care programs.
If fee-for service claims or managed care encounter data are not used, an
Managed Care Encounter data was used.

Appendix I. Rate Development Optumas
24 | P a g e
Section Subject HMO SFY17 Rate Comments
explanation of why that data was not used and why the data used in the rate development is appropriate for setting capitation rates for the populations and services to be covered
If the managed care program is considered mature and has been in operation for more than three years, but managed care encounter data was not used in the rate development, an explanation of why encounter data was not used as well as any review of the encounter data and the concerns identified which led to not including the encounter data
N/A
If there is any reliance or use of a data book in the rate development, the details of the template and relevant instructions used in the data book
N/A
Rate certification must thoroughly describe any significant adjustments, and the basis for the adjustments, that are made to the data, including but not limited to adjustments for:
(a) Credibility of the data See Appendix I.F. for the weight applied to each year of the base data.
(b) Completion Factors Rate Certification Section 2.03
(c) Errors found in the data Rate Certification Section 2.03
(d) Changes in the program between the time period from which the data is obtained and the rating period
Rate Certification Section 2.05

Appendix I. Rate Development Optumas
25 | P a g e
Section Subject HMO SFY17 Rate Comments
(e) Exclusions of certain payments
or services from the data N/A
Projected benefit costs
Description of the data, assumptions, and methodologies used to develop the projected benefit costs and, in particular, all significant and material items in developing the projected benefit costs
Rate Certification Section 2
Any material changes to the data, assumptions, and methodologies used to develop projected benefit costs since the last certification must be described
Rate Certification Section 2 describes the base data and applicable adjustments as part of the rate development process.
Any data used or assumptions made in developing projected benefit cost trends, including a description of the sources of those data and assumptions
Rate Certification Section 2.04
Methodologies used to develop projected benefit trends
Rate Certification Section 2.04
Any comparisons to historical benefit cost trends, or other program benefit costs trends, that were analyzed as part of the development of the trend for the rating period of the rate certification.
Rate Certification Section 2.04
Projected benefit cost trends separated into changes in price and changes in utilization
Rate Certification Section 2.04
If the actuary did not develop the projected benefit cost trends using price and utilization components, the actuary must describe and justify the method(s)
The projected cost trends while based on reported data, are not purely derived using an empirical methodology. The reported data was used to inform

Appendix I. Rate Development Optumas
26 | P a g e
Section Subject HMO SFY17 Rate Comments
used to develop projected benefit cost trends
the projected cost trends and used in conjunction with the Actuary’s professional judgement.
Projected cost trends may include other components as applicable and used by the actuary in developing rates
Rate Certification Section 2.04
Variations in the projected benefit cost trends by Medicaid populations, rate cells, or subsets of benefits within a category of services
Rate Certification Section 2.04
Any material adjustments to projected benefit cost trends, including a description of the data, assumptions, and methodologies used to determine those adjustments
Rate Certification Section 2.04
Description of any other adjustments to the projected benefit costs trends, including the impact of managed care on the utilization and the unit costs of health care services or changes to projected benefit cost trends in the rating period outside of regular changes in utilization or unit cost of services
Rate Certification Section 2.04
Categories of service that contain in lieu of services
N/A
Percentage of costs that in lieu of services represent in each category of service
N/A
How the in lieu of services were taken into account in the development of the projected benefit costs, and if this approach was different than that for any
N/A

Appendix I. Rate Development Optumas
27 | P a g e
Section Subject HMO SFY17 Rate Comments
of the other services in the categories of service
Describe how retrospective eligibility periods are accounted for in rate development
Any retrospective eligibility adjustments are captured in the eligibility data used to develop the base data; both costs and member months have been included for these time periods.
Clearly document the final projected benefit costs by relevant level of detail
See Appendix I.J.
Clearly document the impact on projected costs for all material changes to covered benefits or services since the last rate certification
Rate Certification Section 2.05
Estimated impact of the change on the amount of projected benefit costs and a description of the data, assumptions, and methodologies used to develop the adjustment.
Rate Certification Section 2.05
Pass Through Payments
Any amount that the State requires a managed care plan to pay providers
N/A
Any amount added by the State or any amount required by the State to be added, to the payments from the plans to the providers that is not included in the contracted payment rates between the plans and the providers for a health care service/benefit
N/A
Description of the pass-through payment
N/A

Appendix I. Rate Development Optumas
28 | P a g e
Section Subject HMO SFY17 Rate Comments
Amount of the pass-through payments, both in total and on a per member per month basis
N/A
Providers receiving the pass-through payments
N/A
Financing mechanism for the pass-through payment
N/A
Amount of pass-through payments made to providers in previous years.
N/A
Description of the supplemental payments
N/A
Total amount of the supplemental payments
N/A
Providers receiving the supplemental payments
N/A
Methodology that the actuary used to incorporate the supplemental payment into the capitation rates
N/A
Payment mechanisms associated with incorporating the supplemental payment into the capitation rates
N/A
Analysis and certification that the payment mechanisms) is consistent with ‘Projection Non-Benefit Costs’
N/A
Projected Non-Benefit Costs
Description of the data, assumptions, and methodologies used to develop the projected non-benefit costs, and in
Optumas utilized administrative costs reported by DHHA in its SFY2014-15 financial template, in conjunction with non-medical loads for similar

Appendix I. Rate Development Optumas
29 | P a g e
Section Subject HMO SFY17 Rate Comments
particular, all significant and material items in developing the projected non-benefit costs
programs/populations in other markets to develop the DHHA non-medical load.
Any material changes to the data, assumptions, and methodologies used to develop projected non-benefit costs since the last rate certification
N/A
Rate certification must thoroughly describe any significant adjustments, and the basis for the adjustments, that are made to the data, including but not limited to adjustments for:
(a) Administrative costs Rate Certification Section 2.07
(b) Care coordination and care
management Rate Certification Section 2.07
(c) Provision for operating or profit
margin Rate Certification Section 2.07
(d) Taxes, fees, and assessments Rate Certification Section 2.07
(e) Other material non-benefit costs Rate Certification Section 2.07
Non-benefit costs developed as a per member per month (PMPM) costs or as a percentage of projected benefit costs or capitation rates
Rate Certification Section 2.07 and Appendix I.J.
Specifically address how Health Insurance Providers Fee (HIPF) is incorporated into capitation rates
The HIPF is not applicable to DHHA’s Medicaid Choice line of business.
If the HIPF is incorporated into the rates in the initial rate certification, an explanation of whether the amount included in the rates is based on the
N/A

Appendix I. Rate Development Optumas
30 | P a g e
Section Subject HMO SFY17 Rate Comments
data year or fee year during the rating period of the rate certification
Description of how the amount of the HIPF was determined, and whether or not any adjustments would be made to the rates once the actual amount of the fee is known
N/A
If the HIPF is not incorporated into the rates in the rate certification because the rates will be adjusted to account for the fee subsequently, an explicit statement that the fee is not included, and a description of when and how the rates will ultimately be adjusted to account for the fee
N/A
If the capitation rates include benefits as described in 26 CFR 57.2(h)(2)(ix), CMS recommends that the per member per month cost associated with those benefits be explicitly reported as a separate amount in the rate certification in order to more accurately account for the appropriate revenue on which the plans will be assessed
N/A
Rate Range Development
Any assumptions for which values vary in order to develop rate ranges
Rate Certification Section 2.08
Values of each of the assumptions used to develop the minimum, the mid-point or best estimate, and the maximum of the rate ranges
Rate Certification Section 2.08

Appendix I. Rate Development Optumas
31 | P a g e
Section Subject HMO SFY17 Rate Comments
Description of the data, assumptions, and methodologies that were used to develop the values of the assumptions for the minimum, the mid-point or best estimate, and the maximum of the rate ranges
Rate Certification Section 2.08
Description of other information related to projected benefit costs
Rate Certification Section 2.08
Risk Mitigation, Incentives and Related Contractual Provisions
Rate certification and supporting documentation must describe any risk mitigation, incentives, or similar contractual provisions that may affect the rates, rate ranges, or the final net payments to the health plans under the applicable contract.
Rate Certification Section 2.09
Risk adjustment model(s) being used to calculate risk scores
N/A
Specific data, including the sources(s) of the data, being used by the risk adjustment model(s)
N/A
Any changes that are made to the risk adjustment model(s)
N/A
How frequently the risk scores are calculated
N/A
How the risk scores are being used to adjust the capitation rates
N/A

Appendix I. Rate Development Optumas
32 | P a g e
Section Subject HMO SFY17 Rate Comments
Attestation that the risk adjustment model is cost neutral. (See 42 CFR 438.6(c)(1)(C)(iii) and 438.6(c)(3)(iv).)
N/A
Reason that there is significant uncertainty about the health status of the population and the need for an acuity adjustment
N/A
Risk adjustment or acuity adjustment model(s) being used to calculate acuity adjustment scores
N/A
Specific data, including the source(s) of the data, being used by the risk adjustment or acuity adjustment model(s)
N/A
Relationship and potential interactions between the acuity adjustment and the risk adjustment
N/A
How frequently the acuity adjustment scores are calculated
N/A
Description of how the acuity adjustment scores are being used to adjust the capitation rates
N/A
Supporting documentation detailing any other risk-sharing arrangements, such as a risk corridor or a large claims pool
Rate Certification Section 2.09
Detailed description of, or citation for, the methodology used to calculate the medical loss ratio
Rate Certification Section 2.09
Description of the consequences for having a medical loss ratio below the minimum requirements
Rate Certification Section 2.09

Appendix I. Rate Development Optumas
33 | P a g e
Section Subject HMO SFY17 Rate Comments
Provide a detailed description of any reinsurance requirements under the contract associated with the rate certification, including a description of any effect that the reinsurance requirements have on the development of the capitation rates
N/A
Certification that the incentive payments will not exceed 105% of the certified rates being paid under the contract
N/A
Description of the percentage of the certified capitation rates being withheld through withhold arrangements
N/A
Estimate of the percentage of the withheld amount through a withhold arrangement that is expected to be returned and the basis for that determination
N/A
Description of any effect that the incentive or withhold arrangements have on the development of the capitation rates
N/A
Other Rate Development Considerations
All adjustments to the capitation rates, or to any portion of the capitation rates, must reflect reasonable, appropriate, and attainable costs in the actuary’s judgment and must be included in the rate certification
Rate Certification Section 3

Appendix I. Rate Development Optumas
34 | P a g e
Section Subject HMO SFY17 Rate Comments
Adjustments to the rates or rate
ranges that are performed outside
of the rate setting process described
in the rate certification are not
considered actuarially sound under
42 CFR §438.6(c)
Rate Certification Section 3
Final contracted rates must either match the capitation rates or be within the rate ranges in the rate certification. This is required in total and for each and every rate cell
Rate Certification Section 3
Section II. Medicaid Managed Care Rates with Long-Term Services and Support
Managed Long-Term Services and support
For managed long-term services and supports (MLTSS) programs, or for programs that include MLTSS as part of the covered benefits, the actuarial rate certification must provide the information described in Section I of this guidance that is specific to MLTSS
N/A
Specifically address the following
considerations for MLTSS programs or
for programs that include MLTSS as part
of the covered benefits:
1) Structure of the capitation rates
and rate cells or rating
categories
2) Structure of the rates and the
N/A

Appendix I. Rate Development Optumas
35 | P a g e
Section Subject HMO SFY17 Rate Comments
rate cells, and the data,
assumptions, and methodology
used to develop the rates in
light of the overall rate setting
approach.
Describe the expected effect that managing LTSS has on the utilization and unit costs of services. The certification must describe any effect that the management of this care is expected to have within each care setting and any effect in managing the level of care that the beneficiary receives
N/A
Projected non-benefit costs, such as administrative costs and care coordination costs, may differ for populations receiving MLTSS from other managed care programs, and the rate certification shall describe how the projected non-benefit costs were developed for populations receiving these services
N/A
Provide information on historical experience, analysis, and other sources used to develop the assumptions used for rate setting
N/A
Section III. New adult population capitation rates
Data
Describe any data used to develop new adult group rates
Rate Certification Section 2.06

Appendix I. Rate Development Optumas
36 | P a g e
Section Subject HMO SFY17 Rate Comments
Any new data that is available for use in 2016 rate setting
Rate Certification Section 2.06
How the state and the actuary followed through on any plans to monitor costs and experience for newly eligible adults
Rate Certification Section 2.06
How actual experience and costs in 2014 and/or 2015 have differed from assumptions and expectations in previous rate certifications
Rate Certification Section 2.06
How differences between projected and actual experience in 2014 and/or 2015 have been used to adjust the 2016 rates
Rate Certification Section 2.06
Projected Benefit Costs
Any data and experience specific to newly eligible adults covered in 2014 and/or 2015 that was used to develop projected benefit costs for capitation rates
Rate Certification Section 2.06
Any changes in data sources, assumptions, or methodologies used to develop projected benefit costs for capitation rates since the last certification
Rate Certification Section 2.06. Since additional data is available for this population (SFY2014-15), more weighting has been given to the more recent data in the rate development process.
How assumptions changed from the 2014 and/or 2015 rate certification on the following issues:
1) Acuity or health status adjustments
2) Pent-up demand 3) Adverse selection 4) Demographics of newly eligible
Rate Certification Section 2.06. Since additional data is available for this population (SFY2014-15), more weighting has been given to the more recent data in the rate development process, which takes into account the more recent underlying enrollment of the population. Since January – June 2014 data is being used in the development of the base data, the same pent-up demand adjustments applied to that time

Appendix I. Rate Development Optumas
37 | P a g e
Section Subject HMO SFY17 Rate Comments
adults 5) Differences in provider
reimbursement rates or provider networks
6) Other material adjustments to newly eligible adults projected benefit costs
period during the SFY2015-16 rates has been applied again. No pent-up demand adjustment has been applied to the SFY2014-15 base data.
Describe any changes to the benefit plan offered to the new adult group
N/A
Describe any other material changes or adjustments to projected benefit costs
Rate Certification Section 2 includes a description of all base data adjustments applied in the development of the SFY2016-17 capitation rates.
Projected Non-Benefit Costs
For states that covered the new adult group in Medicaid managed care plans in 2014 and/or 2015, any changes in data sources, assumptions, or methodologies used to develop projected non-benefit costs since the last rate certification
N/A
How assumptions changed from the 2014 and/or 2015 rate certification on the following issues:
(a) Administrative costs Rate Certification Section 2.07
(b) Care coordination and care
management Rate Certification Section 2.07
(c) Provision for operating or profit
margin Rate Certification Section 2.07
(d) Taxes, fees, and assessments Rate Certification Section 2.07
(e) Other material non-benefit costs Rate Certification Section 2.07

Appendix I. Rate Development Optumas
38 | P a g e
Section Subject HMO SFY17 Rate Comments
Final Certified Rates or Rate Ranges
Comparison to the final certified rates or rate ranges in the previous rate certification
See Appendix II.A.
Description of any other material changes to the capitation rates or the rate development process not otherwise addressed in the other sections of this guidance
N/A
Risk Mitigation Strategies
Describe the risk mitigation strategy specific to the new adult group rates
Rate Certification Section 2.09
Any changes in the risk mitigation strategy from those used during 2014 and/or 2015;
N/A
Rationale for making the change in the risk mitigation strategy
N/A
Any relevant experience, results, or preliminary information available related to the risk mitigation strategy used during 2014 and/or 2015
N/A

Appendix I. Rate Development Optumas
39 | P a g e
Appendix I.C: Base Data
Base Data PMPMs
COA SFY2014-15 MMs1 SFY2013-14 SFY2014-15
AFDC-A-F 98,023 $196.30 $199.51
AFDC-A-M 38,541 $136.33 $147.85
BCKC-A 10,459 $641.13 $581.46
CHILD-C 454,489 $73.99 $71.68
CHILD-U 29,168 $211.02 $246.99
FC 3,454 $213.96 $176.19
OAP-A - N 22,260 $170.34 $188.25
OAP-A - I 1,572 $274.32 $290.40
OAP-B/AND - NN 56,086 $661.63 $670.45
OAP-B/AND - NT 10,513 $84.47 $108.86
OAP-B/AND - IN 1,144 $1,271.78 $1,789.71
OAP-B/AND - IT 521 $128.49 $180.78
Buy-In Disabled Dual 198 $254.37 $107.45
Buy-In Disabled Non-Dual 286 $718.04 $375.93
AwDC 24,752 $348.11 $294.49
AFDC Expansion Adults - F - < 108% FPL 20,550 $149.51 $160.03
AFDC Expansion Adults - M - < 108% FPL 10,212 $144.07 $95.18
AFDC Expansion Adults - F - 109% + FPL 8,378 $120.49 $140.05
AFDC Expansion Adults - M - 109% + FPL 3,788 $165.16 $81.02
Delivery 1,342 $5,666.31 $5,648.68
Total (SFY2014-15 Mix) 794,395 $173.87 $173.72 1 SFY2014-15 membership includes the latest emerging six months of expansion membership annualized. Membership includes partial member months, shown values are rounded.

Appendix I. Rate Development Optumas
40 | P a g e
Appendix I.D: Base Data Adjustments
IBNR Adjustment Factor Reinsurance Adjustment Child-U Cost Correction Hepatitis C Therapy Adjustment
COA SFY2013-14 SFY2014-15 SFY2013-14 SFY2014-15 SFY2013-14 SFY2014-15 SFY2013-14 SFY2014-15
AFDC-A-F 0.9998 0.9839 0.00% -2.53% 0.00% -0.13% 0.55% 0.54%
AFDC-A-M 0.9998 0.9671 -0.45% 0.00% 0.00% 0.00% 0.00% 0.00%
BCKC-A 0.9998 0.9883 0.00% 0.00% -7.36% -12.03% 0.00% 0.00%
CHILD-C 0.9998 0.9832 -0.14% 0.00% -0.26% -0.06% 0.00% 0.00%
CHILD-U 0.9998 0.9822 0.00% -5.78% 10.25% 11.38% 0.00% 0.00%
FC 0.9997 0.9820 0.00% 0.00% 0.00% 0.00% 0.00% 0.00%
OAP-A - N 0.9998 0.9765 0.00% 0.00% 0.00% 0.00% 2.67% 2.79%
OAP-A - I 0.9996 0.9683 0.00% 0.00% 0.00% 0.00% 0.00% 0.00%
OAP-B/AND - NN 0.9998 0.9784 -0.42% -1.95% 0.00% 0.00% 0.90% 0.64%
OAP-B/AND - NT 0.9997 0.9737 0.00% 0.00% -0.01% 0.00% -2.75% 0.00%
OAP-B/AND - IN 0.9997 0.9840 -0.74% 0.00% 0.00% 0.00% 0.05% 0.02%
OAP-B/AND - IT 0.9996 0.9707 0.00% 0.00% 0.00% 0.00% 0.00% 0.00%
Buy-In Disabled Dual 0.9999 0.9954 0.00% 0.00% 0.00% 0.00% 0.00% 0.00%
Buy-In Disabled Non-Dual 0.9995 0.9890 0.00% 0.00% 0.00% 0.00% 0.00% 0.00%
AwDC 0.9997 0.9788 0.00% -0.59% 0.00% 0.00% 0.57% 0.66%
AFDC Expansion Adults - F - < 108% FPL 0.9996 0.9871 0.00% 0.00% 0.00% -0.01% 0.00% 0.00%
AFDC Expansion Adults - M - < 108% FPL 0.9995 0.9763 0.00% 0.00% 0.00% 0.00% 3.69% 5.45%
AFDC Expansion Adults - F - 109% + FPL 0.9996 0.9829 0.00% 0.00% 0.00% 0.00% 0.00% 0.00%
AFDC Expansion Adults - M - 109% + FPL 0.9999 0.9845 0.00% 0.00% 0.00% 0.00% 8.22% 16.50%
Delivery 1.0000 1.0000 0.00% 0.00% 0.00% 0.00% 0.00% 0.00%
Total 0.9998 0.9819 -0.19% -1.23% 0.00% 0.00% 0.46% 0.44%

Appendix I. Rate Development Optumas
41 | P a g e
Appendix I.D: Base Data Adjustments Continued
AFDC Acuity Adjustment 1202 Physician Fee Sunset Pent-Up Demand Factors
COA SFY2013-14 SFY2014-15 SFY2013-14 SFY2014-15 SFY2013-14 SFY2014-15
AFDC-A-F 2.51% 0.00% 0.29% -0.07% 0.00% 0.00%
AFDC-A-M 2.13% 0.00% 0.34% -0.15% 0.00% 0.00%
BCKC-A 0.00% 0.00% 1.76% 0.13% 0.00% 0.00%
CHILD-C 0.00% 0.00% 0.36% 0.02% 0.00% 0.00%
CHILD-U 0.00% 0.00% 0.80% 0.00% 0.00% 0.00%
FC 0.00% 0.00% 0.43% -0.02% 0.00% 0.00%
OAP-A - N 0.00% 0.00% 0.29% 0.08% 0.00% 0.00%
OAP-A - I 0.00% 0.00% 0.02% -0.46% 0.00% 0.00%
OAP-B/AND - NN 0.00% 0.00% 0.14% -0.18% 0.00% 0.00%
OAP-B/AND - NT 0.00% 0.00% 0.37% 0.26% 0.00% 0.00%
OAP-B/AND - IN 0.00% 0.00% 0.13% -0.82% 0.00% 0.00%
OAP-B/AND - IT 0.00% 0.00% 0.10% 0.28% 0.00% 0.00%
Buy-In Disabled Dual 0.00% 0.00% 0.21% 0.26% 0.00% 0.00%
Buy-In Disabled Non-Dual 0.00% 0.00% 0.25% 0.15% 0.00% 0.00%
AwDC 0.00% 0.00% 0.13% -0.14% -2.86% 0.00%
AFDC Expansion Adults - F - < 108% FPL 0.00% 0.00% 0.55% -0.03% 0.00% 0.00%
AFDC Expansion Adults - M - < 108% FPL 0.00% 0.00% 0.29% -0.01% 0.00% 0.00%
AFDC Expansion Adults - F - 109% + FPL 0.00% 0.00% 0.62% -0.11% -4.06% 0.00%
AFDC Expansion Adults - M - 109% + FPL 0.00% 0.00% 0.20% -0.68% -3.83% 0.00%
Delivery 0.00% 0.00% 0.00% 0.00% 0.00% 0.00%
Total 0.44% 0.00% 0.34% -0.08% -0.23% 0.00%

Appendix I. Rate Development Optumas
42 | P a g e
Appendix I.E: Pent-Up Demand
Category of Service Pent-Up Demand
Factors
DME -6.78%
DRUGS -7.52%
EMERGENCY TRANSPORT 0.00%
EMERGENCY ROOM 0.00%
EPSDT 0.00%
FAMILY PLANNING 0.00%
FQHC & RURAL HEALTH -7.52%
HOME HEALTH 0.00%
INPATIENT HOSPITAL 0.00%
LABORATORY AND X-RAY -4.11%
OUTPATIENT HOSPITAL -2.10%
PHYSICIAN -5.43%
OTHER -5.43%

Appendix I. Rate Development Optumas
43 | P a g e
Appendix I.F: Base Data Blend: Non-Expansion
Adjusted Base Data Weighted Base Blend
COA SFY2014-15
MMs SFY2013-14 SFY2014-15 SFY2013-14 SFY2014-15 Blended Base
AFDC-A-F 98,023 $202.94 $198.33 50% 50% $200.64
AFDC-A-M 38,541 $139.11 $152.65 50% 50% $145.88
BCKC-A 10,459 $604.48 $518.22 50% 50% $561.35
CHILD-C 454,489 $73.97 $72.87 50% 50% $73.42
CHILD-U 29,168 $234.55 $263.89 50% 50% $249.22
FC 3,454 $214.94 $179.39 25% 75% $188.28
OAP-A - N 22,260 $175.41 $198.33 25% 75% $192.60
OAP-A - I 1,572 $274.47 $298.53 50% 50% $286.50
OAP-B/AND - NN 56,086 $665.78 $674.93 50% 50% $670.36
OAP-B/AND - NT 10,513 $82.47 $112.09 75% 25% $89.87
OAP-B/AND - IN 1,144 $1,264.94 $1,804.40 75% 25% $1,399.81
OAP-B/AND - IT 521 $128.66 $186.75 50% 50% $157.71
Buy-In Disabled Dual 198 $254.93 $108.23 50% 50% $181.58
Buy-In Disabled Non-Dual 286 $720.20 $380.72 25% 75% $465.59
Delivery 1,342 $5,666.31 $5,648.68 50% 50% $5,657.50
Total Non-Expansion (SFY2014-15 Mix) 726,715 $171.59 $173.34 $172.25

Appendix I. Rate Development Optumas
44 | P a g e
Appendix I.F: Base Data Blend Continued: Expansion Cohorts
Adjusted Base Data Weighted Base Blend
COA SFY2014-15
MMs1 SFY2013-14 SFY2014-15
1H SFY2014-15
2H SFY2013-14 SFY2014-15
1H SFY2014-15
2H Blended Base
PMPM
AwDC 24,752 $340.19 $299.51 $301.41 20% 30% 50% $308.59
AFDC Expansion Adults - F - < 108% FPL 20,550 $149.56 $175.27 $149.34 20% 30% 50% $157.17
AFDC Expansion Adults - M - < 108% FPL 10,212 $149.45 $100.43 $104.92 20% 30% 50% $112.48
AFDC Expansion Adults - F - 109% + FPL 8,378 $115.64 $143.67 $141.43 20% 30% 50% $136.94
AFDC Expansion Adults - M - 109% + FPL 3,788 $171.91 $103.94 $89.56 20% 30% 50% $110.34
Total Expansion (SFY2014-15 Mix) 67,680 $216.31 $201.51 $193.93 $200.68 1 SFY2014-15 membership includes the latest emerging six months of expansion membership annualized

Appendix I. Rate Development Optumas
45 | P a g e
Appendix I.F: Base Data Blend Continued: Final Blended PMPMs
COA SFY2014-15 MMs Blended Base
AFDC-A-F 98,023 $200.64
AFDC-A-M 38,541 $145.88
BCKC-A 10,459 $561.35
CHILD-C 454,489 $73.42
CHILD-U 29,168 $249.22
FC 3,454 $188.28
OAP-A - N 22,260 $192.60
OAP-A - I 1,572 $286.50
OAP-B/AND - NN 56,086 $670.36
OAP-B/AND - NT 10,513 $89.87
OAP-B/AND - IN 1,144 $1,399.81
OAP-B/AND - IT 521 $157.71
Buy-In Disabled Dual 198 $181.58
Buy-In Disabled Non-Dual 286 $465.59
AwDC 24,752 $308.59
AFDC Expansion Adults - F - < 108% FPL 20,550 $157.17
AFDC Expansion Adults - M - < 108% FPL 10,212 $112.48
AFDC Expansion Adults - F - 109% + FPL 8,378 $136.94
AFDC Expansion Adults - M - 109% + FPL 3,788 $110.34
Delivery 1,342 $5,657.50
Total (SFY2014-15 Mix) 794,395 $174.67
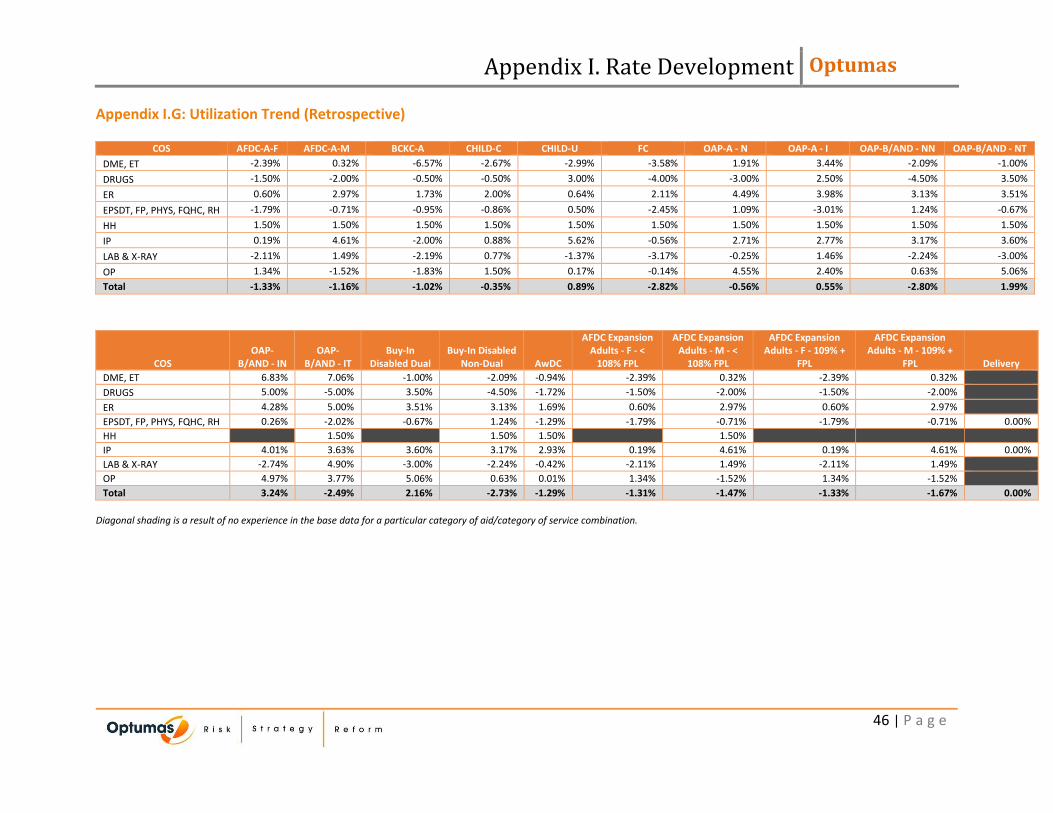
Appendix I. Rate Development Optumas
46 | P a g e
Appendix I.G: Utilization Trend (Retrospective)
COS AFDC-A-F AFDC-A-M BCKC-A CHILD-C CHILD-U FC OAP-A - N OAP-A - I OAP-B/AND - NN OAP-B/AND - NT
DME, ET -2.39% 0.32% -6.57% -2.67% -2.99% -3.58% 1.91% 3.44% -2.09% -1.00%
DRUGS -1.50% -2.00% -0.50% -0.50% 3.00% -4.00% -3.00% 2.50% -4.50% 3.50%
ER 0.60% 2.97% 1.73% 2.00% 0.64% 2.11% 4.49% 3.98% 3.13% 3.51%
EPSDT, FP, PHYS, FQHC, RH -1.79% -0.71% -0.95% -0.86% 0.50% -2.45% 1.09% -3.01% 1.24% -0.67%
HH 1.50% 1.50% 1.50% 1.50% 1.50% 1.50% 1.50% 1.50% 1.50% 1.50%
IP 0.19% 4.61% -2.00% 0.88% 5.62% -0.56% 2.71% 2.77% 3.17% 3.60%
LAB & X-RAY -2.11% 1.49% -2.19% 0.77% -1.37% -3.17% -0.25% 1.46% -2.24% -3.00%
OP 1.34% -1.52% -1.83% 1.50% 0.17% -0.14% 4.55% 2.40% 0.63% 5.06%
Total -1.33% -1.16% -1.02% -0.35% 0.89% -2.82% -0.56% 0.55% -2.80% 1.99%
COS OAP-
B/AND - IN OAP-
B/AND - IT Buy-In
Disabled Dual Buy-In Disabled
Non-Dual AwDC
AFDC Expansion Adults - F - <
108% FPL
AFDC Expansion Adults - M - <
108% FPL
AFDC Expansion Adults - F - 109% +
FPL
AFDC Expansion Adults - M - 109% +
FPL Delivery
DME, ET 6.83% 7.06% -1.00% -2.09% -0.94% -2.39% 0.32% -2.39% 0.32%
DRUGS 5.00% -5.00% 3.50% -4.50% -1.72% -1.50% -2.00% -1.50% -2.00%
ER 4.28% 5.00% 3.51% 3.13% 1.69% 0.60% 2.97% 0.60% 2.97%
EPSDT, FP, PHYS, FQHC, RH 0.26% -2.02% -0.67% 1.24% -1.29% -1.79% -0.71% -1.79% -0.71% 0.00%
HH 1.50% 1.50% 1.50% 1.50%
IP 4.01% 3.63% 3.60% 3.17% 2.93% 0.19% 4.61% 0.19% 4.61% 0.00%
LAB & X-RAY -2.74% 4.90% -3.00% -2.24% -0.42% -2.11% 1.49% -2.11% 1.49%
OP 4.97% 3.77% 5.06% 0.63% 0.01% 1.34% -1.52% 1.34% -1.52%
Total 3.24% -2.49% 2.16% -2.73% -1.29% -1.31% -1.47% -1.33% -1.67% 0.00%
Diagonal shading is a result of no experience in the base data for a particular category of aid/category of service combination.

Appendix I. Rate Development Optumas
47 | P a g e
Appendix I.G: Utilization Trend Continued (Prospective)
COS AFDC-A-F AFDC-A-M BCKC-A CHILD-C CHILD-U FC OAP-A - N OAP-A - I OAP-B/AND - NN OAP-B/AND - NT
DME, ET 2.75% 1.45% 2.75% 1.51% 1.25% 1.25% 3.52% 3.38% 1.92% 0.75%
DRUGS 2.25% 1.83% 2.25% 1.36% 1.25% 0.75% 0.78% 1.89% 0.75% 0.75%
ER 2.25% 1.45% 2.25% 1.51% 1.25% 3.25% 4.52% 3.38% 1.92% 2.25%
EPSDT, FP, PHYS, FQHC, RH 2.25% 0.95% 2.75% 1.51% 0.75% 1.25% 2.03% 2.38% 0.92% 0.75%
HH 2.75% 1.45% 2.75% 1.51% 1.25% 1.25% 2.52% 2.38% 1.42% 1.25%
IP 2.75% 1.95% 2.75% 1.01% 2.75% 1.25% 2.52% 2.38% 0.92% 1.25%
LAB & X-RAY 3.75% 2.95% 3.25% 3.01% 2.75% 3.75% 4.03% 4.88% 1.41% 2.25%
OP 2.25% 1.45% 2.25% 1.51% 1.25% 3.25% 3.52% 3.38% 2.42% 3.25%
Total 2.32% 1.12% 2.56% 1.40% 0.96% 1.36% 2.35% 2.51% 0.96% 1.25%
COS OAP-
B/AND - IN OAP-
B/AND - IT Buy-In
Disabled Dual Buy-In Disabled
Non-Dual AwDC
AFDC Expansion Adults - F - <
108% FPL
AFDC Expansion Adults - M - <
108% FPL
AFDC Expansion Adults - F - 109% +
FPL
AFDC Expansion Adults - M - 109% +
FPL Delivery
DME, ET 2.02% 0.75% 0.75% 2.02% 1.47% 1.34% 2.75% 1.48% 2.75%
DRUGS 2.02% 0.75% 0.75% 1.02% 0.75% 1.22% 2.25% 0.98% 2.25%
ER 2.52% 2.25% 2.25% 2.02% 1.21% 0.84% 2.75% 0.98% 2.75%
EPSDT, FP, PHYS, FQHC, RH 1.52% 0.75% 0.75% 1.02% 0.97% 0.84% 2.25% 0.98% 2.25% 0.00%
HH 1.25% 1.52% 1.47% 2.75%
IP 1.02% 1.25% 1.25% 1.02% 1.78% 1.34% 3.25% 1.48% 3.25% 0.00%
LAB & X-RAY 3.02% 3.75% 2.25% 1.52% 2.71% 2.34% 4.25% 2.48% 4.25%
OP 2.52% 3.25% 3.25% 2.52% 1.21% 0.84% 2.75% 0.98% 2.75%
Total 2.03% 1.08% 1.20% 1.18% 0.94% 1.30% 2.35% 1.03% 2.31% 0.00%
Diagonal shading is a result of no experience in the base data for a particular category of aid/category of service combination.

Appendix I. Rate Development Optumas
48 | P a g e
Appendix I.H: Unit Cost Trend (Retrospective)
COS AFDC-A-F AFDC-A-M BCKC-A CHILD-C CHILD-U FC OAP-A - N OAP-A - I OAP-B/AND - NN OAP-B/AND - NT
DME, ET -2.50% -1.93% 1.19% -2.38% -2.27% -3.53% 0.94% 2.44% 3.39% -2.44%
DRUGS 5.50% 0.00% 2.00% 0.00% 8.00% 3.00% 7.00% 7.00% 7.00% -2.00%
ER -2.18% -0.78% -0.94% -0.63% -0.83% 2.89% 3.89% 6.12% -0.35% 4.43%
EPSDT, FP, PHYS, FQHC, RH 2.94% 1.04% 0.40% 1.69% 3.08% 0.54% 0.94% 6.63% 0.48% 2.68%
HH 1.00% 1.00% 1.00% 1.00% 1.00% 1.00% 1.00% 1.00% 1.00% 1.00%
IP 3.54% 4.47% 1.21% 0.92% -2.05% 0.99% 3.92% -1.59% 3.19% 4.01%
LAB & X-RAY -1.26% -1.13% -2.12% -2.04% -1.15% 0.75% -0.97% -3.90% -0.57% -1.31%
OP 0.94% -1.79% -1.41% -1.23% -1.12% -3.93% 1.98% 2.15% 0.24% -0.78%
Total 2.04% 3.75% 0.31% 1.23% 1.95% 3.23% 6.04% 2.75% 6.46% 1.40%
COS OAP-
B/AND - IN OAP-
B/AND - IT Buy-In
Disabled Dual Buy-In Disabled
Non-Dual AwDC
AFDC Expansion Adults - F - <
108% FPL
AFDC Expansion Adults - M - <
108% FPL
AFDC Expansion Adults - F - 109% +
FPL
AFDC Expansion Adults - M - 109% +
FPL Delivery
DME, ET -2.17% -3.31% -2.44% 3.39% -2.54% -2.50% -1.93% -2.50% -1.93%
DRUGS -1.50% -2.00% -2.00% 7.00% 2.53% 5.50% 0.00% 5.50% 0.00%
ER -3.42% 7.03% 4.43% -0.35% -1.56% -2.18% -0.78% -2.18% -0.78%
EPSDT, FP, PHYS, FQHC, RH 2.06% 4.91% 2.68% 0.48% 2.08% 2.94% 1.04% 2.94% 1.04% 0.00%
HH 1.00% 1.00% 1.00% 1.00%
IP 4.84% 5.22% 4.01% 3.19% 3.89% 3.54% 4.47% 3.54% 4.47% 0.00%
LAB & X-RAY -2.84% -1.33% -1.31% -0.57% -1.25% -1.26% -1.13% -1.26% -1.13%
OP 2.55% -3.39% -0.78% 0.24% -0.80% 0.94% -1.79% 0.94% -1.79%
Total 2.06% 6.20% 2.22% 5.78% 3.45% 2.28% 3.70% 2.21% 1.93% 0.00%
Diagonal shading is a result of no experience in the base data for a particular category of aid/category of service combination.

Appendix I. Rate Development Optumas
49 | P a g e
Appendix I.H: Unit Cost Trend Continued (Prospective)
COS AFDC-A-F AFDC-A-M BCKC-A CHILD-C CHILD-U FC OAP-A - N OAP-A - I OAP-B/AND - NN OAP-B/AND - NT
DME, ET 1.61% 0.35% 2.09% 0.39% 0.11% 0.18% 1.99% 0.94% 0.75% 0.00%
DRUGS 4.75% 4.33% 4.75% 3.86% 3.75% 3.75% 3.78% 4.39% 4.25% 2.75%
ER 1.68% 0.35% 1.67% 0.45% 0.22% 0.19% 1.93% 2.13% 0.29% 0.78%
EPSDT, FP, PHYS, FQHC, RH 1.35% 0.19% 1.30% 0.23% 0.00% 0.00% 1.06% 0.94% 0.15% 0.00%
HH 2.25% 0.95% 2.25% 1.01% 0.75% 0.75% 2.02% 1.88% 0.92% 0.75%
IP 1.65% 0.30% 1.38% 0.25% 0.06% 0.00% 1.22% 1.06% 0.19% 0.00%
LAB & X-RAY 1.25% 0.17% 1.25% 0.38% 0.13% 0.23% 1.06% 0.94% 0.13% 0.00%
OP 1.45% 0.18% 1.84% 0.62% 0.47% 0.28% 1.63% 2.38% 0.37% 0.72%
Total 1.82% 0.98% 1.58% 0.52% 0.62% 0.95% 2.07% 1.57% 1.17% 1.03%
COS OAP-
B/AND - IN OAP-
B/AND - IT Buy-In
Disabled Dual Buy-In Disabled
Non-Dual AwDC
AFDC Expansion Adults - F - <
108% FPL
AFDC Expansion Adults - M - <
108% FPL
AFDC Expansion Adults - F - 109% +
FPL
AFDC Expansion Adults - M - 109% +
FPL Delivery
DME, ET 0.94% 0.00% 0.00% 0.86% 0.35% 0.20% 1.65% 0.34% 1.65%
DRUGS 2.52% 2.25% 2.75% 4.52% 3.25% 3.72% 4.75% 3.48% 4.75%
ER 0.35% 1.37% 0.78% 0.39% 0.39% 0.27% 1.65% 0.41% 1.65%
EPSDT, FP, PHYS, FQHC, RH 0.35% 0.00% 0.00% 0.25% 0.20% 0.08% 1.36% 0.20% 1.36% 0.63%
HH 0.75% 1.02% 0.97% 2.25%
IP 0.24% 0.00% 0.00% 0.29% 0.32% 0.25% 1.59% 0.38% 1.59% 1.84%
LAB & X-RAY 0.23% 0.00% 0.00% 0.23% 0.18% 0.08% 1.25% 0.19% 1.25%
OP 0.46% 0.78% 0.72% 0.47% 0.21% 0.09% 1.36% 0.22% 1.36%
Total 0.52% 0.83% 0.75% 1.49% 0.96% 0.08% 2.29% 0.56% 2.33% 1.68%
Diagonal shading is a result of no experience in the base data for a particular category of aid/category of service combination.

Appendix I. Rate Development Optumas
50 | P a g e
Appendix I.I: Prospective Reimbursement
COA Public Policy/Prospective
Reimbursement (FY16 to FY17) Rx Fill Fee Adjustment Copay Adjustment
AFDC-A-F -0.26% 1.29% 0.00%
AFDC-A-M -0.15% 1.29% -0.90%
BCKC-A -0.55% 0.86% 0.00%
CHILD-C -0.52% 0.71% 0.00%
CHILD-U -0.47% 0.26% 0.00%
FC -0.37% 0.52% 0.00%
OAP-A - N -0.13% 1.85% -0.65%
OAP-A - I 0.00% 0.00% -0.87%
OAP-B/AND - NN -0.11% 2.06% -0.96%
OAP-B/AND - NT -0.10% 1.93% 0.00%
OAP-B/AND - IN -0.01% 0.03% -1.23%
OAP-B/AND - IT -0.01% 0.05% 0.00%
Buy-In Disabled Dual -0.07% 1.40% 0.00%
Buy-In Disabled Non-Dual -0.14% 1.85% -1.00%
AwDC -0.16% 1.83% -0.96%
AFDC Expansion Adults - F - < 108% FPL -0.33% 1.48% 0.00%
AFDC Expansion Adults - M - < 108% FPL -0.20% 2.38% -1.18%
AFDC Expansion Adults - F - 109% + FPL -0.42% 1.44% 0.00%
AFDC Expansion Adults - M - 109% + FPL -0.24% 4.50% -1.72%
Delivery 0.00% 0.00% 0.00%
Total (SFY2014-15 Mix) -0.27% 1.28% -0.41%

Appendix I. Rate Development Optumas
51 | P a g e
Appendix I.J: Non-Medical Load
COA SFY2014-15 MMs1 Medical PMPM Admin Load2 Profit Load2
Non-Medical Load2
Capitation Payment Rate
AFDC-A-F 98,023 $220.75 10.0% 1.0% 11.0% $248.03
AFDC-A-M 38,541 $154.37 10.9% 1.0% 11.9% $175.15
BCKC-A 10,459 $608.97 4.8% 1.0% 5.8% $646.12
CHILD-C 454,489 $76.76 10.8% 1.0% 11.8% $87.06
CHILD-U 29,168 $260.26 11.0% 1.0% 12.0% $295.76
FC 3,454 $197.56 11.0% 1.0% 12.0% $224.50
OAP-A - N 22,260 $215.23 7.0% 1.0% 8.0% $233.95
OAP-A - I 1,572 $313.02 7.0% 1.0% 8.0% $340.23
OAP-B/AND - NN 56,086 $718.30 9.1% 1.0% 10.1% $798.78
OAP-B/AND - NT 10,513 $98.20 10.3% 1.0% 11.3% $110.65
OAP-B/AND - IN 1,144 $1,512.65 6.6% 1.0% 7.6% $1,636.51
OAP-B/AND - IT 521 $166.79 7.8% 1.0% 8.8% $182.78
Buy-In Disabled Dual 198 $195.44 10.3% 1.0% 11.3% $220.21
Buy-In Disabled Non-Dual 286 $497.88 9.1% 1.0% 10.1% $553.63
AwDC 24,752 $323.33 7.0% 1.0% 8.0% $351.34
AFDC Expansion Adults - F - < 108% FPL 20,550 $163.54 12.7% 1.0% 13.7% $189.48
AFDC Expansion Adults - M - < 108% FPL 10,212 $124.74 11.8% 1.0% 12.8% $142.97
AFDC Expansion Adults - F - 109% + FPL 8,378 $142.90 12.6% 1.0% 13.6% $165.32
AFDC Expansion Adults - M - 109% + FPL 3,788 $123.95 11.8% 1.0% 12.8% $142.07
Delivery 1,342 $5,849.71 4.3% 1.0% 5.3% $6,179.04
Total (SFY2014-15 Mix) 794,395 $186.15 9.3% 1.0% 10.3% $207.62 1 SFY2014-15 membership includes the latest emerging six months of expansion membership annualized. 2 Non-Medical Load at Capitation Payment Rate

Appendix II. SFY17 Rates Optumas
52 | P a g e
Appendix II. SFY17 Rates THIS PAGE LEFT INTENTIONALLY BLANK

Appendix II. SFY17 Rates Optumas
53 | P a g e
Appendix II.A: DHHA Rates – Detailed Rating Cohorts
COA SFY2014-15 MMs1 Capitation Payment Rate
AFDC-A-F 98,023 $248.03
AFDC-A-M 38,541 $175.15
BCKC-A 10,459 $646.12
CHILD-C 454,489 $87.06
CHILD-U 29,168 $295.76
FC 3,454 $224.50
OAP-A - N 22,260 $233.95
OAP-A - I 1,572 $340.23
OAP-B/AND - NN 56,086 $798.78
OAP-B/AND - NT 10,513 $110.65
OAP-B/AND - IN 1,144 $1,636.51
OAP-B/AND - IT 521 $182.78
Buy-In Disabled Dual 198 $220.21
Buy-In Disabled Non-Dual 286 $553.63
AwDC 24,752 $351.34
AFDC Expansion Adults - F - < 108% FPL 20,550 $189.48
AFDC Expansion Adults - M - < 108% FPL 10,212 $142.97
AFDC Expansion Adults - F - 109% + FPL 8,378 $165.32
AFDC Expansion Adults - M - 109% + FPL 3,788 $142.07
Delivery 1,342 $6,179.04
Total (SFY2014-15 Mix) 794,395 $207.62 1 SFY2014-15 membership includes the latest emerging six months of expansion membership annualized

Appendix II. SFY17 Rates Optumas
54 | P a g e
Appendix II.A: DHHA Rates Continued – Final Rating Cohorts and Rate Change
COA1 SFY2014-15 MMs SFY2016-17 Capitation
Payment Rate2 SFY2015-16 Capitation
Payment Rate3 Percent Change
AFDC-A-F 98,023 $248.03 $263.02 -5.7%
AFDC-A-M 38,541 $175.15 $173.08 1.2%
BCKC-A 10,459 $646.12 $689.23 -6.3%
CHILD-C 454,489 $87.06 $87.06 0.0%
CHILD-U 29,168 $295.76 $251.59 17.6%
FC 3,454 $224.50 $174.97 28.3%
OAP-A 23,832 $240.96 $240.96 0.0%
OAP-B/AND - N 57,516 $814.23 $813.00 0.2%
OAP-B/AND - T 11,232 $115.93 $107.64 7.7%
AwDC 24,752 $351.34 $350.09 0.4%
AFDC Expansion Adults - F 28,928 $182.48 $182.48 0.0%
AFDC Expansion Adults - M 14,000 $142.72 $183.28 -22.1%
Delivery 1,342 $6,179.04 $6,179.04 0.0%
Total (SFY2014-15 Mix) 794,395 $207.62 $208.57 -0.5% 1 SFY2014-15 membership includes the latest emerging six months of expansion membership annualized 2 Institutional and Non-Institutional members receive the same payment rate; additionally, Buy-In members are rolled into the OAP-B/AND cohorts. AFDC Expansion cohorts receive the same payment rate regardless of FPL 3 Final Capitation Payment for the SFY2015-16 contract period


![SOLICITATION, OFFER, 1. SOLICITATION NUMBER TYPE OF ... · 1. SOLICITATION NUMBER TYPE OF SOLICITATION 19HK3018Q0020 2. SEALED BID (IFB) [x] NEGOTIATED (RFQ) 3. DATE ISSUED April](https://img.dokumen.tips/doc/110x75/5fac2e7772e8aa5c9f6b4dc6/solicitation-offer-1-solicitation-number-type-of-1-solicitation-number-type.jpg)