Embed Size (px)
Citation preview

Project Number: SJR Tracking Code: TC0623-SEAF-SJR-1059
Requested by: Jeremy Wooldridge Date: 05/20/2008 Product Rev: D (SEAF), C (SEAM)
Part #: SEAF-50-5.0-S-10-2-A/ SEAM-50-2.0-S-10-2-A SEAF-50-6.5-S-10-1-A/ SEAM-50-3.5-S-10-1-A SEAF-50-6.5-S-10-2-A/ SEAM-50-3.5-S-10-2-A
Lot #: Tech: Troy Cook Eng: Dave Scopelliti
Part description: Single Ended Array Female/ Single Ended Array Male Qty to test: 96
Test Start: 10/23/2006 Test Completed: 04/23/2007
Revision 02 1 of 18 7/21/2008
SOLDER JOINT RELIABILITY TEST SUMMARY
Solder Joint Reliability Summary Report
PART DESCRIPTION
SEAF-50-5.0-S-10-2-A mated with SEAM-50-2.0-S-10-2-A SEAF-50-6.5-S-10-1-A mated with SEAM-50-3.5-S-10-1-A SEAF-50-6.5-S-10-2-A mated with SEAM-50-3.5-S-10-2-A

Tracking Code: TC0623-SEAF-SJR-1059 Part #: SEAF/ SEAM Part description: Single Ended Array
Revision 02 2 of 18 7/21/2008
CERTIFICATION
All instruments and measuring equipment were calibrated to National Institute for Standards and Technology (NIST) traceable standards according to IS0 10012-l and ANSI/NCSL 2540-1, as applicable. All contents contained herein are the property of Samtec. No portion of this report, in part or in full shall be reproduced without prior written approval of Samtec. SCOPE To perform the following tests: Solder Joint Reliability and life expectancy predictions via Thermal Cycling of Tin-Silver-Copper (SAC) and Tin-Lead (SnPb). SAMPLES TESTED Three groups of SEAF/SEAM connectors were evaluated with stack heights of 7 or 10 mm:
• Group A: SAC, 7 mm stack (SEAF 5.0 mm + SEAM 2.0 mm) • Group C: SAC, 10 mm stack (SEAF 6.5 mm + SEAM 3.5 mm) • Group D: SnPb, 10 mm stack (SEAF 6.5 mm + SEAM 3.5 mm)
RELIABILITY PROJECTIONS
1. Life expectancy is calculated for field service conditions of 25ºC to 45ºC and 25ºC to 55ºC cycles based on lower bound values of Weibull parameters.
2. Field use cycles are calculated at 6 (Cycles/Day) x 365.25 (Days/Year) = 2191.5 Cycles/Year.
TABLE 1a: Reliability projections under field use condition for Groups C & D (10mm mated pairs).
TABLE 1b: Reliability projections under field use condition for Groups C & D (10mm mated pairs).
Condition: 25ºC to 55ºC, 6 cycles/day Group C
SACGroup D
SnPb
56 years 11.38 years Years to 0.01% Failed
Condition: 25ºC to 45ºC, 6 cycles/day Group C
SACGroup D
SnPb
100+ years 99 years Years to 0.01% Failed

Tracking Code: TC0623-SEAF-SJR-1059 Part #: SEAF/ SEAM Part description: Single Ended Array
Revision 02 3 of 18 7/21/2008
TABLE 2a: Reliability projections under field use condition for Group A (7mm mated pairs).
TABLE 2b: Reliability projections under field use condition for Group A (7mm mated pairs).
Condition: 25ºC to 55ºC, 6 cycles/day Group A
SAC56 years Years to 0.01% Failed
Condition: 25ºC to 45ºC, 6 cycles/day Group A
SAC
100+ years Years to 0.01% Failed

Tracking Code: TC0623-SEAF-SJR-1059 Part #: SEAF/ SEAM Part description: Single Ended Array
Revision 02 4 of 18 7/21/2008
APPLICABLE DOCUMENTS • Industry Standard: IPC-9701A • Clech, J-P., "Acceleration factors and thermal cycling test efficiency for lead-free Sn-Ag-Cu assemblies", Proceedings,
SMTA International Conference, Chicago, IL, Sept. 25-29, 2005, pp. 902-917. • Clech, J-P., "An obstacle-controlled creep model for Sn-Pb and Sn-based lead-free solders", Proceedings, SMTA
International Conference, Chicago, IL, September 26-28, 2004. • Clech, J-P., “Review and Analysis of Lead-Free Solder Material Properties”, NIST report, on-line version can be viewed
under NIST's Metallurgy Division web site: http://www.metallurgy.nist.gov/solder/clech/ • Clech, J-P., “Solder Reliability Solutions: a PC-based design-for-reliability tool”, Proceedings, Surface Mount International
Conference, Sept. 8-12, 1996, San Jose, CA, Vol. I, pp. 136-151. Also in Soldering and Surface Mount Technology, Wela Publications, British Isles, Vol. 9, No. 2, July 1997, pp. 45-54.

Tracking Code: TC0623-SEAF-SJR-1059 Part #: SEAF/ SEAM Part description: Single Ended Array
Revision 02 5 of 18 7/21/2008
TEST SAMPLES AND PREPARATION Sample preparation was performed in accordance with paragraph 4.2.3.1 and 4.3.1 of IPC-9701A and the following test conditions:
1) All materials were manufactured in accordance with the applicable product specification. 2) All test samples were identified and encoded to maintain traceability throughout the test sequences. 3) All components were preconditioned prior to soldering at 125 C for 24 hours. 4) All test PCB’s were preconditioned prior to soldering at 105 C for 24 hours. 5) All samples tested were preconditioned after soldering prior to testing at 100 C for 24 hours. 6) Samtec Test PCBs used: PCB-100504-TST-0X (IS410), IS410, 0.093 inches thick, 6-layer with 70 Cu
coverage on layers 2 and 4, 40% Cu coverage on layers 3 and 5. The pads are finished with Electroless Nickel Immersion Gold.
TEST BOARD ASSEMBLY
FIGURE 1: Soldering profile for SnPb samples.

Tracking Code: TC0623-SEAF-SJR-1059 Part #: SEAF/ SEAM Part description: Single Ended Array
Revision 02 6 of 18 7/21/2008
FIGURE 2: Soldering profile for SAC samples.
1) SnPb samples used Kester HM531 Type 3 Solder Paste containing Sn63 Pb37, 90% metal, 325 mesh. 2) SAC samples used Kester R520A Type 3 Solder Paste containing Sn96.5 Ag3.0 Cu0.5, 89.5% metal, 325
mesh. 3) For both SnPb and SAC, stencil thickness was 0.006 inches with aperture diameter of 0.04 inches.

Tracking Code: TC0623-SEAF-SJR-1059 Part #: SEAF/ SEAM Part description: Single Ended Array
Revision 02 7 of 18 7/21/2008
THERMAL CYCLING: Thermal Cycling was performed in accordance with Table 4-1 of IPC-9701A and the following test conditions:
1) Thermal Limits: Low Temperature = 0° C +0/- 3° C; High Temperature = 100° C + 5/- 0° C 2) Dwell Time at Thermal Limits: Ten (10) minutes 3) Ramp Time to Thermal Limits: Ten (10) minutes
FIGURE 3: Accelerated thermal cycling profile. Figure 3 above is a picture of a Thermotron 2 hour temperature graph. Thermocouples are placed in the air of the chamber and attached to PCB on 5 random samples. The solid line represents the chamber air temperature and the dotted line represents the temperature on a sample.

Tracking Code: TC0623-SEAF-SJR-1059 Part #: SEAF/ SEAM Part description: Single Ended Array
Revision 02 8 of 18 7/21/2008
CONFIGURATION
FIGURE 4: Groups A, C, & D consists of 32 mounted mated pair samples each. Group B was mounted but not tested. Signal routing is daisy-chained through all positions on each sample facilitating 100% contact monitoring. EVENT DETECTION:
1) Events are established in accordance with Paragraph 4.3.3.3 of IPC-9701A and Table 4-4. 2) An event is defined as a Signal Interruption exceeding 1000 Ω lasting for greater than 200 nanoseconds.
FAILURE CRITERIA:
1) Failures were established in accordance with Paragraph 4.3.3.3 of IPC-9701A and Table 4-4 2) A failure was defined as 10 events within an elapsed time of 10% of the thermal cycles to the initial
event. I.e. if the first event happens at cycle 1000, 9 more events need to happen by cycle 1100. 3) Thermal Cycling was terminated when ≥62% of the product fails or 6000 cycles are completed. This test
was stopped at 5929 cycles because the cooling compressor on the Thermotron chamber failed at that cycle.

Tracking Code: TC0623-SEAF-SJR-1059 Part #: SEAF/ SEAM Part description: Single Ended Array
Revision 02 9 of 18 7/21/2008
FLOWCHART
FIGURE 5: Flowchart for SJR test.
32 mated assemblies 32 mated assemblies 32 mated assembliesTEST GROUP A (SE Array) GROUP C (SE Array) GROUP D (SE Array) STEP Lead-Free Paste Lead-Free Paste Leaded Paste
IPC-9701A, 32 samples IPC-9701A, 32 samples IPC-9701A, 32 samples10 Min Ramp 10 Min Ramp 10 Min Ramp
10 Min dwell at T-Limits 10 Min dwell at T-Limits 10 Min dwell at T-Limits
01 Etch ID# on each component Etch ID# on each component Etch ID# on each component
02 Component Conditioning Component Conditioning Component Conditioning
03 PCB Conditioning PCB Conditioning PCB Conditioning
04 Solder components to PCB's Solder components to PCB's Solder components to PCB's
05 Assembly Conditioning Assembly Conditioning Assembly Conditioning
06 X-Ray Analysis of Assemblies X-Ray Analysis of Assemblies X-Ray Analysis of Assemblies
07 Mate and # mated assemblies Mate and # mated assemblies Mate and # mated assemblies
08 Measure assembly resistance Measure assembly resistance Measure assembly resistance
09 Solder lead wires to assemblies Solder lead wires to assemblies Solder lead wires to assemblies
10 Orient samples in test chamber Orient samples in test chamber Orient samples in test chamber
11Measure assembly resistance -
through cable/connectorMeasure assembly resistance -
through cable/connectorMeasure assembly resistance -
through cable/connector
12 Begin thermal cycling Begin thermal cycling Begin thermal cycling
13 Start event detection Start event detection Start event detection
14 Cycle chamber 6000x Cycle chamber 6000x Cycle chamber 6000x
15Measure assembly resistance -
through cable/connectorMeasure assembly resistance -
through cable/connectorMeasure assembly resistance -
through cable/connector
16Cross-Section Analysis of 3 samples
from each group Cross-Section Analysis of 3 samples
from each groupCross-Section Analysis of 3 samples
from each group
Thermal Cycling for SJR (0 - 100 degrees C)

Tracking Code: TC0623-SEAF-SJR-1059 Part #: SEAF/ SEAM Part description: Single Ended Array
Revision 02 10 of 18 7/21/2008
RESULTS
Group A (SAC, 7 mm stack assemblies): Four failures out of 32 monitored daisy chains at 5929 test cycles Failure Percentage ------------------------------------------------------12.5%
• Failure#1--------------------------------------------------------4919 • Failure#2--------------------------------------------------------5027 • Failure#3--------------------------------------------------------5470 • Failure#4--------------------------------------------------------5752
The Weibull shape parameter was determined using the same β as for SnPb assembly, i.e. β = 4.736 Characteristic life was then estimated from Weibull equation: % Fail at 1st failure = 1/32 = 1-exp[ -(6917 / α )^4.736 ] which gives α = 14,331 . Group C (SAC, 10 mm stack assemblies): One failure out of 32 monitored daisy chains at 5929 test cycles Failure Percentage ------------------------------------------------------3.1%
• Failure#1--------------------------------------------------------2666
Two-parameter Weibull analysis of failure cycles gives: Characteristic life: α = Cycles to 63.2% Failures = 11270 cycles Shape parameter (slope of Weibull distribution): β = 4.736 Group D (SnPb, 10 mm stack assemblies): Two failure out of 32 monitored daisy chains at 5929 test cycles Failure Percentage ------------------------------------------------------6.3%
• Failure#1--------------------------------------------------------4254 • Failure#2--------------------------------------------------------5691
Two-parameter Weibull analysis of failure cycles gives: Characteristic life: α = Cycles to 63.2% Failures = 11270 cycles Shape parameter (slope of Weibull distribution): β = 4.736
Tracking Code: TC0623-SEAF-SJR-1059 Part #: SEAF/ SEAM Part description: Single Ended Array
Revision 02 11 of 18 7/21/2008
DETERMINING ACCELERATION FACTOR The acceleration factors were determined in Calculations for Solder Joint Reliability Summary Report, which is located in the same Mechanical Test Reports section as this report. MEASURED PATH RESISTANCES OF SAMPLES
Minimum 3.6 0.0 0.2Maximum 4.6 0.7 22.0Average 4.15 0.2 5.7St. Dev. 0.26 0.17 10.85
Group A Path Resistances, Ω
Before TestΔ Passed Samples
Δ Failed Samples
Minimum 4.2 0.0 0.0Maximum 4.8 0.6 23.8Average 4.45 0.25 11.9St. Dev. 0.16 0.15 16.83
Group D Path Resistances, Ω
Before TestΔ Passed Samples
Δ Failed Samples
Minimum 3.8 0.0 0.1Maximum 4.7 0.4 0.1Average 4.34 0.1 0.1St. Dev. 0.23 0.10 N/A
Group C Path Resistances, Ω
Before TestΔ Passed Samples
Δ Failed Samples
FIGURE 7: Path resistances of daisy-chained samples through 18 ft. lead wires.

Tracking Code: TC0623-SEAF-SJR-1059 Part #: SEAF/ SEAM Part description: Single Ended Array
Revision 02 12 of 18 7/21/2008
CROSS SECTION ANALYSIS
1. Cross sectional metallographic evaluation was performed on all 3 groups of SJR samples. Revealing the microstructure of the solder joints depicts the cracks that caused failures in samples.
2. Cross sections were taken on: i. Group A: Three failure samples of SAC, 7 mm stack
ii. Group C: One failure and two passing samples of SAC, 10 mm stack iii. Group D: Two failures and one passing sample of SnPb, 10 mm stack
FIGURE 8: Sectioning pattern used for Metallographic Evaluation

Tracking Code: TC0623-SEAF-SJR-1059 Part #: SEAF/ SEAM Part description: Single Ended Array
Revision 02 13 of 18 7/21/2008
FIGURE 9: Photomicrograph showing failed solder joint of Sample #42, Row 1 (7mm Lead-free, failed)
FIGURE 10: Photomicrograph showing failed solder joint of Sample #44, Row 1 (7mm Lead-free, failed)

Tracking Code: TC0623-SEAF-SJR-1059 Part #: SEAF/ SEAM Part description: Single Ended Array
Revision 02 14 of 18 7/21/2008
FIGURE 11: Photomicrograph showing failed solder joint of Sample #48, Row 1 (7mm Lead-free, failed)
FIGURE 12: A partial crack showing on a passed solder joint of Sample #81, Row 1 (10mm Lead, passed)

Tracking Code: TC0623-SEAF-SJR-1059 Part #: SEAF/ SEAM Part description: Single Ended Array
Revision 02 15 of 18 7/21/2008
FIGURE 13: Photomicrograph showing on a failed solder joint of Sample #99, Row 1 (10mm Lead, failed)
FIGURE 14: Photomicrograph showing on a failed solder joint of Sample #105, Row 1 (10mm Lead, failed)

Tracking Code: TC0623-SEAF-SJR-1059 Part #: SEAF/ SEAM Part description: Single Ended Array
Revision 02 16 of 18 7/21/2008
FIGURE 15: Photomicrograph showing a solder joint of Sample #123, Row 1 (10mm Lead-free, passed)
FIGURE 16: Photomicrograph showing a solder joint of Sample #129, Row 1 (10mm Lead-free, failed)

Tracking Code: TC0623-SEAF-SJR-1059 Part #: SEAF/ SEAM Part description: Single Ended Array
Revision 02 17 of 18 7/21/2008
FIGURE 17: Photomicrograph showing a solder joint of Sample #148, Row 1 (10mm Lead-free, passed)
Tracking Code: TC0623-SEAF-SJR-1059 Part #: SEAF/ SEAM Part description: Single Ended Array
Revision 02 18 of 18 7/21/2008
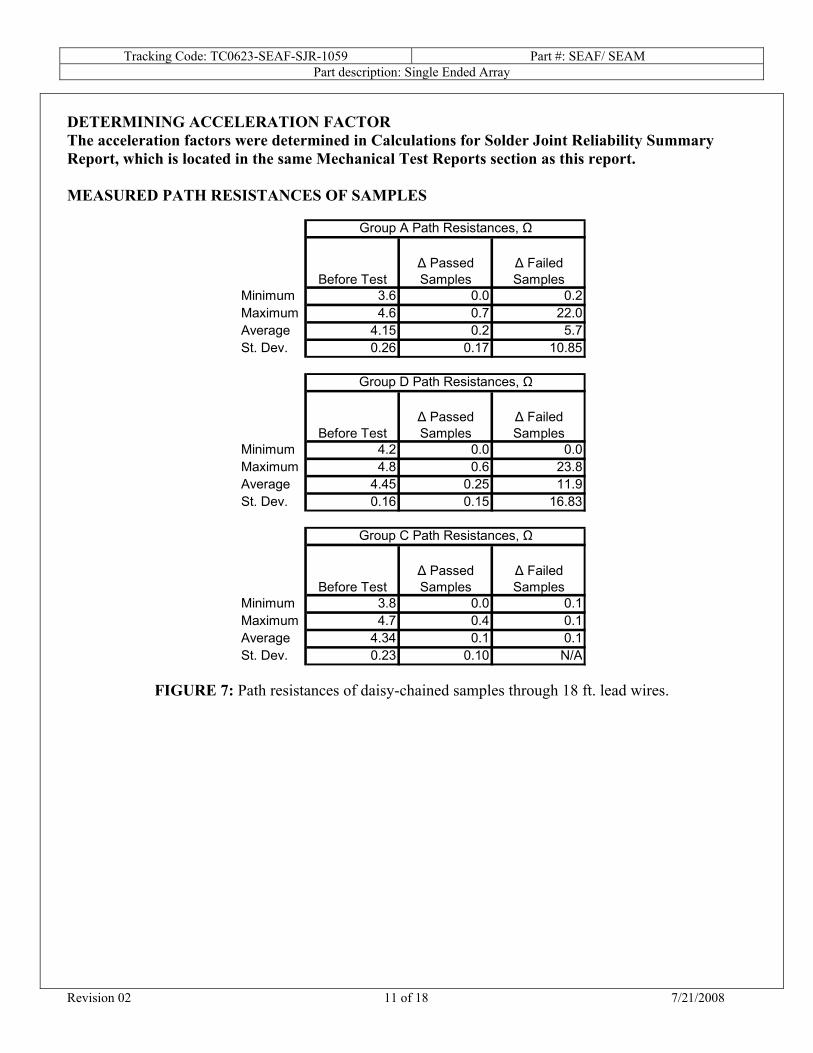
EQUIPMENT AND CALIBRATION SCHEDULES
Equipment #: MM-01 Description: Digital Multimeter Manufacturer: Fluke Model: 87 III Serial #: 74660176 Accuracy: See Manual … Last Cal: 06/14/07, Next Cal: 06/14/08 Equipment #: THC-02 Description: Temperature/Humidity Chamber Manufacturer: Thermotron Model: SE-1000-6-6 Serial #: 31808 Accuracy: See Manual … Last Cal: 09/21/07, Next Cal: 09/21/08 Equipment #: ED-01 Description: STD Series Event Detector Manufacturer: Analysis Tech Model: 256 Serial #: 1010425 Accuracy: See manual … Last Cal: 06/18/07, Next Cal: 06/18/08 …