Embed Size (px)
Citation preview

Solar Reduction of CO2
Group 9
Ore-ofe AdesinaKemi HarrisJohn Long
Amy RobertsonShane Steagall
Project Goals
Develop a process that uses solar energy to reduce
CO2 to CO and O2
Produce Viable Products
Determine Applicability for Mars Exploration
IntroductionCO2 Emissions
Global Warming
Changes global climate
Melting of polar ice caps
Acidification of the oceans

IntroductionCO2 Emissions
16.8% increase in CO2
constant increase since 1991

IntroductionCO2 Emissions
CO2 SourceIndustryEnergy
U.S.A. Largest Producer

BackgroundCO2 Mitigation Strategies
Solar Reduction of CO2
Sequestration
Artificial Rock Weathering
“Scrubbing” the Atmosphere

Background Solar Reduction
Uses solar energy to convert CO2 to CO and O2
Reduces the amount of CO2 entering the atmosphereMarketable Products
COO2
Energy

Process Overview
CO TO SALE
CO2PURIFICATION
SYSTEM
REACTORSYSTEM
COOLING/RECOVERY
COPURIFICATION
SYSTEM
SPLITTER
FLUE GAS FEED
CO2 TO SALE
CO2 QUENCH STREAM
VENT GAS TO STACK

CO2 Purification
Reactor SystemCooling/Energy Production
CO PurificationCO2 To Sale & Quench

Process LocationSan Juan Power Plant CO2 emissions from plant
Farmington, NM ~14.5 MM-ton/yr

Purification SystemTypical flue gas from coal fired boilers (dry basis):
81% Nitrogen14 % Carbon dioxide (0.3 <pp<0.15 bar)5% OxygenTrace impurities SOx (300-5000 ppmv), NOx, Fly ash
Pure CO2 feed stream is needed for reaction process
Process DesignPurification System
Produces 120 tons CO2/day
Fly Ash Removal
Removal of NOx & SOx
Purification of CO2

Process DesignPurification System
Fly Ash Removal
Electrostatic Precipitator
Uses Electrostatic Charge

Process DesignPurification System
NOx Removal
SCR DENOX(Haklor Topsoe) Process
Catalytic reduction of NOx with NH3
4NO + 4NH3 + O2 → 4N2 + 6H2O
6NO2 + 8NH3 → 7N2 + 12H2O

Process DesignPurification System
SOx RemovalUtilizes Alkaline Compounds
Lime slurrySoda ashKOH or NaOH
Can reduce SOx to < 10 ppmv

Process DesignPurification System
CO2 Purification MethodsMembranes
Adsorption with Molecular Sieves
Cryogenic Processing
Ca(OH)2/Mg(OH)2 Scrubbing
Amine Scrubbing

Process DesignPurification System
MembranesRequire Additional Compression (Capital Cost)Do Not Produce High Purity Products
AdsorptionUse Molecular Sieves to Trap GasRegenerate ProductHigh Energy RequirementsLow Product Purity

Process DesignPurification System
Cryogenic Processing CO2 separated by distillationHigh energy requirementsLiquid CO2 product
Ca(OH)2/Mg(OH)2 ScrubbingCompounds React Reversibly With CO2
Both Compounds React Similarly With SO2
Unproven on an Industrial Scale

Amine Separation Process

Process DesignPurification System
AMINE SCRUBBING- (Absorption/ Stripping)
AbsorberCH3CH2OHNH2 + CO2 ↔CH3CH2OHNHCOO- + H+
(MEA) (Carbamate)
Econamine FG solvent30 wt. % MEA solution85-95% CO2 recovery

Process DesignPurification System
Stripper
CO2 regenerated
CH3CH2OHNHCOO- + H2O ↔ CH3CH2OHNH2 +HCO3
Product purity 99.95%

Process DesignPurification System
Provided by The Wittemann Company
Produces 120 tons CO2 /day
Capital Cost: $3.3 million
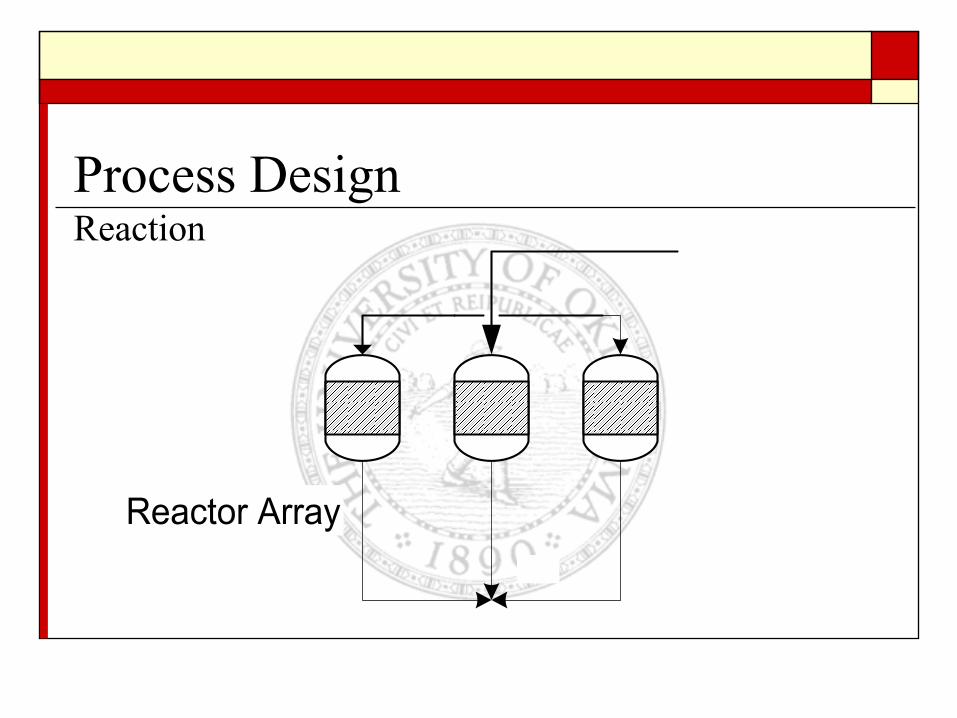
Process DesignReaction

Process DesignReaction
∆HR=1.2167x10⁵BTU/lb-mol
Ea = 1.44x10⁵ BTU/lb-mol
Extremely High Temperatures Required
22 O21COheathv&CO +↔+

Process DesignPrototype Reactor
Renewable Energy Corporation SOLAREC
Mirrors, Core, and Support10 L/min flow of CO2
6% Conversion

Process DesignReactor Scale Up
Optimize ReactorsMinimize CapitalIntensive Properties
TemperaturePressure
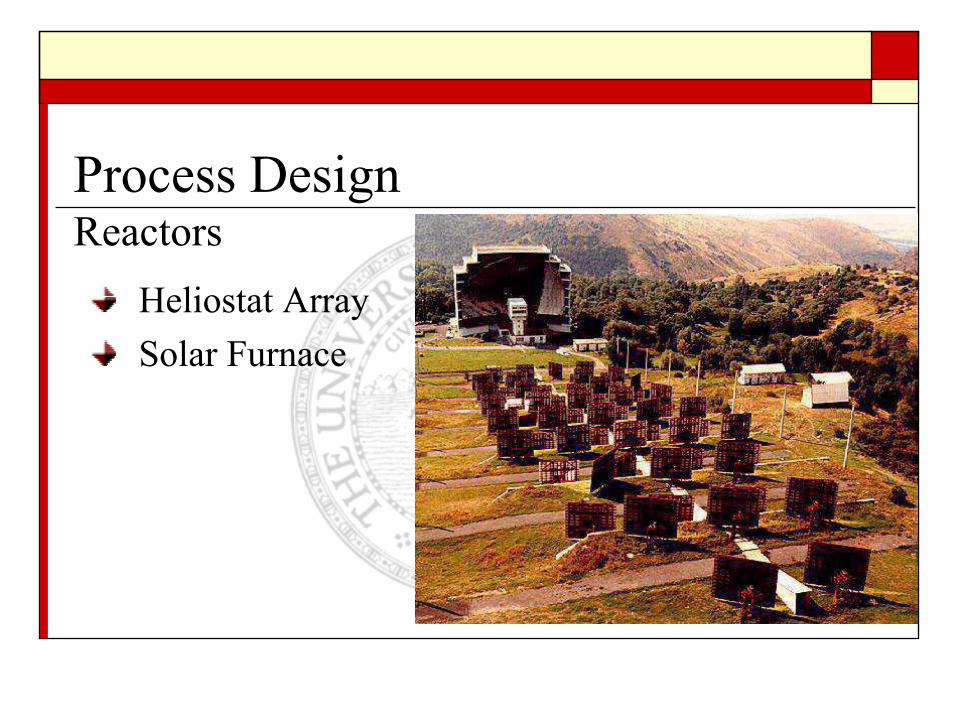
Process DesignReactors
Heliostat ArraySolar Furnace

Process DesignReactor Scale Up
Limitations
Physical Size
Reflective Surface Area (121 m2)
Support Height (7.3 m)

Process DesignScale Up Assumptions
Suns Rays are ParallelMirror is Spherical

Process DesignScale Up Assumptions

Process DesignScale Up Proportions
A = π · R· hEnergyRadiant A ∝
Rate Flow EnergyRadiant ∝
Volume CorePressure∝Volume Core Flowrate∝
Process DesignReactor Cost
90% ~ Reflective Surface10% ~ Unit and StructureOptimum Conditions
Maximum SizeMinimum Units

Process DesignReactor Cost
Optimum Conditions121 m2 Surface Area28 Reactor Units$3.64M for System
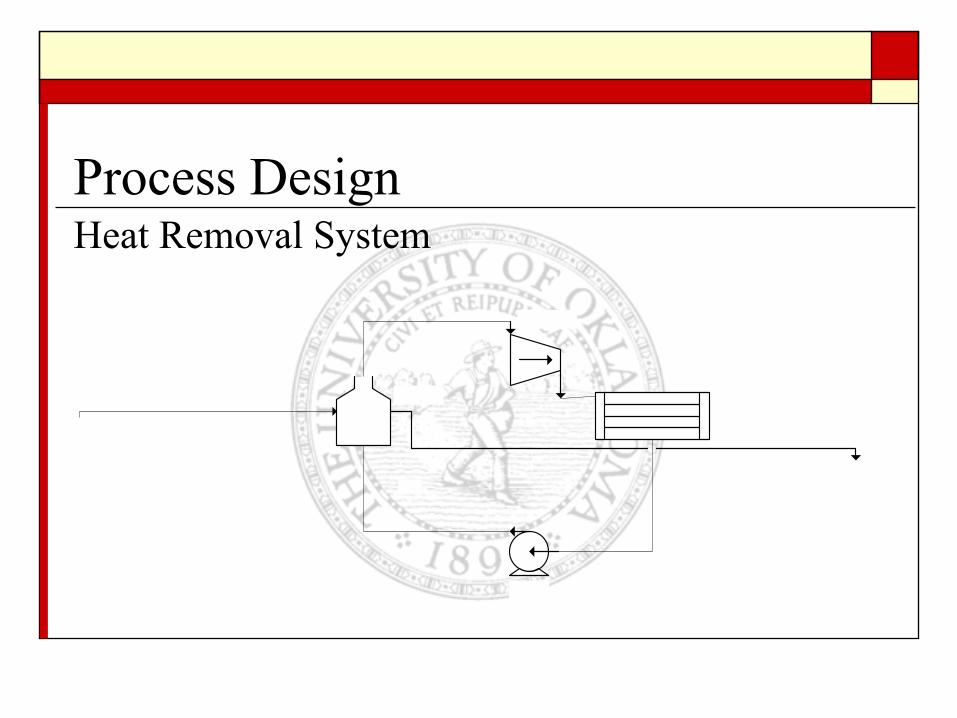
Process DesignHeat Removal System

Process Design
Process stream leaves reactor at ~1350 oF
COSORB requires stream at 85 oF
Use energy to produce steam
Thermal Energy

Q=
Heat Transfer Equations
Process Design
)( 44walli TTA −εσ
Q=
Q=
xTKA∂∂**
ThA ∂**
Radiation
Conduction
Convection

1=++ ταρ
Process DesignCharacteristics of radiation
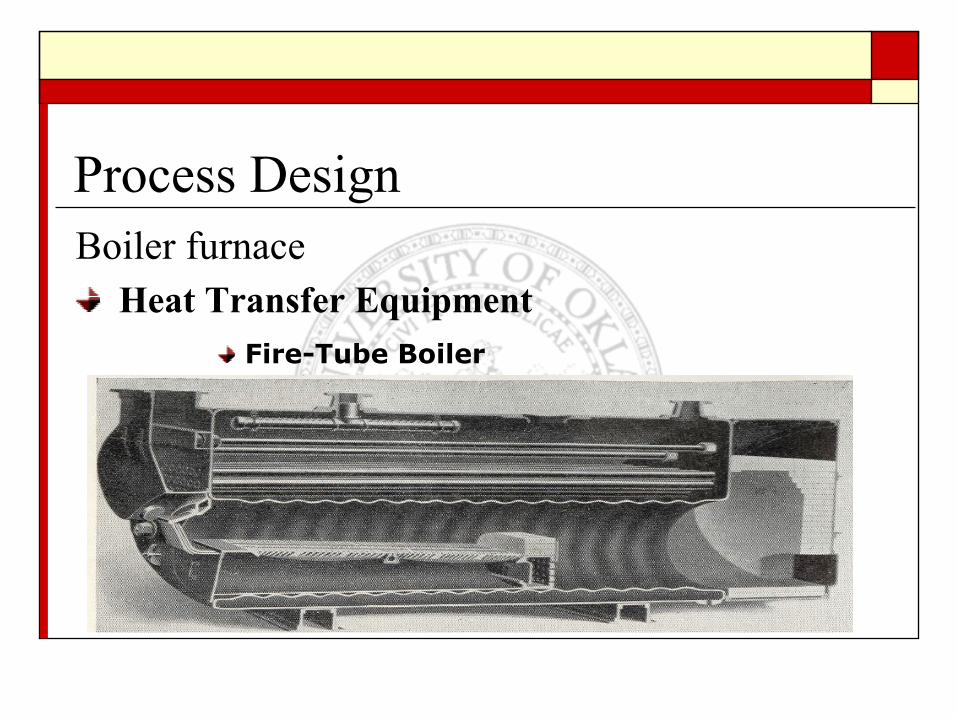
Process Design
Heat Transfer EquipmentFire-Tube Boiler
Boiler furnace

Process Design
Packaged Fire-Tube BoilerCharacteristics of radiation

Process DesignProposed system

Process DesignProposed system4 Tube pass
8 tubes, 12 ft length
2 ½ ’ OD
1 ½ psi pressure drop

Process DesignProposed system

Estimated 0.42 MW of thermal energy
Produces ~36,000 lb/hr of steam
Process DesignHeat transfer

Boiler $145,000
Cooling tower $2,000
Pump $6,000
Process DesignBoiler Furnace Cost

Process DesignProduct Recovery
COSORB separation Iron reduction - thermodynamically unfavorable
( ) ( ) ( ) ( )glgs COFeCOOFe 232 323 +↔+

Process DesignCOSORB

Process Design
COSORB - Selective absorption/desorption using CuAlCl4 in organic solvent
Toluene
Monochlorobiphenyl

Process Design
COSORB advantageLow corrosion rateAbility to separate CO in the presence of CO2Low energy consumptionAbility to produce high purity product (99.9%)
Process DesignCO2 Recovery Options
Separation system for CO2 and O2 High capital costInsignificant revenue generation
Purge and recyclePurge stream to sell for Enhanced Oil RecoveryRecycle stream to quench the reaction

Process DesignIndustrial Uses of CO2

Process DesignStorage
Compressed Liquid CO2Wittemann MEA Freebee
Compressed CO GasTHT Cryogenics

Process DesignStorage
Energy RequirementsPRO/ II
Compressor & Refrigeration Cycle
C1
E1
E2
V1
OP1
C2
S1
S2
S3
S4
S5
S6
S7
Process DesignStorage
CO2 Liquefaction$0 capital cost170 KW
CO compression$200,000 capital cost27 KW

Safety FOLLOW SAFETY PROCEDURES
COTOXIC
Deadly at ~800ppm
Flammable
CO2Pressurized CO2 with trace O2

Environmental ImpactCO2 Reduction
San Juan Produces 14500000 tons/yr~120 ton/ day processed
5256 tons/yr reduction38544 tons/yr sold
0.015% Chemically Reduced0.3% CO2 Emissions Reduction

Environmental ImpactEnergy Production
San Juan 1780 MW
~22 tons CO2 / KW Produced
Solar Reduction0.42 MW
.05 lb CO2 / KW Reduced

Economics
Lifetime = 10yrs

EconomicsCapital Investment
Equipment Costs: $15.7mCosorb Unit - $11.7mBoiler - $175,000MEA system – $3.3mSolar Reactor - $3.6m
Land: royalties - $403,000TCI: $49m

EconomicsProduct Costs
Operating CostsOperating Costs MMBtu/hr $/yr
MEA cooling water 8.02 $35,150.86MEA hot utility 4.58 $80,291.98Water from tower 1.60 $7,019.46COSORB cooling water 1.13 $4,952.68COSORB hot utility 0.21 $3,681.64Total power (MW) 0.5 $289,271.40Cost of water ($/MMBtu) 0.5 $420,368.01 TotalCost of hotutility ($/MMBtu/hr) 2Cost of power ($/kWhr) 0.066

EconomicsProduct Cost
Labor, avg. 8hrs/day e.g.Operators, maintenance workers
Labor cost - $1.6m/yrWages obtained from Bureau of Labor Statistics
Taxes – New Mexico$56,000 + 7.6% of excess over $1mTaxes - $2.6m/yr

EconomicsSales
CommoditiesCO - $0.86/ft3
39mft3/yr - $33.5m$/yr
CO2 - $35/ton~17250ton/yr - ~$604,000/yr
Total Profit - $34.2m/yr

EconomicsNet Earnings, P
Function of Sales, Product Cost, Depreciation.P - ~$23.7m/yrCash flow - $18.6m/yr
NPW - ~$78.5mROI >46%
No risk
POT – 1.65yrs

EconomicsRisk Analysis
Monte Carlo Method
Identify variablesFCIProduct CostProduct PriceConversion – 9.6%, 12% (base case), 14.4%
Based on %20%12 ±
EconomicsRisk Analysis
Three Conversion scenarios9.6%, 12%, 14.4%
Generate random numbers for all variablesUsing mean and standard deviation

EconomicsRisk Analysis
Net Present Worth –affected by variables
Calculated by varying FCI, PC, PPFigure: NPW over 10 yrs at each conversion
9.6 % 12% 14.4 %45.42 47.27 48.8448.24 49.61 51.9250.73 53.08 55.2750.85 52.68 54.4049.49 51.85 53.4444.00 45.96 47.5148.73 50.80 52.2848.19 49.64 51.1949.05 50.85 52.8445.04 46.26 47.9346.85 49.37 51.0049.75 51.16 53.3245.54 47.57 49.9445.72 47.64 49.4445.00 46.71 48.2148.12 50.64 52.3349.53 51.19 52.6943.22 44.54 45.7343.08 44.58 46.0443.27 44.92 46.5546.89 48.70 50.44
Net Present Value ($/106)

Risk AnalysisConversion effect on Net Present Worth
0
20
40
60
80
100
120
140
160
43.88
43.91
44.70
44.85
44.90
45.41
45.58
45.73
46.01
46.04
46.06
46.10
46.11
46.16
46.19
46.33
46.43
46.44
46.50
46.54
Net Present Worth
Freq
uenc
y
9.60%12%14.40%

Risk AnalysisCummulative risk curve
0
0.1
0.2
0.3
0.4
0.5
0.6
0.7
0.8
0.9
1
40.000 42.000 44.000 46.000 48.000 50.000 52.000 54.000 56.000 58.000 60.000
Net present worth
Ris
k 9.6 %12.0014.4 %

Conclusions
Project goalReduce CO2 in atmosphere
120tons/day removed by process
Conclusions
Project is ProfitableFurther Research
Increasing Capacity of the System.Conversion Rate

Conclusions
We are the greatest group In the history of Advanced Design!
Questions?

Process DesignMARS – “The Next Real Frontier”
Process DesignMars Application
Pure Feed Source of CO2
Intensity of Solar Radiation on MarsAtmosphere < 1 % of Earth’sNo global magnetic field Intensity 2.5 times greater
Recovery of products Pure CO for rocket fuelPure O2 for sustaining life
Process DesignMars Application
Material Balance:10 million years of processing CO2Production of 77 mi3 of oxygen
Not practical to Change the Atmosphere of Mars

Absorption: Ca(OH)2 + CO2 → CaCO3+ H2O
Regeneration: CaCO3 → CO2 + CaO
Calcination: CaO + H2O → Ca(OH)2
(Highly exothermic)
Ca(OH)2 Reactions
∆H