Embed Size (px)
Citation preview

Student Statement: As students of Washington University in St. Louis, we commit to the principles of academic
integrity and affirm to honest conduct over the entirety of this course. We understand that integrity of scholarship is
essential to an academic community and have properly cited credit to outside parties as necessary. We claim all
other work presented in this project to be our own.
ESE 498: Electrical Engineering Design Projects Final Report
Solar-Powered Lithium-Ion Battery Charger with USB Connector
Final Project By
Eric Hsu
Arunita Kar John Yuan
Under the Supervision of Dr. Robert Morley
Submitted in Partial Fulfillment of the Requirement for the Bachelor of Science in Electrical Engineering Degree
Washington University in St. Louis
Department of Electrical and Systems Engineering, School of Engineering and Applied Science
April 24, 2015

2
ABSTRACT
The field of solar-photovoltaics has seen rapid growth over the past years due to global
fascination in alternate sources of renewable energy. The use of photovoltaic systems to harness
sunlight for usable power provides opportunities for exciting and useful applications. In this
project, a combination of solar panels is used to convert light energy into electricity in order to
charge a lithium-ion (Li-ion) battery. The circuit design focuses on controlling the charge
provided from the panels to the battery. An Arduino has been programmed for pulse-width-
modulation (PWM) to control the maximum power point tracking (MPPT) capability, which
allows us to obtain the greatest amount of power from the availability of light. A DC/DC buck
converter has been implemented for voltage regulation. Once energy is stored in the battery, we
have the capability to charge devices such as cellphones, iPods, etc.
3
ACKNOWLEDGEMENTS
We would like to thank Dr. Robert Morley for taking the time to meet with us every week to
discuss our methods and progress. His experience and advice was invaluable to our
understanding of the physics and engineering concepts used in our project. We extend our
appreciation to Patrick Morley for his moral support. He truly was a source of joy.
Furthermore, we thank Washington University in St. Louis and the Electrical and Systems
Engineering Department for providing us with lab space and much of the equipment needed for
our project.

4
TABLE OF CONTENTS
ABSTRACT ................................................................................................................................... 2
ACKNOWLEDGEMENTS ......................................................................................................... 3
1. LIST OF TABLES AND FIGURES ........................................................................................ 5
2. PROBLEM STATEMENT AND SPECIFICATIONS ......................................................... 6 2.1. Problem Statement ........................................................................................................................... 6 2.2. Problem Formulation ...................................................................................................................... 6 2.3. Design Specifications ....................................................................................................................... 7
3. DESIGN SYNTHESIS .............................................................................................................. 7 3.1. Literature Review ............................................................................................................................ 7 3.2. Concept Generation ......................................................................................................................... 9 3.3. Concept Reduction ......................................................................................................................... 11
4. COMPLETE PROJECT DESIGN AND ANALYSIS ......................................................... 14 4.1. Arduino Uno ................................................................................................................................... 14 4.2. MPPT Circuit ................................................................................................................................. 15 4.3. Charge Controller .......................................................................................................................... 19 4.4. Full Circuit Working ..................................................................................................................... 21
5. LOGISTICAL ANALYSIS .................................................................................................... 23 5.1. Cost Analysis .................................................................................................................................. 23 5.2. Bill of Materials .............................................................................................................................. 24 5.3. Hazards and Failure Analysis ....................................................................................................... 24
6. CONCLUSION ....................................................................................................................... 25
7. FINAL REMARKS ................................................................................................................. 26
8. REFERENCES ........................................................................................................................ 28
9. APPENDICES ......................................................................................................................... 30 9.1. Appendix A: Datasheets for product components ...................................................................... 30 9.2. Appendix B: Arduino Code for MPPT and Charge Controller ................................................ 31

5
1. LIST OF TABLES AND FIGURES
Table 1: Cost of Parts of Circuit ................................................................................................... 23
Figure 1: Block diagram of solar-powered battery charger ............................................................ 6
Figure 2: Tree Diagram for Battery Choices ................................................................................ 10
Figure 3: Complete Circuit Design Schematic ............................................................................. 14
Figure 4: Enlarged View of MPPT Circuit ................................................................................... 16
Figure 5: Buck Converter Schematic and Simulation Results ...................................................... 17
Figure 6: Results of Buck Converter test with 10V input and either 0.5 or 0.75 duty cycle ........ 17
Figure 7: Results of Second Buck Converter Test with 10 V and 15 V inputs ............................ 18
Figure 8: MPPT Circuit outputs. A) I-V and P-V Curves. B) Output Voltage of full circuit ...... 19
Figure 9: Enlarged view of Charge Controller ............................................................................. 19
Figure 10: Simulation of Charge Controller. Input (red) and output (blue) voltages are shown. . 20
Figure 11: Test of Real Charge Controller Circuit with pulses of duty cycle 0.5 and 0.25 .......... 20
Figure 12: Results of Complete Circuit with Solar Panels ........................................................... 21
Figure 13: Photos of Working Circuit charging an iPhone ........................................................... 22
6
2. PROBLEM STATEMENT AND SPECIFICATIONS
2.1. Problem Statement
Mobile phones are some of the most pervasive electronic devices. Despite numerous makes and
models of cellphones, they all have a common component – batteries. Having battery-powered
devices requires recharging. In reality, it is inconvenient to find and wait at an electrical outlet
while walking, biking or traveling in general, and keeping the phone battery alive is necessary in
for entertainment, information, and emergencies. Battery powered chargers can also work, but
the charging issue is still the same – outlets need to be found eventually. Thus, we turn to the
alternative solution of photovoltaic systems, also known as solar panels. Solar panels, in the
presence of sunlight, can be used as voltage sources that power the charging of phones. Thus, a
solar powered phone charger can be designed. Perhaps the largest audience for our product
would be college students, who are frequently walking from class to class or other places both on
and off campus.
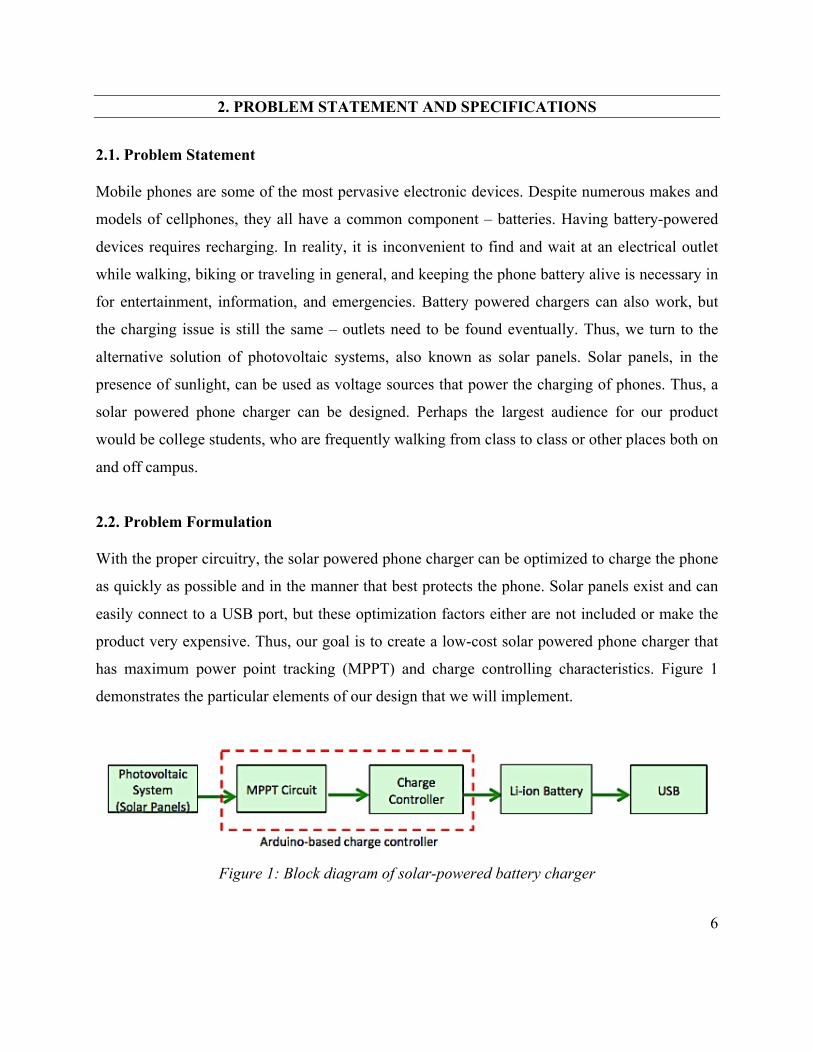
2.2. Problem Formulation
With the proper circuitry, the solar powered phone charger can be optimized to charge the phone
as quickly as possible and in the manner that best protects the phone. Solar panels exist and can
easily connect to a USB port, but these optimization factors either are not included or make the
product very expensive. Thus, our goal is to create a low-cost solar powered phone charger that
has maximum power point tracking (MPPT) and charge controlling characteristics. Figure 1
demonstrates the particular elements of our design that we will implement.
Figure 1: Block diagram of solar-powered battery charger

7
2.3. Design Specifications
This problem presents a need for on-the-go charging devices that use renewable energy to charge
a battery, with the following expectations.
i. Charge Li-ion batteries by day so that the device can still charge a phone without light
ii. Include protection circuitry to prevent overcharging and over-discharging
iii. Track the maximum power point to increase charging efficiency
iv. Have a USB output to connect to rechargeable devices
v. Not exceed $100.00 per unit
The final device will be analyzed to show proof of concept under the following categories:
i. Voltage-current and Power-current graphs from solar panel output
ii. Input and output characteristics of charge controller that match our calculations
iii. Maximum power point tracking properly matching the I-V and P-V graphs
iv. Recharging of the battery and battery-powered device
3. DESIGN SYNTHESIS
3.1. Literature Review
Solar powered battery charging technology exists in the market. However, portable solar-
powered backpack chargers are incredibly expensive. According to commercial suppliers of
portable solar-powered charge stations and solar-powered backpacks, such as Voltaic Systems
and BirkSun, cost of products range from $150.00 to well over $300.00. Current papers and
design projects that have delved into solar-powered battery chargers have looked at either
maximum power point tracking (Nolan) or at charge-controlling circuitry (Bonner), but not both.
Further research was done to understand how a solar powered battery charger should work. The
concept of using solar-power to charge batteries requires some sort of photovoltaic panels (solar

8
cells) to capture the light energy, circuitry to regulate the voltage and current output to direct an
appropriate amount of charge to the battery (Battery).
Maximum power point tracking (MPPT) is a method to adjust input voltage to harvest the
maximum power from the solar array and then transform this power to supply the varying
voltage requirement of the battery plus load. All non-MPPT charge controllers do the same basic
thing: they connect the PV module directly to the battery. The battery acts as a load that will pull
down the PV module operating voltage. The non-MPPT charge controller will keep pushing the
battery voltage up until it reaches the set point of the charge controller. However, charge
controllers are usually set to regulate at a voltage level that does not capture the total power
output of solar panels and so a lot of energy is wasted. The MPPT process raises the current
while lowering the voltage. The reason this works is because current and voltage can be
exchanged and yield the same amount of power. This is done through a process called DC-to-DC
conversion (Rosu-Hamzescu).
One type of DC-DC converter is the Buck converter. This is a step-down method used when the
DC output voltage needs to be lower than the DC input voltage. This is essentially an
intermediate step that allows MPPT to deliver power efficiently to the battery. An essential part
of DC-DC conversion requires the use of pulse-width modulation (PWM). Pulse-width
modulation (PWM) is a technique for getting analog results with digital means. Digital control is
used to create a signal switched between on and off which simulate voltages by changing the
portion of the time the signal spends on versus the time that the signal spends off. To get varying
analog values, you modulate that “on-time,” or pulse width. The percentage of time that the
signal is in the “on” position is called the duty cycle (Hirzel). MPPT involves changing the duty
cycle of the Buck converter to change the overall resistance of the circuit and optimize the
amount of voltage coming out of the solar panels until the maximum power is being delivered to
the battery (Rosu-Hamzescu). However, there are dangers of directly delivering too much charge
to a battery. For this reason, it is necessary to also implement a charge controller.

9
3.2. Concept Generation
For this project to enhance the current technology and be successful, it was important to address
the following questions:
1. What type of batteries should be used?
2. What are the benefits of PWM over directly changing the voltage in the circuit?
3. How can we implement MPPT?
In order to find a suitable battery for this project, four common types of batteries were analyzed
and evaluated against one another. The tree diagram in Figure 2 shows the advantages and
disadvantages of the various batteries under consideration.
PWM has been used for a variety of different control applications. If the pulse frequency is high
enough, the circuit for which the pulse is affected will see the average value of the whole signal.
Thus, PWM allows us to easily change the voltage inputted into a system as long as the voltage
is multiplied with the pulse signal. This can be done with an N and a P transistor, which will be
described in the Complete Design section of this report. We want to change the voltage being
delivered to the battery in our charge controller as the battery approaches its maximum voltage.
Changing this voltage with PWM is much easier than with a Buck or a Boost Converter (which
would not only cost more but also still require pulses).
There are two commonly used methods to implement MPPT algorithms. The first method is the
Perturb and Observe method. This method introduces a small positive perturbation in the panel
voltage by increasing the converter duty cycle. The algorithm then measures the current and
voltage coming out of the panels, multiplies them together to obtain the power output, and
compares it to the previous power output. If the power increases with an increase in voltage, then
the duty cycle is increased. If the power decreases with an increase in voltage, then the duty
cycle is decreased. This continues until the maximum power point is reached – the power does
not decrease with a change in voltage.

10
Figure 2: Tree Diagram for Battery Choices
Rechargeable Bateries
Lead Acid
Pros: -‐Capable of high discharge rates -‐Mature, well-‐understood -‐Low self-‐discharge -‐Usually does not require constant maintenance
Cons: -‐Cannot be stored in a discharged condition. -‐Poor weight-‐to-‐energy density (limits use to stationary and wheeled applications) -‐Allows limited number of full discharge cycles -‐Environmentally unfriendly
Nickel Iron
Pros: -‐Very robust. -‐Withstands overcharge and over-‐discharge -‐Accepts high depth of discharge -‐ deep cycling. -‐Can remain discharged for long periods without damage. -‐Long lifespan
Cons: -‐Low cell voltage -‐Very heavy and bulky. -‐ Slow to charge, slow to discharge -‐Low efHiciency -‐Low energy density. -‐High self discharge rate.
Alkaline
Pros: -‐Long shelf life -‐High energy density -‐Good for applications that do not drain the battery quickly and are turned off most of the time -‐Good for non-‐cruicial devices that will not have memory affected if power was lost suddenly. -‐Low cost
Cons: -‐Bulkier than Li-‐ion -‐Less energy than Li-‐ion -‐High internal resistance that reduces run time -‐Requires the most frequent battery replacements
Lithium-‐ion Polymer
Pros: -‐Flexible, can take any size and shape -‐Light weight -‐Environmentally friendly -‐Highest voltage capacity -‐Good for high-‐drain and crucial applications -‐Relatively short recharge time -‐does not require regular maintenance -‐Safety -‐ resistant to overcharge; less electrolyte leakage.
Cons: -‐More expensive -‐Other batteries have better energy densities (though none of the ones listed here) -‐Battery life is not as long

11
The second method is the Incremental Conductance method. Recall that conductance is the
inverse of resistance, or calculated as 𝐼/𝑉. This method compares the incremental conductance
(∆𝐼/∆𝑉) to the instantaneous conductance (𝐼/𝑉) at a particular voltage. The sum of the current
and an incremental increase in current is equal to the change in power over voltage (the slope of
a P-V curve). More specifically, 𝑑𝑃/𝑑𝑉 = (𝐼 + 𝑉∆𝐼/∆𝑉). If the incremental conductance is less
than the negative value of the instantaneous conductance, the duty cycle is increased. If it is
greater than the negative value of the instantaneous conductance, the duty cycle is decreased.
This is done until the two conductances are equal, as that is where 𝑑𝑃/𝑑𝑉 = 0.
3.3. Concept Reduction
After weighing the advantages and disadvantages of MPPT, charge regulation methods, voltage
control, and types of batteries, it was decided that the solar-power battery charger with both
MPPT capability (Perturb and Observe) and a charge controller, in addition to PWM and Li-ion
polymer batteries would best design. We discuss many of detailed elements of the circuit here,
often aiming for lower cost, ease and feasibility of implementation, and size conservation.
The first decision was to decide on which solar panels best suited our needs. Solar panels with
high power outputs get very expensive quickly, often costing up to hundreds of dollars. Since our
solar panel output is based very much on the resistance of our circuit, we would like solar panels
with high current output while still being able to reach a sufficient 10 V to properly power all
circuit elements. For example, 10 W 12 V solar panels cost over $50, which is too costly for our
$100 budget. Thus, we aimed for versatility and cost by using multiple lower power low cost
solar panels. We decided to use 4 2.5W/5V Mini Encapsulated Solar Cells from ALLPOWERS
to achieve a 10 V and 1 A output from our solar panels, which is sufficient for our circuit. Using
multiple panels also gives the added benefit of decreasing the bulkiness of the system and
changing the number of panels used in different irradiation conditions when desired.
We also needed to track the current for MPPT. There are many ways to sense current, for
example with the ACS712 current sensor, measuring the voltage across a small resistor and using

12
an instrumentation amplifier, or measuring the current across a small resistor using a current-
sense amplifier. The problem with the second two methods is that they both require amplifiers.
Amplifiers tend to need both positive and negative rails. In our circuit, we only have the positive
rail and ground, and not a negative rail. Single-supply amplifiers do exist, but the positive
reference requires a high voltage (often 10 V or greater) to make up for the lack of a negative
rail. In our circuit, our solar panels can only output a maximum of 10 V in the best irradiation
conditions, which is not preferred. As a result, we decided to use the ACS712 current sensor to
measure solar panel current. An extra benefit of using this sensor is that there is also a cheap
adaptor circuit between the ACS712 and Arduino, which we used for our breadboard prototype.
Since our circuit output required a DC/DC converter (which always has switches), we needed a
driver to control the switching in the converter. We decided to use a half-bridge driver, which
outputs a High Output and a Low Output that is the opposite of the High Output. If connected to
two switches, we create a make before break system that is perfect for switching properties of a
Buck Converter. Most drivers require a high input voltage to be used, which is the same issue as
with the single supply amplifiers as discussed above, but we managed to find the half-bridge
driver IR2302, which has a 5 V operating voltage. 5 V is low and easily achievable with our
solar panels, so we decided to use this driver for our MPPT circuit. The choice of using this
driver also confirms that we should use a Buck Converter rather than any variant of a Boost
Converter – since we would prefer to have an output voltage below 4 V and need an input
voltage of 5 V or greater to power the driver, we will always need to decrease the voltage.
With all of the MPPT circuit elements chosen, we then had to decide which method of MPPT we
would use in our circuit. The Incremental Conductance method can react more effectively to
quickly changing radiation levels and can actually reach the maximum power point rather than
oscillate around it as the Perturb and Observe method does. However, the Perturb and Observe
method is much easier to implement, especially on an Arduino. It is also more commonly used,
thus giving us more references in the cases where we had to debug errors (Zainudin). For ease of
implementation, we started by using the Perturb and Observe method, which is a more tried and
true method. We wanted to ensure that our circuit would work with the more often used method,

13
as this was our first time working with solar panels. With time, the more effective Incremental
Conductance method may be implemented in the future to increase the efficiency and robustness
of our circuit.
The choice of the battery came down to the practicality and efficiency of being used in the
desired portable solar-powered charging application. Of course, a rechargeable battery was
needed since any user of this product would want to use the device multiple times. The following
characteristics were taken into also consideration: weight and size, maximum voltage, cost,
charging time, cycle life, and temperature sensitivity. Alkaline, Nickel-Iron (NiFe), Lead Acid,
and Li-ion, are some of the most commonly used rechargeable batteries in industry. While all
these options have certain advantages, it was possible to eliminate NiFe and Lead Acid since
those are rather bulky and heavier than the others. They are also more expensive, degrade more
quickly, are not as efficient, and are not environmentally friendly. The alkaline is, perhaps, the
most commercially used (AA and AAA batteries) and thus the least expensive. However, they
are more suited to applications that do not drain the battery quickly, or are turned off much of the
time (such as flashlights and portable radios). Cellphones and laptops are high-drain devices, so
alkaline batteries connected to them would drain rapidly, run out of life cycles quickly, and need
replacing more often. In the end, lithium-ion polymer batteries were the best choice due to their
lightweight, very high efficiency (99% at 4-hr rate, 92% at 1-hr rate), relatively short charging
duration (2-4 hours), highest nominal voltage (3.7V), and resistance to overcharging.
As we have chosen to use a Li-ion battery, when there is no sunlight, we can only power USB
ports that require less than 3.7 V. Most USB ports, however, require 5 V. We could have used a
separate Boost Converter to increase the voltage to 5 V, but we decided to instead use the DROK
B00C93Z8JY USB Port, which is a USB port with boost capabilities. This circuit requires 3 V to
be powered, which makes it much easier and more efficient to use this USB port and connect
different loads to the circuit via USB. This USB circuit also protects the battery from over-
discharging, as it will not turn on when the battery’s voltage is too low.

14
4. COMPLETE PROJECT DESIGN AND ANALYSIS
Figure 3 below displays our full circuit design schematic. As discussed above and displayed in
Figure 1, we connect the solar panels to the MPPT circuit, which in turn connects to the charge
controller, battery, and USB load. This section of the report will discuss each section in detail
and demonstrate that our circuit works properly.
Figure 3: Complete Circuit Design Schematic
4.1. Arduino Uno
In Figure 3, there are many I/O ports. Each of these I/O ports (excluding the USB+ and USB-
ports) refers to a connection to the Arduino, where analog ports (A) are values that are inputted
into the Arduino and digital ports (D) are outputs from the Arduino. The Arduino serves four
main purposes in the MPPT circuit. The first purpose is to measure the voltage values being
outputted by the solar panels and battery. The Arduino only has 10 bits of resolution (1024
values), where a measured value of 1024 would equate to 5 V. Since there are times where the
solar panel voltage will be greater than 5 V, we always use a voltage divider circuit to scale
down the amount of voltage being measured by the Arduino. Since the voltage is scaled down by
a factor of 20𝑘/(100𝑘 + 20𝑘) = 6, we can properly resolve voltage measurements from 0 to 30
V, which is more than enough to measure the voltages of the solar panels. The full conversion
from Arduino readings to voltage is 𝑉 = 𝑅𝑒𝑎𝑑𝑖𝑛𝑔 ∗ 6 ∗ 5/1024.

15
The second purpose of the Arduino is to measure the current output from the solar panels. As
discussed above, we decided between and experimented with a few ways to do this until we
finally decided upon using the ACS712 current sensor. From the data sheet, this sensor has a
sensitivity of 185 mV/A and senses 2.5 V of voltage when there is no current flowing through it.
Again, a reading of 1024 corresponds to a value of 5 V. Thus, the conversion from Arduino
reading to current is 𝐼 = (𝑅𝑒𝑎𝑑𝑖𝑛𝑔 ∗ 5/1024− 2.5)/0.185.
The voltage reading of the Arduino can change quite often, and averaging multiple values over a
short period of time solves this issue. Thus, we average readings 6 times with 20 µs in between
each reading to obtain a more accurate overall measurement. As a result, everything that involves
voltage or current measurements receives a new reading every 100 µs.
The third purpose of the Arduino is to set the duty cycle of the pulses for proper switching of the
half bridge driver in the MPPT circuit. The fourth and final is similar – it changes the duty cycle
in the charge controller so that the battery cannot be overcharged. The adjustments in duty cycle
will be discussed in more detail in the MPPT and charge controller circuit sections below.
4.2. MPPT Circuit
One of the most significant parts of the MPPT circuit, all of which is shown in Figure 4, is the
Buck Converter. The inductor and capacitor in the Buck Converter store and release energy as
needed, and their values change the output ripple size. These values also change the amount of
voltage and current that the solar panels will output based on output and input voltages into the
converter, so properly calculating these values is important (LC Selection).
Let 𝑉!" and 𝑉!"# be the input and output voltages into the Buck Converter, 𝐷 = 𝑉!"#/𝑉!" be the
duty cycle of the input pulses into the Buck Converter, 𝐹!" be the switching frequency of the
pulses, ∆𝐼 be the output ripple current from the inductor, and ∆𝑉 be the output ripple voltage
from the capacitor. From their specs, our 4 solar panels should output a total of 10 V and 1 A. By
design specs, a good value of ∆𝐼 is 30% of the value of the input current and a good value of ∆𝑉

16
Figure 4: Enlarged View of MPPT Circuit
is 15 mV. We set ∆𝐼 = 0.3 ∗ 1 𝐴 = 0.3. General switching frequencies of solar panel circuits are
set to 50 kHz. With an input voltage of 10 V from our two solar panels and output voltage of 4
V, which would be an optimal voltage to charge our battery, we calculate our inductance and
capacitance with the following equations:
𝐿 =𝐷 ∗ 𝑉!" − 𝑉!"#
𝐹!" ∗ ∆𝐼=0.4 ∗ 10− 450000 ∗ 0.3 = 160 𝜇𝐻
𝐶 =∆𝐼
8 ∗ 𝐹!" ∗ ∆𝑉=
0.38 ∗ 50000 ∗ 0.015 = 50 𝜇𝐹
When purchasing parts, we found that the closest purchasable inductor and capacitor values for
our prototype were 180 µH and 50 µF, so we set our inductance and capacitance to those values.
With the Buck Converter designed, we wanted to test that it worked properly. We first simulated
the buck converter as shown in Figure 5. Instead of using the MOSFETS as switches for our
Buck Converter though, we used a Two-Input switch that emulated the 3 MOSFETs shown in

17
Figure 4. With an input voltage of 6 V and duty cycle of 75%, we see that the simulated output
voltage averages to 4.5 V as expected.
Figure 5: Buck Converter Schematic and Simulation Results
with Input Voltage 6 V, Duty Cycle 75%, and Output Voltage 4.5 V
We then moved on to testing the circuit in a real setting. In this test, we modified the circuit in
Figure 4 so that the current sensor was removed, the solar panels were replaced with a DC power
source, and instead of setting the duty cycle based on MPPT, the Arduino set the duty cycle to a
constant value. This trial tested that the Buck Converter could properly change the output
voltage, the results of which are shown in Figure 6. As displayed, the 10 V input is scaled down
to about 4.9 V at a duty cycle of 0.5 and 7.2 V at a duty cycle of 0.75, which is expected.
Figure 6: Results of Buck Converter test with 10V input and either 0.5 or 0.75 duty cycle

18
Afterwards, we programmed the Arduino to set the duty cycle to 4/𝑉!" to test that the Arduino
could properly measure the input voltage and change the duty cycle appropriately. This result is
seen in Figure 7. At different voltage inputs, the duty cycle changed so that the voltage coming
out of the Buck Converter was close to 4 V (at ~4.2 V). A 10 V input resulted in a duty cycle of
42% and a 15 V input results in a duty cycle of 28%. These two tests demonstrated that our Buck
Converter worked properly.
Figure 7: Results of Second Buck Converter Test with 10 V and 15 V inputs
After ensuring that our Buck Converter worked properly, we added in the current sensor and
programmed the Arduino to perform the Perturb and Observe algorithm. The Arduino measures
the current and voltage and calculates the power by multiplying those two values together. It
stores the voltage and power in memory so to compare them to the voltage and power of the next
reading. The Arduino senses whether the power has changed from its previous value, perturbs
the voltage by a small amount to test whether the current voltage is to the left or right of the
maximum power point, and adjusts the duty cycle accordingly (by less than 1% for each step) to
approach that maximum power. Our MPPT is dynamic in that if the input voltage and current
change, the Arduino will change the voltage to achieve the maximum power possible. Each
change in the duty cycle occurs after 300 µs, which comes from measuring 3 different values in
the manner described in the previous section. Figure 8A shows the I-V and P-V curves of our full
circuit, giving a maximum power at 4.17 V based on the values of current and voltage coming

19
from the solar panels. Figure 8B displays the output of our MPPT circuit with solar panels after
reaching maximum power.
Figure 8: MPPT Circuit outputs. A) I-V and P-V Curves. B) Output Voltage of full circuit
4.3. Charge Controller
Figure 9: Enlarged view of Charge Controller
This section discusses the designed charge controller. The p-MOSFET in the circuit transfers the
voltage, which is seen to be around 4 V from the previous section, to the battery. However, it
A B

20
only flows through when the voltage at the gate is less than the voltage at the source. This occurs
when current can flow through the NPN transistor. The NPN transistor only has current flowing
through it when an “on” signal is inputted. Therefore, the output of the MOSFET is a signal with
the same magnitude as what is going into the source of the MOSFET and with the same pulse
frequency and duty cycles as what the Arduino outputs through port 6. This phenomenon is seen
in Figures 10 and 11. Figure 10 shows our simulation of the charge controller with manually
determined pulses and duty cycles. As shown, the output (blue) is a 4 V signal with duty cycle of
0.5, which is the same duty cycle as the PWM signal (red) of different magnitude. Figure 11
shows the same concept in our real circuit, with a peak to peak output of 4 V at various duty
cycles as shown. Due to other elements in the full circuit though, the signal in Figure 11 is not
exactly the same as what is predicted in simulation. However, it does follow the general on/off
trends of what is expected, and it thus sufficiently works for our circuit. It confirms that as the
duty cycle of the input pulse changes, the output will follow that change in duty cycle.
Figure 10: Simulation of Charge Controller. Input (red) and output (blue) voltages are shown.
Figure 11: Test of Real Charge Controller Circuit with pulses of duty cycle 0.5 and 0.25

21
With the pulse control working, we then program the Arduino to change the duty cycle in
response to a measured voltage. We already showed that this concept works in Figure 7 with the
MPPT section of the report; only a duty cycle change is happening in this case. We want the
battery to start charging more slowly as it hits 80% of its maximum voltage, so we scale the duty
cycle to min {(3.7− 𝑉!"#)/0.7, 1} so that the duty cycle starts decreasing from 1 at 3 V until it
hits 0 at 3.7 V. We also account for the lack of idealness shown in Figure 11 by decreasing the
charge controller pulse frequency from what is shown to 1 kHz. This gives the circuit ample time
to reach the steady state value. This phenomenon will be displayed in Figure 12.
4.4. Full Circuit Working
We tested our full circuit (Figure 4) in two settings to make sure that it worked properly. The
first was indoors near a window where sunlight could enter through the window and hit the solar
panels. This allowed us to still connect the circuit to an oscilloscope to see input and output
waveforms. Figure 12 shows the results of the complete circuit with solar panels in this setting.
The first channel on the first oscilloscope image is the pulse input of the charge controller. The
first channel on the second oscilloscope image is the output voltage of the MPPT circuit and
input voltage into the charge controller. The second channel of both images is the same: the
overall output of the full circuit into the battery, which had a voltage of 3.57 V at the time of this
test. Note that although the voltage of the second channel is not stated anywhere on the images,
the average output voltage is measured (via cursors) to be 3.907 V. Note that the duty cycle also
matches the formula shown in the previous section.
Figure 12: Results of Complete Circuit with Solar Panels

22
We then tested our full circuit outside, where there was more sunlight. We wanted to ensure that
our full circuit could charge the battery, power the USB port, and charge an iPhone with only
sunlight (and without connections to any devices like oscilloscopes). We connect the circuit as
shown in Figure 13 and a close look at both photos shows that our circuit can power the USB
charger for iPhone charging.
Figure 13: Photos of Working Circuit charging an iPhone
From a few time measurements that we took of charging the battery and an iPhone, we estimated
that the amount of time needed to charge an iPhone with no battery remaining was about 4 hours,
as about 1-2% of the iPhone battery charged in 3 minutes. This is comparable to the 3 hours it
took to charge that same empty iPhone with a wall charger. We also discharged the battery to a
low voltage, which turned out to be around 2.5 V when measured, and fully charged the battery
with our circuit. 2.4 V is a common “low voltage” for 3.7 V Li-ion batteries (Battery University).
This charging process took about 2 hours to accomplish.

23
5. LOGISTICAL ANALYSIS
5.1. Cost Analysis
This section provides a cost analysis of the prototype that was created over the course of this
project. However, since this was a proof-of-design project, the prototype is more bulky than
desired for a commercial product. For this reason, we have also provided a cost estimation for an
economic production of 1000 units of this prototype as shown in Table 1.
Part Quantity Cost Per Unit ($)
Cost for 1000 Units ($)
Cost for Prototype ($)
Cost for 1000 Prototypes ($)
Solar Panels 4 7.99 7,990.00 31.96 31,960.00 Arduino Mini Pro
1 2.59 2,590.00 2.59 2,590.00
Li-Ion Battery
1 7.96 7,960.00 7.96 7,960.00
Half-Bridge Driver
1 1.49 1,490.00 1.49 1490.00
NPN BJT 1 0.03 37.00 0.03 37.00 N-MOSFET 3 0.74 740.00 2.22 2,220.00 P-MOSFET 1 0.19 190.00 0.19 190.00 Current Sensor
1 2.05 2,050.00 2.05 2,050.00
USB Port 1 5.81 5,810.00 5.81 5,810.00 Total Cost 28.85 28,857.00 57.26 57,267.00
*Note: Simple circuit components such as resistors, capacitors, inductors, wires, and other basic components were not included in the costs.
Table 1: Cost of Parts of Circuit The maintenance costs for the circuit are minimal. A solar panel will produce at least 80% of its
rated power after 20 years of use (Lombardo). The shelf life of a Li-ion battery is 5 years if one
charge-recharge cycle is done every day (Zaghib). These most expensive parts of the circuit will
thus in essence not need to be replaced in the short term, where new and more reliable parts may
be produced in that time period and render these parts obsolete. From observation of USB ports
on computers, a USB port can be used thousands of times and still work properly. Thus, if we

24
assume that the phone is plugged in once every day and the lifespan of the USB port is at least
1,000 uses, the USB port will last for at least 3 years. Most circuit elements, which will be on the
PCB, will last at least 1 year as long as the power rating is not surpassed, which is not likely in
this case (Carbon). Thus, the maximum frequency of replacement fees would be less than $10
each year for the PCB circuit parts as shown in Table 1.
5.2. Bill of Materials
The bill of materials (with providers) for the final design includes:
1. 2.5W 5V/500mAh Mini Encapsulated Solar Cell (ALLPOWERS)
2. Arduino Microcontroller
a. Arduino UNO Rev3 is used in the prototype
b. Arduino Mini Pro microchip is used in the 1000 unit calculation
3. PKCELL LP503562 Li-Ion Battery (Adafruit)
4. IR2302 Half-Bridge Driver (International Rectifier, Digi-Key)
5. 2N3904 NPN Bipolar Junction Transistor (Digi-Key)
6. IRFZ44-ND N-MOSFET (International Rectifier, Digi-Key)
7. IRF9540 P-Channel P-MOSFET (International Rectifier, Digi-Key)
8. ACS712 Current Sensor (Allegro MicroSystems, Inc., Digi-Key)
9. DROK B00C93Z8JY USB Port (Electronic Care Products)
Many passive elements such as resistors, inductors, capacitors, and wires were also included in
the circuit, but these costs are negligible. For the sake of cost and PCB elements, we use the
Arduino Mini Pro instead of the Arduino Uno. The microcontroller (ATMega328) and the
number of ports for both devices is the same, and thus this swap is reasonable. See Appendix A
for links to data sheets for all of the materials.
5.3. Hazards and Failure Analysis
The safety hazards of the prototype as it stands at the moment include the potential for
overheating and susceptibility to water. Ideally, the finished product would have temperature

25
sensors and temperature regulating circuitry. In addition, since this product will be portable and
eventually attached to bags and backpacks, providing packaging or a cover that allows the device
to be more weatherproof would be beneficial for safety. Overall, the product is environmentally
friendly, due to the use of solar power as a renewable energy source, and has taken certain
measures of safety into consideration. Circuit overcharging protection was supported through the
charge controller and over-discharging protection was included in the USB port.
6. CONCLUSION
In this project we designed and implemented an MPPT charge controller circuit from scratch.
The main goal was to deliver power from an array of solar panels to a Li-ion battery in order to
charge it. To obtain charging efficiency, we set up a maximum power-point tracking circuit that
would ensure that the greatest amount of power is delivered to the battery. The Buck-converter
was used to regulate the voltage delivered to the battery. Since the solar panels generate a much
higher voltage than what the battery requires to reach full charge, the Buck-converter performs
voltage step-down.
We optimize our Buck-converter by choosing inductance and capacitance values so that the
power is maximized at near 4 V, which is the perfect voltage for charging the 3.7 V Li-ion
battery. Combined with our charge controller, which decreases the amount of voltage flowing
into the battery as the battery voltage approaches 3.7 V, our battery will never be overcharged.
The USB Port and adapter prevent the battery from overdischarging, as it shuts down when the
battery voltage gets too low to power it. The Arduino Uno microcontroller is the heart of this
circuit, providing the PWM and the sensing capabilities that allow for MPPT and charge control.
It is powered by the solar panels, thus taking away the need for more power sources.
Our project successfully demonstrates how harnessing solar energy can be used to charge
devices with a USB connect capability at a low cost. This project provides a potential solution to

26
the very real problem of needing to charge personal devices, such as mobile phones, iPods,
iPads, etc. – on the go.
In order to make the battery charger design presented here more realistic, it is necessary to add
various protection methods. In the future, we hope to equip out current design with thermal
sensors that will allow the detection and prevention of overheating. Once those are in place, the
most logical progression of this project would be to transfer the components to a solder-able
circuit board, for compactness and easier packaging and transport. Last but not least, we would
want to a solar panel package that can be easily attached and detached from backpacks, purses,
and other carry-on items and is weatherproof to allow users to charge their devices on-the-go in
various travelling conditions.
7. FINAL REMARKS
Overall, we believe this project turned out well. We successfully completed what we set out to
do – that is, build a proof-of concept prototype of a solar-powered Li-ion battery charger that
allows the user to charge their portable personal devices using a USB cable. The design process
itself was an immense learning experience for all members of our group. Not only did we learn
how to implement new techniques such as MPPT, but we also have gained hands-on experience
of taking the fundamentals we have learned in our electrical engineering curriculum and using
them in practical applications of building a circuit and analyzing how each component works.
If we were to do this project again, we would most likely want to use our time more efficiently.
For example, it might have been beneficial to simulate and test every individual section of the
circuit before putting it all together. We originally put the whole circuit together and then
separated the parts when we did not get results anywhere close to what we expected. It also
would have been beneficial to learn more about the elements in our circuits more before using
them. Knowing what operating voltage and that solar cells did not work well even with light

27
from a simulated sunlight lamp would have decreased the amount of debugging time by 15 hours
at the very least. This was the place we spent the most amount of time on – racking our heads
from failing to debug our circuit because we didn’t know the intrinsic properties of the devices
we were using. In addition, if we had made better use of our time, perhaps we could have
implemented temperature sensing capabilities and packaging of the circuit as we originally
intended to. While there is always room for improvement, we are satisfied with how our group
performed, and plan to keep designing in our futures.

28
8. REFERENCES
1. Albright, Edie, Al-Hallaj. “A Comparison of Lead Acid to Lithium-ion in Stationary Storage
Appplications.” Altenenergymag.com. 12 Apr. 2012.
< http://www.altenergymag.com/content.php?post_type=1884>
2. ”Arduino Solar Charge Controller (Version 2.0)." Instructables.com. 1 Apr. 2014.
<http://www.instructables.com/id/ARDUINO-SOLAR-CHARGE-CONTROLLER-
Version-20/?ALLSTEPS>
3. "Basic Tutorials: Charge Controllers for Solar Energy Systems." Basic Tutorials: Charge
Controllers for Solar Energy Systems.
<http://www.freesunpower.com/chargecontrollers.php>.
4. Bonner, Jordan. "Portable Solar Panel Charging Station." Digital Commons CalPoly. 2012.
2<http://digitalcommons.calpoly.edu/cgi/viewcontent.cgi?article=1151&context=eesp>.
5. Battery University. "Is Lithium-ion the Ideal Battery?" Advantages & Limitations of the
Lithium-ion Battery.
<http://batteryuniversity.com/learn/article/is_lithium_ion_the_ideal_battery>.
6. “Carbon Composition Resistor.” ResistorGuide.com. 2015. Web.
<http://www.resistorguide.com/carbon-composition-resistor/>.
7. Hirzel, Timothy. “PWM.” Arduino. 01 Jan 2015. <http://www.arduino.cc/en/Tutorial/PWM>.
8. "LC Selection Guide for the DC-DC Synchronous Buck Converter." ON Semiconductor.
Semiconductor Components Industries, LLC. 2013. Web.
<http://www.onsemi.com/pub_link/Collateral/AND9135-D.PDF>.
9. Lombardo, Tom. “What is the Lifespan of a Solar Panel?” Engineering.com. 20 Apr 2014.
Web. <http://www.engineering.com/ElectronicsDesign/ElectronicsDesignArticles/
ArticleID/7475/What-Is-the-Lifespan-of-a-Solar-Panel.aspx>.
10. "Maximum Power Point Tracking." - National Instruments. 7 July 2009. Web.
<http://www.ni.com/white-paper/8106/en/>.
11. Nolan, Tim. "Arduino PPT Solar Charger." Arduino Peak Power Tracker Solar Charger.
CMS Made Simple, 10/005/2009. Web. 8 Jun 2012.
<http://www.timnolan.com/index.php?page=arduino-ppt-solar-charger>.

29
12. Rosu-Hamzescu, Mihnea and Sergia Oprea. “Practical Guide to Implementing Solar Panel
MPPT Algorithms.” Microchip. 29 Nov 2012. Web.
<http://ww1.microchip.com/downloads/en/AppNotes/00001521A.pdf>.
13. Sze, S. M. Physics of Semiconductor Devices. 2nd ed. New York: Wiley, 1981. 796. Print.
14. Zaghib, K; Dontigny, M; Guerfi, A; Charest, P; Rodrigues, I; Mauger, A and CM Julien.
“Safe and fast-charging Li-ion battery with long shelf life for power applications.” 15
Apr 2011. Journal of Power Sources, 196: 2949-2954.
15. Zainudin, Hairul Nissah. “Comparison Study of Maximum Power Point Tracker Techniques
for PV Systems.” Proceedings of the 14th International Middle East Power Systems
Conference. 19 Dec 2010. Web. < http://core.ac.uk/download/pdf/11438597.pdf>

30
9. APPENDICES
9.1. Appendix A: Datasheets for product components
1. Current Sensor –
http://www.allegromicro.com/~/media/Files/Datasheets/ACS712-Datasheet.ashx
2. IR2302 Half Bridge Driver –
http://www.irf.com/product-info/datasheets/data/ir2302.pdf
3. NPN Bipolar Junction Transistor –
http://www.mccsemi.com/up_pdf/2N3904(TO-92).pdf
4. N-MOSFET –
http://www.irf.com/product-info/datasheets/data/irfz44npbf.pdf
5. P-MOSFET –
http://www.vishay.com/docs/91078/91078.pdf
6. PKCELL LP503562 Li-Ion Battery -
http://www.adafruit.com/datasheets/503562%201200mah.pdf
7. UNO Rev3 Arduino (ATMega328 Microcontroller) –
http://www.atmel.com/Images/doc8161.pdf

31
9.2. Appendix B: Arduino Code for MPPT and Charge Controller
long csPin = A1; long vsPin = A0; long bPin= A2; int pwm_pin=9; int shut=10; int pwm_pin2=6; int duty; int charge_duty; int temp_duty; long prevPower; long prevVoltage; void setup() { Serial.begin(9600); pinMode (csPin, INPUT); pinMode (vsPin, INPUT); int duty = 0; int charge_duty=0; int tempduty = 0; long prevPower = 0; long prevVoltage = 0; } void loop() { duty = temp_duty; long current = readAndAvg(csPin)*26.39; long voltage = readAndAvg(vsPin)*27.08; long power = current * voltage/1000; if (abs(power - prevPower) > 1) { algorithm (voltage, power); } analogWrite (pwm_pin, duty); analogWrite (shut, 255); long bat_volt= readAndAvg(bPin)*27.08; charge_duty=(3.7-bat_volt)/0.7*255; } long algorithm (long voltage, long power) {

32
if (duty > 15 && duty < 240) { if (power>prevPower) { if (voltage<(prevVoltage+0.1)) { temp_duty = temp_duty - 2; } else { temp_duty = temp_duty + 2; } } else { if (voltage<(prevVoltage+0.1)) { temp_duty = temp_duty + 2; } else { temp_duty = temp_duty - 2; } } } else { temp_duty = 128; } prevPower = power; prevVoltage = voltage; } long readAndAvg (long pin_num) { long reading = 0; long temp = 0; for (int x = 0; x <= 0; x++) { temp = analogRead(pin_num); delay(20); temp = temp + analogRead(pin_num); delay(20); temp = temp + analogRead(pin_num);

33
delay(20); temp = temp + analogRead(pin_num); delay(20); temp = temp + analogRead(pin_num); delay(20); temp = temp + analogRead(pin_num); } reading = temp / 6; return reading; }