Embed Size (px)
Citation preview

Solar Physics with LOFAR
G. Mann, C. Vocks, and H. EnkeAstrophysikalisches Institut Potsdam
Abstract
The Low Frequency Array (LOFAR) is a novel radio telescope that operates in the frequency rangeof 30 – 240 MHz. It is a radio interferometer consisting of 77 stations that are organized in a cen-tral core at Exloo in the Netherlands and remote stations across central Europe. LOFAR’s basicworking principle is digitizing the antenna signals at each station and sending them to the CentralProcessing System (CPS) at Groningen. This novel approach provides LOFAR with a high flexi-bility, and the possibility of directing up to eight beams at different sources in the sky so that it canbe used by a corresponding number of concurrent users. A remote station is planned at the AIP’sObservatory of Solar Radioastronomy at Tremsdorf. Solar radio radiation in LOFAR’s frequencyrange emanates from the upper corona. The solar activity manifests itself in flares and coronalmass ejections (CMEs) that are strong radio sources. The impact of the solar activity on the terres-trial environment is commonly referred to as Space Weather. LOFAR will study the solar activitywith an angular resolution that is unprecedented in the meter wavelength range. Different solarobservation modes are proposed in this paper that include continuous monitoring of solar activity,the identification and flexible responses to radio bursts, as well as joint observation campaigns withother instruments. The tasks of the Solar Science Data Center that is to be established at the AIPwill additionally be introduced.

1 LOFAR — The LOw Frequency ARray
1.1 Introduction
LOFAR, the LOw Frequency ARray, is a new interferometric radio telescope that covers the fre-quency range of 30 – 240 MHz. It is currently being constructed by ASTRON at Exloo in theNetherlands. In its first construction phase, LOFAR consists of sensor fields that are arranged in a2 km diameter compact core located at Exloo with 32 stations, and 45 remote stations that providebaselines of up to 100 km.
Figure 1: LOFAR central core and remote station configuration.
Figure 1 shows the configuration of LOFAR’s central core and remote stations. Additionally tothese remote stations that are planned by ASTRON, LOFAR is open towards further remote sta-tions all over central Europe. Such remote stations provide longer baselines, e.g. Exloo – Potsdam= 450 km, and thus increase the angular resolution of the radio telescope.
1.2 Interferometry with LOFAR
In “classical” interferometry (Kraus, 1986) an array of radio dish antennae is oriented towards theobserved source in the sky. The antenna signals are correlated with well-defined delays, and animage is synthesized. With this setup, only a single source can be observed at a certain frequencyat the same time. LOFAR pursues a different approach that offers an unprecedented flexibility andversatility. LOFAR uses arrays of simple dipole antennae that essentially cover the whole sky.At each LOFAR station, the antenna signals are digitized, preprocessed and sent to the CentralProcessing System (CPS) at Groningen where the signal correlation and further data processing,e.g. image synthesis, is done. The results (“data products”) are sent to the LOFAR users and theirrespective Science Data Centers.
Thus, the radio interferometer LOFAR is basically realized in software. The price for this approachis demanding computing resources at the CPS and the necessity of fast data connections from the
2

antennae fields. Since these are available today, the LOFAR setup offers multiple advantages.First, it is possible to correlate the signals with different phase delays at the same time and toform multiple beams that point towards different sources in the sky. Thus, LOFAR can be used bydifferent observers simultaneously. Furthermore, LOFAR is highly flexible. Observing programsquickly can be changed by readjusting data processing parameters and the programming of theCPS. Finally, buffering of the raw data enables LOFAR to “look back” in time and point one of itsbeams e.g. towards a transient event, and study its nascent stage after the burst has been realizedby LOFAR or another instrument.
1.3 Sensitivity and angular resolution
The large number of LOFAR antennae results in a large collecting area of up to 1 km2 and yields anunprecedented sensitivity. The remote stations in Europe provide long baselines that are necessaryfor a good angular resolution of the interferometer.
Figure 2: Comparison of LOFAR capabilities with those of previous facilities as a function offrequency. The angular resolution (left) and the sensitivity (right) of LOFAR are shown in redtogether with those of previous low frequency radio survey facilities. From de Bruyn et al. (2002).
Figure 2 displays LOFAR’s angular resolution and sensitivity in comparison with those of existinglow frequency radio telescopes. It is evident that LOFAR will improve both quantities by morethan two order of magnitudes in the frequency of 30 – 240 MHz and thus paves the way for newdiscoveries in radio astronomy.
3
1.4 LOFAR remote station at Tremsdorf
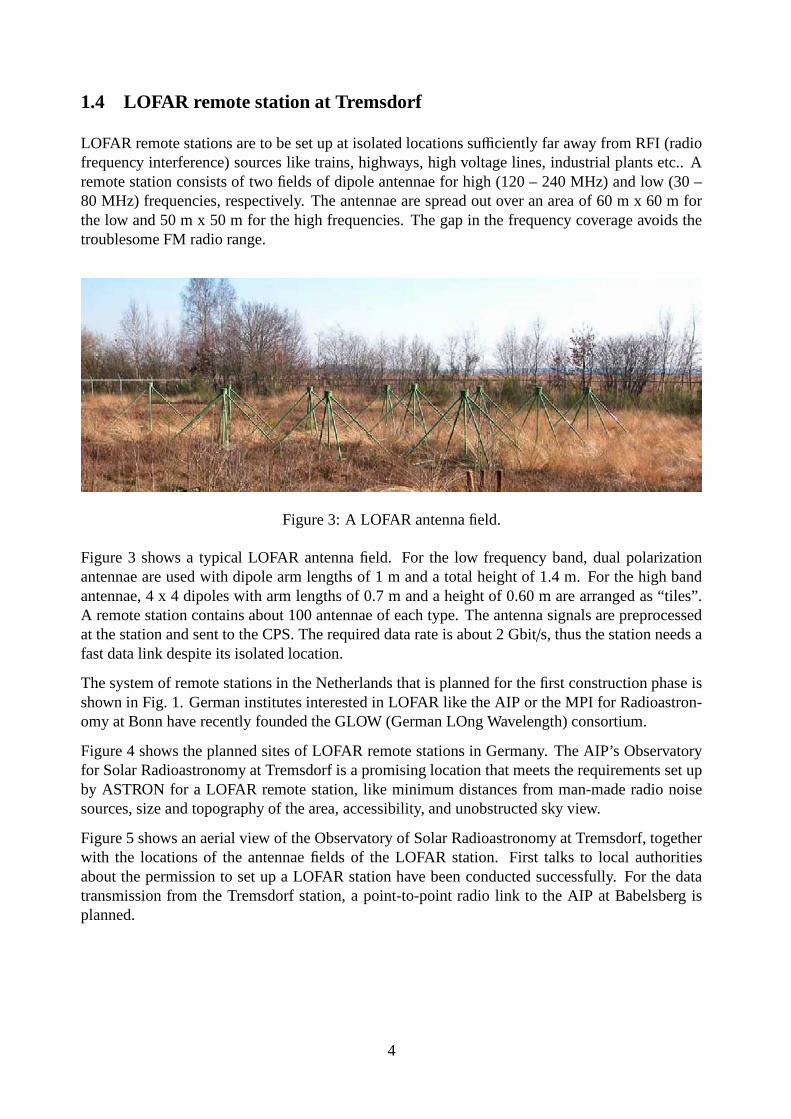
LOFAR remote stations are to be set up at isolated locations sufficiently far away from RFI (radiofrequency interference) sources like trains, highways, high voltage lines, industrial plants etc.. Aremote station consists of two fields of dipole antennae for high (120 – 240 MHz) and low (30 –80 MHz) frequencies, respectively. The antennae are spread out over an area of 60 m x 60 m forthe low and 50 m x 50 m for the high frequencies. The gap in the frequency coverage avoids thetroublesome FM radio range.
Figure 3: A LOFAR antenna field.
Figure 3 shows a typical LOFAR antenna field. For the low frequency band, dual polarizationantennae are used with dipole arm lengths of 1 m and a total height of 1.4 m. For the high bandantennae, 4 x 4 dipoles with arm lengths of 0.7 m and a height of 0.60 m are arranged as “tiles”.A remote station contains about 100 antennae of each type. The antenna signals are preprocessedat the station and sent to the CPS. The required data rate is about 2 Gbit/s, thus the station needs afast data link despite its isolated location.
The system of remote stations in the Netherlands that is planned for the first construction phase isshown in Fig. 1. German institutes interested in LOFAR like the AIP or the MPI for Radioastron-omy at Bonn have recently founded the GLOW (German LOng Wavelength) consortium.
Figure 4 shows the planned sites of LOFAR remote stations in Germany. The AIP’s Observatoryfor Solar Radioastronomy at Tremsdorf is a promising location that meets the requirements set upby ASTRON for a LOFAR remote station, like minimum distances from man-made radio noisesources, size and topography of the area, accessibility, and unobstructed sky view.
Figure 5 shows an aerial view of the Observatory of Solar Radioastronomy at Tremsdorf, togetherwith the locations of the antennae fields of the LOFAR station. First talks to local authoritiesabout the permission to set up a LOFAR station have been conducted successfully. For the datatransmission from the Tremsdorf station, a point-to-point radio link to the AIP at Babelsberg isplanned.
4

Figure 4: Sites of planned LOFAR remote stations in Germany.
Figure 5: Aerial view of the Observatory of Solar Radioastronomy at Tremsdorf, and the sites ofthe antennae fields of the LOFAR remote station.
5

2 LOFAR observations
This section provides an overview of the LOFAR data processing and transport system fromthe remote stations to the Central Processing System (CPS), especially the necessary reductionof the data to a bandwidth of about 2 Gbit/s that can be handled with today’s technologies.This data reduction has implications on LOFAR users that have to be considered when planningLOFAR observations.
2.1 Remote station data processing
The basic principle of LOFAR measurements is to digitize the signals of all station antennae and tosend the data to the Central Processing System (CPS). There, the data are further processed. Theobserved sources in the sky are selected through beamforming, i.e. correlation with proper phasedelays between the signals of different antennae. A variety of observation modes can be employedto study the beams, e.g. obtaining time series or image synthesis. The principle of performing alldata processing and analysis in a computer offers LOFAR great flexibility. Changing the observedfrequencies or moving an observation beam to another source in the sky only requires the changeof some parameters for the data processing that can be quickly done, and even the introduction ofnew observation modes is possible through adjustments of the software running on the CPS. AnyLOFAR observer could use his beam independently from the other concurrent users.
However, if LOFAR had the digitized information from all antennae at all stations available, eachremote station would produce a data rate of several tens of Gbit/s. This neither can be transmittedfrom most locations to the CPS, nor can the CPS handle the combined data flow from all stations.Thus, some data processing and reduction has to be performed on the station level. The followingprocessing steps are foreseen for each LOFAR remote station:
• Each receiver unit is connected to a low (30 – 80 MHz) and a high band (120 – 240 MHz)antenna. The receiver can only process the signals from one of these antennae.
• The antenna signal is digitized and Fourier-transformed with a bandwidth of 100 MHz, thatcovers the low band completely and most of the high band. This 100 MHz wide frequencyband is subdivided into 256 kHz bands.
• Only a total bandwidth of 32 MHz, i.e. 128 of the 256 kHz bands, can be further processed.The rest of the information is lost. These 32 MHz can be distributed among up to 8 differentbeams. Thus, it is possible to define a single beam with a total bandwidth of 32 MHz, or 8beams with a total bandwidth of 4 MHz each, or any combination in between.
• Now up to 8 station beams are formed by correlating the signals of all antennae on the stationwith phase delays that correspond to the specified direction in the sky.
• The station beam information is finally sent to the CPS
The result of this data processing is up to 8 dual polarization station beams with a total bandwidthof 32 MHz. The required data rate towards the CPS is about 2 Gbit/s and thus well within therange of today’s possibilities, e.g. through optical fibers or a radio link from the station.
6

At the CPS, the data from all stations are collected and further processed according to the needs ofthe different LOFAR users. An important step is the data calibration that is also done at the CPSby regularly pointing towards a set of reference sources, e.g. quasars, and adjusting an ionosphericmodel in order to yield agreement between the calibrated data and a reference sky model.
2.2 Implications for LOFAR users
The necessity of a station data processing has important implications for the users of LOFAR. Ifthe LOFAR data processing was as simple as outlined in the beginning of the previous subsection,each users could select observation objects, frequencies, and observing modes according to hisneeds and entirely independent from other users, except for the limitations of total computingpower and data bandwidth. But since the data flow from the remote stations is limited to 2 Gbit/s,some information necessarily is lost. This leads to some limitations for LOFAR users, and to somedependencies between concurrent observing programs:
• The formation of station beams limits the field of view of each beam. For a station with asize of L = 200 m and a wave frequency of 150 MHz (wavelength λ = 2 m), the diameterof the station beam can be estimated as 2 · λ/L = 2 · 10−2 rad = 2.2◦. This is not a stronglimitation, e.g. it is shown below that this does not limit solar applications. All sky surveysthat need large fields of view will mainly use the central core of LOFAR that is not subjectto station beam limitations.
• Since the antenna receivers are connected to either the low or the high band antennae, obser-vations in either frequency range have to be coordinated with other LOFAR users. This hasto be considered in LOFAR’s observation planning.
• A user that operates one of 8 observation beams is limited to a total bandwidth of 4 MHz,i.e. 16 subbands of 256 kHz width each. But since this selection is performed by the stationdata processing and realized in software, flexible and fast changes of the subbands should bepossible.
At the CPS, the 256 kHz bands are further subdivided into 1 kHz subbands, that define LOFAR’sspectral resolution. The temporal resolution is consequently limited to 1 ms. The integration timesare also noteworthy. For sensitivities of the order 1 mJy as displayed in Fig. 2, an integration timeof 1 hour is necessary. For the Sun as a bright radio source, much smaller integration times aresufficient. The intensity of the quiet Sun’s thermal radiation at 40 MHz is about 200 Jy, and it in-creases with increasing frequency. Thus, the integration times are not much longer than LOFAR’stemporal resolution.
To summarize, the necessary station data processing imposes on LOFAR users the restriction to a4 MHz section of the total spectrum that is available at the same time, and it requires a coordinationwith other observers on the choice of the high or low frequency band.
7

2.3 LOFAR Key Science Projects
The new radiotelescope LOFAR has a wide range of applications that cover many scientific objec-tives. Science with LOFAR is organized in “Key Science Projects” that address certain topics. Inthe Netherlands, the following Key Science Projects currently are defined:
• Epoch of Reionization of the Universe
– Determination of the epoch of reionization
– Information on the sources of reionization (UV radiation of hot stars or X-rays fromblack holes)
– Measure the power spectrum of fluctuations as a function of redshift
• All-sky surveys
– Observations with large field of view
– Star forming galaxies, AGN, clusters, etc.
– More than 100 m. new sources expected to be found
• Detection of transient events
– Multiple station beams cover a significant part of the sky
– Daily monitoring of a large fraction of the sky
– Flare stars, X-ray binaries, supernovae, gamma ray bursts, etc.
• Cosmic ray showers
– Detection of cosmic rays through gyrosynchrotron emission of electrons and protonsin Earth’s atmosphere
– Derivation of air shower properties
But these key science projects are not exclusive. LOFAR science covers the early universe, thestructure and evolution of galaxies, galactic astronomy and supernova remnants, as well as solarand stellar physics, stellar-planetary systems, especially the Sun-Earth system, and ionosphericphysics.
8

3 Solar radio astronomy with LOFAR
The flexible and versatile radio telescope LOFAR is very well suited for solar radio astronomy. TheSun as our closest star is an intense source of radio waves. The already strong thermal radiation ofthe quiet Sun is superimposed by intense radio bursts that are associated with phenomena of thesolar activity like flares and coronal mass ejections (CMEs).
The theory of space plasmas provides the tools for investigating the physics of the source regionsof solar radio emission as it is observed on Earth, e.g. by LOFAR. Thus, radio waves can be usedto investigate the physical parameters within flares and CMEs, and to gain insight into their mech-anisms. Radio waves can be generated by manifold processes in these manifestations of solaractivity. Basically, energetic electrons are needed for non-thermal radio emission. The energeticelectrons excites high frequency plasma waves, e.g. Langmuir or upper-hybrid waves, which con-vert into electromagnetic (radio) waves. Thus, the radio waves are emitted at the local electronplasma frequency
fpe =1
2π
√
Nee2
meε0(1)
and/or its harmonics (Melrose, 1985). Ne is the electron number density of the plasma, and me theelectron mass. For instance, electrons can directly be accelerated in a flare and then be injected intomagnetic field geometries that are open towards the higher corona or interplanetary space, leadingto the formation of type III radio bursts, see (Suziki & Dulk, 1985) for a review.
Figure 6: Joint observation of UTR-2 and the Tremsdorf solar radioobservatory of the solar radioevent of 6 July 2002 (Mel’nik et al., 2004).
Figure 6 presents an example for a joint radio observation of the solar event of 6 July 2002 bythe DSP in Kharkov, Ukraine, and the radio observatory in Tremsdorf (Mel’nik et al., 2004). Thefrequency range covers LOFAR’s low band (30 – 80 MHz). The figure clearly shows type IIIbursts as features with very high frequency drift rates, i.e. nearly vertical lines. Another source ofradio radiation are shock waves, which are produced either by a flare or a CME. If such a shockwave is able to accelerate electrons up to supra-thermal velocities, it can emit radio waves via the
9

mechanism described above (Mann, 1994). These radio waves manifest themselves as a type IIradio burst in dynamic radio spectra with lower frequency drift rates than the type III bursts. TypeII bursts can also be identified in Fig. 6.
3.1 Analysis of solar low frequency radio radiation
It has already been noted that the frequency of solar radio radiation corresponds to the local plasmafrequency, Eq. (1) or its harmonic at the source region. It is noteworthy that the plasma frequencyonly depends on the electron number density and natural constants. It is independent of the mag-netic field and electron or ion temperatures. Due to this connection, the electron density at thesource is immediately known whenever solar radio radiation is received.
1 10 100100
101
102
103
104
105
106
107
108
109
1010
N (
cm-3)
R / RS
Figure 7: Heliospheric density model of Mann et al. (1999)
In order to determine the source’s height in the solar corona, a heliospheric density model is neededthat provides information on the variation of the electron density with distance from the Sun.Figure 7 shows the heliospheric density model of Mann et al. (1999). R is the distance from thesolar center. With this model, frequencies can now be converted into solar distances. The modelcovers the whole corona, the transition into the solar wind and the interplanetary space up to 1AU. With the density model, the plasma frequency can now be calculated as function of the solardistance:
f [MHz] 30 40 70 100 170 240R/R� 1.80 1.68 1.48 1.37 1.24 1.17
Table 1: Frequencies in the LOFAR range and corresponding solar distances according to thedensity model from Fig. 7
Table 1 clearly shows that the source regions of radio waves in LOFAR’s frequency range of30 – 240 MHz are located in the upper corona with a minimum value of R = 1.17 R� for the highestfrequencies, that approximately corresponds to a height of 120,000 km above the photosphere.
10
With the density model at hand, it is also possible to transform the frequency drift rates of so-lar radio bursts into source velocities. From the definition of the plasma frequency, Eq. (1),it follows that:
d fdt=
f2Ne
dNe
drVS ource (2)
With this relation it is possible to investigate the speed and thus energy of electron beams fromtype III burst drift rates, or shock velocities from type II bursts. Generally, it is now possible totransform dynamic radio spectrograms into coronal height-time diagrams, see e.g. (Warmuth &Mann, 2004) as a review.
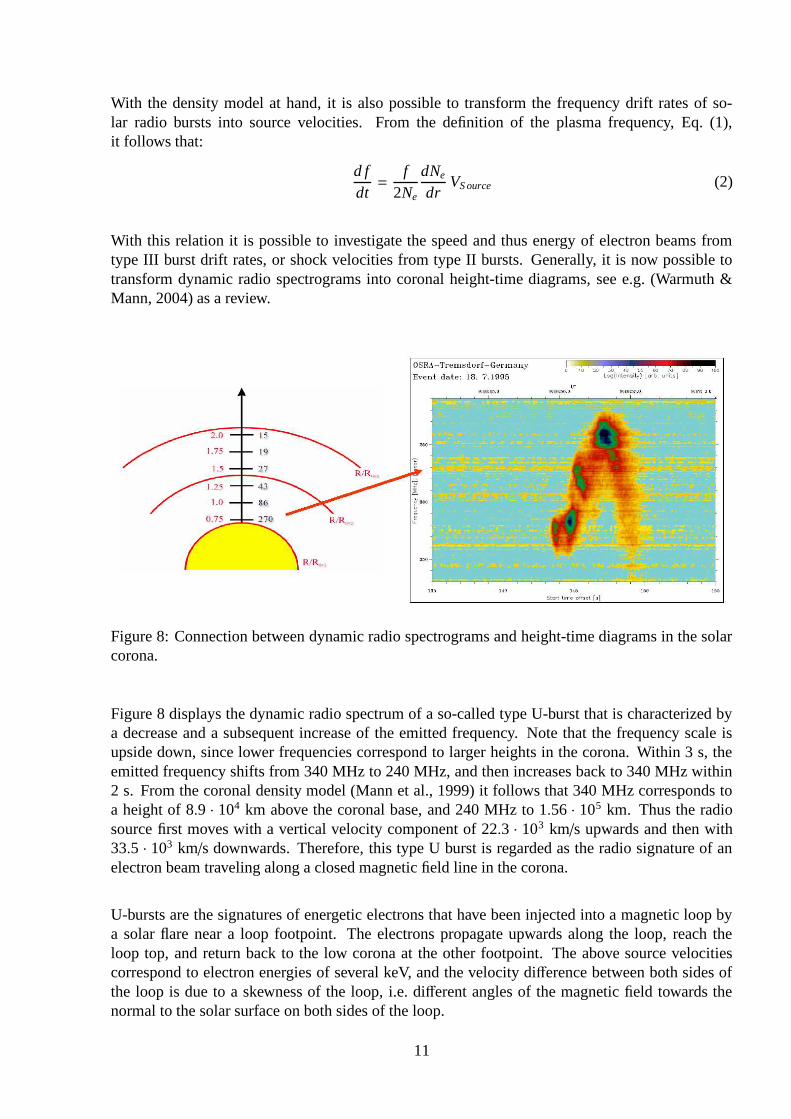
Figure 8: Connection between dynamic radio spectrograms and height-time diagrams in the solarcorona.
Figure 8 displays the dynamic radio spectrum of a so-called type U-burst that is characterized bya decrease and a subsequent increase of the emitted frequency. Note that the frequency scale isupside down, since lower frequencies correspond to larger heights in the corona. Within 3 s, theemitted frequency shifts from 340 MHz to 240 MHz, and then increases back to 340 MHz within2 s. From the coronal density model (Mann et al., 1999) it follows that 340 MHz corresponds toa height of 8.9 · 104 km above the coronal base, and 240 MHz to 1.56 · 105 km. Thus the radiosource first moves with a vertical velocity component of 22.3 · 103 km/s upwards and then with33.5 · 103 km/s downwards. Therefore, this type U burst is regarded as the radio signature of anelectron beam traveling along a closed magnetic field line in the corona.
U-bursts are the signatures of energetic electrons that have been injected into a magnetic loop bya solar flare near a loop footpoint. The electrons propagate upwards along the loop, reach theloop top, and return back to the low corona at the other footpoint. The above source velocitiescorrespond to electron energies of several keV, and the velocity difference between both sides ofthe loop is due to a skewness of the loop, i.e. different angles of the magnetic field towards thenormal to the solar surface on both sides of the loop.
11

3.2 Solar observations with LOFAR
Figure 9: Nancay radio heliograph image of of 14 March 2000.
The solar radio data presented so far have been recorded with radio telescopes like Tremsdorf orUTR that do not have a sufficient spatial resolution to observe any details of the Sun. The Sunis just a point source to them. At low frequencies, only a few instruments observe the Sun withrelatively coarse resolution, e.g. the radioheliograph at Nancay, France. LOFAR will dramaticallyimprove the situation with resolutions in the arcsecond range.
Figure 10: The Sun in the light of the resonance lines of eight and nine times ionized iron (Fe IX/X)at 171Å that is emitted at a temperature of 106 K. The image was recorded on 11 September 1997by the EIT instrument onboard the SOHO spacecraft.
12

Figure 10 shows an EUV image of the solar corona that was recorded by the EIT instrumentonboard the SOHO spacecraft on 11 September 1997. The resolution of the image is approximately2”. LOFAR will be able to observe the solar corona in low frequency radio waves with a similarresolution. The comparison with the Nancay radioheliograph image in Fig. 9 demonstrates thehuge progress. LOFAR will reveal fine structures in coronal radio sources that are yet unexplored.
When planning LOFAR full Sun images, the limited field of view that is available to a each userhas to be taken into account. In Section 2.2 it has been noted that the preprocessing of the dataat the LOFAR remote stations limits the station beams to a diameter of 2 · λ/L, with λ beingthe wavelength and L = 200 m the station size. For LOFAR’s low frequency limit of 30 MHz,i.e. λ = 10 m, the beam diameter is 5.7◦. From Table 1 it follows that this corresponds to a largestaccessible height of r = 1.8 R� in the corona. Since 1 R� appears from the Earth under an viewingangle of about 0.5◦, this radio Sun has an angular diameter of 1.8◦ and thus fits well into the 5.7◦
beam. For LOFAR’s high frequency limit of 240 MHz (λ = 1.25 m), the corresponding numbersare a station beam diameter of 0.72◦ and a coronal height of r = 1.17 R� that corresponds to anangular diameter of the radio Sun of 0.59◦. So it can be concluded that the field of view limit isnot critical for LOFAR solar observations.
It is also important to assess the memory demand for LOFAR full Sun images. From the angularresolutions in Fig. 2 and the solar angular diameters that result from the solar distances of wavesource regions in Table 1 it follows that image sizes of 1000×1000 pixels are a reasonable estimate.For low frequencies, the images have to extend over larger viewing angles, but the resolutiondecreases, and for high frequencies LOFAR’s resolution becomes better, but the images have tocover smaller viewing angles. A 16 bit sampling results in 2 Byte/pixel, and if the polarization ischaracterized by the 4 Stokes vectors, the total image size will result in:
106 pixel × 2 Byte/pixel × 4 = 8 MByte per image
But this assessment does not include any kind of data compression. Generally, image compressionalgorithms can reduce file sizes by an order of magnitude without (e.g. GIF) or with minimal (e.g.JPEG) loss of information. Thus, image sizes of less than 1 MByte are reasonable.
3.2.1 Monitoring with LOFAR
The high flexibility of the LOFAR instrument offers several different modes for solar observations.Some examples are presented in the next subsections. A standard mode will be continuous mon-itoring of the Sun. This mode will allow for studies of the long-term evolution of solar activeregions and provides information on the precursors of solar radio bursts, flares, and CMEs. Opti-cal solar observatories routinely monitor the Sun, e.g. the Kanzelhohe Solar Observatory (KSO),Austria, with an image cadence of 1 picture per minute.
With LOFAR it will be possible to produce solar images in different selected frequencies in regularintervals and to archive the images. Since either the low (30 – 80) MHz or the high band (120 –240) MHz is available at the same time, see Sect. 2.2, two sets of frequencies for the two bandshave to be defined. The resulting data volume can be easily estimated. It has been found in theprevious subsection that a LOFAR image of the Sun requires uncompressed 8 MByte. One LOFARbeam will be available to solar observations for 8 hours per day. If the Sun is observed in 5 differentfrequencies with an image cadence of 3 minutes, the daily data require:
8 h × (60/3) images/h × 5 × 8 MByte/image = 6.4 GByte/day
13
Again, this number only refers to uncompressed data, and it can be reduced by an order of magni-tude easily. Thus, after compression the data rate produced by such a monitoring mode correspondsto 1 CD/day, or one state-of-the-art harddisc per year. Thus, archiving the data and making themaccessible to the scientific community through the Solar Science Data Center is not a problem.
time
Radio spectra
(Tremsdorf)
LOFAR images(several frequencies)
Optical images(e.g. Kanzelhöhe)
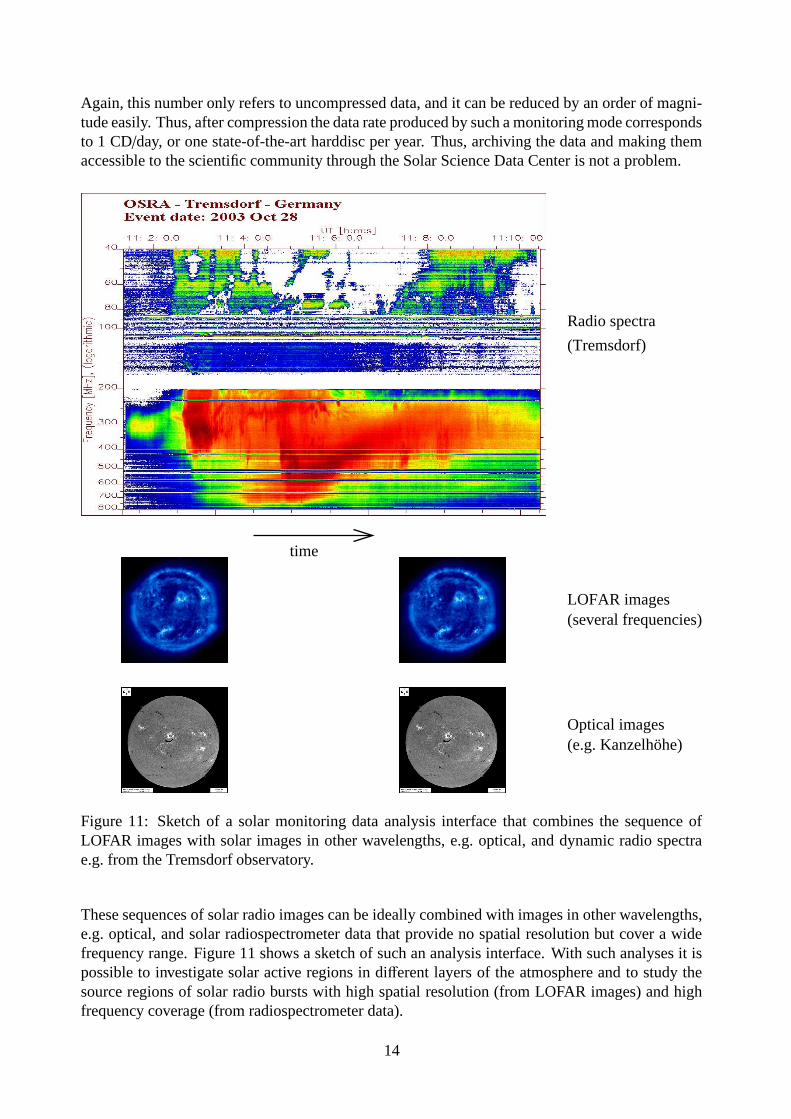
Figure 11: Sketch of a solar monitoring data analysis interface that combines the sequence ofLOFAR images with solar images in other wavelengths, e.g. optical, and dynamic radio spectrae.g. from the Tremsdorf observatory.
These sequences of solar radio images can be ideally combined with images in other wavelengths,e.g. optical, and solar radiospectrometer data that provide no spatial resolution but cover a widefrequency range. Figure 11 shows a sketch of such an analysis interface. With such analyses it ispossible to investigate solar active regions in different layers of the atmosphere and to study thesource regions of solar radio bursts with high spatial resolution (from LOFAR images) and highfrequency coverage (from radiospectrometer data).
14

3.2.2 Response to solar radio bursts
Beside of routine monitoring of the Sun, LOFAR’s flexibility can be used to trigger automaticresponses to transient phenomena like solar radio bursts. This first leads to the task of identifyinga burst in the radio data. Such a trigger mechanism is called ‘burst bell”. A method analogous tothe burst trigger mode of the Burst and Transient Source Experiment (BATSE), see (Aschwandenet al., 1995), can be implemented. The method is based on calculating the standard deviation σ ofthe count rates recorded by BATSE within a previous time window. If the count rate increases bymore than 5.5σ in two energy channels, this is considered as a burst.
For LOFAR, a “burst bell” can work in a similar way. Depending on the current availability ofthe low or high band, the total power on the frequencies 40 MHz and 70 MHz or 150 MHz and200 MHz can be monitored. The power is averaged over a time window of e.g. three minutes thatis sufficiently long compared to the growth times of solar radio bursts, and the standard variationσ is calculated. If the power exceeds the average by more than 5.5σ on both frequencies, this isconsidered as a solar radio burst. Once a burst is identified, the “burst bell” serves to purposes:
• Alert other working groups and other instruments in order to trigger follow-up observationsin different wavelength ranges.
• Perform a pre-defined series of follow-up observations with LOFAR in order to study theevolution of the radio source both in frequency and space.
An example of LOFAR observations triggered by the detection of a solar radio burst is a sequenceof solar images with high cadence, and with different frequencies that are adapted to the frequencydrift of the burst. From the technical description of the LOFAR data processing in Sect. 2.1 isfollows that this requires an continuous readjustment of the 4 MHz selection out of the currentlyobserved frequency band that is available to the solar beam. This is controlled by the CentralProcessing System and can be pre-programmed. Thus, LOFAR’s flexibility due the realization ofmuch of the interferometry in software makes it ideal for this task.
Since the source region of radio waves in the LOFAR frequency range between 30 MHz and 240MHz is located in the upper corona, the observation of solar radio bursts is especially importantin the context of studying the release mechanism of CMEs. As soon as a CME reaches super-sonic/superalfvenic speed, it drives a shock wave (Mann, 1994) that is capable of acceleratingelectrons to high energies. These electrons lead to the emission of type II radio bursts (Aurass,1996). LOFAR observations of nascent CMEs provide spatial information that helps determiningthe direction of the CME as it heads towards interplanetary space. This helps assessing the poten-tial impact of a CME on Earth. The study of CMEs connects LOFAR observations of solar radiobursts closely with Space Weather research.
3.2.3 Observation campaigns
In the previous subsections the continuous task of monitoring the radio Sun has been described. Incase of the detection of solar radio bursts the monitoring is interrupted and a predefined follow-upobservation program is performed that provides a detailed investigation of the burst. Beside ofthese basic observational activities, LOFAR can be used for specific observation campaigns thattarget special aspects of the solar activity.
15

An example is the acceleration of energetic electrons in solar flares. These electrons do not onlyproduce radio waves that can be observed by LOFAR, but also X-rays as they interact with the solaratmosphere. Thus, joint observations with X-ray instruments like the upcoming Japanese Solar-B(http://solar.nro.nao.ac.jp/solar-b/index e.html) and NASA’s Solar Dynamics Observatory (SDO,http://sdo.gsfc.nasa.gov) are well suited for studying the production and propagation of energeticparticles. The strong heating of the solar atmosphere results in intense EUV radiation that will bestudied by SDO, and also by Solar-B. Additional images in optical wavelengths with GREGOR orthe Kanzelhohe observatory provide further information on the connection of the acceleration sitewith the photosphere, and mm-wave data, e.g. from the Atacama Large Millimeter Array (ALMA,http://www.eso.org/projects/alma), reveal the response of the chromosphere.
Another example is the study of CMEs at they travel through the interplanetary space. Withinthe next decade, the missions STEREO (http://stereo.gsfc.nasa.gov/mission/mission.shtml), KuaFu(http://ilws.gsfc.nasa.gov/ilws kuafu0405.pdf), and Solar Orbiter (http://sci.esa.int/science-e/www/area/index.cfm?fareaid=45) will collect radio and in-situ plasma data on CMEs, while LOFARprovides images of the nascent CME as it accelerates in the upper solar corona. STEREO hasthe special advantage that the mission consists of two nearly identical spacecraft, one ahead ofEarth in its orbit, the other trailing behind. Thus, it provides a stereoscopic, 3-dimensional view ofCMEs heading towards Earth, and it covers the frequency range of 16 MHz – 30 kHz that is notaccessible from Earth. Together with the LOFAR images, this will enable unprecedented studiesof the spatial structure of the CME release mechanism. These joint observations also benefit fromLOFAR’s “burst bell” that was introduced above.
4 Solar Science Data Center
The LOFAR data are not analyzed at each station, but are sent to the Central Processing System atGroningen as it has been discussed in Sect. 2.1. Only the collection of the data from all stationsyield LOFAR’s sensitivity and angular resolution. At the CPS, the incoming data are processedand “data products” are produced according to the needs of the different observers. Examples ofsuch data products are radio images or time series of radio fluxes of a certain source.
But these data are not routinely archived at the CPS for a long time, and a scientific data analysisis also not done there. Instead, the data products are sent to different Science Data Centers (SDCs)that are dedicated to special research interests. Fast network connections of 1 Gbit/s are envisagedbetween the CPS and the SDCs that enable a quick transfer of observational data toward eachSDC. The Science Data Centers are responsible for LOFAR’s Key Science Programs. They arecenters for the scientific expertise of low frequency radio observations in the relevant field, andthey perform the following tasks:
• Development of observational modes needed to address the scientific questions.
• Planning of observations, depending on the availability of the required frequency range thatdepends on the requests of concurrent users, and thus has to be organized by the CPS.
• Performance of observational programs, either automatically or interactively.
• Archiving of the Data.
• Dissemination of the data to the scientific community.
16

4.1 LOFAR and Grid technology
The operation of a Science Data Center (SDC) requires the storage of large amounts of data of theorder of many hundred TByte or even a PByte. Furthermore, the processing of these data by userswho are not physically located at the Science Data Center makes distributed computing resourcesessential.
With the concept of SDCs, the tier model, that has been developed by the High Energy Physics(HEP) Community at the European Organization for Nuclear Research (CERN), is adapted to theneeds of the LOFAR instrument. At CERN, this model has been used for the Large Hadron Collider(LHC) data. The first tier, the Central Processing System (CPS), generates the data products of theinstrument. The second tier, formed by the SDCs, receive and store part of the data product forfurther processing and analysis.
To manage distributed data storage for LOFAR data products, Grid technology, e.g. the dCache(http://www.dchache.org), is available to ensure the integrity and transparent accessibility acrossdifferent SDCs. The SDCs are connected within a Grid framework that provides facilities for run-ning data analysis tools on LOFAR products remotely. Furthermore, the Grid framework enablesaccess to distributed computing resources for such tasks. Science Data Centers will provide por-tals for scientific users accessing the LOFAR grid. The Grid includes security mechanisms thatwill ensure the protection of the resources and the users. The concept of a Virtual Organization,which builds on the grid security, facilitates the formation of collaborations. Thus, the Grid is animportant component of the development of E-Science.
4.2 The Solar Science Data Center
A Solar Science Data Center is planned to be established at the AIP. This SDC will organize theLOFAR solar observations and archive the data. Figure 12 summarizes the tasks of the Solar SDC.
Monitoring
"Burst bell"
Campaigns
Searchable database
Virtual Solar Observatory
Data storage
Archive
Solar Science Data Center
Observations
Figure 12: Diagram of the tasks of the Solar Science Data Center.
17
The observational duties comprise the development of observational programs and data analysistools that are necessary to derive quantitative information on the state of the solar corona fromthe LOFAR data, as well as the performance of the observations itself. The different observationprograms have been introduced in Sect. 3.2 above. At the SDC, the observations are planned,and the required observation programs and parameters, e.g. frequencies, are sent to the CPS. It isnoteworthy that “burst bell” from Sect.3.2.2 can not only be used to interrupt the routine moni-toring for fast responses to solar radio bursts, but is also useful for triggering special observingprograms of cooperating instruments during joint observations in specialized campaigns. Alertingthem is a task of the Solar SDC, as well as starting follow-up observations at the CPS as part ofLOFAR’s response.
The other main task of the Solar SDC is archiving the observations once the data products havebeen sent from the CPS. This includes the storage of the data, but also making them availableto the scientific community. Since the routine monitoring and specialized campaigns generate amultitude of different observations, a searchable database is necessary in order to let a scientistfind the relevant information. Thus, the SDC fulfills the task of a Virtual Solar Observatory.
5 Summary
LOFAR opens a new spectral window for high-sensitivity and high-resolution observations in themeter wave range. The telescope consists of a central core and remote stations that are spreadover central Europe. A remote station is planned at the site of the AIP’s Observatory for SolarRadioastronomy at Tremsdorf.
LOFAR follows the approach of digitizing the antenna signals at each station, sending the data tothe Central Processing System (CPS) at Groningen, and realizing the radio interferometry there insoftware. This offers LOFAR a high flexibility and allows fast changes of observation programsand thus responses to transient events. However, the sheer volume of raw data requires stationdata processing and reduction that results in some loss of information. As a consequence, thisleads to some restriction for the users as compared to an ideal instrument where each user can dohis observations without any interference with concurrent users. These limits are the selection ofeither the low (30 – 80 MHz) or high (120 – 240 MHz) frequency band at a time and a limitedbandwidth of 4 MHz out of this band that is available to each of 8 observation beams. But thelatter restriction is alleviated by the possibility of fast changes of the observed frequency.
The Sun is an strong radio source, and the solar activity leads to intense radio bursts that accompanyflares and Coronal Mass Ejections (CMEs). The source regions of LOFAR frequencies are locatedin the upper solar corona, and thus provide information on the nascent phase of CMEs as they headtowards interplanetary space. Thus, LOFAR contributes to estimates of their impact on Earth,especially in combination with the data from upcoming satellite missions like STEREO, SDO,Solar-B, and Solar Orbiter.
For LOFAR observations of the Sun different modes are proposed. The basic mode is routinemonitoring with full Sun images that are taken, e.g., with a cadence of 3 min and on 5 different fre-quencies. The estimated data rate of such a mode is 6.4 GByte/day. Image compression can reducethis by one order of magnitude with no or minimal loss of information, and thus yield manageabledata volumes. Such observations allow studies of the long-term evolution of active regions and
18
the precursor phase of solar flares. The combination with other solar monitors, e.g. optical (Hα)images from the Kanzelhohe Solar Observatory, Austria (http://www.kso.ac.at/).
During such a monitoring mode, the signals can also be checked for solar radio bursts. Once a burstis identified, a fast response with follow-up observations can be triggered. Such a “burst bell”is also useful for other working groups operating different ground- or space-based instruments.Beside of such routine tasks, specialized campaigns can be undertaken, e.g. for more detailedstudies of selected active regions by joint observations with other instruments.
For the planning, performance as well as data analysis and archiving a Solar Science Data Cen-ter (SSDC) will be established at the AIP. The SSDC will concentrate the expertise in solar lowfrequency radio astronomy and will be responsible for all aspects of solar radioastronomy withLOFAR. The observational methods will be developed there, and the observations are planned andperformed by sending the requirements to the CPS and receiving the data products from it. At theSSDC the data are analyzed, archived, and disseminated to the scientific community.
Acknowledgement
The authors thank the LOFAR working group at the AIP (Prof. Dr. M. Steinmetz, Dr. H. Aurass,Dipl.-Ing. U. Hanschur, Dipl.-Phys. G. Rausche, Dipl.-Ing. A. Saar, and Dr. A. Warmuth) for manystimulating discussions.
Contact information
Prof. Dr. Gottfied Mann
Tel.: +49-331-7499-292, E-Mail: [email protected]
Dr. Christian Vocks
Tel.: +49-331-7499-327, E-Mail: [email protected]
Dr. Harry Enke
Tel.: +49-331-7499-433, E-Mail: [email protected]
All at:
Astrophysikalisches Institut PotsdamAn der Sternwarte 1614482 Potsdam, Germany
Fax: +49-331-7499-352
19

References
Aschwanden, M. J., Schwartz, R. A., Alt, D. M.: 1995, ApJ, 447, 923
Aurass, H.: 1996, in Coronal Physics from Radio and Space Observations, Ed. G. Trottet, LectureNotes in Physics, 483, 135, Springer, Berlin
de Bruyn, A. G., Fender, R. P., Kuijpers, J. M. E., Miley, G. K., Ramachandran, R., Rottgering, H.J. A., Stappers, B. W., van de Weygaert, M. A. M., van Haarlem, M. P. (eds.), “Exploring theUniverse with the Low Frequency Array – A Scientific Case”, ASTRON, 2002
Kraus, J. D., “Radio Astronomy”, Cygnus-Quasar Books, Powell, 1986
Mann, G.: 1994, in Coronal Magnetic Energy Releases, Ed. A. O. Benz, A. Kruger, Lecture Notesin Physics, 444, 183, Springer, Berlin
Mann, G., Jansen, F., MacDowall, R. J., Kaiser, M. L.: 1999, A&A, 348, 614
Mel’nik, V. N., Konovalenko, A. A., Rucker, H. O., Stanislavsky, A. A., Abranin, E. P., Lecacheux,A., Mann, G., Warmuth, A., Zaitsev, V. V., Boudjada, M. Y., Dorovskii, V. V., Zaharenko, V. V.,Lisachenko, V. N., Rosolen, C.: 2004, Solar Phys., 222, 151
Melrose, D.: 1985, in Solar Radio Physics, Ed. D. J. McLean & N. R. Labrum, Cambridge Uni-versity Press, Cambridge
Suzuki, S., Dulk, G. A.: 1985, in Solar Radio Physics, Ed. D. J. McLean & N. R. Labrum, Cam-bridge University Press, Cambridge
Warmuth, A., Mann, G.: 2004, in Space Weather, Ed. K. Scherer, H. Fichtner, B. Heber, U. Mall,Lecture Notes in Physics, 656, 49, Springer, Berlin
20