Embed Size (px)
Citation preview
24-Mar-04 1
Solar Irradiances, Geomagnetic Events, and Total Electron Content Beginning Oct 2003
Bouwer, S.D'., W.K. Tobiska', A. Komjathy'', B. Wilson'', X. Pi'', and A. Mannucci''
' Space Environment Technologies'' Jet Propulsion Laboratories
• Solar Irradiance Indices• Total Electron Content comparison of 28 Oct 04 (X-ray flare)
to 30 Oct 04 (Geomagnetic event)• Thermospheric and Ionospheric Effects• The SOLAR2000 Irradiance Model and E10.7

24-Mar-04 2
Solar Indices and Active Region Evolution
• F10.7 significantly differs from E10.7(see page 9) over a solar rotation (and longer time scales)
– F10.7 cm flux (2800 MHz radio) represents a mixture of coronal and photospheric variations, and has no thermospheric effect
– E10.7 (the integrated 1-105 nm soft X ray and EUV flux in F10.7 units) represents both coronal and chromospheric variations, and better represents the energy input to the thermosphere
• In general, active region evolution has a dominant pattern of a rapid rise and gradual decay over 4-5 solar rotations
– A solar rotational effect in the flux seen at Earth is related to the relative opacity of the solar atmosphere to solar irradiances
• A better index to coronal variations is needed to better represent the X-ray irradiances
E10.7 and F10.7
50
100
150
200
250
300
9/1/03 9/29/03 10/27/03 11/24/03 12/22/03 1/19/04 2/16/04
Date (27-day)
F10E10
Images courtesy of the SOHO/EIT Consortium

24-Mar-04 3
Solar Indices, 13 Oct to 9 Nov, 2003
• E10.7 (see page 9) represents the integrated spectrum from approximately 1-105 nm, with both chromospheric and coronal components
– Employs the Penticton F10.7 and NOAA SBUV Mg II data (in Ly-alpha units)
• A Daily Background X-ray index, Xb = weighted daily hourly minimum of 100*log((X-ray 1-8A flux)*10E+10),shows a different rotational modulation
– Time series curve of 1-8 A X-rays is due to the X-ray irradiance through an optically thin solar atmosphere as the evolving active region rotates across the disk
– Xb reduces the short-term logarithmic flares in the time series, creating a daily coronal index on a linear scale
Solar Indices, 13 Oct - 9 Nov, 2003
350
400
450
500
550
600
10/1
3/03
10/1
4/03
10/1
5/03
10/1
6/03
10/1
7/03
10/1
8/03
10/1
9/03
10/2
0/03
10/2
1/03
10/2
2/03
10/2
3/03
10/2
4/03
10/2
5/03
10/2
6/03
10/2
7/03
10/2
8/03
10/2
9/03
10/3
0/03
10/3
1/03
11/1
/03
11/2
/03
11/3
/03
11/4
/03
11/5
/03
11/6
/03
11/7
/03
11/8
/03
11/9
/03
Date
Background 1-8A X-ray
Penticton F10.7 (+300)
Lya (From MgII c/w)Solar2000 E10.7 (+300)
QuickTime™ and aTIFF (LZW) decompressor
are needed to see this picture.

24-Mar-04 4
"Halloween" Events, 13 Oct - 9 Nov 2003
Images courtesy of the SOHO/EIT Consortium
• Oct 28 and Nov 4 were primarily X-ray events (low Kp), although Oct 22-23 saw several M-class flares• At Earth, major Geomagnetic and particle events persisted throughout Oct 29-31
•In general, the variation of X-rays over a solar rotation is what we expect for an optically thin solar atmosphere

24-Mar-04 5
Thermospheric Heating from Solar EUV Compared to Joule Heating
• Generally, Solar EUV is responsible for approximately 80% of thermospheric heating;
• Except during major geomagnetic disturbances, when Joule heating dominates
• Hemispheric particle power during solar-induced particle events is a 2nd-order effect
Daily Average Power Values for Max and Decline of Solar Cycle 23
0
500
1000
1500
2000
2500
3000
2000 2001 2002 2003 2004
Year
Pow
er (G
W)
Joule Power*2 Electron Pcp Power*2 Sum Solar Power
Jul 15&16 Aug 12 Mar 31 Nov 6 Nov 24 Oct 29 &30 Nov 20 2000 2000 2001 2001 2001 2003 2003
Climatology of Extreme Upper Atmosphere Heating Events, D.J. Knipp et. al., ASR, in press

24-Mar-04 6
TIMED GUVI and Solar Indices, 12 Jul - 8 Aug 2002
• Thermospheric heating for a period of time similar to the Halloween events was measured by the TIMED GUVI instrument in 2002
• A suggestion of coronal components in the GUVI data may be represented by the daily background 1-8 Angstrom X-ray index Xb (1-minute 1-8 A X-ray flux red line in fig)
– The GUVI local minima near DOY 200 and the slowly declining slope after DOY 210 are not as apparent in the other solar indices as in Xb
– Flares in GUVI data correspond to GOES X-ray flares
• Can the 4-40 nm component in thermospheric heating be represented by a 1-8 A X-Ray index?

24-Mar-04 7
Qeuv Heating Rate
• Thermospheric heating (Qeuv) by solar flux in soft X-ray and EUV wavelengths dominates thermospheric heating
• other derivative SOLAR2000 products include:
•derived sunspot number, Rsn (unitless),•exospheric temperature at 450 km, Tinf (K)•EUV hemispheric power, Peuv (GW)
• To the extent soft X-ray (in the 1-40 nm range, E1_40) is correlated with the 1-8 Angstrom index Xb, a new coronal proxy may be possible
Relative thermospheric Qeuv heating rate near solar maximum, calculated using the SOLAR2000 empirical model (see page 9)

24-Mar-04 8
JPL Total Electron Content• TEC collected from over 100 GPS stations by the JPL Ionospheric and Atmospheric Remote Sensing Group• The X-Ray flare at 11 UT on Oct 28 is responsible for enhanced TEC
• Extensive latitudinal effect• Duration of enhanced TEC lasted only several hours
• In contrast, the geomagnetically induced TEC increase on Oct 30 was much larger, and persisted for several days
24-Mar-04 9
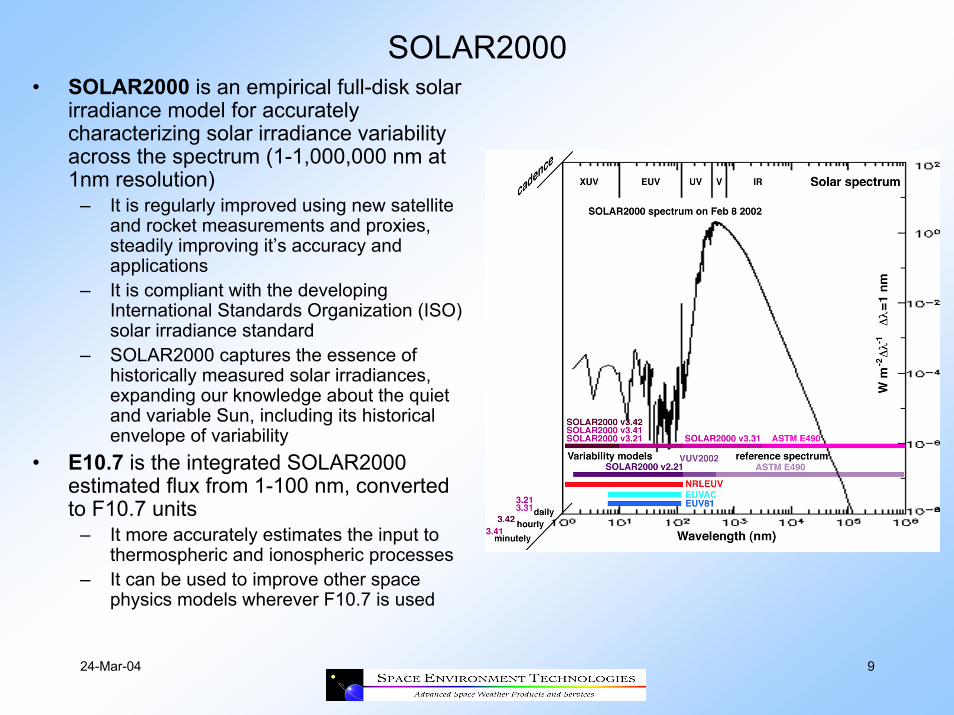
SOLAR2000• SOLAR2000 is an empirical full-disk solar
irradiance model for accurately characterizing solar irradiance variability across the spectrum (1-1,000,000 nm at 1nm resolution)
– It is regularly improved using new satellite and rocket measurements and proxies, steadily improving it’s accuracy and applications
– It is compliant with the developing International Standards Organization (ISO) solar irradiance standard
– SOLAR2000 captures the essence of historically measured solar irradiances, expanding our knowledge about the quiet and variable Sun, including its historical envelope of variability
• E10.7 is the integrated SOLAR2000 estimated flux from 1-100 nm, converted to F10.7 units
– It more accurately estimates the input to thermospheric and ionospheric processes
– It can be used to improve other space physics models wherever F10.7 is used

24-Mar-04 10
SOLAR2000 Products For Research and Engineering Applications
• A freely-available SOLAR2000 Research-Grade software package is available for studying historical solar-terrestrial variations.
– See http://www.spacewx.com• A SOLAR2000 Professional-Grade
(fee-based) software application is available for high-resolution nowcast and forecast operations
• The SOLAR2000 solar irradiance specification tool (and associated derivative products) have operational applications in satellite drag, radio communications, TEC, post-event analysis, etc.

24-Mar-04 11
SOLAR2000 Forecasts
• SET employs an automated wavelet-based algorithm for predicting E10.7 (on time scales of hours to years)
• In extensive tests of the wavelet-based algorithm for predictions:
– The SET forecasts of F10.7 were at least as good as the NOAA/SEC forecaster predictions on 1-3 day time scales
– The E10.7 forecasts were significantly better on all time scales
• One-day F10.7/E10.7 forecasts are freely available at the http://www.spacewx.comwebsite
– Longer forecasts are one of the components in fee-based SOLAR2000 products
– Upgraded SOLAR2000 versions will improve forecasts

24-Mar-04 12
Summary
• The Oct 2003 events demonstrate unique variations in both solar,thermospheric, and ionospheric measurements and indices
– Permitting the comparison of terrestrial effects due to a solar X-ray flare vs. a geomagnetic storm
• Solar Irradiance from soft X-rays and EUV (1-40 nm) are the principal driving forces to thermospheric and ionospheric variations
– Except during major geomagnetic events, when Joule heating dominates• SOLAR2000, the E10.7 index, and subsequent derived estimates (e.g.,
Qeuv, E1_40, Tinf) are effective proxies for estimating solar irradiance, thermospheric, and ionospheric variations
– SET is currently developing a better index representing coronal X-ray variations (i.e., the background X-ray index Xb and an associated flare index Xf) to improve the SOLAR2000 model and derivative solar-terrestrial proxies