Embed Size (px)
Citation preview

Solar Fuels From Light & Heat Xiaofei Ye, Liming Zhang, Madhur Boloor, Nick Melosh
Will Chueh
Materials Science & Engineering, Precourt Institute for Energy Stanford University
chuehlab.stanford.edu
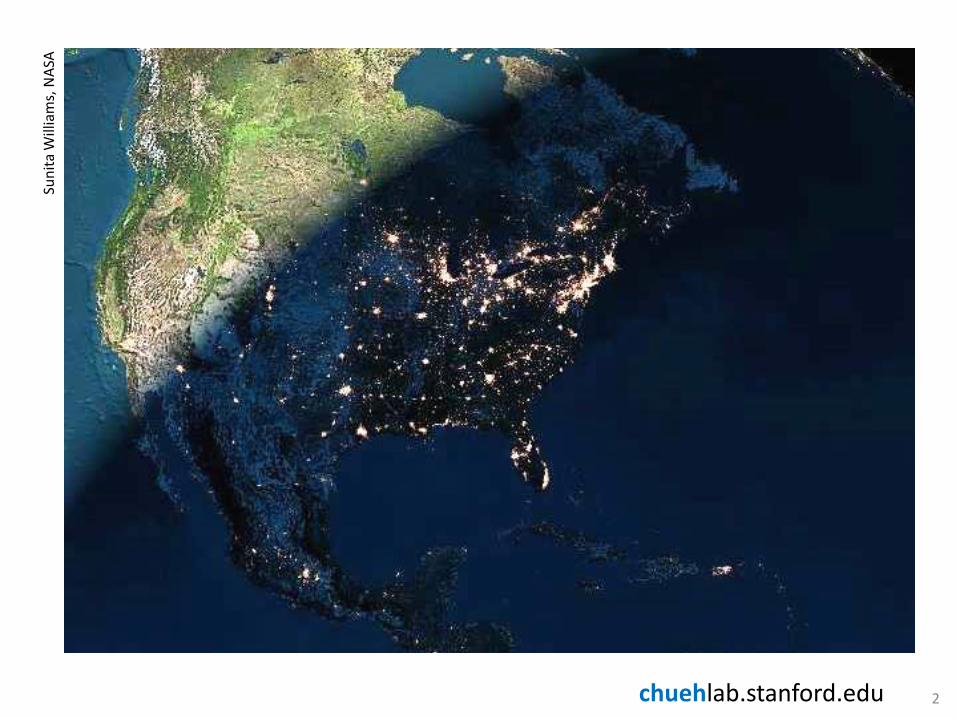
chuehlab.stanford.edu
Suni
ta W
illia
ms,
NAS
A
2

chuehlab.stanford.edu
D. D
iliff
R. L
addi
sh
C.-Y
. Yu
London
Tokyo
Chicago
3
chuehlab.stanford.edu
500 1000 1500 2000 25000.0
0.4
0.8
1.2
1.6
Powe
r (W
m-2 n
m-1)
Wavelength (nm)
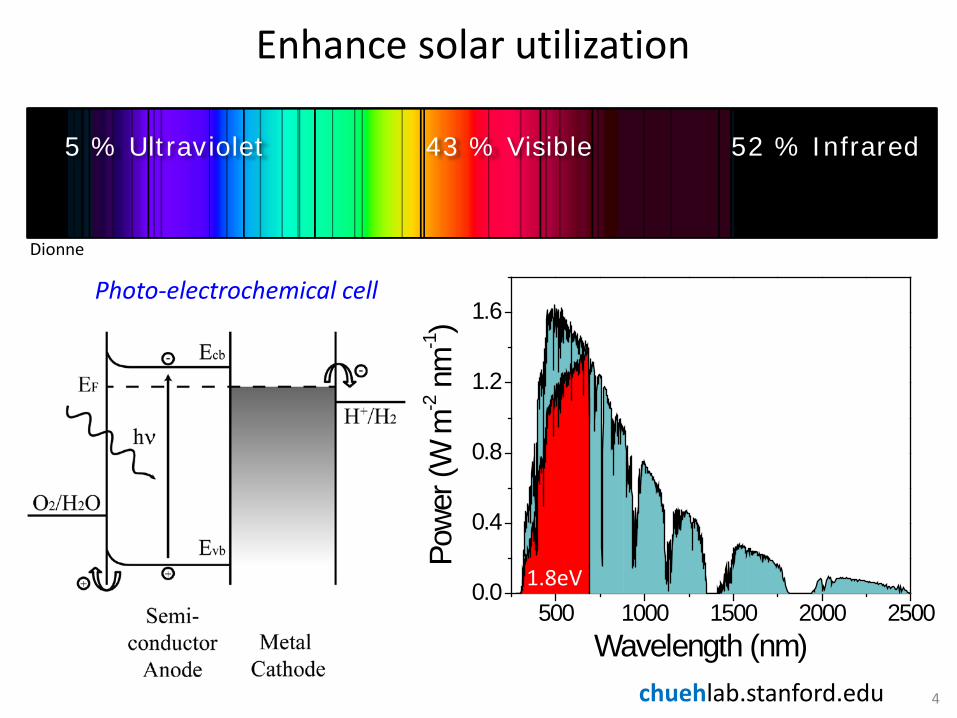
Enhance solar utilization
5 % Ultraviolet 43 % Visible 52 % Infrared
Dionne
1.8eV
4
Photo-electrochemical cell
chuehlab.stanford.edu
Unreachable Temp.
10%
Solar-to-Fuel Efficiency
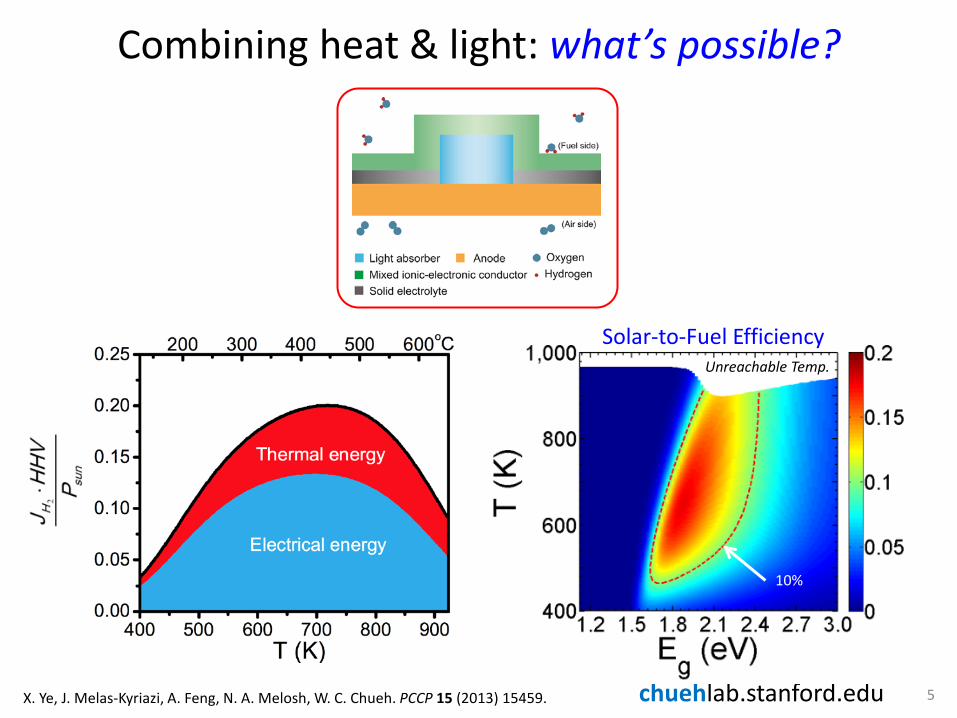
Combining heat & light: what’s possible?
5 X. Ye, J. Melas-Kyriazi, A. Feng, N. A. Melosh, W. C. Chueh. PCCP 15 (2013) 15459.

chuehlab.stanford.edu
Can thermal energy make existing materials
better?
6
Low mobility
Morin, F. J. Phys. Rev. 1954, 93, 1195.
chuehlab.stanford.edu
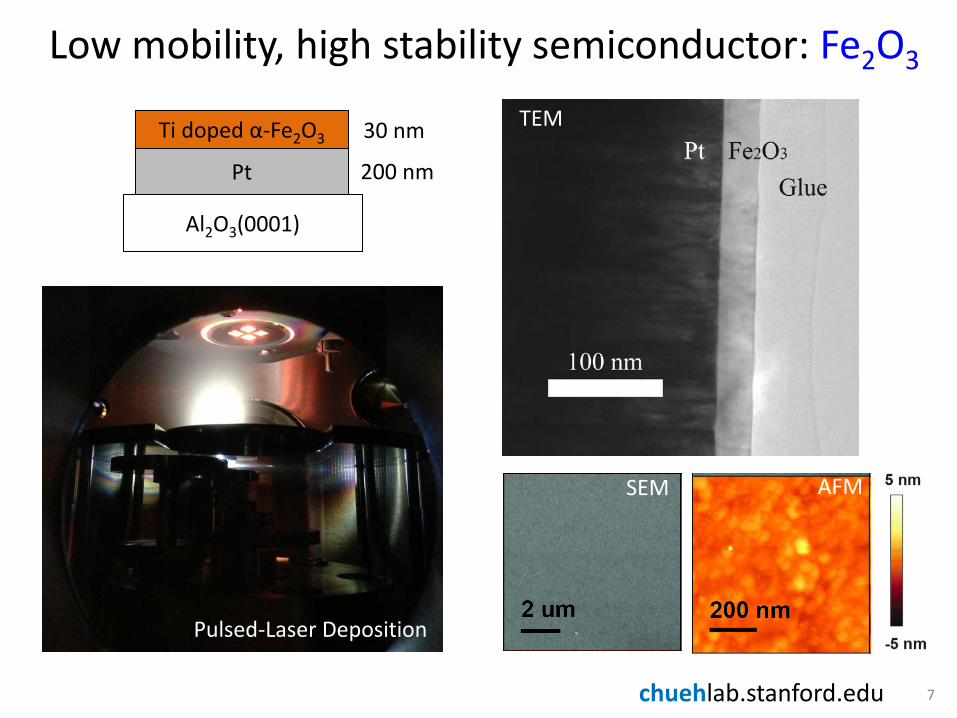
Low mobility, high stability semiconductor: Fe2O3
Al2O3(0001)
Pt
Ti doped α-Fe2O3 30 nm
200 nm
7
Pulsed-Laser Deposition
SEM AFM
TEM
chuehlab.stanford.edu
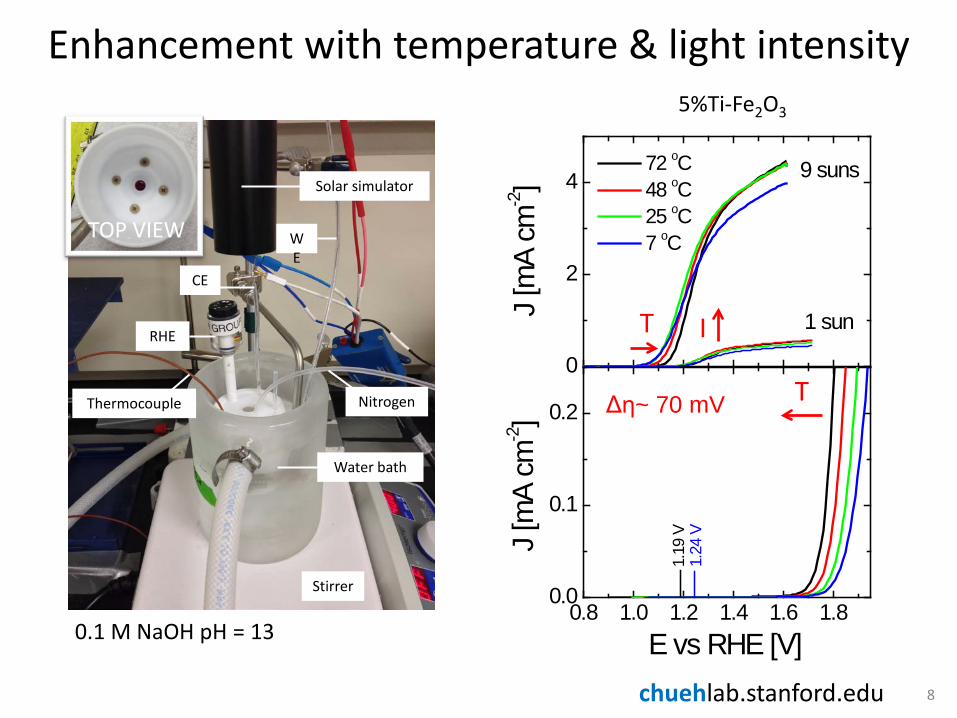
0.1 M NaOH pH = 13
Solar simulator
RHE
Thermocouple
CE
Nitrogen
Water bath
WE
Stirrer
5%Ti-Fe2O3
8
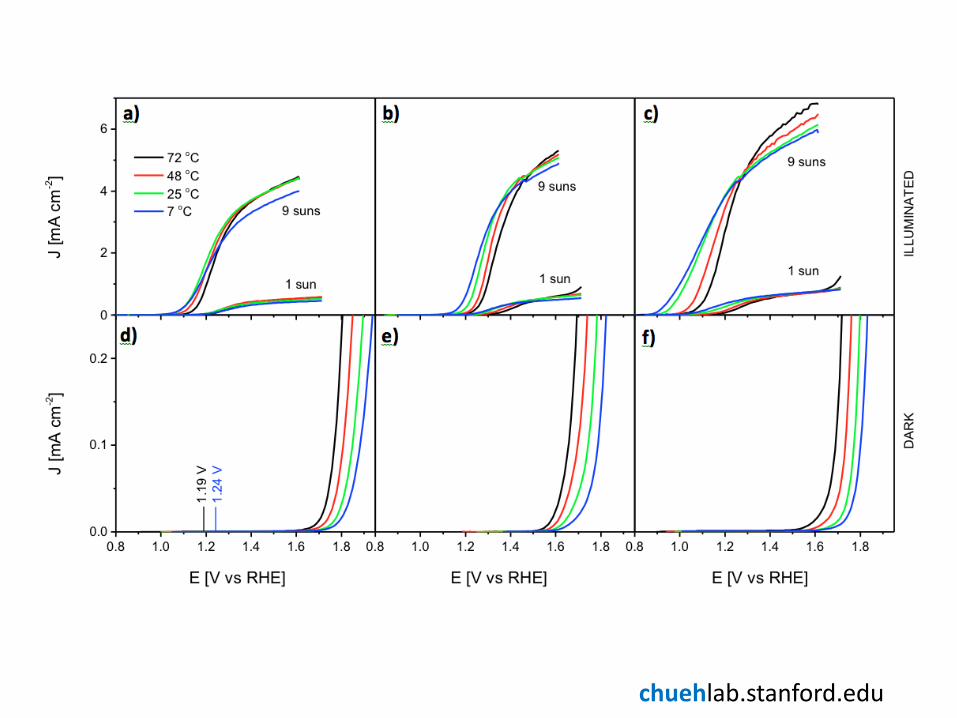
0
2
4
J [m
A cm
-2]
72 oC 48 oC 25 oC 7 oC
9 suns
1 sun
0.8 1.0 1.2 1.4 1.6 1.80.0
0.1
0.2
1.24
VJ [m
A cm
-2]
E vs RHE [V]1.
19 V
TOP VIEW
Enhancement with temperature & light intensity
Δη~ 70 mV
I T
T

chuehlab.stanford.edu
Enhancement with temperature & light intensity
9

chuehlab.stanford.edu
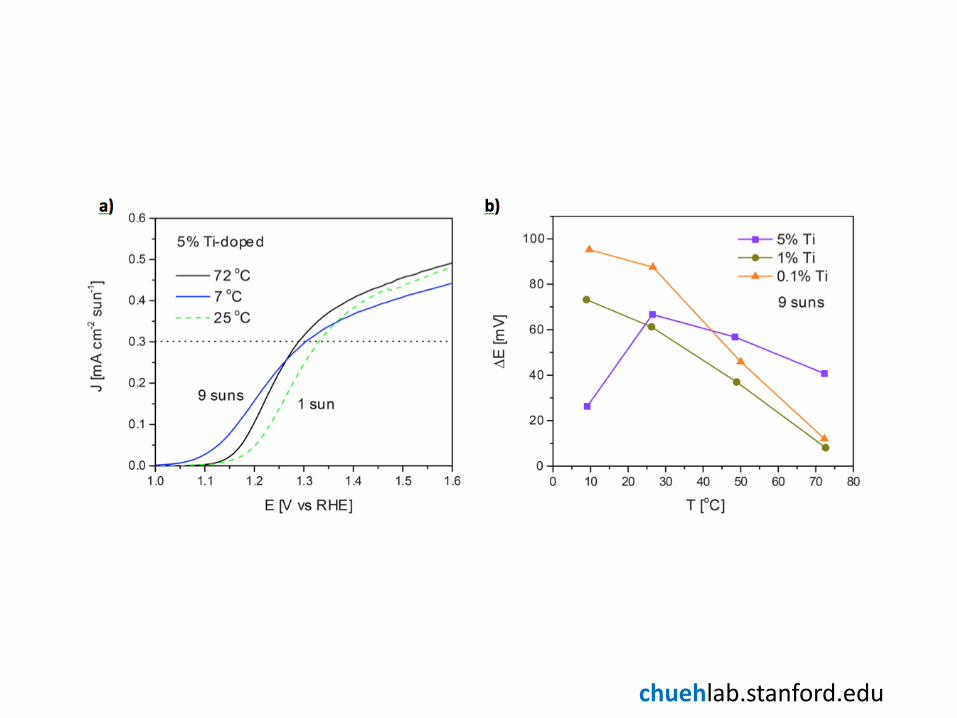
Thermally-enhanced fill factor
0.1% Ti-doped Fe2O3
0.1
0.2
0.3
0.4
∆E
[V]
0.45 --> 4.5 mA cm-2
10
160 mV
chuehlab.stanford.edu
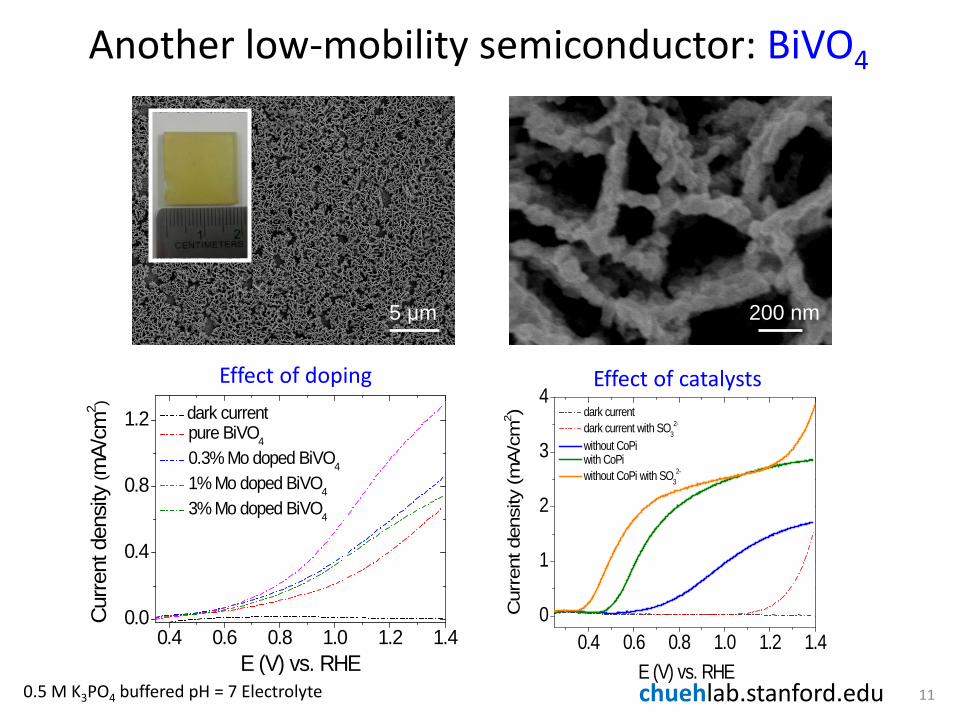
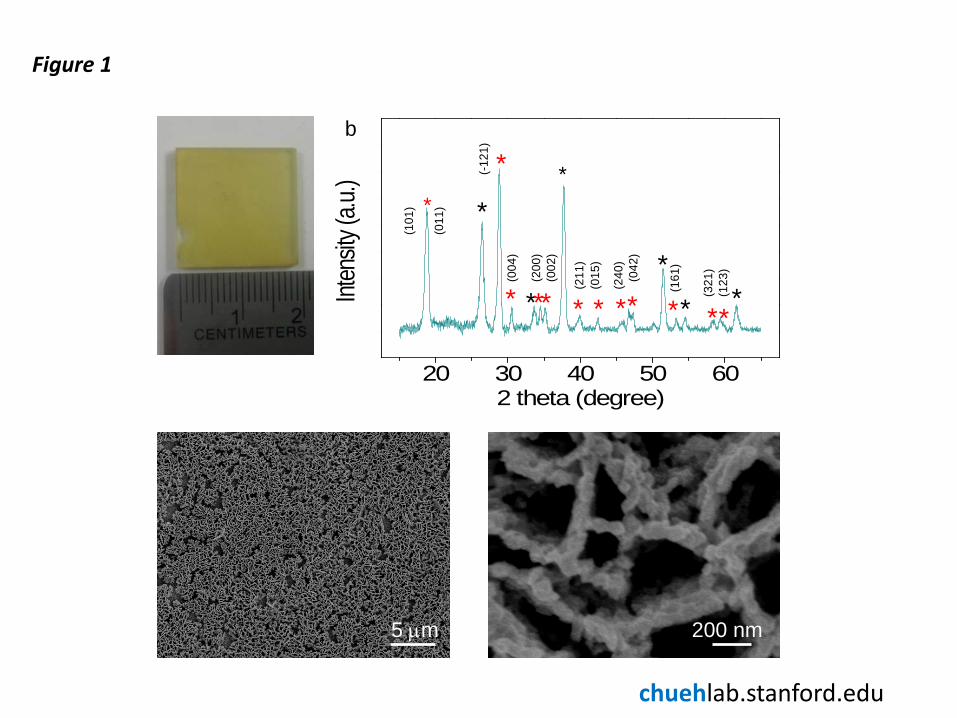
200 nm 5 μm
Another low-mobility semiconductor: BiVO4
0.4 0.6 0.8 1.0 1.2 1.40
1
2
3
4
Cur
rent
den
sity
(mA
/cm
2 )
E (V) vs. RHE
dark current dark current with SO3
2-
without CoPi with CoPi without CoPi with SO3
2-
Effect of catalysts
0.4 0.6 0.8 1.0 1.2 1.40.0
0.4
0.8
1.2
Cur
rent
den
sity
(mA/
cm2 )
E (V) vs. RHE
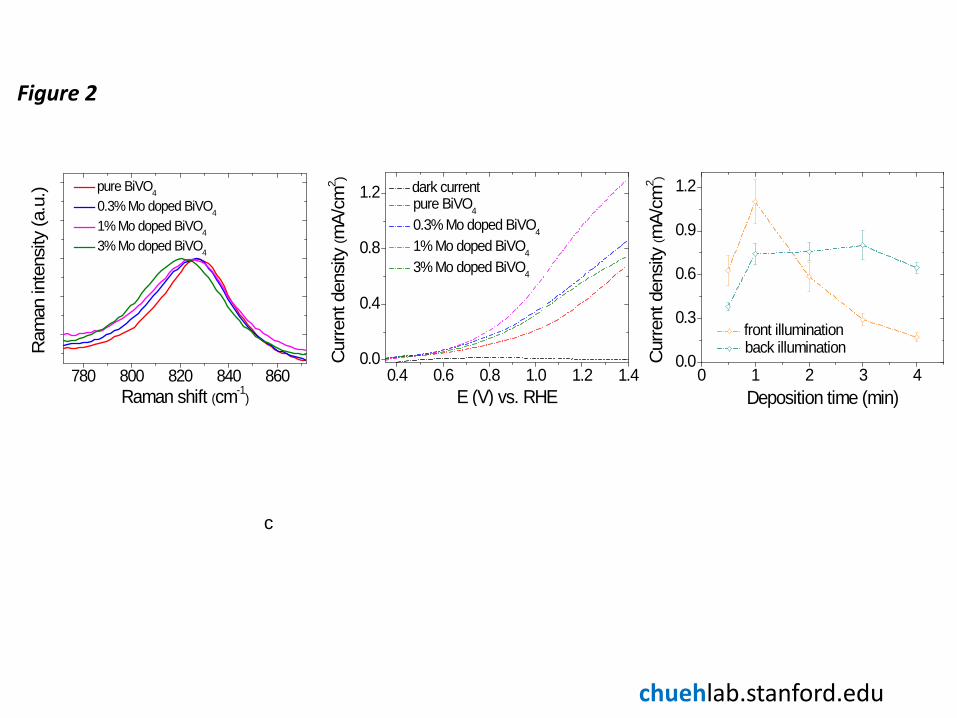
dark current pure BiVO4
0.3% Mo doped BiVO4
1% Mo doped BiVO4
3% Mo doped BiVO4
Effect of doping
0.5 M K3PO4 buffered pH = 7 Electrolyte 11

chuehlab.stanford.edu
0.4 0.6 0.8 1.0 1.2 1.40
1
2
3
Cur
rent
den
sity
(mA/
cm2 )
E (V) vs. RHE
dark 9 ℃ 25 ℃ 42 ℃
°C °C
°C
1 sun
T
T
Thermally-enhanced saturation current
0 500 1000 1500 2000 2500 3000
0.4
0.6
0.8
1.0
1.2
BiVO4
Pt
E (V
) vs.
RH
E
Time (s)
light on 1 sun
light off
light on 3 suns
10 20 30 40 50600
650
700
750
800
Ope
n C
ircui
t Vol
tage
(mV
)
Temperature ( ℃)(°C)
Significant enhancement in photocurrent without significant decrease with photovoltage
1mM [IrCl6]4-/0.1 mM [IrCl6]3-
12
chuehlab.stanford.edu
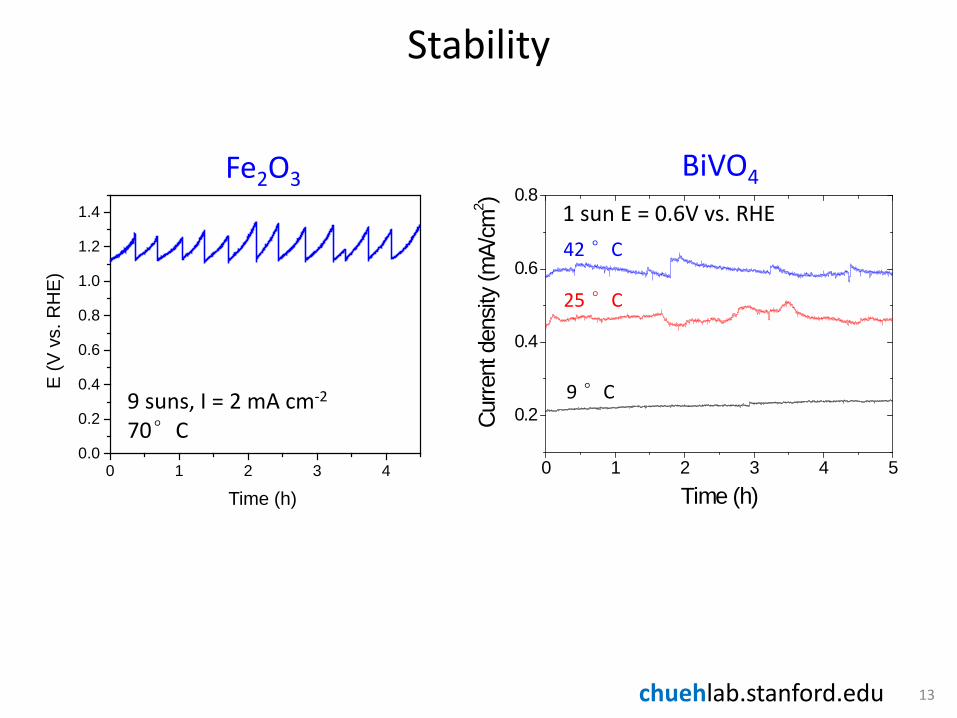
Stability
0 1 2 3 4 5
0.2
0.4
0.6
0.8
Curre
nt d
ensit
y (m
A/cm
2 )Time (h)
42 °C
25 °C
9 °C
BiVO4
0 1 2 3 40.0
0.2
0.4
0.6
0.8
1.0
1.2
1.4
E [V
vs
RH
E]
Time [hour]
0.1% Ti-doped9 suns, 70 oC2 mA cm-2
Fe2O3
1 sun E = 0.6V vs. RHE
9 suns, I = 2 mA cm-2
70°C
E (V
vs.
RH
E)
Time (h)
13

chuehlab.stanford.edu
Thermally-enhanced PEC
14
PEC / Solar cells
cooling
chuehlab.stanford.edu
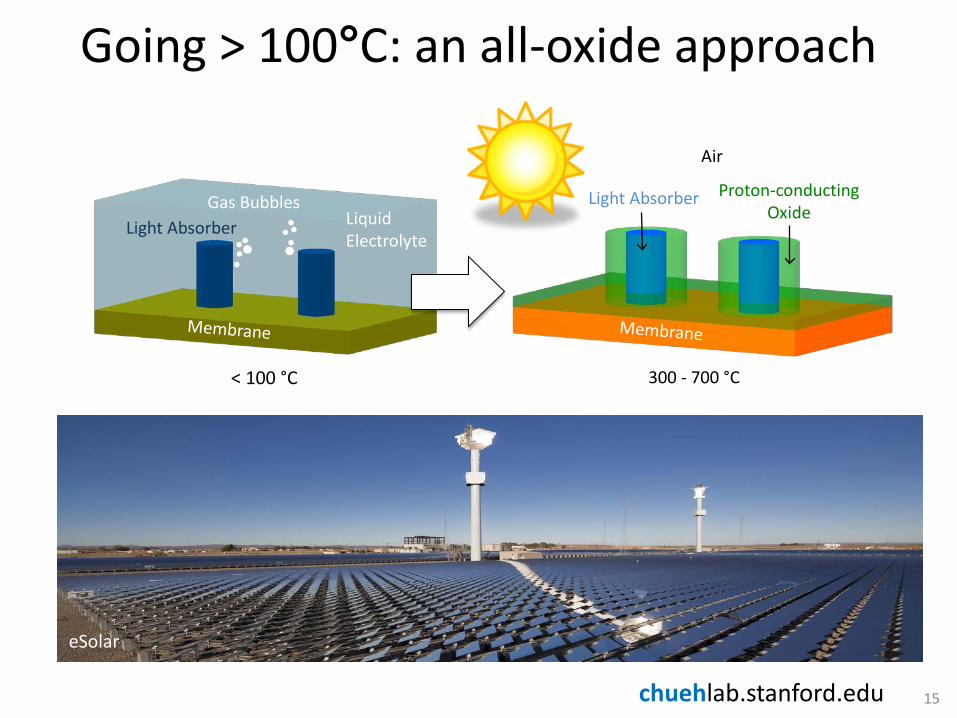
< 100 °C
Light Absorber Proton-conducting Oxide
Air
300 - 700 °C
Light Absorber Liquid Electrolyte
Gas Bubbles
eSolar
15
Going > 100°C: an all-oxide approach
chuehlab.stanford.edu
chuehlab.stanford.edu

chuehlab.stanford.edu
• A new class of solid state PEC for concentrated sunlight • Compatible with elevated temperature • Single device, isothermal
19
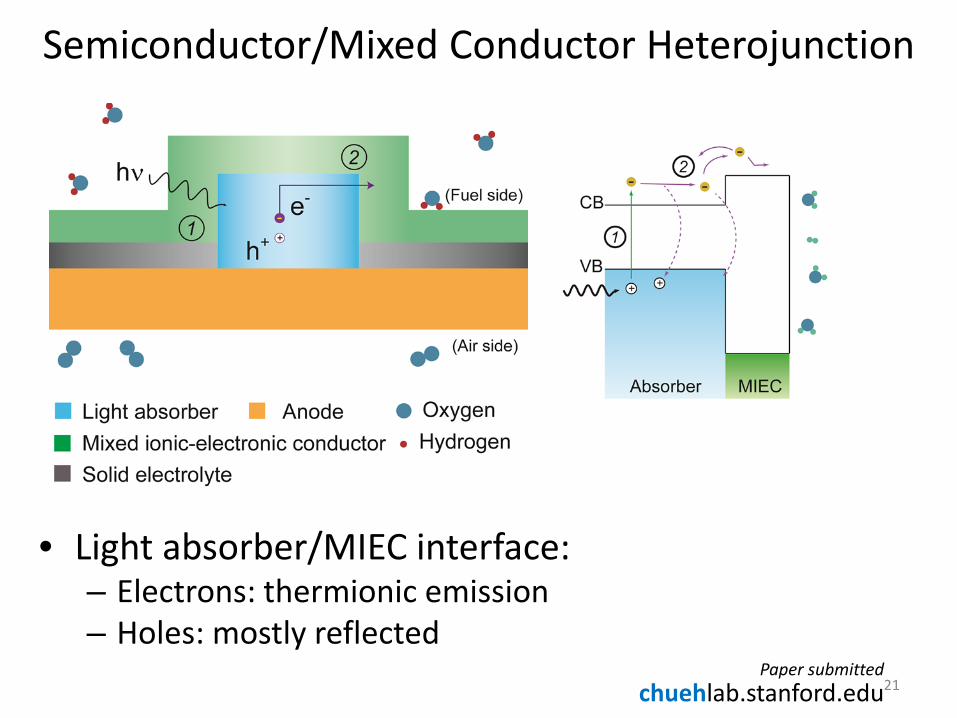
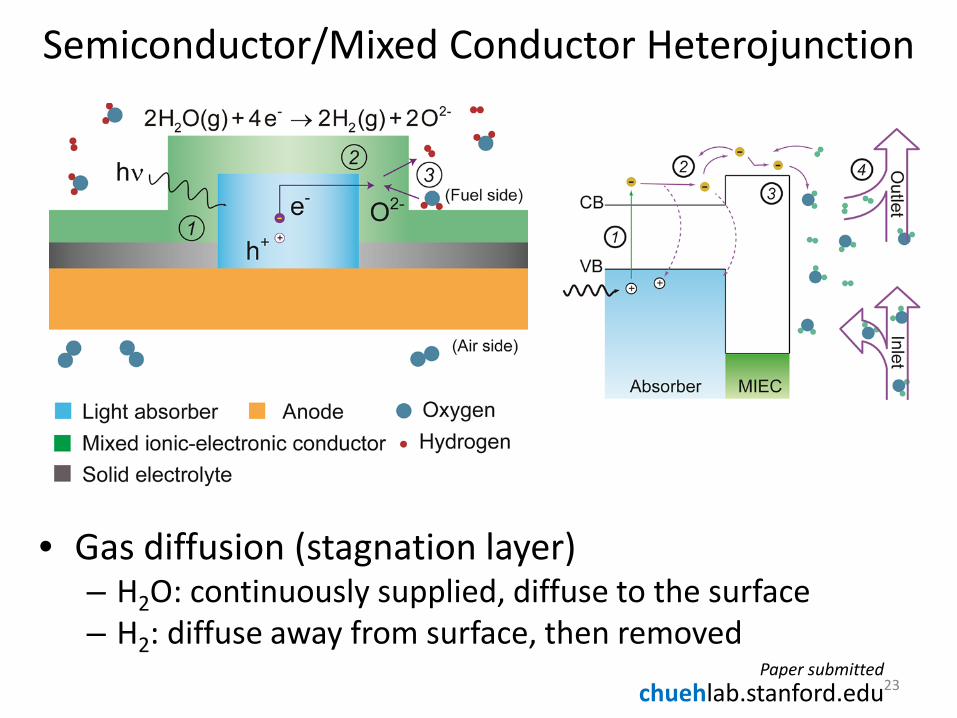
Semiconductor/Mixed Conductor Heterojunction

chuehlab.stanford.edu
• Photon absorption • Electron/hole pairs excitation • Carrier diffusion
20 Paper submitted
Semiconductor/Mixed Conductor Heterojunction
chuehlab.stanford.edu
• Light absorber/MIEC interface: – Electrons: thermionic emission – Holes: mostly reflected
21 Paper submitted
Semiconductor/Mixed Conductor Heterojunction

chuehlab.stanford.edu
• MIEC/gas interface – Electron transfer, HER
22 Paper submitted
Semiconductor/Mixed Conductor Heterojunction
chuehlab.stanford.edu
• Gas diffusion (stagnation layer) – H2O: continuously supplied, diffuse to the surface – H2: diffuse away from surface, then removed
23 Paper submitted
Semiconductor/Mixed Conductor Heterojunction
chuehlab.stanford.edu
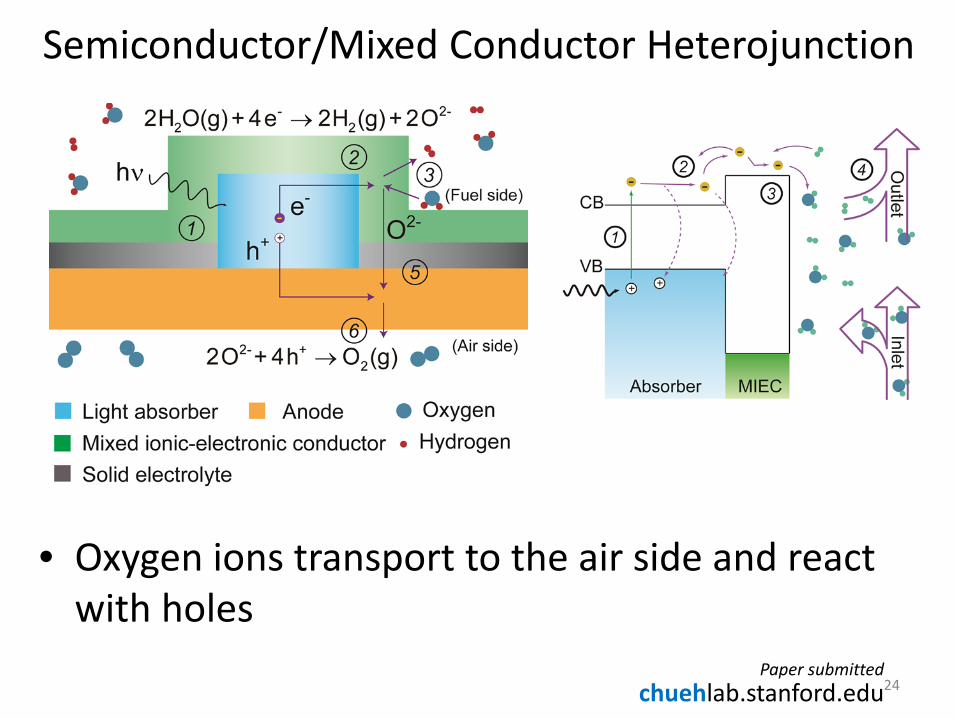
• Oxygen ions transport to the air side and react with holes
24 Paper submitted
Semiconductor/Mixed Conductor Heterojunction

chuehlab.stanford.edu
• Broad maximum at ~750 K, 17 % • Below 700 K: slow thermionic emission • Above 700 K: insufficient photovoltage
25
400 500 600 700 800 9000.8
1.0
1.2
1.4
1.6
Pote
ntia
l (V)
T (K)
∆µabs/q ∆µMIEC/q Erxn E0
rxn
200 300 400 500 600oC
400 500 600 700 800 9000.00
0.05
0.10
0.15
0.20oC
Effic
ienc
y
T (K)
200 300 400 500 600
400 500 600 700 800 9000.8
1.0
1.2
1.4
1.6
Pote
ntia
l (V)
T (K)
∆µabs/q ∆µMIEC/q Erxn
200 300 400 500 600oC
400 500 600 700 800 9000.8
1.0
1.2
1.4
1.6
Pote
ntia
l (V)
T (K)
∆µabs/q
200 300 400 500 600oC
400 500 600 700 800 9000.8
1.0
1.2
1.4
1.6
Pote
ntia
l (V)
T (K)
∆µabs/q ∆µMIEC/q
200 300 400 500 600oC
Paper submitted
Efficiency Simulation

chuehlab.stanford.edu
chuehlab.stanford.edu
c
Figure 1
200 nm
20 30 40 50 60
Inten
sity (
a.u.)
2 theta (degree)
* *
* *
*
*
* * * * * * * * * * * *
(-12
1)
(004
)
(101
)
(011
)
(002
)
(211
) (0
15)
(240
) (0
42)
(161
)
(321
) (1
23)
(200
)
5 µm
b
chuehlab.stanford.edu
Figure 2
0 1 2 3 40.0
0.3
0.6
0.9
1.2
front illumination back illuminationC
urre
nt d
ensi
ty (m
A/cm
2 )
Deposition time (min)780 800 820 840 860
pure BiVO4
0.3% Mo doped BiVO4
1% Mo doped BiVO4
3% Mo doped BiVO4
Ram
an in
tens
ity (a
.u.)
Raman shift (cm-1)
0.4 0.6 0.8 1.0 1.2 1.40.0
0.4
0.8
1.2
Cur
rent
den
sity
(mA/
cm2 )
E (V) vs. RHE
dark current pure BiVO4
0.3% Mo doped BiVO4
1% Mo doped BiVO4
3% Mo doped BiVO4
c

chuehlab.stanford.edu
2 µm 200 nm
a b
0.2 0.4 0.6 0.8 1.00
1
2
3
Curre
nt d
ensit
y (m
A/cm
2 )
E (V) vs. RHE
dark current macroporous BiVO4
nanoporous BiVO4
c
Figure 5

chuehlab.stanford.edu
0.2 0.4 0.6 0.8 1.00
1
2
3
4
Cur
rent
den
sity
(mA/
cm2 )
E (V) vs. RHE
10 ℃ 25 ℃ 35 ℃ 45 ℃ 55 ℃
0.2 0.4 0.6 0.8 1.00
1
2
Cur
rent
den
sity
(mA/
cm2 )
E (V) vs. RHE
10 ℃ 25 ℃ 35 ℃ 45 ℃ 55 ℃
10 20 30 40 50 601
2
3
4
Cur
rent
den
sity
(mA/
cm2 )
at 0
.80
V vs
. RH
E
Temperature(℃)
a
b
c
Small BiVO4 NPs
Large BiVO4 NPs
Figure 6
chuehlab.stanford.edu
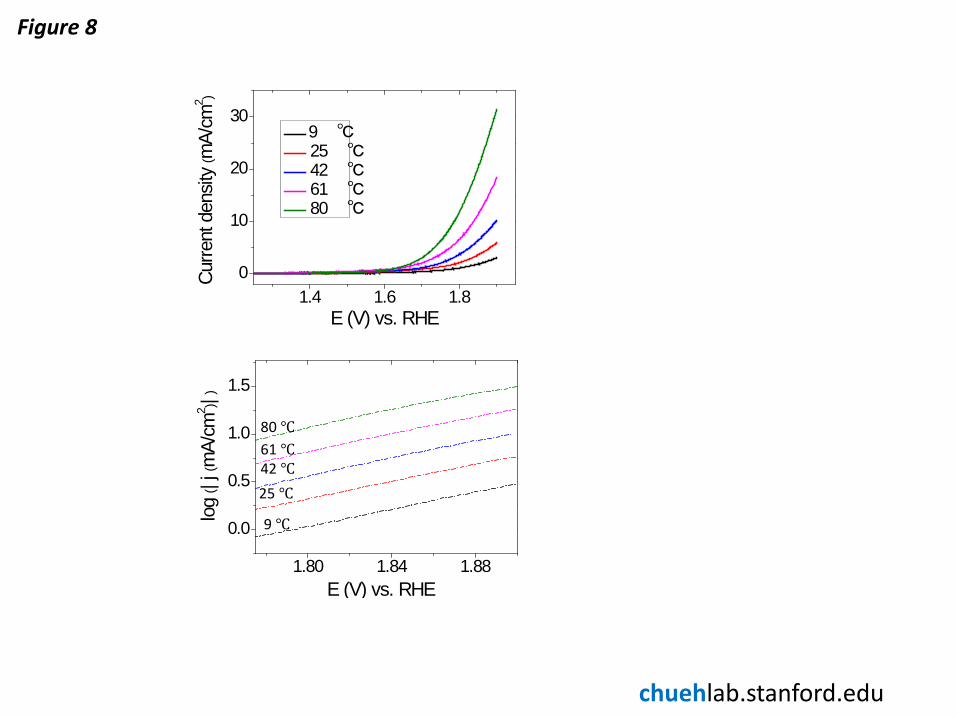
1.4 1.6 1.80
10
20
30
Curre
nt d
ensit
y (m
A/cm
2 )
E (V) vs. RHE
9 ℃ 25 ℃ 42 ℃ 61 ℃ 80 ℃
1.80 1.84 1.88
0.0
0.5
1.0
1.5
log
(| j (m
A/cm
2 ) | )
E (V) vs. RHE
9 ℃
25 ℃ 42 ℃ 61 ℃ 80 ℃
Figure 8