Embed Size (px)
Citation preview

Solar Forecast ArbiterAn open source evaluation framework
for solar forecasting
Department of Hydrology and Atmospheric Sciences
Will Holmgren
Cliff Hansen Justin Sharp
Grid Operations and Planning
Aidan Tuohy
Principal and OwnerRenewable and Distributed System Integration Department
.org

2
Open-source framework for solar forecast evaluations that are impartial, repeatable, and auditable.
Project goal
• Implement objective, consistent evaluation scenarios and metrics better solar forecasts
• Develop user confidence in solar forecasts system integration
• Standardize evaluations reduce provider and user costs
• Easily extend to wind power and load forecasting

3
• Web-based user interface
• Web-based API for scripting
• Python software package that formalizes and implements analysis
• Scripts to redeploy entire software stack (OS, database, web application)
• Detailed documents that explain the approach
Open source. Transparently developed on
GitHub
What is the Solar Forecast Arbiter?

4
EXAMPLE REPORT
Project Timeline/Milestones
5
Year 1Design, build, test and demonstrate the framework.
Year 2Refine the framework and host two operational forecast competitions
Year 3Support evaluations for Solar Forecasting II Topic 2 and Topic 3 awardees.
Transition framework to new operator.
July2018
July2021
2019-10-07

Stakeholder Engagement
6
• Use cases
• Data format/API
• Data policies
• Benchmark forecasts
• Evaluation metrics
5 primary topics
Stakeholder Workshop
St. Paul, June 2018
Proposal documents
Revised documents
Final documents
ImplementStakeholder
feedbackStakeholder consensus
Team discussions
Please join the Stakeholder Committee! (open to all)
solarforecastarbiter.org/stakeholdercommittee
Typical engagement process

7
Application: short term marketRequirement: hour ahead forecast

8
Application: short term marketRequirement: hour ahead forecast

9
Forecast taxonomyApplication: short term marketRequirement: hour ahead forecast

Use Cases
10
A. Compare a forecast to measurements
B. Compare a probabilistic forecast to measurements (Nov.)
C. Compare multiple forecasts to measurements
D. Compare forecasts to measurements for sites and aggregates (Oct.)
E. Evaluate an event forecast (~Mar.)
F. Conduct a forecast trial (~Jan.)
G. (stretch) Compare multiple overlapping forecast runs to measurements
H. (stretch) Establish long-term performance baseline of state-of-the-art
operational forecasts
solarforecastarbiter.org/usecases
1D time series – no gridded data

• Website & API
• Reference databases
• Secure databases
• Data QA/QC• Benchmark
power fx• Analysis
engine
Metadata, data
Candidate forecasts
Metadata
Training data
Reports following exp. design
Sketch of Forecast Trial Use Case
11
Forecast User
Forecast Provider A
Forecast Provider C
Forecast Provider B
Reference data
Benchmark weather forecasts
Solar Forecast Arbiter

12
Data policies in layman’s terms1. Organization must sign non-negotiable Data Use Agreement before
given access to do anything but view reference data.2. Signing agreement does not obligate organizations to upload data or
share data.3. Organizations retain ownership of the data they upload to the
framework.4. Organization admins have complete control over how their data may be
accessed by other users. Default: no sharing, private analysis only.5. Organization admins may delete data from the framework.6. Uploading data does not give SFA team ability to study data. 7. All non-public data will be securely deleted at the termination of the
project (2021).

Data Sharing and Privacy
13
https://solarforecastarbiter.org/datapolicies/

Data Sharing Implementation: Role Based Access Control
14
Read Sites (all)
Read Observations
(all)
Read Observation Values (all)
Share with forecasters

Data Sharing Implementation: Role Based Access Control
15
Read Sites (all)
Read Observations
(all)
Read Observation Values (all)
Share with forecasters
Read Forecast(utility-1 only)
Read Forecast Values (utility-1 only)
Share with utility-1

Data Upload/Download
16
solarforecastarbiter.org/datamodel
Dashboard API Data Model
api.solarforecastarbiter.org
solarforecastarbiter.org/dashboarddoc

• Available throughout the US
• Freely accessible or easily implemented
• Provide quantities of interest to both forecast users and providers
• Stakeholder buy-in
Benchmark Forecasts
17
Required Attributes

Benchmark Forecasts
18
• For 1 hour – 7 day ahead and longer horizons:• Downloaded all GFS, GEFS, NAM, RAP, HRRR runs since April 2019. ~CONUS domain using g2sub
• GFS, NAM, RAP irradiance forecasts have serious limitations, so derive irradiance or PV power from cloud cover.
• Directly use HRRR subhourly irradiance
Supported Options:
• HRRR subhourly irradiance (15 min instant or hourly avg)
• RAP cloud cover to irradiance (hourly avg)
• NAM cloud cover to irradiance (hourly avg)
• GFS cloud cover to irradiance (hourly avg)GFS
solarforecastarbiter.org/benchmarks

19
NWP Benchmark Forecasts Processing
• Our PV power model requires instantaneous input• Accurate hourly averages require many subhourly instantaneous points
1. Load hourly (or longer) interval data from the NWP grib files. • For GFS cloud cover, unmix the mixed-intervals average data.
2. Resample data to 5 minute intervals. • For GFS cloud cover, backfill the data.• For all other NWP data, interpolate the data.
3. Convert cloud cover to irradiance. Linear clear sky scaling Larson et. al.: • GHI = (35% + (100% - cloud cover)) * GHI_clear
4. If PV, use site metadata to compute AC power using pvlib-python functions.5. Compute hourly averages with desired interval labels.
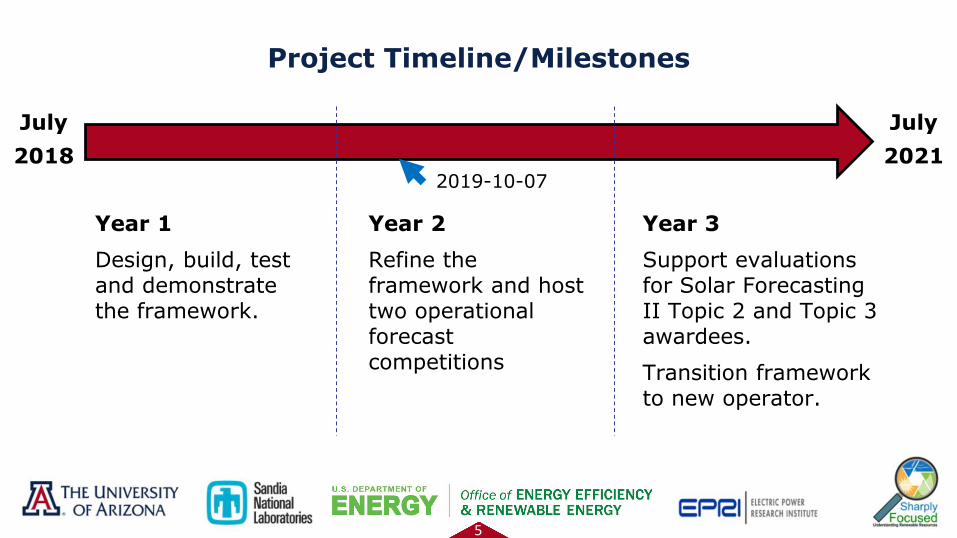
Persistence Benchmark Forecasts
20
“Vanilla” Persistence • Low level reference functions with lots of flexibility.
• High level functions enforce averaging period = forecast interval length

Persistence Benchmark Forecasts
21
Persistence of clear sky indexCSI calculated at 5 minute resolution, then averaged to desired interval.

Persistence Benchmark Forecasts
22
Day Ahead PersistenceOnly hourly intervals allowed.

Probabilistic Benchmark Forecasts
23
• GEFS cloud cover processed into irradiance or power percentiles (0, 5, …95, 100)
• Climatology (not yet implemented)• Persistence ensemble (not yet implemented)

Benchmark Forecast Configuration
24
• Current operational NWP processing configuration
• Based on time zone. Example for site in MST (UTC-0700):
• Persistence not yet configured. One idea: follow CAISO requirements
• Trials allow custom configuration

Net Load Benchmark Forecasts
25
• Net load definitions• Net load = True load – BTM PV
• Net load = True load – Known Utility Scale Solar – BTM PV
Use regression w/weather obs for true load? Persistence?
Stay tuned.

26
Validation and Reference Data Sources
Public Reference Data• NOAA
SURFRAD• NOAA
SOLRAD• NOAA CRN• NREL MIDC• DOE RTC• U. Oregon
network
User Data• Stakeholder supplied• Owner controls access• Contribute public reference data, get
reference forecastsolarforecastarbiter.org/
referencedata

Climate Regions
27
• Regions support broader analyses of forecast performance
• ”This forecast performs well/poorly on the West Coast”
• Interactive map, shapefiles, kmz

Metrics
Stakeholder selections of:
• Deterministic Forecasts
• Event Forecasts
• Probabilistic Forecasts
https://solarforecastarbiter.org/metrics/

• Users specify start and end time for analysis report• Rule: don’t modify user-submitted forecasts• Interval length consistency:
• If measurements are higher resolution, Average the measurement data so that it has the same resolution as the forecast data (default)
• If the forecast is higher resolution – comparison not allowed
• Interval label consistency:• Observations and forecasts have defined labels (beginning, ending,
instant)• Arbiter accounts for observation intervals when resamples
• Nighttime data: Day/night filter based on solar zenith angle• Ability to select certain periods: time of day, months of year,
clear/cloudy, other weather variables, ramping periods
29
Selecting Periods and Time Series Issues

30
Evaluation with messy data
• Priority: clearly document the process and any user-configured options in each report
• Missing or bad forecast data• Missing or bad observation data
• Data validation toolkit flags most problems
• Research study• Options selected when report is created
• Operational forecast trial• Options selected when trial is created

• Solar power forecast and actual visualization• Time series• Scatter plots of forecast vs actual • Density plots of joint distributions• Conditional and marginal distributions
• Metric visualization• Bar charts for different metrics• Ability to plot by time of day, day by day and monthly• Box and whiskers – median, upper and lower quantiles and min,
max for MAE and RMSE
31
Visualization

Built-in support for:• Fixed $/MW • Fixed $/MW for handful of error bins• Time series of $/MW
Also provide brief recommendations and references for how to conduct more detailed cost evaluations
32
Cost metrics

33
Summary
• Open source, reproducible, transparent framework• Stakeholder feedback guides project – speak up!• Use cases tailored to needs of solar forecast stakeholders• Reference datasets• Secure, private data upload. Sharing optional• Benchmark forecast capability• Automated reports including bulk metrics, analysis filters• Sign up for project updates, stakeholder committee at:
solar forecast arbiter . org