Embed Size (px)
Citation preview

SOLAR FARM FEASIBILITY STUDY
District Council of Mount Remarkable
November 2013

2 ITP/A0121 – November 2013
Solar Farm Feasibility Study
DISTRICT COUNCIL OF MOUNT REMARKABLE Client contract No.: 2013 – 062 MS (L)
IT Power reference: A0121
Solar Farm Feasibility Study
November 2013
Prepared by:
IT Power (Australia) Pty Limited
Southern Cross House,
6/9 McKay St, Turner, ACT, 2612,
PO Box 6127, O’Connor, ACT, 2602, Australia.
Tel. +61 2 6257 3511
Fax. +61 2 6257 3611
E-mail: [email protected]
http://www.itpau.com.au
Document control
File path & name C:\Users\Nic\Dropbox\A0121 MTR Solar Farm Feasibility\Final\131120 Final deliverables\A0121 131119 Solar Farm Feasibility Report.docx
Author Nic Jacobson, Joe Wyder, Simon Franklin
Project Manager Nic Jacobson
Approved Joe Wyder
Date 19 November 2013
Distribution level Final
Template: ITP REPORT Form 001
Issue: 01; Date: 20/04/12

ITP/A0121 – November 2013 3
Solar Farm Feasibility Study
About IT Power
The IT Power Group, formed in 1981, is a specialist renewable energy, energy efficiency and
carbon markets consulting company. The group has offices and projects throughout the world.
IT Power (Australia) was established in 2003 and has undertaken a wide range of projects,
including designing grid-connected renewable power systems, providing advice for government
policy, feasibility studies for large, off-grid power systems, developing micro-finance models for
community-owned power systems in developing countries and modelling large-scale power
systems for industrial use.
The staff at IT Power (Australia) have backgrounds in renewable energy and energy efficiency,
research, development and implementation, managing and reviewing government incentive
programs, high level policy analysis and research, including carbon markets, engineering design
and project management.
About this report
This report was commissioned by the District Council of Mount Remarkable with the assistance of
the Local Government Association of South Australia.

4 ITP/A0121 – November 2013
Solar Farm Feasibility Study
CONTENTS
EXECUTIVE SUMMARY ................................................................................................... 6
1. LARGE-SCALE SOLAR FARMS ............................................................................... 8
Economic benefits ....................................................................................................... 8
2. ESTABLISH THE VIABILITY OF LARGE-SCALE SOLAR FARMS IN THE SOUTHERN FLINDERS ............................................................................................. 9
Results ...................................................................................................................... 11
100 kW roof mounted system ................................................................................ 11
1 MW ground mounted system .............................................................................. 11
10 MW ground mounted system ............................................................................ 12
Analysis of the Cost-Value Gap ............................................................................. 12
3. REVIEW OF FUNDING OPPORTUNITIES ............................................................... 14
Renewable Energy Target ......................................................................................... 14
Carbon Price ............................................................................................................. 15
Clean Energy Finance Corporation (CEFC) .............................................................. 15
Australian Renewable Energy Agency ...................................................................... 16
Emerging Renewables Program ............................................................................ 16
Regional Australia’s Renewables Initiative ............................................................ 17
Accelerated Step Change Initiative (ASCI) ............................................................ 18
Renewable Energy Venture Capital Fund .............................................................. 18
Regional Development Australia Fund ...................................................................... 18
South Australian Government Support ...................................................................... 19
Summary of funding opportunities ............................................................................. 20
4. IDENTIFY PREFERRED AREAS FOR LARGE-SCALE SOLAR FARMS ............... 21
Multi-criteria analysis ................................................................................................. 21
Data sources .......................................................................................................... 21
Processing ............................................................................................................. 24
Combining the criteria ............................................................................................ 25
Results ................................................................................................................... 26
Investigation – improving the grid .............................................................................. 26

ITP/A0121 – November 2013 5
Solar Farm Feasibility Study
5. OPTIONS PAPER FOR COUNCIL ACTIONS .......................................................... 28
6. DISCUSSION ........................................................................................................ 30
Recommendations for further investigations ............................................................. 30
7. REFERENCES ........................................................................................................ 32
APPENDIX A.PREFERRED AREAS FOR A 1 MW SOLAR FARM ............................... 33
APPENDIX B.PREFERRED AREAS FOR A 10 MW SOLAR FARM ............................. 34
APPENDIX C.10 MW PREFERRED AREA FOR AN IMPROVED GRID ........................ 35

ITP/A0121 – November 2013 6
Solar Farm Feasibility Study
EXECUTIVE SUMMARY
The District Council of Mount Remarkable is investigating the potential of renewable energy, in
the form of large-scale solar farms to add to the economic development of the district. The key to
understanding this potential is to understand the current financial viability of these projects at a
suitable scale. Following from the viability, to make an informed decision on the next actions
requires understanding the financial support and incentives available to support the development,
the areas likely to be targeted by developers and what actions the Council can take to improve
the project economics and draw investment to the District.
The viability of large-scale photovoltaic solar farms in the District Council of Mount Remarkable
was investigated by estimating the levelised cost of energy produced and comparing the cost to
the current price of energy from projects of similar scale. The difference between the two prices
indicates the price barrier to the development of solar farms. To attract investment in solar farms
in the DCMR, the price barrier needs to be reduced, if not overcome. The LCOEs from the three
representative solar farms and the price barriers for each is given in the table below.
Representative solar farm 100 kW roof
mounted
1 MW ground
mounted
10 MW ground
mounted
LCOE1 ($/MWh) $175 $247 $187
Retail price ($/MWh) $120 to $140
Retail price barrier ($/MWh) $35 to $55
Wholesale price2 ($/MWh) $90 to $110 $90 to $110
Wholesale price barrier3 ($/MWh) $137 to $147 $77 to $97
Table 1 Price barriers for solar farms in the District Council of Mount Remarkable
To assist the understanding of the Council, a multi-criteria analysis was completed to identify the
areas of the Council most suited and favourable to the development of solar farms. The analysis
used scale factors to give weight to different constraints to development. The analysis was
conducted for the 1 MW and 10 MW ground mounted solar farms. The resulting maps are shown
in Appendix A and Appendix B.
1 Based on 25 years for 1 and 10 MW and 10 years for 100 kW
2 Wholesale price is based on average NEM Pool Price and REC value
3 Wholesale price is based on average NEM Pool Price and REC value

ITP/A0121 – November 2013 7
Solar Farm Feasibility Study
The actions that can be taken by the Council are discussed in a separate Council Action Options
paper. The recommended actions for the District Council of Mount Remarkable selected from a
range of financial and facilitation based actions are:
Action Evaluation of impact Suitability for the District
A2 Soft loans Medium to High Suitable
B1 Fast track planning and
environmental approvals
Medium Suitable
B2 Re-zoning rural to renewable energy –
solar farm
Medium Suitable
Table 2 Recommend actions for DCMR

ITP/A0121 – November 2013 8
Solar Farm Feasibility Study
1. LARGE-SCALE SOLAR FARMS
There are two groups of solar technologies used for the conversion of solar energy to grid quality
electricity in large-scale solar farms. These are: photovoltaic systems and solar thermal systems.
A description of these two different technologies is available in Box 10.1 in Chapter 10 of the
Australian Energy Resource Assessment [1].
Solar thermal and concentrating photovoltaic systems will not be considered in this assessment.
They are currently less cost effective than flat photovoltaic module systems [2]. Solar thermal
systems for electricity generation are typically in the tens of megawatts scale and unsuitable for
connection to the existing distribution network in the Southern Flinders region. Concentrating
photovoltaic systems (CPV), as in use at the Alice Springs airport (Fresnel lenses) and near
Mildura (mirror parabolic dish), are not deployed widely as the capital cost of fixed PV has
decreased significantly relative to the cost of tracking CPV systems.
Figure 1 Concentrating solar PV at Alice Springs Airport4
This report will investigate the viability of solar farms using fixed array, flat photovoltaic module
systems. While tracking increases output, the additional capital and maintenance costs lead to
most large PV farms being fixed tilt.
Economic benefits
The economic benefits of developing large-scale solar farms extend beyond the boundary of the
project into the wider community. While estimates of these impacts are beyond the scope of this
document, the direct on going employment created by large-scale solar farms has been estimated
at 11 job years per MW during construction and 0.3 full-time equivalents per MW during operation
[3]. The development of a 10 MW system in the District would be expected to provide 110 job
years of employment over the construction period and a further 3 full time positions during the
operation of the plant.
4 http://www.alicesolarcity.com.au/solfocus-flat-plate-concentrator-systems

ITP/A0121 – November 2013 9
Solar Farm Feasibility Study
2. ESTABLISH THE VIABILITY OF LARGE-SCALE SOLAR FARMS IN THE SOUTHERN FLINDERS
In order to examine the financial viability of large-scale solar farms in the Southern Flinders a
number of different sized systems were considered. This is due to significant variation in the
financial characteristics of the difference sized solar farms. ITP conducted in-depth performance
and financial modelling for the following systems:
100 kW roof mounted system,
1 MW ground-mounted system, and
10 MW ground-mounted system.
Each of the different systems has its own unique characteristics that affect its overall financial
viability. Key items of note for the systems included:
The 100 kW system is eligible for Small Technology Certificates (STC) which significantly
reduce the upfront capital costs of the system
The 100 kW system (because it is (roof-mounted) requires a much simpler mounting
structure which reduces construction costs
The 100 kW system is able to be directly connected to the LV grid of the building on which
it is installed. This both reduces the grid connection costs for the project and increases the
potential revenue of the system through the off-setting of onsite electricity use.
The 1 MW system benefits from some economies of scale over the 100 kW system,
however, has increased grid-connection and civil costs.
The 10 MW system further benefits from economies of scale, however, requires a higher
grid voltage for network connection.
It is likely that only the larger plants would be able to attract commercial project finance
and therefore benefit from a reduced cost of capital.
The expected outputs for each of the systems considered were modelled using the industry
standard software package PVSyst. The modelled generation for each of the systems was
between 1,600 and 1,700 kWh/kWp/year. The smaller roof mounted system was at the lower end
of the production range, having lower output than the larger ground mounted systems. The
reduced output from the roof mounted system is primarily due to reduced airflow behind the
panels compared to the ground mount system leading to increased operating temperature of the
modules.

ITP/A0121 – November 2013 10
Solar Farm Feasibility Study
The key assumptions used in the financial models are shown in Table 3 below.
Capital costs
Representative Solar Farm
100 kW roof mounted 1 MW ground mounted 10 MW ground mounted
Item Cost per W (AUD)
Total cost (AUD)
Cost per W (AUD)
Total cost (AUD)
Cost per W (AUD)
Total cost (AUD)
PV modules $0.77 $77,000 $0.75 $750,000 $0.70 $7,000,000
Inverters (inc transformers for large systems)
$0.17 $17,000 $0.22 $220,000 $0.20 $2,000,000
BoS Components
$0.30 $30,000 $0.38 $380,000 $0.35 $3,500,000
Civil Works $0.00 $0 $0.25 $250,000 $0.20 $2,000,000
Labour $0.20 $20,000 $0.20 $200,000 $0.20 $2,000,000
Shipping & transport
$0.05 $5,000 $0.05 $50,000 $0.05 $500,000
Contingencies $0.05 $5,000 $0.05 $50,000 $0.05 $500,000
Engineering $0.00 $0 $0.10 $100,000 $0.10 $1,000,000
Grid Connection
$0.10 $10,000 $0.50 $500,000 $0.25 $2,500,000
Land $0.00 $0 $0.005 $5,000 $0.0025 $25,000
STC value $35/STC
-$0.73 -$72,500 $0.00 $0 $0.00 $0
TOTAL $0.91 $91,500 $2.51 $2,505,000 $2.10 $21,025,000
Table 3 Capital costs of large-scale solar farms in the District Council of Mount Remarkable

ITP/A0121 – November 2013 11
Solar Farm Feasibility Study
Results
100 kW roof mounted system
The key modelling assumptions for the 100 kW system were:
Capital Cost: $91,500
O&M Costs: 1% of capital
Roof lease costs: $2,000
Permits and approvals: $10,000
100% equity financed at 15% cost of equity
The results of the modelling for the 100 kW system are shown in Table 4 below.
Project lifetime 30 years 25 years 20 years 15 years 10 years 5 years
LCOE $0.132 $0.135 $0.141 $0.152 $0.175 $0.268
Table 4 LCOE - 100 kW roof mounted system
As many commercial buildings change occupiers relatively frequently a system life of 10 years
assumed when conducting further analysis.
1 MW ground mounted system
The key modelling assumptions for the 1 MW system were:
Capital Cost: $2.5M
O&M Costs: 1% of capital per year
Insurance and other costs: 1.3% of capital
Setup costs (permits and approvals, legal costs, etc): $204,000
Debt to equity: 60%
Cost of debt: 8%, Loan term: 15 years
Cost of equity: 15%
ITP/A0121 – November 2013 12
Solar Farm Feasibility Study
The results of the modelling for the 1 MW system are shown in Table 5 below.
Project lifetime 30 years 25 years 20 years 15 years 10 years 5 years
LCOE $0.242 $0.247 $0.257 $0.279 NA NA
Table 5 LCOE – 1 MW ground mounted system
As the loan term for the system is 15 years only LCOEs for a system life of 15 years of greater
are considered. The assumed system life for further analysis is 25 years.
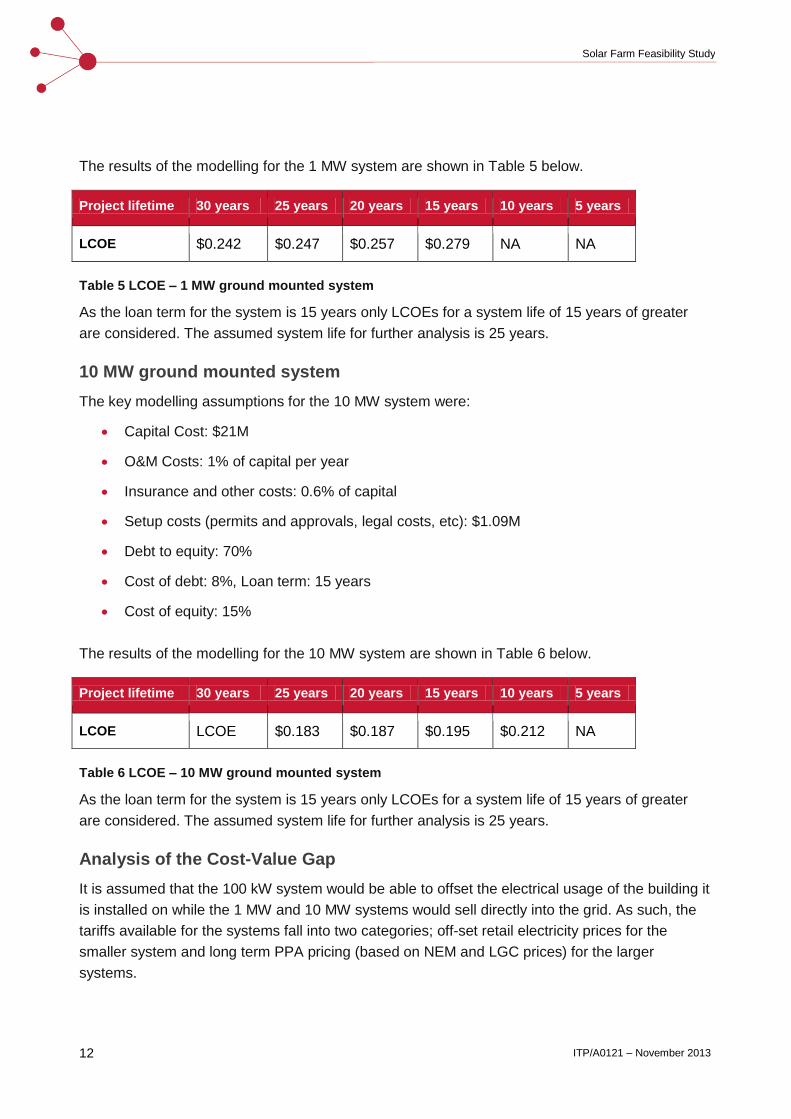
10 MW ground mounted system
The key modelling assumptions for the 10 MW system were:
Capital Cost: $21M
O&M Costs: 1% of capital per year
Insurance and other costs: 0.6% of capital
Setup costs (permits and approvals, legal costs, etc): $1.09M
Debt to equity: 70%
Cost of debt: 8%, Loan term: 15 years
Cost of equity: 15%
The results of the modelling for the 10 MW system are shown in Table 6 below.
Project lifetime 30 years 25 years 20 years 15 years 10 years 5 years
LCOE LCOE $0.183 $0.187 $0.195 $0.212 NA
Table 6 LCOE – 10 MW ground mounted system
As the loan term for the system is 15 years only LCOEs for a system life of 15 years of greater
are considered. The assumed system life for further analysis is 25 years.
Analysis of the Cost-Value Gap
It is assumed that the 100 kW system would be able to offset the electrical usage of the building it
is installed on while the 1 MW and 10 MW systems would sell directly into the grid. As such, the
tariffs available for the systems fall into two categories; off-set retail electricity prices for the
smaller system and long term PPA pricing (based on NEM and LGC prices) for the larger
systems.

ITP/A0121 – November 2013 13
Solar Farm Feasibility Study
While retail electricity prices in many areas are quite high (relative to pool prices) the 100 kW roof
mounted system would only be able to offset the electricity consumption component of the tariff
as the system is unlikely to have an effect on demand charges for the site. Therefore, the value of
the off-set electricity is likely to be in the order of 12 to 14c/kWh ($120 to $140/MWh). At present,
any electricity feed into the grid from the roof mounted system is likely to only attract a value of
9.8c/kWh.
The PPA pricing for the large scale systems is likely to be similar to that of recent wind farm PPAs
in the area with an allowance for the time of day benefit due to the output profile of a solar farm
compared to a wind farm. The PPA price is likely to be in the order of $90 to $110/MWh.
Table 7 below shows provides a summary of the financial viability of large scale solar farms in the
region.
Representative solar farm 100 kW roof
mounted
1 MW ground
mounted
10 MW ground
mounted
LCOE ($/MWh) $175 $247 $187
Retail price ($/MWh) $120 to $140
Retail price barrier ($/MWh) $35 to $55
Wholesale price5 ($/MWh) $90 to $110 $90 to $110
Wholesale price barrier6 ($/MWh) $137 to $147 $77 to $97
Table 7 Price barriers for solar farms in the District Council of Mount Remarkable
The LCOE estimates for the ground mounted systems in Table 5 and Table 6 show a decreasing
cost of energy, and increasing viability of larger ground mounted solar farms through economies
scale effects. As a comparison, the feed in tariffs offered in recent ACT reverse auction for the
successful proposals: $186/MWh for a 7 MW solar farm and $178/MWh for a 13 MW solar farm
[4] are similar to the results above.
5 Wholesale price is based on average NEM Pool Price and REC value
6 Wholesale price is based on average NEM Pool Price and REC value
ITP/A0121 – November 2013 14
Solar Farm Feasibility Study
3. REVIEW OF FUNDING OPPORTUNITIES
This section provides a scan of the Commonwealth and external funding opportunities for solar
farms in the region.
The Australian Government has a range of measures which aim to increase the uptake of
renewable energy in Australia. These include the Renewable Energy Target (RET) of ‘20%
renewable energy by 2020’, carbon pricing, the Clean Energy Finance Corporation (CEFC) and
the Australian Renewable Energy Agency (ARENA).
How these measures may change after the Federal election will depend on the result for the
House of Representatives and the make up of the new Senate. This summary outlines the
measures existing at the start of the 2013-14 financial year. It does not explore in detail, the
various scenarios that may eventuate following the Federal election on 7 September 2013.
However, it is worth noting the Coalition has announced it intends to abolish the carbon price and
the CEFC. It has also announced that it intends to reduce ARENA’s budget and review the RET
in 2014. This introduces uncertainty for renewable generation investments due to the review’s
potential impact on renewable energy certificate prices.
Renewable Energy Target
The RET commenced in 2001 and is a legislative scheme that creates a guaranteed market for
renewable generation by using a mechanism of tradable certificates. Demand for the renewable
energy certificates is created by placing a legal obligation on liable entities, (mainly electricity
retailers) to surrender a calculated number of certificates each year.
On 1 January 2011, the RET was split into two parts:
Small-scale Renewable Energy Scheme, (SRES); and
Large-scale Renewable Energy Target, (LRET).
The SRES allows small-scale installations such as solar hot water systems, heat pump hot water
systems, residential PV systems, small-scale wind turbines and small-scale hydro systems to
create Small-scale Technology Certificates (STCs). Liable entities are required to surrender a
calculated amount of STCs each quarter.
Typically, for solar PV, the STCs are allocated based on a forecast output for 15 years,
(deeming). Deeming is only available for Small-scale Generation Units and for solar PV this is
defined as systems no more than 100 kW.
An STC is equivalent to 1 MWh of renewable generation and the STC clearing house effectively
caps their price at $40. However, as a tradeable commodity, the price fluctuates based on supply

ITP/A0121 – November 2013 15
Solar Farm Feasibility Study
and demand. The price fell to less than $20 in 2011 and the STC spot price was about $37 in
mid-2013. A 10 kW PV array installed in the region would be eligible to create 207 STCs.
The LRET allows larger renewable generation facilities to create Large-scale Generation
Certificates (LGCs). LGCs are also equivalent to 1 MWh of renewable generation but are created
on the metered output of the power station. This enables the renewable power station to have two
separate income streams, one from selling the electricity and the other from selling the LGCs.
However, these are often combined under a Power Purchase Agreement (PPA).
The penalty for not surrendering enough LGCs to meet a liability is $65 per LGC, which is not tax
deductable. This effectively caps the LGC price at about $93. However, since the market for
renewable energy certificates and LGCs commenced, there has been an oversupply of
certificates. In mid-2013, their spot price was around $32. It should be noted that the majority of
LGCs are purchased through long term PPAs and their price is not published.
A 1 MW solar farm generating 1,400 MWh per year would have an annual LGC income of around
$45,000, assuming a price of $32 / LGC.
Carbon Price
Operating in tandem with the RET, the carbon price commenced on 1 July 2012. This makes
large emitters of greenhouse gas emissions financially liable. Originally, the price was to be fixed
for three years before transitioning to an emissions trading scheme.
On 16 July 2013, the Prime Minister announced the government’s intention to bring the start date
of emissions trading forward to 1 July 2014. This is expected to reduce the carbon price from a
fixed $24/tonne to a floating price of less than $10/tonne due to linkages with European markets.
The Coalition has announced an intention to abolish the carbon price and if it gains a lower house
majority, the ability to do this will be determined by the make up of the Senate.
The carbon price increased the costs of fossil fuel generation and thus increased wholesale
electricity prices. This decreases the cost gap for new renewable generation. However, as the
LGC price is influenced by the difference between the wholesale electricity price and the cost of
wind energy, the overall effect on project economics is not significant at present.
Clean Energy Finance Corporation (CEFC)
The CEFC commenced operations on 1 July 2013 and has $10 billion to invest in firms and
projects utilising clean energy technologies as well as manufacturing businesses that focus on
producing the inputs required. It is commercially oriented and expected to make a positive return
on its investments. Capital that is returned from investments will be retained for reinvestment by
the CEFC, with the Board to determine the quantum of any dividends payable to the Australian
Renewable Energy Agency.
ITP/A0121 – November 2013 16
Solar Farm Feasibility Study
The CEFC, after assessing the risks and commercial returns, may make obtaining solar farm
finance slightly less difficult by providing some of the debt required to reach financial close on a
project.
Similar to the carbon price, the Coalition’s plan to abolish the CEFC will need a majority in both
houses of parliament.
Australian Renewable Energy Agency
ARENA commenced on 1 July, 2012 and provides financial assistance for:
research, development, demonstration, deployment and commercialisation of
renewable energy and related technologies; and
storage and sharing of knowledge and information about renewable energy
technologies.
It has a range of programs including
Emerging Renewables Program,
Regional Australia Renewables Initiative,
Accelerated Step Change Initiative, and
Renewable Energy Venture Capital Fund.
Emerging Renewables Program
The objectives of the Emerging Renewables Program are to provide funding to:
drive innovation of renewable energy technologies in Australia,
reduce or remove roadblocks,
achieve renewable energy industry development and capacity building in Australia,
and
support the delivery of ARENA’s Supporting High-value Australian Renewable Energy
knowledge initiative.
The Emerging Renewables Program provides funding for Projects or Measures.
Projects are defined as activities that:
Progress the development of a renewable energy technology along the technology
innovation chain, or
Develop or demonstrate a renewable energy technology to remove or reduce a
roadblock.

ITP/A0121 – November 2013 17
Solar Farm Feasibility Study
Measures are defined as:
Knowledge activities, in support of the program’s objectives,
Renewable energy industry development and capacity building activities, or
Preparatory activities for projects, including potential projects for funding by ARENA.
The Emerging Renewables Program is unlikely to support the straightforward deployment of a
solar farm in the region. A solar farm project is likely to need an innovative approach to
overcoming a roadblock for consideration for Emerging Renewables Program funding.
Regional Australia’s Renewables Initiative
The Regional Australia’s Renewables Initiative supports trials of renewable energy solutions in
regional and remote locations. It consists of two components:
Regional Australia’s Renewables Industry Program (I-RAR), and
Community and Regional Renewable Energy (CARRE) program.
The objectives of the I-RAR are to:
demonstrate a portfolio of renewable energy solutions, including hybrid and integrated
systems, in Australia off-grid and fringe-of-grid areas,
ensure knowledge is produced and disseminated regarding the deployment of renewable
energy solutions in remote areas catalysing further renewable energy uptake, and
remove roadblocks, leading to greater deployment of renewable energy solutions in off-
grid and fringe-of-grid areas.
To be eligible, projects must be larger than 1 MW and off-grid or fringe-of-grid. The definition of
fringe-of-grid is areas in the National Electricity Grid that are remote, where remote is as defined
in the Australian Statistical Geography Standard. The DCMR region is classified as Outer
Regional Australia and thus is not eligible under the I-RAR.
The objectives of the CARRE program are to:
demonstrate technical viability and system reliability of feeding more renewable energy
into isolated electricity systems and mini-grids,
facilitate the further development of supporting technologies and systems that will improve
renewable energy reliability and commercial success, such as system integration and
storage, through demonstration and deployment,
demonstrate the commercial viability of innovative business models, including community
ownership models, for renewable energy systems in these locations, and

ITP/A0121 – November 2013 18
Solar Farm Feasibility Study
develop and share knowledge and experience in implementing, operating and maintaining
renewable energy systems among regional energy suppliers and distributors and
commercial and community customers.
To be eligible for funding under the CARRE program, the applicant must be an Australian
electricity distributor and the project not connected to the main-grid. Thus the CARRE is unlikely
to support solar farms in the region.
Accelerated Step Change Initiative (ASCI)
The objectives of the ASCI are to fund projects above $20m each that allow ARENA to capitalise
on exceptional opportunities that are consistent with its General Funding Strategy but are not
captured through ARENA’s existing suite of initiatives and programs. It is unlikely that a solar farm
project in the region would be eligible for ASCI funding.
Renewable Energy Venture Capital Fund
This venture capital fund is managed by Southern Cross Venture Partners. The primary
objectives of the fund are to:
increase the number of Australian renewable energy and enabling technology companies
that are successful in Australian and overseas markets,
foster the skills and management capability of Australian renewable energy and enabling
technology companies by providing active investment management, and
leverage additional investment in Australian renewable energy technology and enabling
technology companies from the private sector, including from international sources.
This fund would not invest in solar farms in the region as it is more focused on commercialisation
of new technologies.
Regional Development Australia Fund
The Regional Development Australia Fund (RDAF) is administered by the Department of
Regional Australia, Local Government, Arts and Sports. The objective of the RDAF is to support
the economies and communities of Australia’s regions.
RDAF Round 5 closed on 22 July 2013. While electricity infrastructure is not listed as ineligible,
the announced projects for Round 4 are mainly transport, sport and tourism related. Further
information is available from the website: www.regional.gov.au/regional/programs/rdaf.aspx
The Flinders Ranges Council led a consortium of four local government councils, including the
District Council of Mount Remarkable, which was successful in obtaining RDAF Round 1 funding
for 10 solar power systems and 84 solar lights.

ITP/A0121 – November 2013 19
Solar Farm Feasibility Study
South Australian Government Support
The only South Australian Government funding program identified that may be relevant is the
Regional Development Fund (RDF).
The RDF has funding of $3 million year and is delivered by Primary Industries and Regions South
Australia (PIRSA). The guides for applicants are available from the website:
www.pir.sa.gov.au/regions/programs/rdf
The RDF offers grant funding of $50,000 to $200,000 through two streams:
i) Growing Stronger Regions
For non-metropolitan Regional Development Australia Associations to facilitate
regional economic development that directly delivers on:
South Australia’s Strategic Plan targets,
PIRSA Strategic Priorities,
South Australian Government’s seven priorities.
ii) Creating Competitive Regions – up to 50% eligible project costs
For non-metropolitan private sector businesses, industry associations, community
organisations, regional local government, and the South Australian non-metropolitan
Regional Development Australia Associations to leverage funds to support the
delivery of new regional employment and investment directly linked with the following
strategic priorities of the State Government:
premium food and wine from our clean environment,
growing advanced manufacturing, or
realising the benefits of the mining boom for all South Australians.
The Creating Competitive Regions 2014 funding round Expressions of Interest close on 27
September 2013. The Growing Stronger Regions - Guide for Applicants does not specify when
applications for this stream’s 2014 funding round closes. However, the 2013 funding round
closed on 28 September 2012.
The guide for applicants for both streams indicates that the following is not eligible:
projects undertaken on behalf of third parties, and
feasibility studies, business cases, plans and reports.

ITP/A0121 – November 2013 20
Solar Farm Feasibility Study
However, the Growing Stronger Regions – Guide for Applicants caveats the second dot point by
stating:
‘Feasibility studies, business cases, plans and reports will not be funded where they do not
form part of an established and broader program that meets the Regional Development
Fund Stream 1 purpose and objectives’
It is recommended that DCMR contact PIRSA’s Senior Regional Industry Liaison Officer on
(08) 8226 0218 to discuss how this program may support council activities and whether there is
any scope for funding solar farm developments in the region or their facilitation.
South Australian Feed-in Scheme
The South Australian solar feed-in scheme is open to electricity consumers that consume less
than 160 MWh per year. For PV systems that receive permission to connect after 30 September
2013, the minimum retailer payment is 9.8c/kWh (GST exc) to 31 December 2013. The minimum
retailer payment for 2014 and onwards is being reviewed by the Essential Services Commission
of South Australia. Submissions closed on 26 July 2013 and an outcome is expected before the
end of the year.
Summary of funding opportunities
As the Solar Flagships program has closed, there is no grant funding available from to support
the straightforward deployment of proven, renewable energy technologies, such as solar PV
farms, in the region.
The Australian Government’s principal support mechanism is the renewable energy target. This
market based mechanism, predominantly, assists the lowest cost forms of renewable energy
such as wind farms.
The Emerging Renewables Program may support a solar farm in the region, if it involves an
innovative approach to overcoming a roadblock that is replicable for future projects. As the NSW
government is funding several community solar farm feasibility studies7, it may be difficult to
identify an innovative approach that would attract Emerging Renewables Program funding.
7 http://www.environment.nsw.gov.au/resources/MinMedia/MinMedia13053001.pdf

ITP/A0121 – November 2013 21
Solar Farm Feasibility Study
4. IDENTIFY PREFERRED AREAS FOR LARGE-SCALE SOLAR FARMS
Identifying the preferred areas of the DCMR region is a key element of understanding the
opportunity presented by solar farms and the attractiveness of the District to investors.
Multi-criteria analysis
To assist the Council’s thinking the areas likely to be targeted by developers were identified
through a multi-criteria analysis. Using spatial information, that is electronic maps, ITP combined
the criteria that exclude8 solar farm development with those that have a variable9 impact on the
attractiveness for development to produce a colour-graded map that indicates the relative
attractiveness to developers of solar farms of each part of the District.
A separate analysis was carried out for the 1 MW and 10 MW solar farms as the electricity grid
connection requirements at the two scales are very different.
Data sources
Spatial information was obtained from public sources where possible. The Government of South
Australia and the Government of Australia operate internet-based data portals that provide a
range of spatial data. Where required, data was obtained directly from the custodian organisation.
Data was obtained from the sources listed in Table 8.
Source
Number
Data portal Internet address
1. South Australian Government
Data Directory
http://data.sa.gov.au/
2. Housing Property and Lands,
Spatial Data Downloads
Government of South Australia
http://www.sa.gov.au/subject/
Housing%2C+property+and+land/
Building+and+development/South+Australia
%27s+land+supply+and+planning+system/
Planning+data+for+research+and+mapping/
Spatial+data+downloads
8 Exclusions are factors that prohibit development. The converse of exclusion is allowed. They have a yes or no value.
9 Variables are factors that do not prohibit development, rather have a location specific value that is considered in
decision making.

ITP/A0121 – November 2013 22
Solar Farm Feasibility Study
Source
Number
Data portal Internet address
3. NatureMaps
Government of South Australia
http://www.naturemaps.sa.gov.au/
download_spatial_layers.html
4. National Elevation Data
Framework Portal
Government of Australia,
http://nedf.ga.gov.au/geoportal/
catalog/main/home.page
5. SA Power Networks http://www.sapowernetworks.com.au
6. Bureau of Meteorology http://www.bom.gov.au
Table 8 Spatial data sources
Community consultation
A discussion paper and request for opinions on solar farms was circulated to residents of DCMR
through the Council’s website10 on 23 August 2013. Following distribution to the community the
discussion paper was publicised to the industry via the Australian PV Association e-newsletter on
9 September 2013.
Community perspectives were not included in the analysis. No responses from the community
were received by 16 September 2013 supporting the decision not to use a community view based
criterion.
Exclusions
The criteria that exclude solar farm development are given in the table below. The table describes
which elements of each data set exclude and which allow solar farm development. These criteria
provide a yes or no answer for solar farm development.
10
http://www.mtr.sa.gov.au/page.aspx?u=148

ITP/A0121 – November 2013 23
Solar Farm Feasibility Study
Criteria Values excluding solar farms
Values allowing solar farms
Source Number, Data Set Name, Specific URL11
National Parks
All values indicating a park or reserve
Nil 1, Conservation Reserve Boundaries http://data.sa.gov.au/dataset/conservation-reserve-boundaries
Native vegetation
All values indicating native vegetation
Nil 3, Native Vegetation Cover – Statewide (Dataset #826)
Land use All categories except for those listed in Values Allowing column
Agriculture, Livestock, Industry, Rural residential > 2.5 Ha, Vacant > 2.5 Ha
2, Generalised Land Use
Planning zones
Rural Living. All categories except for those listed in Values Allowing column.
Rural, Deferred Urban, Industrial, Infrastructure
2, Land development zones
Bushfire risk High, Medium
General 1, Bushfire Protection Areas http://data.sa.gov.au/dataset/bushfire-protection-areas
Table 9 Criteria excluding solar farm development
Variable impacts
Criteria that have a variable impact on the attractiveness for solar farm development on the basis
of location, or criteria where the value varies across the area under consideration are discussed
in the following table. The table describes the basis for the variable to influence the attractiveness
for solar farm development. The table also indicates the source of the data, the data sets used
and the specific source of the information.
11
If different from the source URL or website address

ITP/A0121 – November 2013 24
Solar Farm Feasibility Study
Variable Measure Source, Data Set Name, Specific URL12
Electricity network
Cost based on distance to suitable connection to network
5, HV Line, HV Cable, LV Line, LV Cable, Substations
Terrain Slope North facing slopes above 30° are not suitable. South facing slopes above 10° are not suitable.
Derived from 4, 1 second SRTM Derived Digital Elevation Model (DEM) version 1.0
Terrain Shading Hours of shading Derived from 4, 1 second SRTM Derived Digital Elevation Model (DEM) version 1.0
Solar resource Annual average MJ/m2 6, Annual Average DNI (1997 – 2007)
Table 10 Criteria with variable impacts on solar farm development
Processing
The next step in the multi-criteria analysis is to process each of the criteria to create a gridded
data set or a raster map13 of values representing the exclusion or variable. The criteria that are
provided in this format require little more processing than identifying the range of values and
working out an appropriate scaling or weighting factor.
Criteria that are provided as vector or line data, where each part of the drawing is described be a
start and end point or a start point and a direction and distance, the information needs to be
converted to a raster. For exclusions the map is converted to a raster where each cell has a yes
or no value.
For the grid network, the criterion is the cost of the connection as determined by: the type of
connection, either line or substation; the rated capacity of the connection; the voltage at the
connection point; and the distance from the connection point. The shortest distance to a
connection point is calculated for each point. Then the cost equation from Table 11 is applied to
create a map of grid connection costs.
12
If different from the source URL or website address 13
A raster is an image composed of points or pixels. Each point has a reference and value.

ITP/A0121 – November 2013 25
Solar Farm Feasibility Study
Solar farm 33 kV line 33 kV substation 11 kV feeder 11 kV
substation
10MW $2.2 million +
$300,000/km
$2.0 million +
$300,000/km Cannot take load
$1.2 million +
$250,000/km
1MW Cost Prohibitive Cost Prohibitive $800,000 +
$200,000/km
$600,000 +
$200,000/km
Table 11 Grid connection cost criterion
An important constraint on the development of solar farms in the District is the capacity of the
network. The SA Power Networks annual planning document [5] provides detailed information on
the rated capacity of the lines and substations across South Australia. In the District, there are a
limited number of lines and substations that have a rated capacity that can accept a 10 MW load
or generator. This limits the areas where a 10 MW solar farm can be economically connected.
For the solar resource the existing raster is used without refinement. However, the solar resource
information used has a 5 km grid resolution which leads to artefacts in the final mapping. This can
be seen clearly in Appendix B in the area to the north-northwest of the Baroota substation. These
step changes could be avoided using higher resolution solar resource data.
The terrain in the District is included in the analysis and is based on a ~30 m resolution digital
elevation model (DEM). The DEM was processed to calculate shading from the terrain, areas of
high slope, and areas of moderate south-facing slope.
Combining the criteria
Once the exclusions and variables have been processed into rasters, they are combined. At each
point each exclusion is evaluated in turn by a simple logic statement14. If a point is excluded by a
layer, no further evaluation is carried out. If the exclusions layers exclude a point, a numeric value
such as -9999 is included in the results layer, and no further evaluation takes place. If after all the
exclusions have been evaluated, the point is still included, the cost of the development is
calculated at the point using the equations such as this for the 10 MW solar farm:
10MW_cost_total = ($19,610,000 + lowest value from (10MW_33kVcost,
10MW_11kVSubcost, 10MW_33kVcost, 10MW_11kVSubcost)) * (20 / Solar_Resource)
14
Such as if X then Y else Z

ITP/A0121 – November 2013 26
Solar Farm Feasibility Study
The result of combining the raster layers using the logic and equations is a total cost, expressed
as millions of dollars.
Results
The resulting raster maps were then presented for printing at A3 size. They are also provided in
Appendix A Preferred Areas for a 1 MW solar farm and Appendix B Preferred Areas for a 10 MW
solar farm. The A3 maps are supplied.
The connection cost is a key variable component of the overall cost of solar farm. For the 10 MW
solar farm, a 1 km connection to a 33 kV substation represents about 12% of the total capital
cost. As the length of the connection increases, proportional cost of the grid connection increases
and so does the LCOE, making the cost value gap for a solar farm project larger.
The preferred area maps show the exclusion zones as transparent and the possible areas
shaded with a graduated range of colour. The graduated colour is based on the total cost of
developing the solar farm and shows the cost increasing with distance from the grid connection
point. The quality of the solar resource indicates that the preference is for areas toward the north
of the district.
The maps indicate that the preferred locations for a 10 MW solar farm are in the immediate
vicinity of the Murraytown and Baroota substations and the line connecting Murraytown to
Baroota and then to Bungama.
For the 1 MW solar farm the grid does not present the same limitation as the 10 MW solar farm.
In this case, the preferred areas follow the 33 kV and 11 kV lines and centre on the substations.
As the cost of connecting to substation is lower than breaking in to a line, a solar farm can be
developed further from a substation at the same cost.
It should be noted that this analysis did not consider all possible variables influencing
development decision. The cost of land access not considered as a variable across the District,
although it is generally known that the areas of higher and more reliable rainfall are more
valuable. Further investigations could incorporate rainfall information as a proxy for land value.
Investigation – improving the grid
A ‘what if’ investigation of the impact on the areas preferred for development of a 10 MW solar
farm of improving the grid in the District was carried out. The preferred areas for 10 MW solar
farms were reassessed using the assumption that all of the 33 kV distribution lines, 33 kV
substations and 11 kV substations have the capacity to accept a 10 MW solar farm. In this case,
as expected, the preferred areas follow the lines, with a focus on the area near the Wilmington
substation. The results, a third preferred areas map was produced and is presented in Appendix
C. Further explanation of this investigation follows.

ITP/A0121 – November 2013 27
Solar Farm Feasibility Study
The preferred area maps highlight the attraction of solar farms to proximity to the electricity
network and in particular the substations. At substations, it is possible to add extra equipment and
connect, minimising costs. Connection to a power line requires additional equipment compared to
a substation connection thereby increasing costs. Any connection to the electricity distribution
system in the District will require the approval of SA Power Networks.
The SA Power Networks’ Electricity System Development Plan 2012 [5] provides details of the
lines and substations in their network. In the District the network consists primarily of 33 kV
distribution lines. The transmission connection point at Baroota supplies lines to Murraytown and
Bungama. The line to the Murraytown non-zone substation transformer has a capacity of 10 MVA.
This transformer supplies lines to:
Melrose (5.6 MVA) then Wilmington (7.6 MVA)
Booleroo Centre then Orroroo (7 MVA)
Gladstone (5.6 MVA)
The substations at Melrose, Booleroo and Wilmington all have transformers rated at 1 MVA.
What this means is that in the District the 10 MW solar farm can only be connected to the
Baroota or Murraytown substations or the line from Bungama to Murrarytown without requiring
extensive and expensive upgrades to the existing lines and substations.

ITP/A0121 – November 2013 28
Solar Farm Feasibility Study
5. OPTIONS PAPER FOR COUNCIL ACTIONS
The options for a local government in Australia to take action to attract and support investment in
renewable energy in their area of governance are limited. This limitation is a result of the
jurisdictional responsibilities delegated from the Government of Australia to the State
Governments and then to Local Governments. The delegation of powers varies from State to
State. In South Australia, Local Government is responsible for the provision of local services and
regulation of activities at a regional level. The use of a feed-in-tariff or portfolio standard for
example are outside the powers of Local Governments in South Australia.
In the areas of economic development and renewable energy, the Council has limited areas
under its direct control where it can take action and influence the economics. While both
Commonwealth and State governments have the power to levy taxes and duties, Local
government does not. Council’s also have limited budgets with their income generated primarily
from rates. Increasing their rates to provide support for commercial projects may not be
welcomed by their constituents.
To identify options that are available to Local Governments literature on the experience and
practices used in other countries and jurisdictions were reviewed to prepare a separate Council
Options Paper. To increase the applicability of this research, a range of options were identified
and assessed. As expected, some are not well suited to utilisation by all councils.
The literature review was open to all types of support mechanism and then filtered to produce a
list of the options suitable to the policy and regulatory powers of Local Government. The literature
reviewed includes, but is not limited to:
Compendium of Best Practices, Sharing Local and State Successes in Energy Efficiency
and Renewable Energy from the United States [6]
Deploying Renewables 2011: Best and Future Policy Practice [7]
Deploying Renewables: Principles for Effective Policies [8]
The Database of State Incentives for Renewables and Efficiency [9]
The current economics of solar farms is the main barrier to their deployment. As the modelling in
Section 2 of this report shows there is a significant gap between the value of energy from solar
farms and the cost of energy from solar farms. To assess the benefits of implementing the action,
its impact on the economics of solar farm development was considered qualitatively.
Council Options Paper identifies two broad groups of potential actions, Financial Actions and
Facilitation Actions. The Financial based incentives or actions provide direct financial support or
savings to the solar farm. Facilitation based incentives may indirectly reduce the cost of
ITP/A0121 – November 2013 29
Solar Farm Feasibility Study
developing the solar farm or make the process of obtaining approval for the solar farm more
streamlined or certain.
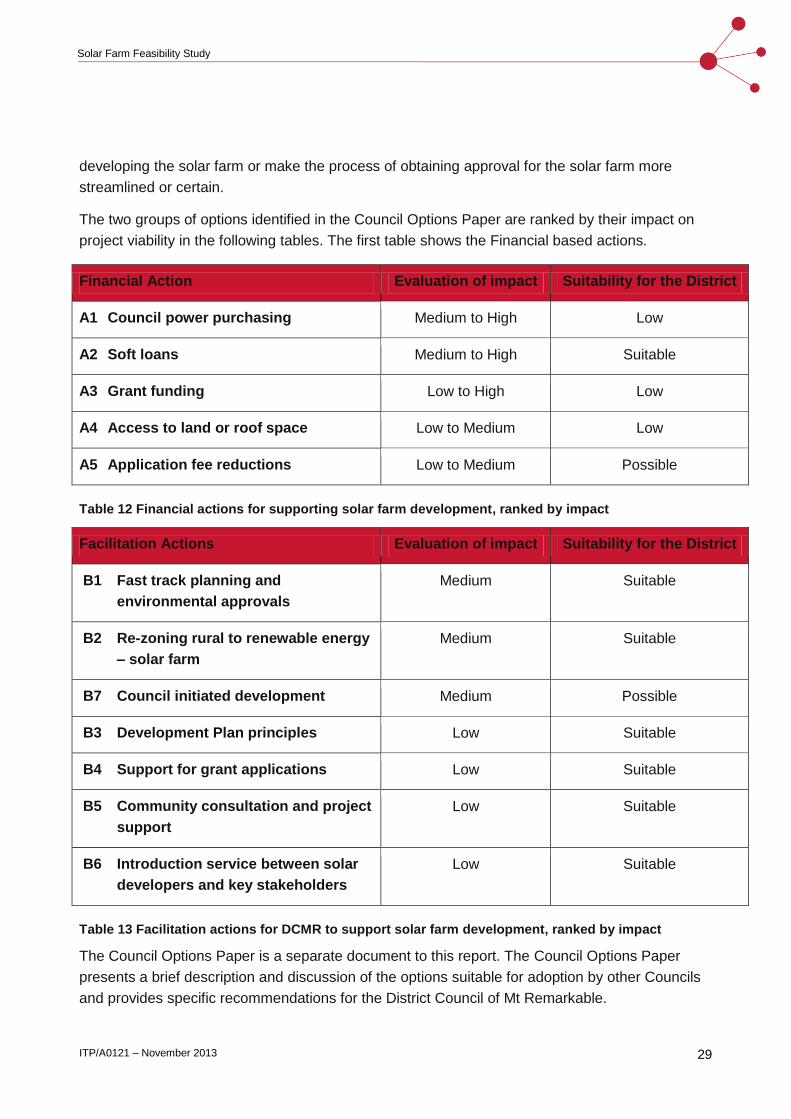
The two groups of options identified in the Council Options Paper are ranked by their impact on
project viability in the following tables. The first table shows the Financial based actions.
Financial Action Evaluation of impact Suitability for the District
A1 Council power purchasing Medium to High Low
A2 Soft loans Medium to High Suitable
A3 Grant funding Low to High Low
A4 Access to land or roof space Low to Medium Low
A5 Application fee reductions Low to Medium Possible
Table 12 Financial actions for supporting solar farm development, ranked by impact
Facilitation Actions Evaluation of impact Suitability for the District
B1 Fast track planning and
environmental approvals
Medium Suitable
B2 Re-zoning rural to renewable energy
– solar farm
Medium Suitable
B7 Council initiated development Medium Possible
B3 Development Plan principles Low Suitable
B4 Support for grant applications Low Suitable
B5 Community consultation and project
support
Low Suitable
B6 Introduction service between solar
developers and key stakeholders
Low Suitable
Table 13 Facilitation actions for DCMR to support solar farm development, ranked by impact
The Council Options Paper is a separate document to this report. The Council Options Paper
presents a brief description and discussion of the options suitable for adoption by other Councils
and provides specific recommendations for the District Council of Mt Remarkable.

ITP/A0121 – November 2013 30
Solar Farm Feasibility Study
6. DISCUSSION
The cost value gap for large scale solar farms in the District of Mount Remarkable is sufficient to
make action by the Council unlikely to remove it entirely. Action by the Council would instead set
out to make the District more attractive for developers than other regions.
The DCMR has a competitive solar resource; land is suitable and accessible, making it as
prospective for solar farm development as many other areas of the State and Australia. By
implementing one or more actions, DCMR could increase its attractiveness for investment and
promoting them to the solar farm industry.
The recommended Council Actions for DCMR are:
Action Evaluation of impact Suitability for the District
A2 Soft loans Medium to High Suitable
B1 Fast track planning and
environmental approvals
Medium Suitable
B2 Re-zoning rural to renewable energy –
solar farm
Medium Suitable
Table 14 Recommend actions for DCMR
Action A1 Council power purchasing is not recommended for the DCMR due to the size of the
demand from Council operations and the extensive use of solar power.
When considered together, the cost value gap and the preferred areas for solar farm it is clear
that the attractiveness of the District for 10 MW solar farms in the District is limited. When
considering 1 MW solar farms, there are more siting options however the economics are less
favourable.
Recommendations for further investigations
The review of the electricity network in the District identified limited opportunities to connect a
10 MW solar farm at competitive cost. At the 1 MW scale, the opportunity for cost effective
connection is greater, however the economics are less favourable. Investigation of an
intermediate size solar farm of around 5 MW could be undertaken to understand the cost – value
gap at this scale and the impacts of the grid network.

ITP/A0121 – November 2013 31
Solar Farm Feasibility Study
The solar resource information used is based on a 5 km grid that introduces some artefacts into
the preferred area maps. It is recommended that higher resolution solar data is obtained and
used in the mapping to avoid artefacts.
It is noted that this analysis did not consider all possible variables influencing development
decision. The cost of land access not considered as a variable across the District, although it is
generally known that the areas of higher and more reliable rainfall are more valuable. Further
investigations could incorporate rainfall information as a proxy for land value.

ITP/A0121 – November 2013 32
Solar Farm Feasibility Study
7. REFERENCES
[1] Geoscience Australia and ABARE, “Australian Energy Resource Assessment,” Canberra,
2010.
[2] Bureau of Resources and Energy Economics, “Australian Energy Technology Assessment,”
Canberra, 2012.
[3] J. Rutovitz and S. Harris, “Calculating global energy sector jobs: 2012 methodology,”
Prepared for Greenpeace International by the Institute for Sustainable Futures, University of
New South Wales, Sydney, 2012.
[4] G. Parkinson, “ACT Solar Auction won by Elementus, Zhenfa Solar,” 19 August 2013.
[Online]. Available: http://reneweconomy.com.au/2013/act-solar-auction-won-by-elementus-
zhenfa-solar-67633. [Accessed 27 August 2013].
[5] ETSA Utilities, “Electricity System Development Plan,” Adelaide, 2012.
[6] Renewable Energy and Energy Efficiency Partnership (REEEP), Alliance to Save Energy,
American Council On Renewable Energy, “Compendium of Best Practices, SHaring Local
and State Successes in Energy Efficiency and Renewable Energy from the United States,”
2010.
[7] International Energy Agency, “Deploying Renewables 2011: Best and Future Policy Practice,”
Paris, 2011.
[8] International Energy Agency, “Deploying Renewables: Principles for Effective Policies,” Paris,
2008.
[9] North Carolina State University, under NREL Subcontract No. XEU-0-99515-01, “Database of
State Incentives for Renewables and Efficiency,” [Online]. Available: http://www.dsireusa.org.
[Accessed 19 August 2013].
[10] State Electoral Office, “An introduction to Local Government,” 2006.
[11] G. Parkinson, “FRV to build 20MW solar PV plant after winningACT auction,” 5 September
2012. [Online]. Available: http://reneweconomy.com.au/2012/frv-to-build-20mw-solar-pv-
plant-after-winning-act-auction-50595. [Accessed 27 August 2013].

ITP/A0121 – November 2013 33
Solar Farm Feasibility Study
APPENDIX A. PREFERRED AREAS FOR A 1 MW SOLAR FARM

ITP/A0121 – November 2013 34
Solar Farm Feasibility Study
APPENDIX B. PREFERRED AREAS FOR A 10 MW SOLAR FARM

ITP/A0121 – November 2013 35
Solar Farm Feasibility Study
APPENDIX C. 10 MW PREFERRED AREA FOR AN IMPROVED GRID

ITP/A0121 – November 2013 2
Title