Embed Size (px)
Citation preview
- 1 -
岩波書店発行『世界1 2011January no.812』《特集 原子力復興という危険な夢;マイケルシュナイダー他》
131ページに図6「発電コストの歴史的交差(ノースカロライナ州における事例研究)」を掲載している。
出典が明らかになっているので、それをウェブにて調べたら以下の内容であることが判明した。
1)原子力発電単価の2010年以降の予測値が一直線であるのに、太陽光発電は数多くあり、違うデ
ータを使って回帰曲線、つまり相関直線を描いている。それで推論に持ってゆくのは科学的な手
法ではない。
2)事例研究とあるが、何故に元データを紹介しないのか、下記報告書の中段にフル・レポートへのリ
ンク先が明示されてひょっとしたらあるのかも知れないが、そこへは繋がらない。まして米国の一州
の予測値を全世界に恰も米国の傾向であるかのように発信し、見事にマイケルシュナイダーが都
合のよいデータとして飛びつき、それを日本に紹介していることに疑問を禁じえない。
3)比較のために別の資料をこの4ページ以下に呈示します。太陽光発電とは直接の比較は困難で
しょうが、根拠が示されまた解析が行なわれています。因みに前者のそれは、再生可能エネルギ
ー促進部隊であり、後者は World Nuclear Association が公開しているので夫々の色が違うので
しょう。
4)MITによる「原子力の将来」の報告書(2003年版の最新更新版)のウェブサイトをご覧下さい。
http://web.mit.edu/nuclearpower/
2010年12月24日 IOJ会員 鈴木 弥栄男
http://www.renewableenergyworld.com/
Solar and Nuclear Costs —The Historic Crossover By John O. Blackburn, PhD, NC-WARN (left) and Sam Cunningham (photo not
available) | 2010/08/10 | 20 Comments
Report shows that solar energy is now the better buy. Solar photovoltaic system costs have fallen steadily for decades. They are projected to fall even farther
over the next 10 years. Meanwhile, projected costs for construction of new nuclear plants have risen
steadily over the last decade, and they continue to rise. In the past year, the lines have crossed in North
Carolina. Electricity from new solar installations is now cheaper than electricity from proposed new nuclear
plants. This new development has profound implications for North Carolina's energy and economic future.
Each and every stakeholder in North Carolina's energy sector — citizens, elected officials, solar power
installers and manufacturers, and electric utilities — should recognize this watershed moment.

- 2 -
Figure 1: The Historic Crossover — Solar photovoltaic costs are falling as new nuclear costs are
rising. The Solar PV least-squares trendline is fit to:
1. data points representing the actual cost of producing a kilowatt-hour in the year shown through
2010 in the US
2. 2010 costs from North Carolina installers, and
3. national cost projections from 2010 to 2020.
The nuclear trend-line is fit to national cost projections made in the year shown on the x-axis of eventual
kilowatt-hour cost if projects reach completion.
State law requires that the development of the electricity system follow a “least-cost” path and that
available resources be added as necessary. Less expensive resources are to be added first, followed by
more expensive ones, provided that system reliability is maintained. Energy efficiency, wind power, solar
hot water (displacing electric water heating) and cogeneration (combined heat and power), were already
cheaper sources than new nuclear plants.
This report illustrates that solar photovoltaics (PV) have joined the ranks of lower-cost alternatives to new
nuclear plants. When combined, these clean sources can provide the power that is needed, when it is
needed.
The state’s largest utilities are holding on tenaciously to plans dominated by massive investments in new,
risky and ever-more-costly nuclear plants, while they limit or reject offers of more solar electricity. Those
utilities seem oblivious to the real trends in energy economics and technology that are occurring in
competitive markets.
Everyone should understand that both new solar and new nuclear power will cost more than present
electricity generation costs. That is, electricity costs will rise in any case for most customers, especially

- 3 -
those who do not institute substantial energy efficiency upgrades. Power bills will rise much less with solar
generation than with an increased reliance on new nuclear generation.
Commercial-scale solar developers in North Carolina are already offering utilities electricity at 14 cents or
less per kWh. Duke Energy and Progress Energy are limiting or rejecting these offers and pushing ahead
with plans for nuclear plants that, if ever completed, would generate electricity at much higher costs —
14–18 cents per kilowatt-hour according to present estimates. The delivered price to customers would be
somewhat higher for both sources.
It is true that solar electricity enjoys tax benefits that, at the moment, help lower costs to customers.
However, since the late 1990s the trend of cost decline in solar technology has been so great that solar
electricity is fully expected to be cost-competitive without subsidies within the decade. Nuclear plants
likewise benefit from various subsidies — and have so benefitted throughout their history.
Now the nuclear industry is pressing for more subsidies. This is inappropriate. Commercial nuclear power
has been with us for more than forty years. If it is not a mature industry by now, consumers of electricity
should ask whether it ever will be competitive without public subsidies. There are no projections that
nuclear electricity costs will decline. Very few other states are still seriously considering new nuclear plants.
Some have cancelled projects, citing continually rising costs with little sign of progress toward commencing
construction. Many states with competitive electricity markets are developing their clean energy systems as
rapidly as possible. North Carolina should be leading, not lagging, in the clean energy transition.
We call on Governor Perdue, the General Assembly, the Energy Policy Council and the N. C. Utilities
Commission to investigate these matters and see for themselves that a very important turning point has
been reached.
This is a summary of a full report produced for clean energy nonprofit NC WARN. To download the full report (PDF), click here.
John O. Blackburn, PhD is a professor Emeritus of Economics and former Chancellor at Duke University.
Dr. Blackburn has conducted research into energy efficiency and renewable energy over a period of more
than thirty years. He has authored two books and numerous articles on the future of energy, and has
served on the Advisory Boards of the Florida Solar Energy Center and the Biomass Research Program at
the University of Florida. He has testified before the NC Utilities Commission in several utility dockets on
electricity supply and demand, energy efficiency, and renewable energy.
Sam Cunningham, Masters of Environmental Management candidate, Duke University. Mr. Cunningham's
professional and academic interests are focused on policy applications of natural resource economics. He
is an Economics and Environmental Studies graduate of Emory University.
NC WARN: Waste Awareness & Reduction Network is a member-based nonprofit tackling the accelerating
crisis posed by climate change — along with the various risks of nuclear power — by watch-dogging utility
- 4 -
practices and working for a swift North Carolina transition to energy efficiency and clean power generation.
In partnership with other citizen groups, NC WARN uses sound scientific research to inform and involve the
public in key decisions regarding their well-being.
The information and views expressed in this article are those of the author and not necessarily those of
RenewableEnergyWorld.com or the companies that advertise on its Web site and other publications.
**********************************************
比較のために別の資料を示します。
World Nuclear Association
http://www.world-nuclear.org/info/inf02.html
The Economics of Nuclear Power
(July 2010)
· Nuclear power is cost competitive with other forms of electricity generation, except where there is direct access to low-cost fossil fuels.
· Fuel costs for nuclear plants are a minor proportion of total generating costs, though capital costs are greater than those for coal-fired plants and much greater than those for gas-fired plants.
· In assessing the economics of nuclear power, decommissioning and waste disposal costs are fully taken into account.
Assessing the relative costs of new generating plants utilising different technologies is a complex matter and the results depend crucially on location. Coal is, and will probably remain, economically attractive in countries such as China, the USA and Australia with abundant and accessible domestic coal resources as long as carbon emissions are cost-free. Gas is also competitive for base-load power in many places, particularly using combined-cycle plants, though rising gas prices have removed much of the advantage.
Nuclear energy is, in many places, competitive with fossil fuels for electricity generation, despite relatively high capital costs and the need to internalise all waste disposal and decommissioning costs. If the social, health and environmental costs of fossil fuels are also taken into account, the economics of nuclear power are outstanding.

- 5 -
See also the December 2005 World Nuclear Association report (pdf 310 kB) The New Economics of Nuclear Power.
The cost of fuel
From the outset the basic attraction of nuclear energy has been its low fuel costs compared with coal, oil and gas-fired plants. Uranium, however, has to be processed, enriched and fabricated into fuel elements, and about half of the cost is due to enrichment and fabrication. In the assessment of the economics of nuclear power allowances must also be made for the management of radioactive used fuel and the ultimate disposal of this used fuel or the wastes separated from it. But even with these included, the total fuel costs of a nuclear power plant in the OECD are typically about a third of those for a coal-fired plant and between a quarter and a fifth of those for a gas combined-cycle plant.
In January 2010, the approx. US $ cost to get 1 kg of uranium as UO2 reactor fuel (at likely contract price for the natural uranium from a mine):
Uranium: 8.9 kg U3O8 x $115.50 US$ 1028
Conversion: 7.5 kg U x $12 US$ 90
Enrichment: 7.3 SWU x $164 US$ 1197
Fuel fabrication: per kg US$ 240
Total, approx: US$ 2555
At 45,000 MWd/t burn-up this gives 360,000 kWh electrical per kg, hence fuel cost: 0.71 c/kWh.
Fuel costs are one area of steadily increasing efficiency and cost reduction. For instance, in Spain the nuclear electricity cost was reduced by 29% over 1995-2001. This involved boosting enrichment levels and burn-up to achieve 40% fuel cost reduction. Prospectively, a further 8% increase in burn-up will give another 5% reduction in fuel cost.
Uranium has the advantage of being a highly concentrated source of energy which is easily and cheaply transportable. The quantities needed are very much less than for coal or oil. One kilogram of natural uranium will yield about 20,000 times as much energy as the same amount of coal. It is therefore intrinsically a very portable and tradeable commodity.
The fuel's contribution to the overall cost of the electricity produced is relatively small, so even a large fuel price escalation will have relatively little effect (see below).
There are other possible savings. For example, if used fuel is reprocessed and the recovered plutonium and uranium is used in mixed oxide (MOX) fuel, more energy can be extracted. The

- 6 -
costs of achieving this are large, but are offset by MOX fuel not needing enrichment and particularly by the smaller amount of high-level wastes produced at the end. Seven UO2 fuel assemblies give rise to one MOX assembly plus some vitrified high-level waste, resulting in only about 35% of the volume, mass and cost of disposal.
Comparing the economics of different forms of electricity generation
It is important to distinguish between the economics of nuclear plants already in operation and those at the planning stage. Once capital investment costs re effectively “sunk”, existing plants operate at very low costs and are effectively “cash machines”. Their operations and maintenance (O&M) and fuel costs (including used fuel management) are, along with hydropower plants, at the low end of the spectrum and make them very suitable as base-load power suppliers. This is irrespective of whether the investment costs are amortized or depreciated in corporate financial accounts – assuming the forward or marginal costs of operation are below the power price, the plant will operate.
US figures for 2008 published by NEI show the general picture, with nuclear generating power at 1.87 c/kW.
Note: the above data refer to fuel plus operation and maintenance costs only, they exclude capital, since this varies greatly among utilities and states,
as well as with the age of the plant.
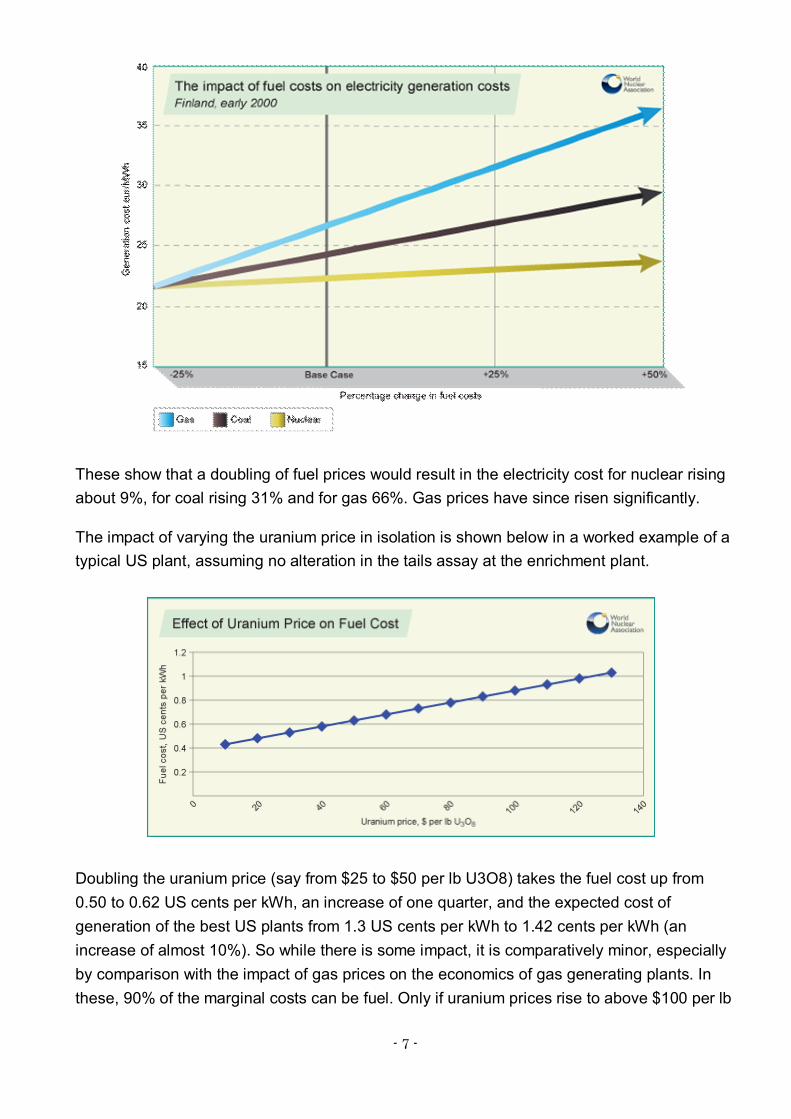
A Finnish study in 2000 also quantified fuel price sensitivity to electricity costs:
- 7 -
These show that a doubling of fuel prices would result in the electricity cost for nuclear rising about 9%, for coal rising 31% and for gas 66%. Gas prices have since risen significantly.
The impact of varying the uranium price in isolation is shown below in a worked example of a typical US plant, assuming no alteration in the tails assay at the enrichment plant.
Doubling the uranium price (say from $25 to $50 per lb U3O8) takes the fuel cost up from 0.50 to 0.62 US cents per kWh, an increase of one quarter, and the expected cost of generation of the best US plants from 1.3 US cents per kWh to 1.42 cents per kWh (an increase of almost 10%). So while there is some impact, it is comparatively minor, especially by comparison with the impact of gas prices on the economics of gas generating plants. In these, 90% of the marginal costs can be fuel. Only if uranium prices rise to above $100 per lb
- 8 -
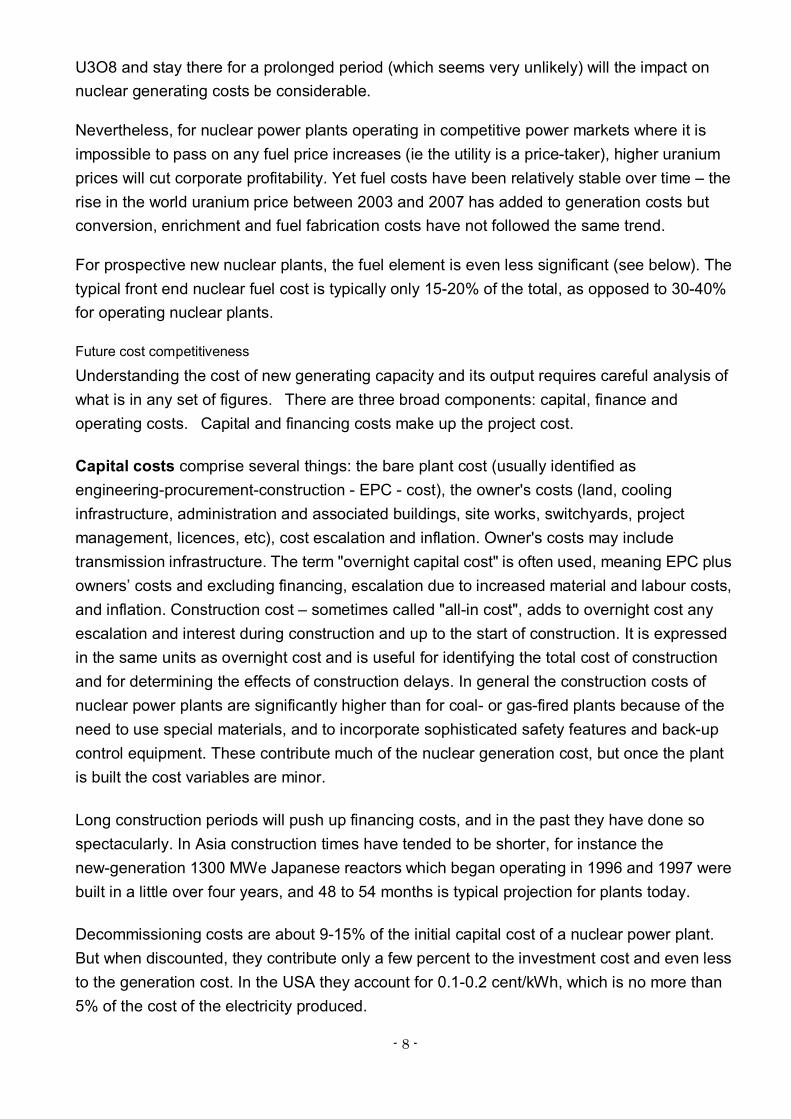
U3O8 and stay there for a prolonged period (which seems very unlikely) will the impact on nuclear generating costs be considerable.
Nevertheless, for nuclear power plants operating in competitive power markets where it is impossible to pass on any fuel price increases (ie the utility is a price-taker), higher uranium prices will cut corporate profitability. Yet fuel costs have been relatively stable over time – the rise in the world uranium price between 2003 and 2007 has added to generation costs but conversion, enrichment and fuel fabrication costs have not followed the same trend.
For prospective new nuclear plants, the fuel element is even less significant (see below). The typical front end nuclear fuel cost is typically only 15-20% of the total, as opposed to 30-40% for operating nuclear plants.
Future cost competitiveness
Understanding the cost of new generating capacity and its output requires careful analysis of what is in any set of figures. There are three broad components: capital, finance and operating costs. Capital and financing costs make up the project cost.
Capital costs comprise several things: the bare plant cost (usually identified as engineering-procurement-construction - EPC - cost), the owner's costs (land, cooling infrastructure, administration and associated buildings, site works, switchyards, project management, licences, etc), cost escalation and inflation. Owner's costs may include transmission infrastructure. The term "overnight capital cost" is often used, meaning EPC plus owners’ costs and excluding financing, escalation due to increased material and labour costs, and inflation. Construction cost – sometimes called "all-in cost", adds to overnight cost any escalation and interest during construction and up to the start of construction. It is expressed in the same units as overnight cost and is useful for identifying the total cost of construction and for determining the effects of construction delays. In general the construction costs of nuclear power plants are significantly higher than for coal- or gas-fired plants because of the need to use special materials, and to incorporate sophisticated safety features and back-up control equipment. These contribute much of the nuclear generation cost, but once the plant is built the cost variables are minor.
Long construction periods will push up financing costs, and in the past they have done so spectacularly. In Asia construction times have tended to be shorter, for instance the new-generation 1300 MWe Japanese reactors which began operating in 1996 and 1997 were built in a little over four years, and 48 to 54 months is typical projection for plants today.
Decommissioning costs are about 9-15% of the initial capital cost of a nuclear power plant. But when discounted, they contribute only a few percent to the investment cost and even less to the generation cost. In the USA they account for 0.1-0.2 cent/kWh, which is no more than 5% of the cost of the electricity produced.
- 9 -
Financing costs will depend on the rate of interest on debt, the debt-equity ratio, and if it is regulated, how the capital costs are recovered. There must also be an allowance for a rate of return on equity, which is risk capital.
Operating costs include operating and maintenance (O&M) plus fuel. Fuel cost figures include used fuel management and final waste disposal. These costs, while usually external for other technologies, are internal for nuclear power (ie they have to be paid or set aside securely by the utility generating the power, and the cost passed on to the customer in the actual tariff).
This “back-end” of the fuel cycle, including used fuel storage or disposal in a waste repository, contributes up to 10% of the overall costs per kWh, - rather less if there is direct disposal of used fuel rather than reprocessing. The $26 billion US used fuel program is funded by a 0.1 cent/kWh levy.
Calculations of relative generating costs are made using levelised costs, meaning average costs of producing electricity including capital, finance, owner's costs on site, fuel and operation over a plant's lifetime, with provision for decommissioning and waste disposal.
It is important to note that capital cost figures quoted by reactor vendors, or which are general and not site-specific, will usually just be for EPC costs. This is because owner's costs will vary hugely, most of all according to whether a plant is Greenfield or at an established site, perhaps replacing an old plant.
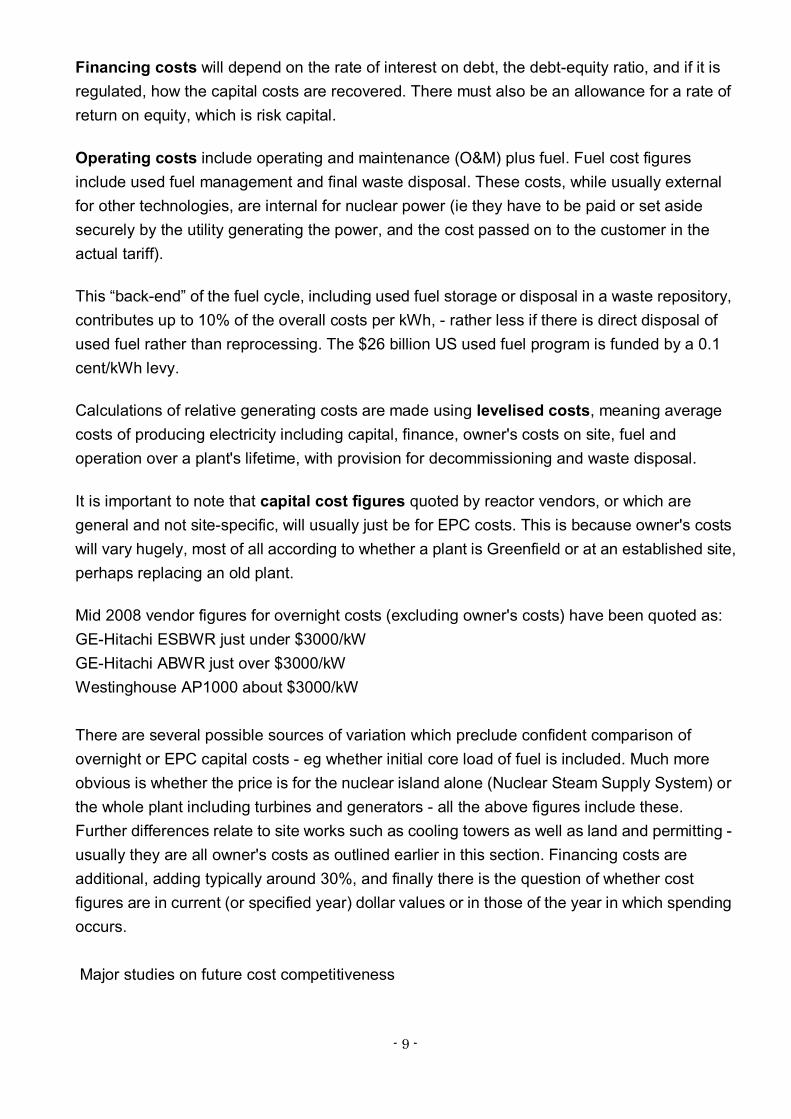
Mid 2008 vendor figures for overnight costs (excluding owner's costs) have been quoted as: GE-Hitachi ESBWR just under $3000/kW GE-Hitachi ABWR just over $3000/kW Westinghouse AP1000 about $3000/kW There are several possible sources of variation which preclude confident comparison of overnight or EPC capital costs - eg whether initial core load of fuel is included. Much more obvious is whether the price is for the nuclear island alone (Nuclear Steam Supply System) or the whole plant including turbines and generators - all the above figures include these. Further differences relate to site works such as cooling towers as well as land and permitting - usually they are all owner's costs as outlined earlier in this section. Financing costs are additional, adding typically around 30%, and finally there is the question of whether cost figures are in current (or specified year) dollar values or in those of the year in which spending occurs. Major studies on future cost competitiveness
- 10 -
There have been many studies carried out examining the economics of various future generation options, and the following are merely the most important and also focus on the nuclear element.
A 2010 OECD study Projected Costs of generating Electricity compared 2009 data for generating base-load electricity by 2015 as well as costs of power from renewables, and showed that nuclear power was very competitive at $30 per tonne CO2 cost and low discount rate. The study comprised data for 190 power plants from 17 OECD countries as well as some data from Brazil, China, Russia and South Africa. It used levelised lifetime costs with carbon price internalised (OECD only) and discounted cash flow at 5% and 10%, as previously. The precise competitiveness of different base-load technologies depended very much on local circumstances and the costs of financing and fuels.
Nuclear overnight capital costs in OECD ranged from US$ 1556/kW for APR-1400 in South Korea through $3009 for ABWR in Japan, $3382/kW for Gen III+ in USA, $3860 for EPR at Flamanville in France to $5863/kW for EPR in Switzerland, with world median $4100/kW. Belgium, Netherlands, Czech Rep and Hungary were all over $5000/kW. In China overnight costs were $1748/kW for CPR-1000 and $2302/kW for AP1000, and in Russia $2933/kW for VVER-1150. EPRI (USA) gave $2970/kW for APWR or ABWR, Eurelectric gave $4724/kW for EPR. OECD black coal plants were costed at $807-2719/kW, those with carbon capture and compression (tabulated as CCS, but the cost not including storage) at $3223-5811/kW, brown coal $1802-3485, gas plants $635-1747/kW and onshore wind capacity $1821-3716/kW. (Overnight costs were defined here as EPC, owner's costs and contingency, but excluding interest during construction.)
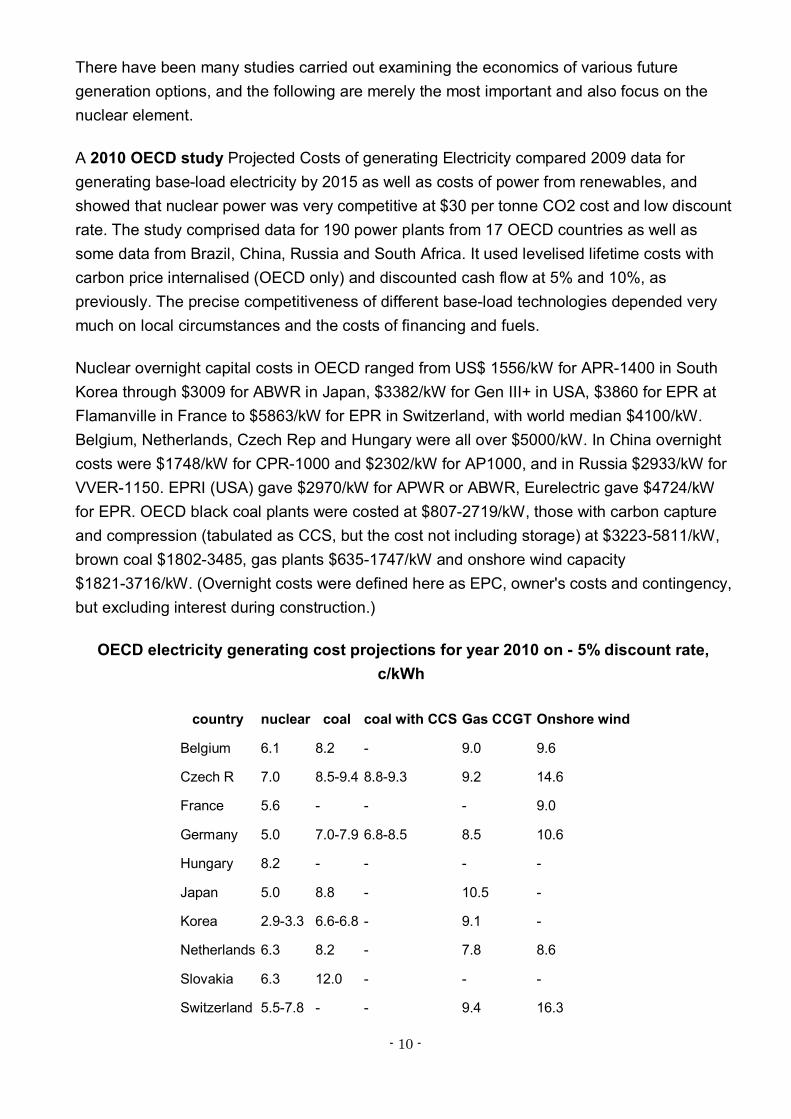
OECD electricity generating cost projections for year 2010 on - 5% discount rate, c/kWh
country nuclear coal coal with CCS Gas CCGT Onshore wind
Belgium 6.1 8.2 - 9.0 9.6
Czech R 7.0 8.5-9.4 8.8-9.3 9.2 14.6
France 5.6 - - - 9.0
Germany 5.0 7.0-7.9 6.8-8.5 8.5 10.6
Hungary 8.2 - - - -
Japan 5.0 8.8 - 10.5 -
Korea 2.9-3.3 6.6-6.8 - 9.1 -
Netherlands 6.3 8.2 - 7.8 8.6
Slovakia 6.3 12.0 - - -
Switzerland 5.5-7.8 - - 9.4 16.3

- 11 -
USA 4.9 7.2-7.5 6.8 7.7 4.8
China* 3.0-3.6 5.5 - 4.9 5.1-8.9
Russia* 4.3 7.5 8.7 7.1 6.3
EPRI (USA) 4.8 7.2 - 7.9 6.2
Eurelectric 6.0 6.3-7.4 7.5 8.6 11.3
* For China and Russia: 2.5c is added to coal and 1.3c to gas as carbon emission cost to enable sensible comparison with other data in those
fuel/technology categories, though within those countries coal and gas will in fact be cheaper than the Table above suggests.
Source: OECD/IEA NEA 2010, table 4.1.
At 5% discount rate comparative costs are as shown above. Nuclear is comfortably cheaper than coal and gas in all countries. At 10% discount rate (below) nuclear is still cheaper than coal in all but the Eurelectric estimate and three EU countries, but in these three gas becomes cheaper still. Coal with carbon capture is mostly more expensive than either nuclear or paying the $30 per tonne for CO2 emissions, though the report points out "great uncertainties" in the cost of projected CCS. Also, investment cost becomes a much greater proportion of power cost than with 5% discount rate.
OECD electricity generating cost projections for year 2010 on - 10% discount rate, c/kWh
country nuclear coal coal with CCS Gas CCGT Onshore wind
Belgium 10.9 10.0 - 9.3-9.9 13.6
Czech R 11.5 11.4-13.3 13.6-14.1 10.4 21.9
France 9.2 - - - 12.2
Germany 8.3 8.7-9.4 9.5-11.0 9.3 14.3
Hungary 12.2 - - - -
Japan 7.6 10.7 - 12.0 -
Korea 4.2-4.8 7.1-7.4 - 9.5 -
Netherlands 10.5 10.0 - 8.2 12.2
Slovakia 9.8 14.2 - - -
Switzerland 9.0-13.6 - - 10.5 23.4
USA 7.7 8.8-9.3 9.4 8.3 7.0
China* 4.4-5.5 5.8 - 5.2 7.2-12.6
Russia* 6.8 9.0 11.8 7.8 9.0

- 12 -
EPRI (USA) 7.3 8.8 - 8.3 9.1
Eurelectric 10.6 8.0-9.0 10.2 9.4 15.5
* For China and Russia: 2.5c is added to coal and 1.3c to gas as carbon emission cost to enable sensible comparison with other data in those
fuel/technology categories, though within those countries coal and gas will in fact be cheaper than the Table above suggests.
Source: OECD/IEA NEA 2010, table 4.1.
A 2004 report from the University of Chicago, funded by the US Department of Energy, compared the levelised power costs of future nuclear, coal, and gas-fired power generation in the USA. Various nuclear options were covered, and for an initial ABWR or AP1000 they range from 4.3 to 5.0 c/kWh on the basis of overnight capital costs of $1200 to $1500/kW, 60 year plant life, 5 year construction and 90% capacity. Coal gives 3.5 - 4.1 c/kWh and gas (CCGT) 3.5 - 4.5 c/kWh, depending greatly on fuel price.
The levelised nuclear power cost figures include up to 29% of the overnight capital cost as interest, and the report notes that up to another 24% of the overnight capital cost needs to be added for the initial unit of a first-of-a-kind advanced design such as the AP1000, defining the high end of the range above. For more advanced plants such as the EPR or SWR1000, overnight capital cost of $1800/kW is assumed and power costs are projected beyond the range above. However, considering a series of eight units of the same kind and assuming increased efficiency due to experience which lowers overnight capital cost, the levelised power costs drop 20% from those quoted above and where first-of-a-kind engineering costs are amortised (eg the $1500/kW case above), they drop 32%, making them competitive at about 3.4 c/kWh.
Nuclear plant: projected electrcity costs (c/kWh)
Overnight capital cost $/kW 1200 1500 1800
First unit 7 yr build, 40 yr life 5.3 6.2 7.1
5 yr build, 60 yr life 4.3 5.0 5.8
4th unit 7 yr build, 40 yr life 4.5 4.5 5.3
5 yr build, 60 yr life * 3.7 3.7 4.3
8th unit 7 yr build, 40 yr life 4.2 4.2 4.9
5 yr build, 60 yr life * 3.4 3.4 4.0
* calculated from above data

- 13 -
The study also shows that with a minimal carbon control cost impact of 1.5 c/kWh for coal and 1.0 c/kWh for gas superimposed on the above figures, nuclear is even more competitive. But more importantly it goes on to explore other policy options which would offset investment risks and compensate for first-of-a-kind engineering costs to encourage new nuclear investment, including investment tax breaks, and production tax credits phasing out after 8 years. (US wind energy gets a production tax credit which has risen to 2.1 c/kWh.)
In May 2009 an update of a heavily-referenced 2003 MIT study was published. This said that "since 2003 construction costs for all types of large-scale engineered projects have escalated dramatically. The estimated cost of constructing a nuclear power plant has increased at a rate of 15% per year heading into the current economic downturn. This is based both on the cost of actual builds in Japan and Korea and on the projected cost of new plants planned for in the United States. Capital costs for both coal and natural gas have increased as well, although not by as much. The cost of natural gas and coal that peaked sharply is now receding. Taken together, these escalating costs leave the situation [of relative costs] close to where it was in 2003." The overnight capital cost was given as $4000/kW, in 2007 dollars. Applying the same cost of capital to nuclear as to coal and gas, nuclear came out at 6.6 c/kWh, coal at 8.3 cents and gas at 7.4 cents, assuming a charge of $25/tonne CO2 on the latter.
The French Energy & Climate Directorate published in November 2008 an update of its earlier regular studies on relative electricity generating costs. This shied away from cash figures to a large extent due to rapid changes in both fuel and capital, but showed that at anything over 6000 hours production per year (68% capacity factor), nuclear was cheaper than coal or gas combined cycle (CCG). At 100% capacity CCG was 25% more expensive than nuclear. At less than 4700 hours per year CCG was cheapest, all without taking CO2 cost into account.
With the nuclear plant fixed costs were almost 75% of the total, with CCG they were less than 25% including allowance for CO2 at $20/t. Other assumptions were 8% discount rate, gas at 6.85 $/GJ, coal at EUR 60/t. The reference nuclear unit is the EPR of 1630 MWe net, sited on the coast, assuming all development costs being borne by Flamanville 3, coming on line in 2020 and operating only 40 of its planned 60 years. Capital cost apparently EUR 2000/kW. Capacity factor 91%, fuel enrichment is 5%, burnup 60 GWd/t and used fuel is reprocessed with MOX recycle. In looking at overall fuel cost, uranium at $52/lb made up about 45% of it, and even though 3% discount rate was used for back-end the study confirmed the very low cost of waste in the total - about 13% of fuel cost, mostly for reprocessing.
At the end of 2008 EdF updated the overnight cost estimate for Flamanville 3 EPR (the first French EPR, but with some supply contracts locked in before escalation) to EUR 4 billion in 2008 Euros (EUR 2434/kW), and electricity cost 5.4 cents/kWh (compared with 6.8 c/kWh for
- 14 -
CCGT and 7.0 c/kWh for coal, "with lowest assumptions" for CO2 cost). These costs were confirmed in mid 2009, when EdF had spent nearly EUR 2 billion. A second unit would be more expensive, and would deliver power at 5.5 to 6.0 cents/kWh.
A detailed study of energy economics in Finland published in mid 2000 was important in making the strong case for additional nuclear construction there, showing that nuclear energy would be the least-cost option for new generating capacity. The study compared nuclear, coal, gas turbine combined cycle and peat. Nuclear has very much higher capital costs than the others --EUR 1749/kW including initial fuel load, which is about three times the cost of the gas plant. But its fuel costs are much lower, and so at capacity factors above 64% it is the cheapest option.
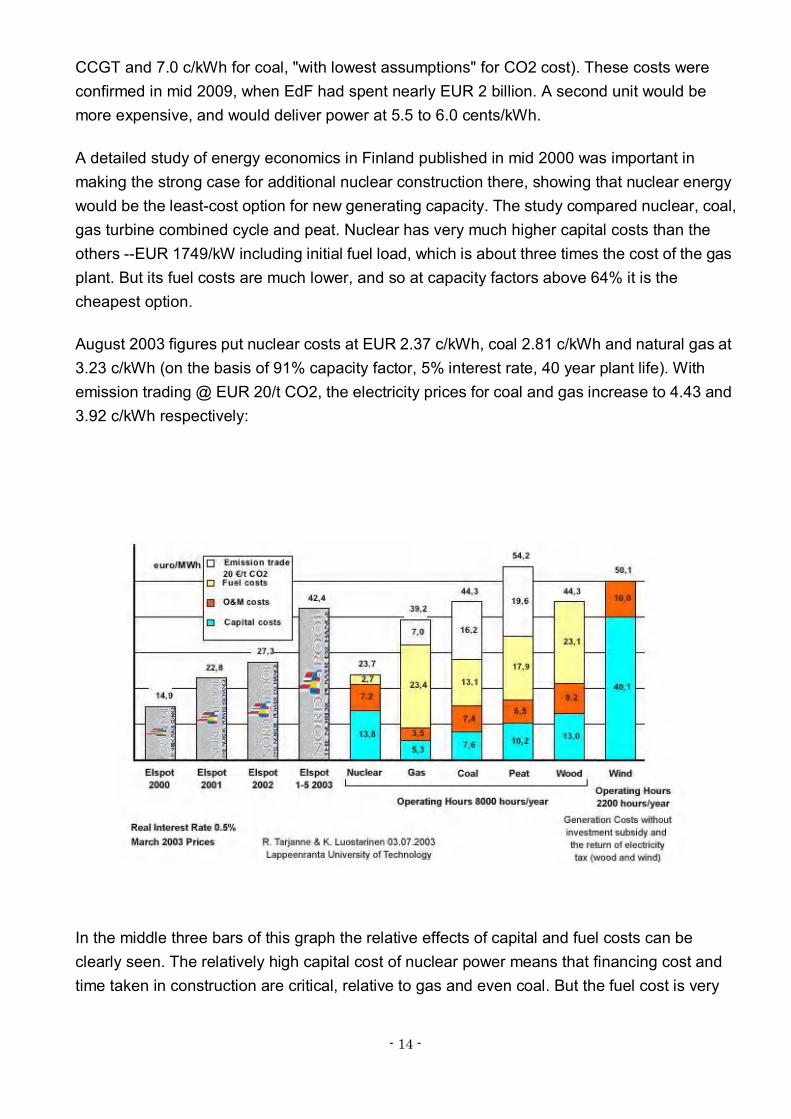
August 2003 figures put nuclear costs at EUR 2.37 c/kWh, coal 2.81 c/kWh and natural gas at 3.23 c/kWh (on the basis of 91% capacity factor, 5% interest rate, 40 year plant life). With emission trading @ EUR 20/t CO2, the electricity prices for coal and gas increase to 4.43 and 3.92 c/kWh respectively:
In the middle three bars of this graph the relative effects of capital and fuel costs can be clearly seen. The relatively high capital cost of nuclear power means that financing cost and time taken in construction are critical, relative to gas and even coal. But the fuel cost is very
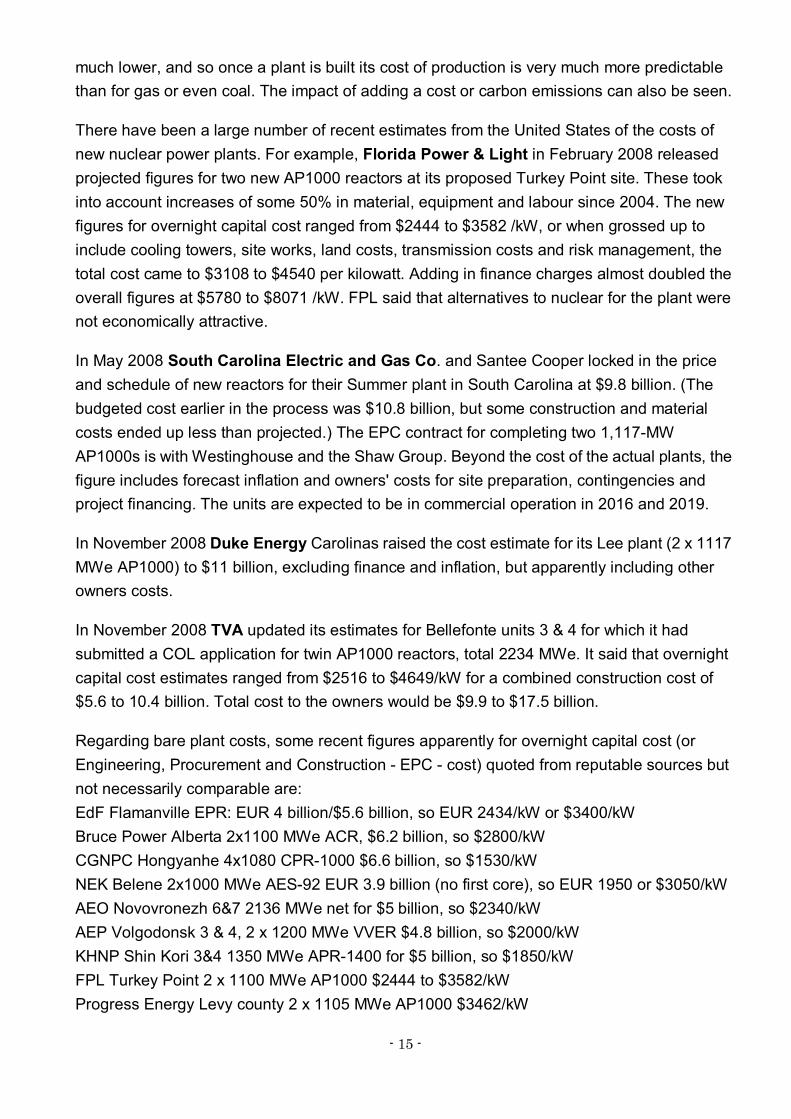
- 15 -
much lower, and so once a plant is built its cost of production is very much more predictable than for gas or even coal. The impact of adding a cost or carbon emissions can also be seen.
There have been a large number of recent estimates from the United States of the costs of new nuclear power plants. For example, Florida Power & Light in February 2008 released projected figures for two new AP1000 reactors at its proposed Turkey Point site. These took into account increases of some 50% in material, equipment and labour since 2004. The new figures for overnight capital cost ranged from $2444 to $3582 /kW, or when grossed up to include cooling towers, site works, land costs, transmission costs and risk management, the total cost came to $3108 to $4540 per kilowatt. Adding in finance charges almost doubled the overall figures at $5780 to $8071 /kW. FPL said that alternatives to nuclear for the plant were not economically attractive.
In May 2008 South Carolina Electric and Gas Co. and Santee Cooper locked in the price and schedule of new reactors for their Summer plant in South Carolina at $9.8 billion. (The budgeted cost earlier in the process was $10.8 billion, but some construction and material costs ended up less than projected.) The EPC contract for completing two 1,117-MW AP1000s is with Westinghouse and the Shaw Group. Beyond the cost of the actual plants, the figure includes forecast inflation and owners' costs for site preparation, contingencies and project financing. The units are expected to be in commercial operation in 2016 and 2019.
In November 2008 Duke Energy Carolinas raised the cost estimate for its Lee plant (2 x 1117 MWe AP1000) to $11 billion, excluding finance and inflation, but apparently including other owners costs.
In November 2008 TVA updated its estimates for Bellefonte units 3 & 4 for which it had submitted a COL application for twin AP1000 reactors, total 2234 MWe. It said that overnight capital cost estimates ranged from $2516 to $4649/kW for a combined construction cost of $5.6 to 10.4 billion. Total cost to the owners would be $9.9 to $17.5 billion.
Regarding bare plant costs, some recent figures apparently for overnight capital cost (or Engineering, Procurement and Construction - EPC - cost) quoted from reputable sources but not necessarily comparable are: EdF Flamanville EPR: EUR 4 billion/$5.6 billion, so EUR 2434/kW or $3400/kW Bruce Power Alberta 2x1100 MWe ACR, $6.2 billion, so $2800/kW CGNPC Hongyanhe 4x1080 CPR-1000 $6.6 billion, so $1530/kW NEK Belene 2x1000 MWe AES-92 EUR 3.9 billion (no first core), so EUR 1950 or $3050/kW AEO Novovronezh 6&7 2136 MWe net for $5 billion, so $2340/kW AEP Volgodonsk 3 & 4, 2 x 1200 MWe VVER $4.8 billion, so $2000/kW KHNP Shin Kori 3&4 1350 MWe APR-1400 for $5 billion, so $1850/kW FPL Turkey Point 2 x 1100 MWe AP1000 $2444 to $3582/kW Progress Energy Levy county 2 x 1105 MWe AP1000 $3462/kW

- 16 -
NRG South Texas 2 x 1350 MWe ABWR $8 billion, so $2900/kW ENEC for UAE from Kepco, 4 x 1400 MWe APR-1400 $20.4 billion, so $3643/kW
A striking indication of the impact of financing costs is given by Georgia Power, which said in mid 2008 that twin 1100 MWe AP1000 reactors would cost $9.6 billion if they could be financed progressively by ratepayers, or $14 billion if not. This gives $4363 or $6360 per kilowatt including all other owners costs.
Finally, in the USA the question of whether a project is subject to regulated cost recovery or is a merchant plant is relevant, since it introduces political, financial and tactical factors. If the new build cost escalates (or is inflated), some cost recovery may be possible through higher rates can be charged by the utility if those costs are deemed prudent by the relevant regulator. By way of contrast, a merchant plant has to sell all its power competitively, so must convince its shareholders that it has a good economic case for moving forward with a new nuclear unit.
External costs The report of a major European study of the external costs of various fuel cycles, focusing on coal and nuclear, was released in mid 2001 - ExternE. It shows that in clear cash terms nuclear energy incurs about one tenth of the costs of coal. The external costs are defined as those actually incurred in relation to health and the environment and quantifiable but not built into the cost of the electricity. If these costs were in fact included, the EU price of electricity from coal would double and that from gas would increase 30%. These are without attempting to include the external costs of global warming.
The European Commission launched the project in 1991 in collaboration with the US Department of Energy, and it was the first research project of its kind "to put plausible financial figures against damage resulting from different forms of electricity production for the entire EU". The methodology considers emissions, dispersion and ultimate impact. With nuclear energy the risk of accidents is factored in along with high estimates of radiological impacts from mine tailings (waste management and decommissioning being already within the cost to the consumer). Nuclear energy averages 0.4 euro cents/kWh, much the same as hydro, coal is over 4.0 cents (4.1-7.3), gas ranges 1.3-2.3 cents and only wind shows up better than nuclear, at 0.1-0.2 cents/kWh average. NB these are the external costs only.
Sources: OECD/ IEA NEA 2010, Projected Costs of Generating Electricity. OECD, 1994, The Economics of the Nuclear Fuel Cycle. NEI: US generating cost data. Tarjanne, R & Rissanen, S, 2000, Nuclear Power: Lest-cost option for baseload electricity in Finland; in Proceedings 25th International Symposium, Uranium Institute. Gutierrez, J 2003, Nuclear Fuel - key for the competitiveness of nuclear energy in Spain,
- 17 -
WNA Symposium. University of Chicago, August 2004, The Economic Future of Nuclear Power. Nuclear Energy Institute, August 2008, The cost of new generating capacity in perspective. Direction Générale de l'Energie et du Climat, 2008, Synthèse publique de l'étude des coûts de référence de la production électrique ExternE web site