Embed Size (px)
Citation preview
© NERC All rights reserved
Soil uranium, soil gas radon and indoor radon empirical relationships in the UK and other
European countries
Don Appleton (BGS) and Jon Miles (HPA)

© NERC All rights reserved
EUROPEAN GEOGENIC RADON POTENTIAL MAP
• Wide range of numerical (quantitative) data types: indoor radon, soil gas radon, U in soil (measured and estimated from airborne or ground gamma spectrometry), U in rock; U in sediment.
• European radon potential classification based on combining layers of available input variables requires an understanding of the empirical relationships between indoor radon (main hazard to human health) and other numerical data types.
• European radon potential classification will also have to deal with categorical (qualitative) data (e.g. rock type and structural features, such as faults) but this is outside scope of this presentation.
© NERC All rights reserved
DATA
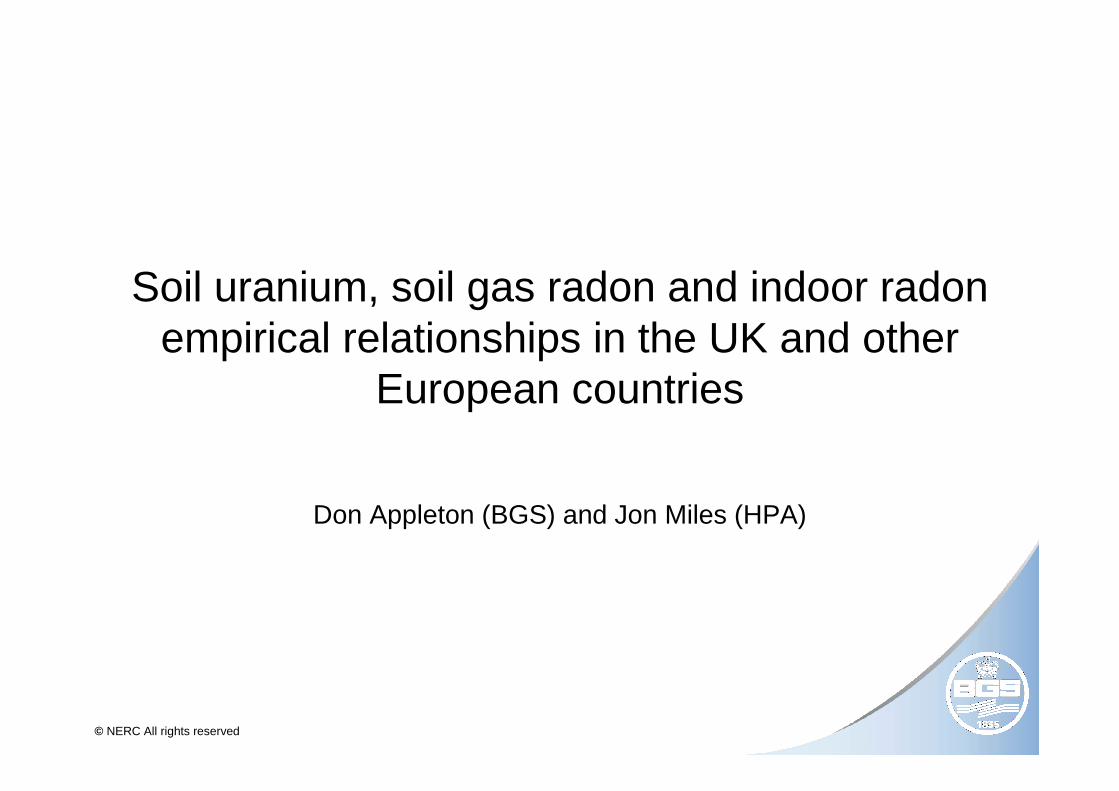
• Estimated U in <2mm topsoil derived from estimated U (eU) from airborne gamma spectrometry [Estimated <2mm soil U = 1.7216 * HiRES eU mg/kg)]
• U in topsoil (5-20 cm depth) soil geochemical samples (<2mm fraction); potentially better correlation with airborne gamma spectrometry data than subsurface (20-50 cm soil U data)
• Radon concentrations in soil gas• Radon concentrations in homes
Data grouped by geological unit and sub-area (usually 1-km or 5-km grid square)
© NERC All rights reserved
REGRESSION ANALYSIS
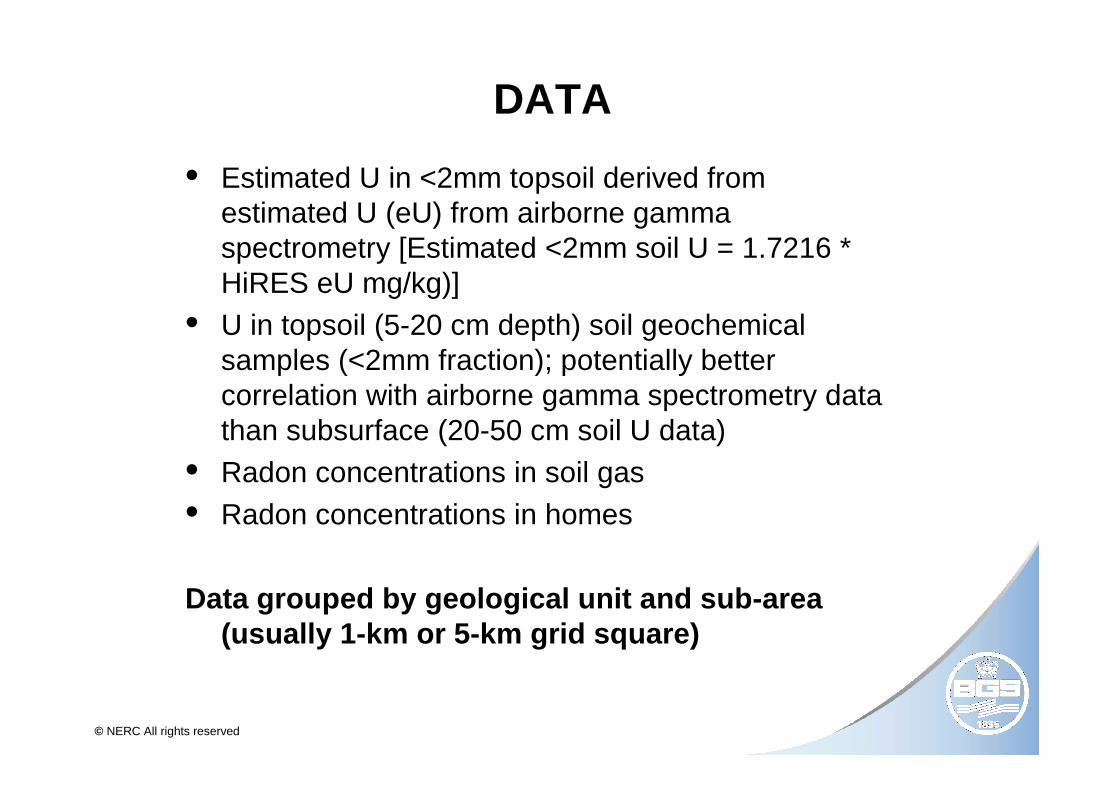
• Spatially and geologically grouped data should be approximately normally distributed to give most robust central estimate for least squares linear regression analysis
• Anderson-Darling normality tests indicate regression modelling should be based on:
1. Arithmetic means of airborne eU and soil U data2. Geometric means of lognormally distributed soil gas
and indoor radon data
• LS regression analysis results have limitations related to uncertainties of x and y axis data AND outliers

© NERC All rights reserved
MODELS BASED ON AIRBORNE GAMMA
SPECTROMETRY DATA
Estimated U in <2mm topsoil derived from estimated U (eU) from HiRES airborne gamma spectrometry [Estimated <2mm soil U = 1.7216 * HiRES eU mg/kg)]
© NERC All rights reserved
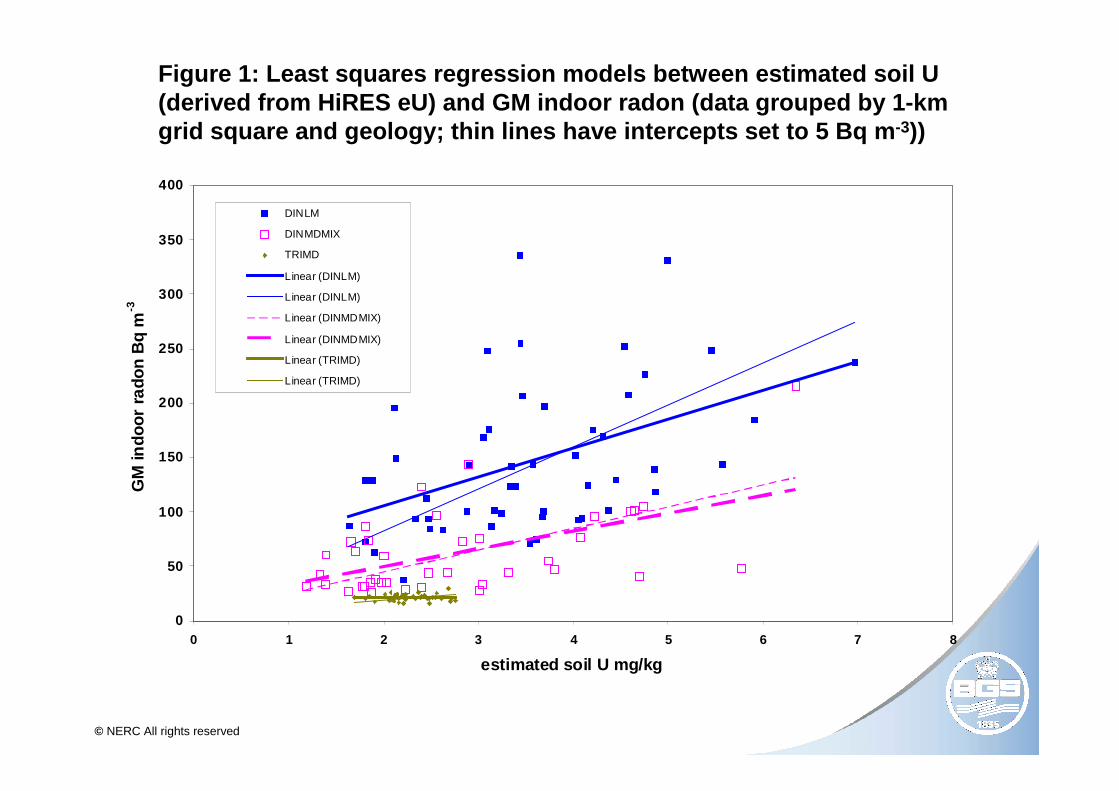
Figure 1: Least squares regression models between e stimated soil U (derived from HiRES eU) and GM indoor radon (data g rouped by 1-km grid square and geology; thin lines have intercepts set to 5 Bq m -3))
0
50
100
150
200
250
300
350
400
0 1 2 3 4 5 6 7 8
estimated soil U mg/kg
GM
indo
or ra
don
Bq
m-3
DINLM
DINMDMIX
TRIMD
Linear (DINLM)
Linear (DINLM)
Linear (DINMDMIX)
Linear (DINMDMIX)
Linear (TRIMD)
Linear (TRIMD)

© NERC All rights reserved
INTERCEPTS
• High positive intercepts on y axis of least squares (LS) linear regression models probably due to uncertainties of indoor radon, soil gas radon and soil U data
• UNSCEAR (1993) estimated world mean outdoor radon (10 Bq m-3) and indoor contribution from building materials (6 Bq m-3)
• UNSCEAR intercept of 16 Bq m-3 inappropriate for UK where a value of 5 Bq m-3 is the best estimate for combined indoor contribution from outdoor radon and UK building materials
• LS regression models for UK data therefore forced to intercept y-axis at 5 Bq m-3 (thin regression lines in previous slide)

© NERC All rights reserved
Figure 2: Least squares regression models between estimated soil U (derived from HiRES eU) and GM indoor radon (data grouped by 1-km grid square and geology) compared with data for Oslofjord region and N. Ireland
0
50
100
150
200
250
300
0 1 2 3 4 5 6 7 8
estimated U mg/kg in topsoil
GM
indo
or r
adon
Bq
m-3
DINLM
DINMDMIX
TRIMD
N. Ireland
Oslofjord
Linear (DINLM)
Linear (DINMDMIX)
Linear (TRIMD)
Linear (N. Ireland)
Linear (Oslofjord)

© NERC All rights reserved
MODELS BASED ON SOIL CHEMISTRY DATA
U (mg/kg) in <2mm fraction of topsoil determined by XRF

© NERC All rights reserved
Figure 3: Least squares regression models between U in <2mm fraction of topsoils and GM indoor radon (data grouped by 5-km grid square and geology; dashed lines have intercepts set to 5 Bq m-3)
0
50
100
150
200
250
0 1 2 3 4 5
U mg/kg
GM
indo
or r
adon
(Bq
m-3
)
DINLM
INOLMST
INONS
WESMDMIX
Linear (DINLM)
Linear (DINLM)
Linear (INOLMST)
Linear (INONS)
Linear (INONS)
Linear (WESMDMIX)

© NERC All rights reserved
MODELS BASED ON SOIL GAS RADON DATA
Geometric mean of soil gas radon concentrations (Bq/L) grouped by geology and grid square

© NERC All rights reserved
Figure 4: GM soil gas radon vs. GM indoor radon (data grouped by 1-km or 5-km grid square and geology)
0
50
100
150
200
250
300
350
0 50 100 150 200 250 300 350GM Soil gas radon (kBq/m3)
GM
Ind
oor
rado
n (B
q/m
3)
BGS Derby-Notts Carb-Perm1km grouping
BGS Derbyshire Carb Lmst1km grouping (2002-04 data)
BGS Derby-Notts Carb-Perm5km grouping
BGS INONS 1km grouping
BGS INONS 5km grouping
Linear (BGS Derby-NottsCarb-Perm 1km grouping)
Linear (BGS Derbyshire CarbLmst 1km grouping (2002-04data))
Linear (BGS Derby-NottsCarb-Perm 5km grouping)
Linear (BGS INONS 1kmgrouping)
Linear (BGS INONS 5kmgrouping)

© NERC All rights reserved
Figure 5: GM soil gas radon vs. GM indoor radon (data grouped by 1-km or 5-km grid square and geology; intercepts set at 5 Bq m-3)
0
50
100
150
200
250
300
350
400
0 50 100 150 200 250 300 350GM Soil gas radon (kBq/m3)
GM
Indo
or ra
don
(Bq/
m3)
BGS Derby-Notts Carb-Perm 1km grouping
BGS Derbyshire Carb Lmst 1km grouping(2002-04 data)
BGS Derby-Notts Carb-Perm 5km grouping
BGS INONS 1km grouping
BGS INONS 5km grouping
Linear (BGS Derby-Notts Carb-Perm 1kmgrouping)
Linear (BGS Derbyshire Carb Lmst 1kmgrouping (2002-04 data))
Linear (BGS Derby-Notts Carb-Perm 5kmgrouping)
Linear (BGS INONS 1km grouping)
Linear (BGS INONS 5km grouping)
© NERC All rights reserved
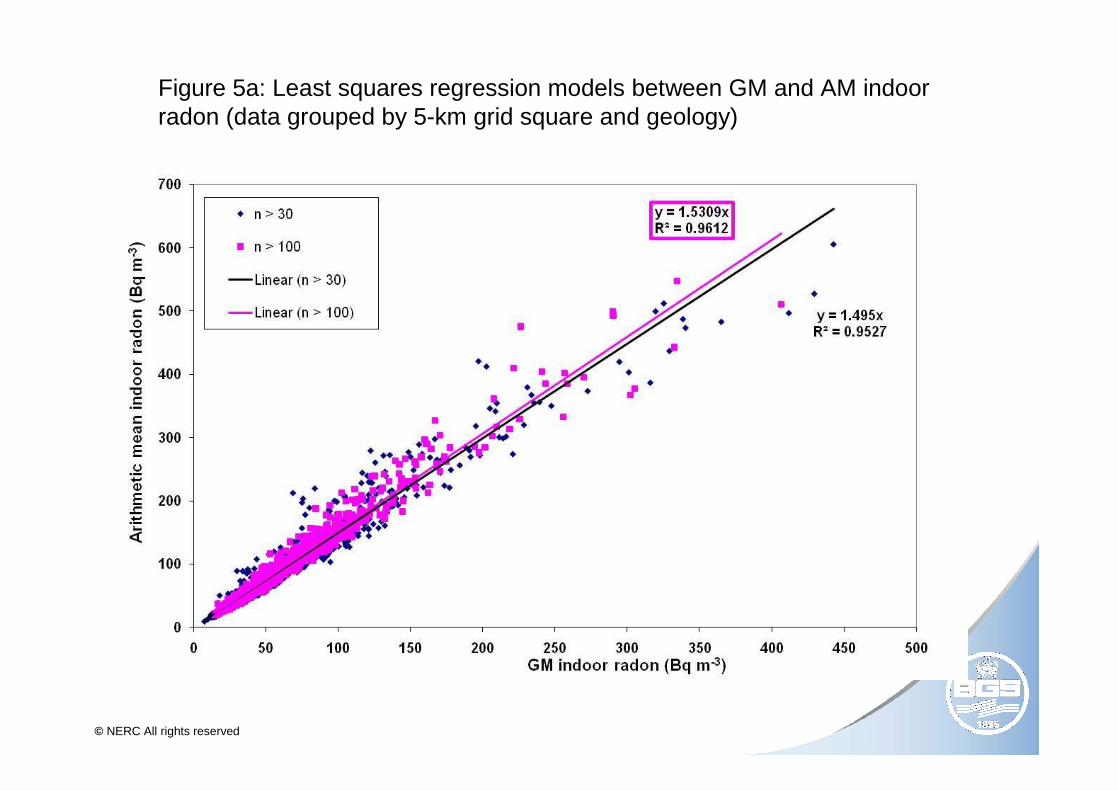
Figure 5a: Least squares regression models between GM and AM indoor radon (data grouped by 5-km grid square and geology)

© NERC All rights reserved
Figure 6: Soil gas radon vs. estimated arithmetic mean indoor radon linear regression models for England, Czech Republic and Germany
y = 5.878x + 49.615
y = 2.5749x + 18.229
y = 2.4124x + 87.677
y = 3.6932x + 104.97y = 1.5623x + 123.97
y = 0.9771x + 20.5
y = 0.2786x + 35.429
y = 4.9769x + 35.473
0
100
200
300
400
500
600
700
800
0 50 100 150 200 250 300 350Soil gas radon (kBq/m3)
Arit
hmet
ic a
vera
ge g
roun
dflo
or in
door
rad
on (
Bq/
m3)
Czech; Barnet et al 2008 Tab. 11-2 data
Czech Republic Barnet et al., 2002
Czech Republic: Barnet et al., 2004
BGS Derby-Notts Carb-Perm 1km grouping
BGS Derbyshire Carb Lmst 2002-2004
German NUTS5 units;Barnet et al 2006
Kemski et al., 2009
N. Bohemian Massif; Barnet et al., 2010
Linear (Czech; Barnet et al 2008 Tab. 11-2 data)
Linear (Czech Republic Barnet et al., 2002)
Linear (Czech Republic: Barnet et al., 2004)
Linear (BGS Derby-Notts Carb-Perm 1km grouping)
Linear (BGS Derbyshire Carb Lmst 2002-2004)
Linear (German NUTS5 units;Barnet et al 2006 )
Linear (Kemski et al., 2009)
Linear (N. Bohemian Massif; Barnet et al., 2010)

© NERC All rights reserved
Indoor radon: soil gas radon ratios•UK (GM) models similar to arithmetic mean SG Czech data
•Both significantly higher than German models based Maximum SG data
•Different house national and regional characteristics will also impact on IR/SG ratios
•Older buildings with ‘leaky’ floors are likely to have higher IR/SG ratios
•Příbram (Czech Rep) has higher IR/SG ratio than average; lower ratios for magmatic rocks, medium ratios for metamorphic, highest ratios for sedimentary rocks.
© NERC All rights reserved
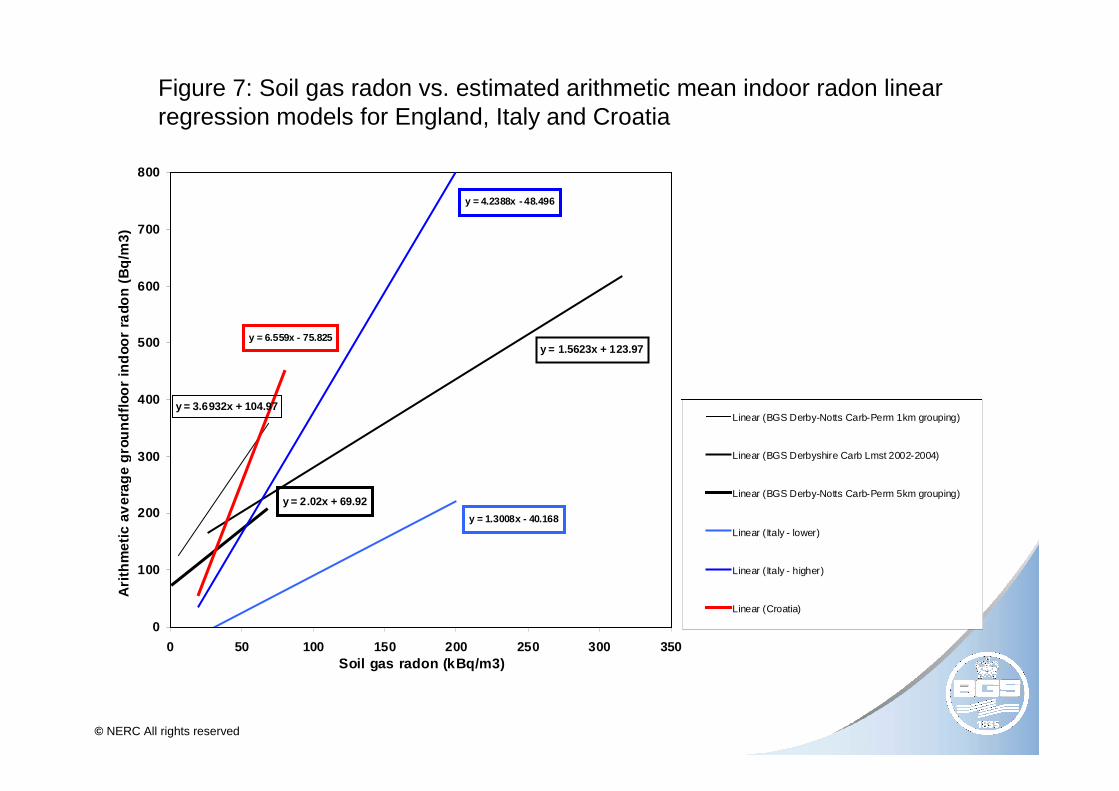
Figure 7: Soil gas radon vs. estimated arithmetic mean indoor radon linear regression models for England, Italy and Croatia
y = 3.6932x + 104.97
y = 1.5623x + 123.97
y = 2.02x + 69.92
y = 1.3008x - 40.168
y = 4.2388x - 48.496
y = 6.559x - 75.825
0
100
200
300
400
500
600
700
800
0 50 100 150 200 250 300 350Soil gas radon (kBq/m3)
Ari
thm
etic
ave
rage
gro
undf
loor
indo
or ra
don
(Bq/
m3)
BGS Derby-Notts Carb-Perm 1km grouping
BGS Derbyshire Carb Lmst 2002-2004
BGS Derby-Notts Carb-Perm 5km grouping
Italy - lower
Italy - higher
Croatia
Linear (BGS Derby-Notts Carb-Perm 1km grouping)
Linear (BGS Derbyshire Carb Lmst 2002-2004)
Linear (BGS Derby-Notts Carb-Perm 5km grouping)
Linear (Italy - lower)
Linear (Italy - higher)
Linear (Croatia)
© NERC All rights reserved
CONCLUSIONS• ASSUMPTIONS: linear relationship between surrogates for
source of radon (e.g. eU or U) and radon in homes• DATA DISTRIBUTIONS : eU and soil U normally
distributed (therefore use AM for modelling); soil gas and indoor radon log-normally distributed (use GM)
• MEASUREMENT UNCERTAINTIES: impact on slopes and intercepts of LS regression models; slopes generally steeper for fixed intercepts (5 Bq m-3 in UK)
• PERMEABILITY OF THE GROUND: Radon concentrations in houses generated from specific U or soil gas radon concentrations generally increase with the permeability of the ground
• GEOGENIC RADON MAP OF EUROPE: further research required to generate robust empirical relationships for the wide range of numerical input data types (and also for categorical data types).