Embed Size (px)
Citation preview

SOIL MECHANICS CIVIL ENGINEERING VIRTUAL LABORATORY
EXPERIMENT: 5 ATTERBERG LIMITS
INTRODUCTION:
The Atterberg limits are a basic measure of the nature of a fine-grained soil. Depending
on the water content of the soil, it may appear in four states: solid, semi-solid, plastic
and liquid. In each state the consistency and behavior of a soil is different and thus so
are its engineering properties. Thus, the boundary between each state can be defined
based on a change in the soil's behavior. The Atterberg limits can be used to distinguish
between silt and clay, and it can distinguish between different types of silts and clays.
These limits were created by Albert Atterberg, a Swedish chemist.[1] They were later
refined by Arthur Casagrande.
OBJECTIVE:
To determine the liquid and plastic limits of the given soil sample.
THEORY:
The definitions of the consistency limits proposed by Atterberg are not, by
themselves, adequate for the determination of their numerical values in the laboratory,
especially in view of the arbitrary nature of these definitions. In view of this, Arthur
Casagrade and others suggested more practical definitions with special reference to the
laboratory devices and methods developed for the purpose of the determination of the
consistency limits. In this sub-section, the laboratory methods for determination of the
liquid limit, plastic limit, shrinkage limit, and other related concepts and indices will be
studied, as standardized and accepted by the Indian Standard Institution and
incorporated in the codes or practice.

EXPERIMENT: 1 WATER CONTENT DETERMINATION SM-CEVL
2
Shrinkage limit:
The shrinkage limit (SL) is the water content where further loss of moisture will not
result in any more volume reduction. The shrinkage limit is much less commonly used
than the liquid limit and the plastic limit.
Plastic limit:
The plastic limit (PL) is the water content where soil starts to exhibit plastic behavior. A
thread of soil is at its plastic limit when it is rolled to a diameter of 3 mm or begins to
crumble. To improve consistency, a 3 mm diameter rod is often used to gauge the
thickness of the thread when conducting the test. (AKA Soil Snake Test).
Liquid limit:
„Liquid limit‟ (LL or ) is defined as the arbitrary limit of water content at which the soil
is just about to pass from the plastic state into the liquid state. At this limit, the soil
possesses a small value of shear strength, losing its ability to flow as a liquid.In other
words, the liquid limit is the minimum moisture content at which the soil tends to flow as
a liquid.
TERMS:
PLATICITY INDEX:
„Plasticity index‟ (PI or ) is the range of water content within which the soil exhibits
plastic properties; that is, it is the difference between liquid and plastic limits.
PI (or ) = (LL - PL) = ( )
When the plastic limit cannot be determined, the material is said to be non-plastic (NP).
Plasticity index for sands is zero.
For proper evaluation of the plasticity properties of a soil, it has been found desirable to
use both the liquid limit and the plasticity index values.

EXPERIMENT: 1 WATER CONTENT DETERMINATION SM-CEVL
3
SHRINKAGE INDEX:
„Shrinkage index‟ (SI OR ) is defined as the difference between the plastic and
shrinkage limits of a soil; in other words, it is the range of water content within which a
soil is in a semisolid state of consistency.
SI (or ) = (SL OR ) = ( )
CONSISTENCY INDEX:
„Consistency index‟ or „Relative consistency‟ (CI OR ) is defined as the ratio of the
difference between liquid limit and the natural water content to the plasticity index of a
soil:
CI OR = (LL - w) / PI = ( ) /
Where w = natural water content of the soil (water content of a soil in the undisturbed
condition in the ground).
If = 0, w = LL
= 1, w = PL
> 1, the soil is in semi-solid state and is stiff.
< 0, the natural water content is greater than LL, and the soil behaves like a liquid.
LIQUIDITY INDEX:
„Liquidity index (LI OR IL) or „Water-plasticity ratio‟ is the ratio of the difference between
the natural water content and the plastic limit to the plasticity index:
LI or ( ) = (w - PL) / PI or ( ) = ( w - /
If = 0, w = PL
= 1, w = LL
> 1, the soil is in liquid state.
< 0, the soil is in semi-solid state and is stiff.

EXPERIMENT: 1 WATER CONTENT DETERMINATION SM-CEVL
4
Obviously, CI + LI = 1
APPARATUS:
1. FOR LIQUID LIMIT DETERMINATION:
The apparatus required are the mechanical liquid limit device, grooving tool, porcelain
evaporating dish, flat glass plate, spatula, palette knives, balance, oven wash bottle with
distilled water and containers.
2. FOR PLASTIC LIMIT DETERMINATION:
The apparatus consists of a porcelain evaporating dish, about 12 cm in diameter (or a
flat glass plate, 10 mm thick and about 45 cm square), spatula, about 8 cm long and 2
cm wide (or palette knives, with the blade about 20 cm long and 3 cm wide, for use with
flat glass plate for mixing soil and water), a ground-glass plate, about 20×15 cm, for a
surface for rolling, balance, oven, containers, and a rod, 3 mm in diameter and about 10
cm long.
STANDARD REFERENCE:
FOR LIQUID LIMIT:
The liquid limit is determined in the laboratory with the aid of the standard mechanical
liquid limit device, designed by Arthur Casagrande and adopted by the ISI, as given in
IS:2720(Part V)–1985.
FOR PLASTIC LIMIT:
IS: 2720, Part V–1985.

EXPERIMENT: 1 WATER CONTENT DETERMINATION SM-CEVL
5
FIGURES:-

EXPERIMENT: 1 WATER CONTENT DETERMINATION SM-CEVL
6
TEST PROCEDURE:-
Liquid Limit:
1. Take roughly 3/4 of the soil and place it into the porcelain dish. Assume that the
soil was previously passed though a No. 40 sieve, air-dried, and then pulverized.
Thoroughly mix the soil with a small amount of distilled water until it appears as a
smooth uniform paste. Cover the dish with cellophane to prevent moisture from
escaping.
2. Weigh four of the empty moisture cans with their lids, and record the respective
weights and can numbers on the data sheet.
3. Adjust the liquid limit apparatus by checking the height of drop of the cup. The
point on the cup that comes in contact with the base should rise to a height of 10
mm. The block on the end of the grooving tool is 10 mm high and should be
used as a gage. Practice using the cup and determine the correct rate to rotate
the crank so that the cup drops approximately two times per second.
4. Place a portion of the previously mixed soil into the cup of the liquid limit
apparatus at the point where the cup rests on the base. Squeeze the soil down
to eliminate air pockets and spread it into the cup to a depth of about 10 mm at
EXPERIMENT: 1 WATER CONTENT DETERMINATION SM-CEVL
7
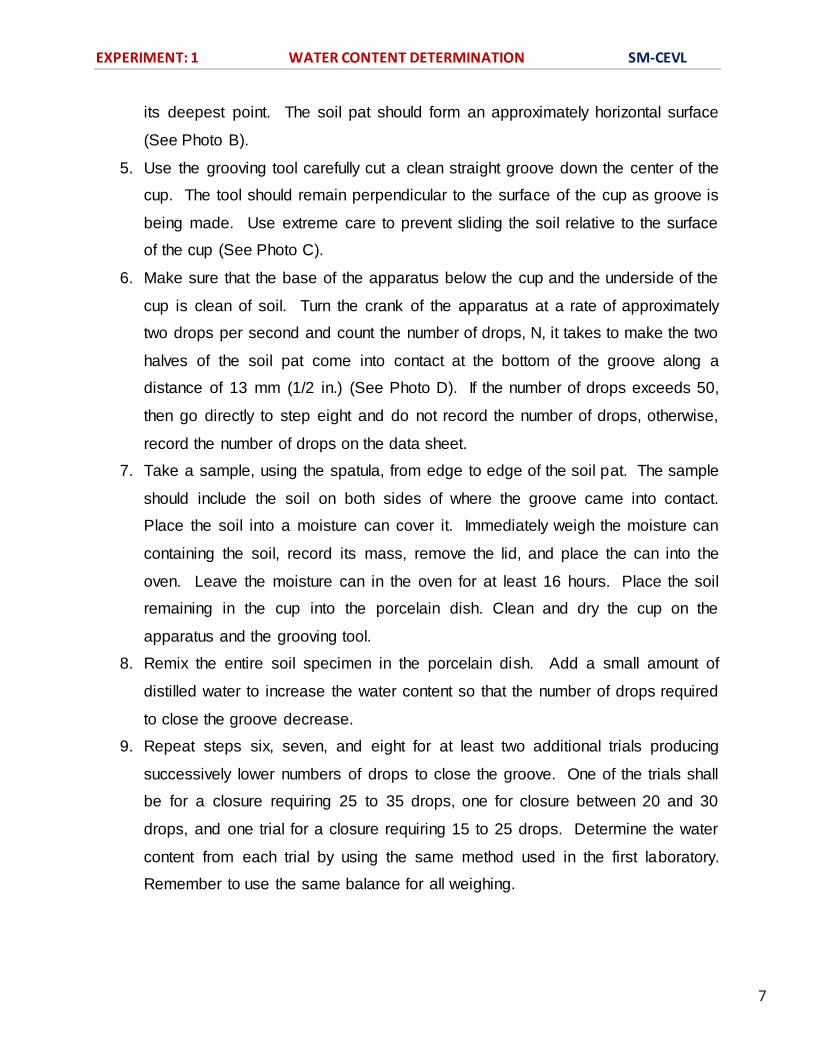
its deepest point. The soil pat should form an approximately horizontal surface
(See Photo B).
5. Use the grooving tool carefully cut a clean straight groove down the center of the
cup. The tool should remain perpendicular to the surface of the cup as groove is
being made. Use extreme care to prevent sliding the soil relative to the surface
of the cup (See Photo C).
6. Make sure that the base of the apparatus below the cup and the underside of the
cup is clean of soil. Turn the crank of the apparatus at a rate of approximately
two drops per second and count the number of drops, N, it takes to make the two
halves of the soil pat come into contact at the bottom of the groove along a
distance of 13 mm (1/2 in.) (See Photo D). If the number of drops exceeds 50,
then go directly to step eight and do not record the number of drops, otherwise,
record the number of drops on the data sheet.
7. Take a sample, using the spatula, from edge to edge of the soil pat. The sample
should include the soil on both sides of where the groove came into contact.
Place the soil into a moisture can cover it. Immediately weigh the moisture can
containing the soil, record its mass, remove the lid, and place the can into the
oven. Leave the moisture can in the oven for at least 16 hours. Place the soil
remaining in the cup into the porcelain dish. Clean and dry the cup on the
apparatus and the grooving tool.
8. Remix the entire soil specimen in the porcelain dish. Add a small amount of
distilled water to increase the water content so that the number of drops required
to close the groove decrease.
9. Repeat steps six, seven, and eight for at least two additional trials producing
successively lower numbers of drops to close the groove. One of the trials shall
be for a closure requiring 25 to 35 drops, one for closure between 20 and 30
drops, and one trial for a closure requiring 15 to 25 drops. Determine the water
content from each trial by using the same method used in the first laboratory.
Remember to use the same balance for all weighing.

EXPERIMENT: 1 WATER CONTENT DETERMINATION SM-CEVL
8
Plastic Limit:
1. Weigh the remaining empty moisture cans with their lids, and record the
respective weights and can numbers on the data sheet.
2. Take the remaining 1/4 of the original soil sample and add distilled water until the
soil is at a consistency where it can be rolled without sticking to the hands.
3. Form the soil into an ellipsoidal mass (See Photo F). Roll the mass between the
palm or the fingers and the glass plate (See Photo G). Use sufficient pressure to
roll the mass into a thread of uniform diameter by using about 90 strokes per
minute. (A stroke is one complete motion of the hand forward and back to the
starting position.) The thread shall be deformed so that its diameter reaches 3.2
mm (1/8 in.), taking no more than two minutes.
4. When the diameter of the thread reaches the correct diameter, break the thread
into several pieces. Knead and reform the pieces into ellipsoidal masses and re-
roll them. Continue this alternate rolling, gathering together, kneading and re-
rolling until the thread crumbles under the pressure required for rolling and can
no longer be rolled into a 3.2 mm diameter thread (See Photo H).
5. Gather the portions of the crumbled thread together and place the soil into a
moisture can, then cover it. If the can does not contain at least 6 grams of soil,
add soil to the can from the next trial (See Step 6). Immediately weigh the
moisture can containing the soil, record its mass, remove the lid, and place the
can into the oven. Leave the moisture can in the oven for at least 16 hours.
6. Repeat steps three, four, and five at least two more times. Determine the water
content from each trial by using the same method used in the first laboratory.
Remember to use the same balance for all weighing.

EXPERIMENT: 1 WATER CONTENT DETERMINATION SM-CEVL
9
Different Classification Systems Followed in Classification of Soils:
FOR ENGINEERING PURPOSE:
Engineers, typically Geotechnical engineers, classify soils according to their engineering
properties as they relate to use for foundation support or building material. Modern
engineering classification systems are designed to allow an easy transition from field
observations to basic predictions of soil engineering properties and behaviors.
The most common engineering classification system for soils in North America is
the Unified Soil Classification System (USCS). The USCS has three major classification
groups:
1. Coarse-grained soil (e.g. sands and gravels).
2. Fine-grained soils (e.g. silts and clays).
3. Highly organic soils (mainly referred to as “peat”).
The USCS further subdivides the three major soil classes for clarification.
Other engineering soil classification systems in the States include the AASHTO Soil
Classification System and the Modified Burmister A full geotechnical engineering soil
description will also include other properties of the soil including color, in-situ moisture
content, in-situ strength, and somewhat more detail about the material properties of the
soil than is provided by the USCS code.
SOIL SCIENCE:
For soil resources, experience has shown that a natural system approach
to classification, i.e. grouping soils by their intrinsic property (soil morphology),
behaviour, or genesis, results in classes that can be interpreted for many diverse uses.
Differing concepts of pedogenesis, and differences in the significance of morphological
features to various land uses can affect the classification approach. Despite these
differences, in a well-constructed system, classification criteria group similar concepts

EXPERIMENT: 1 WATER CONTENT DETERMINATION SM-CEVL
10
so that interpretations do not vary widely. This is in contrast to a technical system
approach to soil classification, where soils are grouped according to their fitness for a
specific use and theiredaphic characteristics.
Natural system approaches to soil classification, such as the French Soil Reference
System (Référentiel pédologique français) are based on presumed soil genesis.
Systems have developed, such as USDA soil taxonomy and the World Reference Base
for Soil Resources, which use taxonomic criteria involving soil morphology and
laboratory tests to inform and refine hierarchical classes.
Another approach is numerical classification, also called ordination, where soil
individuals are grouped by multivariate statistical methods such as cluster analysis. This
produces natural groupings without requiring any inference about soil genesis.
In soil survey, as practiced in the United States, soil classification usually means criteria
based on soil morphology in addition to characteristics developed during soil formation.
Criteria are designed to guide choices in land use and soil management. As indicated,
this is a hierarchical system that is a hybrid of both natural and objective criteria. USDA
soil taxonomy provides the core criteria for differentiating soil map units. This is a
substantial revision of the 1938 USDA soil taxonomy which was a strictly natural
system. Soil taxonomy based soil map units are additionally sorted into classes based
on technical classification systems. Land Capability Classes, hydric soil, and prime
farmland are some examples.
In addition to scientific soil classification systems, there are also vernacular soil
classification systems. Folk taxonomies have been used for millennia, while scientifically
based systems are relatively recent developments.

EXPERIMENT: 1 WATER CONTENT DETERMINATION SM-CEVL
11
Example Data
Liquid Limit Determination
Sample No. 1 2 3 4
Moisture can and lid number A1 A2 A3 A4
Mc = Mass of empty, clean can + lid (grams) 22.23 23.31 21.87 22.58
MCMS = Mass of can, lid, and moist soil (grams) 28.56 29.27 25.73 25.22
MCDS = Mass of can, lid, and dry soil (grams) 27.40 28.10 24.90 24.60
MS = Mass of soil solids (grams) 5.03 4.79 3.03 2.02
MW = Mass of pore water (grams) 1.16 1.17 0.83 0.62
w = Water content, w% 23.06 24.43 27.39 30.69
No. of drops (N) 31 29 20 14
Plastic Limit Determination
Sample No. 1 2 3
Moisture can and lid number A6 A7 A8
Mc = Mass of empty, clean can + lid (grams) 7.78 7.83 15.16
MCMS = Mass of can, lid, and moist soil (grams) 16.39 13.43 21.23
MCDS = Mass of can, lid, and dry soil (grams) 15.28 12.69 20.43
MS = Mass of soil solids (grams) 7.5 4.86 5.27
MW = Mass of pore water (grams) 1.11 0.74 0.8
w = Water content, w% 14.8 15.2 15.1
Plastic Limit (PL)= Average w % = (14.8+15.2+15.1)/3 = 15.0 Liquid Limit Chart:
From the above graph, liquid limit = 26 Results:
Liquid Limit = 26 Plastic Limit = 15 Plasticity Index =11

EXPERIMENT: 1 WATER CONTENT DETERMINATION SM-CEVL
12
OBSERVATION TABLE:-
Liquid Limit Determination
Sample No. 1 2 3 4
Moisture can and lid number
Mc = Mass of empty, clean can + lid (grams)
MCMS = Mass of can, lid, and moist soil (grams)
MCDS = Mass of can, lid, and dry soil (grams)
MS = Mass of soil solids (grams)
MW = Mass of pore water (grams)
w = Water content, w%
No. of drops (N)
Plastic Limit Determination
Sample No. 1 2 3
Moisture can and lid number
Mc = Mass of empty, clean can + lid (grams)
MCMS = Mass of can, lid, and moist soil (grams)
MCDS = Mass of can, lid, and dry soil (grams)
MS = Mass of soil solids (grams)
MW = Mass of pore water (grams)
w = Water content, w%
Liquid Limit =
Plastic Limit = Plasticity Index =

EXPERIMENT: 1 WATER CONTENT DETERMINATION SM-CEVL
13
QUIZ:
1. What is liquid limit?
2. What is plastic limit?
3. What apparatus is used to measure the liquid limit of a given soil sample.
4. What number of blows is taken for consideration while determining the liquid limit
of a given soil sample.
5. What is plasticity index?
Objective:
1. Atterberg limits are usefull for
a) Fine grained soil
b) Coarse grained soil
c) Both a and b
d) None
2. In liquid state the shear strength is
a) Zero
b) <0
c) >0
d) None
3. If soft rubber base is used instead of standard rubber base, liquid limit of soil
always -------because more number of blows are required
a) Increases
b) Decreases
c) Remains same
d) None
4. Shrinkage ratio is given by
a) ᵞd/ᵞw
b) ᵞd/ᵞ
c) ᵞw/ᵞd
d) ᵞ/ᵞw
5. Shrinkage limit is given by
a) e/G
b) ᵞd/ᵞw
c) 1-e/G
d) 1-ᵞd/ᵞw

EXPERIMENT: 1 WATER CONTENT DETERMINATION SM-CEVL
14
6. Plastic index is given by (Ip)
a) Wl-Wp
b) Ws-Wp
c) Wp-Ws
d) Wl-Ws
7. Plasticity index of non plastic soil is
a) =0
b) <0
c) >0
d) None
8. Toughness index is given as
a) Plasticity index(Ip)/Flow index(If)
b) If/Ip
c) If/Is
d) Ip/Is
9. If consistency index is negative the soil will be in ---------- state
a) Liquid
b) Plastic
c) Semisolid
d) Solid
10. Liquid limit, plastic limit and plasticity index ______ with _____ of grain size
a) Decreases, Increases
b) Decreases, Decreases
c) Increases, Increases
d) Increases, Decreases

EXPERIMENT: 1 WATER CONTENT DETERMINATION SM-CEVL
15
REFERENCES:-
i. IS : 2720 (Part II) – 1973, Method of Test for soil : Part II
ii. Soil Mechanics and Foundations.
iii. http://en.wikipedia.org/wiki/Atterberg_limits
iv. http://www.answers.com/topic/atterberg-limits
v. http://www.tpub.com/content/engineering/14069/css/14069_543.htm
vi. http://www.civil.umaine.edu/cie366/atterberg_limits/default.htm
vii. A textbook on geotechnical engineering by C.Venkataramaiah.
viii. A textbook on geotechnical engineering by B.C.Punmia
ix. A textbook on geotechnical engineering by V.N.S.Murthy
x. http://www.astm.org/Standards/D4318.htm
xi. http://www.aboutcivil.com/atterberg-limits.html
xii. http://en.wikipedia.org/wiki/Soil_classification.

EXPERIMENT: 1 WATER CONTENT DETERMINATION SM-CEVL
16
PART – 2
ANIMATION STEPS

EXPERIMENT: 1 WATER CONTENT DETERMINATION SM-CEVL
17
PART – 3
VIRTUAL LAB FRAME
-----------------------------------------------YET TO DO ------------------------------------------------ LABORATORY ROOM CONSISTS:
1. Table 2.
INPUT:
1. Type of Soil
OUTPUT: 1. Water Limit 2. Plastic Limit