Embed Size (px)
Citation preview
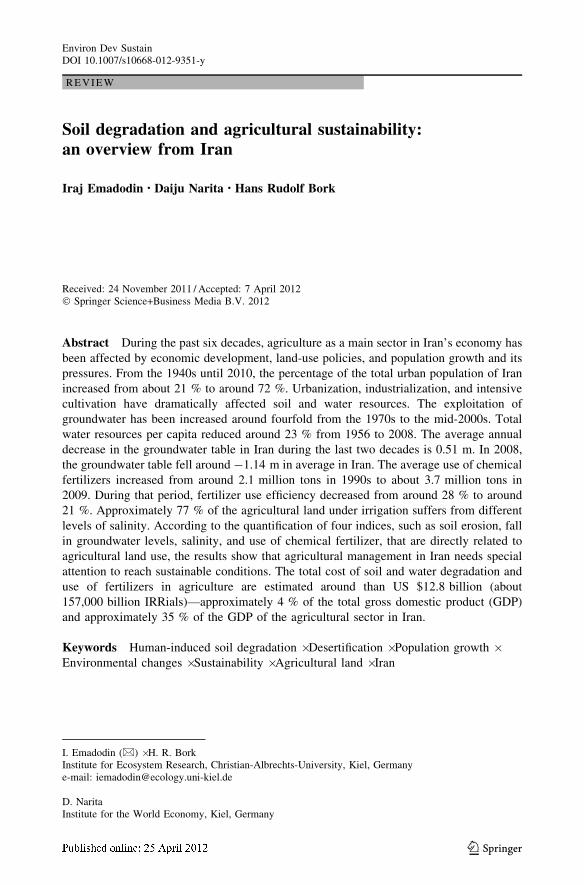
REVIEW
Soil degradation and agricultural sustainability:an overview from Iran
Iraj Emadodin • Daiju Narita • Hans Rudolf Bork
Received: 24 November 2011 / Accepted: 7 April 2012� Springer Science+Business Media B.V. 2012
Abstract During the past six decades, agriculture as a main sector in Iran’s economy has
been affected by economic development, land-use policies, and population growth and its
pressures. From the 1940s until 2010, the percentage of the total urban population of Iran
increased from about 21 % to around 72 %. Urbanization, industrialization, and intensive
cultivation have dramatically affected soil and water resources. The exploitation of
groundwater has been increased around fourfold from the 1970s to the mid-2000s. Total
water resources per capita reduced around 23 % from 1956 to 2008. The average annual
decrease in the groundwater table in Iran during the last two decades is 0.51 m. In 2008,
the groundwater table fell around -1.14 m in average in Iran. The average use of chemical
fertilizers increased from around 2.1 million tons in 1990s to about 3.7 million tons in
2009. During that period, fertilizer use efficiency decreased from around 28 % to around
21 %. Approximately 77 % of the agricultural land under irrigation suffers from different
levels of salinity. According to the quantification of four indices, such as soil erosion, fall
in groundwater levels, salinity, and use of chemical fertilizer, that are directly related to
agricultural land use, the results show that agricultural management in Iran needs special
attention to reach sustainable conditions. The total cost of soil and water degradation and
use of fertilizers in agriculture are estimated around than US $12.8 billion (about
157,000 billion IRRials)—approximately 4 % of the total gross domestic product (GDP)
and approximately 35 % of the GDP of the agricultural sector in Iran.
Keywords Human-induced soil degradation � Desertification � Population growth �Environmental changes � Sustainability � Agricultural land � Iran
I. Emadodin (&) � H. R. BorkInstitute for Ecosystem Research, Christian-Albrechts-University, Kiel, Germanye-mail: [email protected]
D. NaritaInstitute for the World Economy, Kiel, Germany
123
Environ Dev SustainDOI 10.1007/s10668-012-9351-y

1 Introduction
An increase in agricultural yield over the past several decades has not already come
without several costs (Gliessman 2004). It caused some environmental, economic, and
social problems (e.g., Kimbrell 2002; Gliessman 2004). A study of soil degradation and
agricultural sustainability needs combined socioeconomic and environmental approaches.
During around the last five decades, agricultural activities have been directly affected by
population growth and the spatial distribution of the people. Land-use changes and
intensive farming activities have negative effects on the value of the output and capacity of
the agricultural land (e.g., Zinck et al. 2004; Emadodin et al. 2009; Emadodin and Bork
2011). Population growth increases the demand of food and agricultural activities. Pro-
ductivity usually increases by an acceleration of the use of machinery and chemical fer-
tilizers. An important factor for a successful strategy to maintain the level of agricultural
production is a sustained increase in productivity. During the past six deceases, intensive
agricultural practices have had significant effects on agricultural sustainability and pro-
ductivity. Industrialization, population growth, and urbanization caused an intensification
of land use and have created several problems for the natural and the human environment
( e.g., Emadodin and Bork 2011). Agricultural sustainability is a multidimensional issue.
Herdt and Steiner (1995) described three aspects of sustainability of a system, including
space (the scale and level of assessment), time (long-term dynamics), and namely bio-
physical, economic, and social drivers. Sydorovych and Wossink (2008) developed a set of
sustainability attributes. They indicated the main attributes of agricultural sustainability
including economic, social, and ecological components in detail.
According to Altieri et al. (1983), American Society of Agronomy (1989), and Farshad
and Zinck (2001), a sustainable agricultural system is a system that over long time:
• provides human food demand,
• uses land and other resources most efficiently,
• increases environmental quality through adoption of agricultural practices,
• is socially and politically acceptable, and
• improves the social and economic conditions of local people.
Land-use intensification has the most significant effect on soil productivity and its
economical and ecological functions. As a technical approach, sustainable agricultural
management needs:
• soil erosion control,
• good soil structure,
• good soil fertility conditions, and
• good water balance.
In order to study ecological and economical aspects of soil degradation in agricultural
land, it is necessary to consider the trend of sustainability of agriculture practices with
regard to output and input namely of energy, water, and matter.
This overview follows the DPSIR (Driving forces, Pressure, State, Impacts and
Response, assessment framework of soil degradation, Fig. 1) that is adapted by EEA
(European Environment Agency 2001). DPSIR model was applied by Gorlach et al. (2004)
to assess the economic impacts of soil degradation. The results of this study may be useful
to increase the awareness of policymakers in order to a better management of agricultural
land. Also, we recommend an ecological economics approach for decisions related to land
use in the future.
I. Emadodin et al.
123

1.1 Share of agriculture in Iran’s economy
Gross domestic product (GDP) is considered as a measurement of the size of an economy.
Agriculture is an important economic sector in Iran and provides 11 % of Iran’s gross
domestic product (GDP) today, while industry and services provide 45 and 44 %,
respectively. Since 1965, the share of GDP of the agricultural sector has decreased by
16 % points (Table 1). This change shows a dramatic decrease in the contribution of
agriculture in the economy of Iran. The share of agricultural labor force in Iran decreased
from 56 % in 1956 to around 21 % in 2010 (Table 2). The machinery use in agricultural
activities increased from around 5,000 tractors in 1960s to 330,000 tractors in 2008 (Re-
zaei-Moghaddam et al. 2005; Iranian Ministry of Jihad-e-Agriculture 2009). The annual
use of chemical fertilizers increased from around 0.1 million tons in the mid-1960s
(Mahdavi 1969) to around 3.78 million tons in 2009. Total agricultural production
Fig. 1 The DPSIR soil degradation assessment framework (extract from Gorlach et al. 2004)
Table 1 Change in value addedof GDP from different sectors(1965–2009)
Source: World Bank (2012),Iranian Central Bank (2010)
Year Agriculture (%) Industry (%) Services (%)
1965 27 30 43
1970 20 38 42
1975 10 55 35
1980 16 31 53
1985 19 27 54
1990 19 29 52
1995 18 34 48
2000 14 37 50
2005 10 45 45
2009 11 45 44
Soil degradation and agricultural sustainability
123

increased from around 57 million tons in the 1990s to around 97 million tons in 2009
(FAO 2005; Iranian Ministry of Jihad-e-Agriculture 2009).
The intensification in agricultural activities over the past five decades took place
alongside the changes of unsustainable land use/land cover. From the 1950s until 2008,
around 5 million hectares of forest was converted to farmland, pasture, and urban areas
(Emadodin and Bork 2011). The main farming systems are presented in Table 3.
According to Mclachlan (1988) in the early 1960s, approximately 4 % of the country were
under the plow or covered with fruit trees. In the mid-1950s, the development of oil
industry and oil export caused the development of multipurpose dams and agricultural
equipment that improved farming practices. Land reforms, which involve regulations of
farmland ownership, have been started in 1962 and continued until 1971. The release of
6–7 million hectares of state land resulted in a high number of new landowners (Mclachlan
1988). According to Amid (1990), those land reforms improved welfare for only a small
group of rural people and poverty remained as main problem, but the general agreement is
that land reform changed the agricultural system. More land was brought under cultivation,
and the use of fertilizers significantly increased along with diversification of crops and
particularly cash cropping (Rezaei-Moghaddam et al. 2005).
Over the last 50 years, irrigated areas have increased rapidly from approximately
2.5 million hectares in the mid-1950s to around 8 million hectares in the mid-2000s (UN
1961; Iranian Ministry of Jihad-e-Agriculture 2009). The production of wheat (the most
important cereal in Iran, 35 % of the food grain production) increased from around
8 million tons in 1990 to 13.5 million tons in 2009 (from around 6.6 million hectares of
which 37 % are irrigated). According to the Iranian Water Resource Management Com-
pany (2008), the exploitation of groundwater increased from around 16 billion cubic meter
in 1973 to about 70 billion cubic meter in 2004. Qanat as a traditional water management
system for irrigation in arid and semiarid climates has played a significant role in the
agricultural development of Iran in the past (Fig. 2). According to Amid (1990), approx-
imately 75 % of water for irrigation was supplied by qanats in 1960. The number of
useable qanats decreased from around 50,000 in the mid-1970s (Mclachlan 1988; Khe-
irabadi 1991) to around 34,300 in the mid-2000s (Iranian Water Resource Management
Company 2004). Drilling wells surrounding qanat’s canals, long-term drought, collapse of
the roofs of qanats, sedimentation, and earthquakes decreased the quantity of water, and
Table 2 Labor forces in Iran(1956–2010)
Source: Lieberman (1979),Statistical Centre of Iran (2010)
Sector 1956 (%) 2010 (%)
Agriculture 56 21
Industry 20 31
Services 24 48
Table 3 Main farming systems in Iran (2009)
Farming system Area (1,000 ha) % Of total arable land Production (10,000 tons) % Of total
Irrigated 6,218 41.34 5,605 72
Rain fed 6,222 41.36 838 11
Horticulture 2,600 17.30 1,340 17
Total 15,040 100 7,783 100
Source: Iranian Ministry of Jihad-e-Agriculture (2009)
I. Emadodin et al.
123

qanats were abandoned during that period. According to the Iranian Water Resource
Management Company (2008), still active qanats provide approximately 10 % of the water
for agricultural purposes in Iran. They supply approximately 8.2 billion cubic meter of
water annually. Meanwhile, the number of wells increased from around 40,000 in 1973 to
approximately 410,000 in 2008. Agriculture uses approximately 89.5 billion cubic meter
of water annually. During the past 40 years as a result of economic development and
urbanization, water demand had increased in different sectors rapidly. With an incessant
population growth and an increasing demand of water, the situation of Iran’s water
resources will deteriorate in the future. Total annual water resources per capita have
reduced from around 7,000 cubic meters in 1956 to about 1,590 cubic meters in 2008.
Water management in Iran needs to improve in order to increase the efficiency of water use
in agriculture. According to the Iranian Water Resource Management Company (2008), the
number of traditional, semi-modern, and modern drainage and irrigation networks are
4,805, 568, and 85, respectively. Water efficiency in agriculture is estimated to be
approximately 35 %. This indicates that Iran needs more investment in water recourse
management to increase the efficiency of water use in the future. Drought has direct effects
on agricultural production and the price of agricultural products in Iran. According to
Iranian Ministry of Jihad-e-Agriculture (2009), the area under cultivation decreased from
around 14 million hectares in 2007 (with an average annual precipitation of 278 mm) to
around 12.7 million hectares in 2008 (with an average annual precipitation of 138 mm).
Total agricultural production of Iran decreased from around 90 million tons in 2007 to
around 67 million tons in 2008 (Table 3).
Desertification is a serious environmental threat in Iran and creates unfavorable con-
ditions for farmland. Around 42 million km2 (about 33 %) of the global land surface is
affected by desertification (Eswaran et al. 2001). According to Iranian Forests, Range and
Watershed management organization (2008), the desert covers around 20 % of total land of
Iran (about 0.33 million km2). Around 1 million km2 of land in Iran is at risk of deserti-
fication (Ahmadi 2004a; Abdinejad 2007). Anti-desertification activities have been started
in 1958 by Soil and Water Conservation Committee that it became as a part of the Ministry
of Agriculture (Abdinejad and Nategi 2010; Amiraslani and Dragovich 2011). From 1965
until 2006, around 2,300 km2 of the sand dune areas was stabilized by oil mulch and about
Fig. 2 A section of qanat (Source: http://www.wetech-institut.de and http://en.wikipedia.org/wiki/File:Qanat-3.svg)
Soil degradation and agricultural sustainability
123

21,000 km2 through afforestation and sowing programs (Amiraslani and Dragovich 2011;
Fig. 3). Although many activities and projects have been done to mitigate the effects of
desertification, it is still a major problem and costs more than US $1 billion annually
(Ekhtesasi 2004; Emadodin and Bork 2011).
2 Identification and estimate of the key indicters
In order to assess the trend of sustainability in agriculture in Iran, three main attributes of
agricultural sustainability will be considered below. As an environmental aspect, soil
erosion, fall of groundwater level, salinity, and the use of fertilizers will be estimated in
detail. The demographic dynamics as main social aspect and the total costs of soil and
water degradation as an important economic aspect are considered.
3 Main attributes of agricultural sustainability in agricultural land in Iran
3.1 Environmental aspects
3.1.1 Soil erosion
Around 17 billion cubic meters of water is annually used for different sectors (agriculture,
industry, etc.) in Iran. About 76.6 % of this water is used for irrigation. According to
Iranian Ministry of Jihad-e-Agriculture, dam sedimentation reduces storage capacity
around 0.2 billion cubic meters per year. Every year, 0.5 % of the potential dam capacity is
lost due to sedimentation. The annual costs of damages from dam sedimentation are
approximately US $0.6 billion in Iran (modified after World Bank 2005).
Fig. 3 Anti-desertification activities through the plantation of Haloxylon sp. near the city of Shahriar inTehran Province, north central Iran (Photo: Emadodin)
I. Emadodin et al.
123

Approximately 1.2 million km2 of the land area of Iran is affected by different types
of soil erosion (Ahmadi 2004b). Wind erosion as a main effect of land degradation in
arid and semiarid areas of Iran affects about 200,000 km2 of land in 19 from 31
provinces. In critical areas, its impact affects more than 150,000 residential units and
6,300 km2 of farmland (FRWO 2004; Abdinejad and Nategi 2010; Emadodin and Bork
2011; Fig. 4).
Water erosion removes a maximum of 500 million tons soil from about 15 million ha of
agricultural land each year (Samani et al. 2009). According to Pimentel et al. (1995), soil
formation takes between 200 and 1,000 years to form 2.5 cm of topsoil. In Iran, soil is lost
due to erosion approximately 19 times faster than it forms. Therefore, the present and
future potential for soil degradation is very great.
In the United States and China, an estimated 4 and 7 billion tons of soil is lost from the
260 and 108 million ha of agricultural land each year, respectively (Pimentel et al. 1995;
Berry 2003; Bennett et al. 2008). Pimentel et al. (1995) also indicated that the total cost of
on-site effects of the water erosion in United States is US $20 billion for replacing lost
nutrients. The economic cost of soil erosion in China is estimated to be US $6 billion for
replacement of nutrients.
The area of arable land under cultivation in Iran is estimated to be approximately
16 million hectares. A maximum of 32 tons ha-1 y1 of soil is lost from farmland in Iran
due to water erosion. One ton of soil contains approximately 28 kg of N, P, and K;
therefore, around 896 kg of nutrients is lost per hectare (Bybordi 2003). According to the
average price of chemical fertilizer, the annual costs of the loss of nutrients due to soil
erosion on arable land—with regard to the loss of soil fertility—are estimated to be
approximately US $2.7 billion per year.
Fig. 4 Sand deposition on agricultural land (Photo: Ekhtesasi)
Soil degradation and agricultural sustainability
123

3.1.2 Groundwater
The long-term average of Iran’s annual precipitation is 247 mm (1968–2008). About 70 %
of the total precipitation is falling in only 40 % of the area of the country. A long-term
analysis of annual rainfall in Iran shows a significant variability in spatial and temporal
distributions as well as in frequency and intensity (Ahmadi-Givi and Parhizkar 2008). The
average annual potential evaporation varies from approximately 700 mm near the Caspian
Sea to more than 4,000 mm in central part of Iran (Qadir et al. 2008). According to Iranian
Ministry of Energy, in 2009, the country received around 352 billion cubic meters of water
through precipitation, which is approximately 13 % less than the long-term average. In
average, approximately 280 billion cubic meters per year is lost via evapotranspiration.
Approximately 130 billion cubic meters charges surface and groundwater water annually.
Around 89.5 billion cubic meters of water is used in average per year in Iran; around 93 %
of this amount is used by agriculture (Hojjati and Boustani 2010). Around 8 million
hectares is under irrigation in Iran. And irrigation in iran,and approximately 45 % of water
is supplied through surface water and 55 % with groundwater. Groundwater plays an
important role in Iran’s agricultural activities; 362,784 wells (including deep and semi-
deep) supply in average 43.8 billion cubic meters of water for agriculture per year
(Table 4). Approximately 30 billion cubic meters of water is supplied through springs and
qanats annually. The average decrease in the groundwater table is 0.51 m with a reduction
of approximately 4.7 billion cubic meters. In 2008, the groundwater table fell around
1.14 m with about 9.1 billion cubic meter of reduction in groundwater resources (Iranian
Water Resource Management Company 2008; Iranian Ministry of Jihad-e-Agriculture
2009). The main cause of water table fall in Iran is over-pumping. According to Iranian
Water Resource Management Company, around 85 % of average annual replacements of
wells in Iran are the result of falling groundwater levels and drying the wells. Around
28,000 wells have been replaced from 1996 to 2003 (3,500 wells annually). On average, 62
wells were abandoned per year because of groundwater pollution (World Bank 2005).
3.1.3 Salinity
Salinity as one aspect of soil degradation is a main problem in sustainable agricultural
management. Agricultural land in Iran suffers from two main processes of salinization,
resulting from natural processes (as a result of the geological conditions, climatic factors,
the intrusion of saline bodies of water into the coastal aquifers, etc.) and human activities
(Fig. 5). The salt-affected area in Iran is about 34 million ha. The highly salt-affected soils
and slightly to moderately salt-affected soils are 8.5 and 25.5 million ha, respectively
(FAO 2000; Qadir et al. 2008). Over-pumping of the groundwater through exploitation of
saline aquifers and lack of drainage facilities are considered as important anthropogenic
driving forces of salinity. Around 50 % of the irrigated areas are affected by different
Table 4 Number of wells and the amount of water supply for different sectors in 2008
Area of use Agriculture Industry Urban area Rural area Total
Number of well 362,784 27,390 10,515 13,570 414,259
Water supply (billion cubic meter) 43.8 1.7 2.7 1.9 50.1
Source: Iranian Water Resource Management Company (2008)
I. Emadodin et al.
123

levels of salinity in Iran (Cheraghi 2004). The main result of salinization in agricultural
lands is the loss of productivity. Table 5 shows irrigated lands and their salinity levels.
According to Qadir et al. (2008), soils with severe to extreme salinity are located in the
Central Plateau, Khuzestan and Southern Coastal Plains and the Caspian Coastal Plain of
Iran. In these areas, salinity is one of the main factors effecting on crop production.
3.1.4 Use of fertilizer
Fertilizers are used to increase plant growth and productivity. They are divided into two
groups: macronutrients (e.g., nitrogen, phosphorus, potassium) and micronutrients (e.g.,
chlorine, manganese, iron, zinc). The use of fertilizers and pesticides may be useful for
increasing the production, but it has several negative environmental effects on eutrophi-
cation and human health. Around 19 billion cubic meters of waste water from agriculture,
industry, and urban areas recharges to surface water and about 10 billion cubic meters to
groundwater (Iranian Water Resource Management Company 2004). According to Iranian
Ministry of Jihad-e-Agriculture in 2008, around 4,700 tons of micronutrient fertilizers has
Fig. 5 Salinity and soil degradation, near the city of Shahriar in Tehran Province, north central Iran (Photo:Emadodin)
Table 5 Soil salinity in irrigatedlands in Iran
Source: Moameni (2004), WorldBank (2005)
Salinity level dS/m Irrigated land(million ha)
(%)
Slight salinity 4–8 0.9 19
Moderate salinity 8–16 1.2 26
Strong salinity 16–32 1.5 32
Very strong salinity [32 1.1 23
Total 4.7 100
Soil degradation and agricultural sustainability
123

been applied in arable land. The macronutrient fertilizers such as nitrogen (N), phosphorus
(P2O5), and potassium (K2O) have been used, 2.3, 0.8, and 0.2 million tons, respectively.
Also, around 8,000 tons of pesticides have been used in cultivated areas in 2008.
Approximately 70 % of chemical fertilizers were produced in Iran, and about 30 % were
imported from other countries. According to Table 6, the average use of fertilizers
increased around two times from 1990 to 2009. Fertilizer use efficiency has been decreased
from 28.02 to 21.55 during the last three decades.
3.2 Demographic dynamics
Iran has a total land area of 1.65 million km2 and a total population of around 74 million.
Population growth and urbanization in Iran during the last five decades as major aspects of
demographic transition are the result of economic development during this period.
According to Iranian Statistic Centre, the number of cities in Iran increased 20-fold from
1956 to 2008 (Hesari 2008). From 1936 to 2010, the percentage of rural population in Iran
decreased from 79 to 28 %, although the absolute size of rural population exhibited an
increase during that period (Fig. 6). Urban manufacturing, construction, and services
absorbed a large amount of labor force. Figure 7 illustrates the distribution of the popu-
lation in Iran today. According to this map, the north, north-center, and the west of Iran
have a high population density of more than 500 persons per sq km, while the density is
less than 2 persons per sq km in the center and the desert area. Around 22 million people
Table 6 Relationship between rainfall, fertilizer use, and agricultural production (1990–2009)
Year Average amountof fertilizer (91,000 tons)
Mean annualprecipitation (mm)
Production(million tons)
P/F (%)
1990–1995 1,959 267 54.9 28.02
1996–2000 2,402 239 59.3 24.69
2001–2005 3,173 237 71.7 22.59
2006–2009 3,786 236 81.6 21.55
Source: Iranian Ministry of Jihad-e-Agriculture
P production, F average amount of fertilizer
Fig. 6 Population growth in rural and urban areas (1936–2010) (Source: Hesari 2008; Statistical Centre ofIran 2010)
I. Emadodin et al.
123

are living in rural areas; 23 % of them engage in agriculture, and 77 % are working in the
industry and service sectors. Around 30 % of the total active people in the agricultural
sector are women today. As a social development index, the literacy rate has increased
from around 15 % in 1956 to approximately 82 % in 2010 (Lieberman 1979; UNDP 2010).
Literacy differentiation between urban and rural areas changed from 35 % in 1976 to 13 %
in 2006. According to the Literacy Movement Organization of Iran, around 4.5 million
illiterate people are still working in industry or agricultural sectors today. The mortality
rate for children in an age less than 5 years per 1000 people has been decreased from 190
in 1970 to 31 in 2009 (World Bank 2009).
According to World Bank (2005), total health costs related to inadequate water supply,
water pollution, sanitation, and hygiene are estimated to be around US $3.9 billion in 2002.
Energy use (kilogram of oil equivalent per capita) increased from 569 in 1970 to around
2,600 in 2007. CO2 emission per capita has been increased from around 2 metric tons in
1960 to 7 metric tons per capita in 2007(World Bank 2009). According to Iranian Ministry
of Energy, the share of the agricultural sector in total CO2 emission is around 2.5 %.
3.3 Economic costs of soil degradation
Soil degradation causes various negative effects on human activities and amenities, and
some of those effects are quantifiable as economic costs through indirect estimation
methods such as the replacement cost approach. GDP has grown during the last 35 years
(Fig. 8). According to Iranian Statistic Centre, the price-adjusted household income has
decreased from 2005 to 2009; the average reduction is greater for rural households (-17
and -5 %, respectively) than for urban households.
Fig. 7 Density and distribution of the population (modified after FAO 2002) (c) FAO 2011 (Source: FAOCountry Profiles http://www.fao.org/countryprofiles)
Soil degradation and agricultural sustainability
123

Soil degradation has direct and indirect economic cost. Loss of nutrients by soil erosion
could be offset by application of chemical fertilizers. The total annual costs resulting from
dam sedimentation and the reduction in soil fertility are estimated to be approximately US
$3.3 billion (around 40,600 billion IRRials, based on 2012 US dollars). Considering the
average price of the fertilizers, about US $7.5 billion (around 92,200 billion IRRials) is the
annual costs of fertilizers in Iran. Meanwhile, the cost for one well with a depth of 100 m
in Iran is US $38,400 (472 million IRRials), including mechanical drilling, piping, and
pumping tests. Additionally, approximately US $4,800 or US $24,000 (59 or 295 million
IRRials) is needed for diesel pumps and electric motor pumps, respectively. Accordingly,
the total cost for drilling new wells (including equipment such as pipes and pumps) due to
falling groundwater tables and pollution is estimated to be approximately US $170 million
in Iran (about 2,100 billion IRRials). As for salinity, based on World Bank’s data and
estimation method (2005), the annual costs are estimated to be around US $1.8 billion
(around 22,100 billion IRRials).
4 Conclusions
According to four main physical factors that were quantified for agricultural land in Iran,
the results indicated that agricultural sustainability is not in suitable condition. Soil erosion
is very active and causes several social, economic, and environmental problems. The cost
of soil erosion from arable land—with regard to the loss of soil fertility—and dam sedi-
mentation and average price of the fertilizers is estimated to approximately US
$10.8 billion (about 132,800 billion IRRials). The decrease in groundwater level increased
the economical costs around 0.17 billion US$ (around 2,090 billion IRRials).
Chemical fertilizer use increased approximately 38 times from the mid-1960s to the
end-2000s with an average total price of the fertilizers of around US $7.5 billion in 2010.
Salinity of soil in different levels as an important factor of soil degradation in agricultural
land in Iran affects around 4.7 million hectares with average cost of yield loss around US
$1.8 billion (about 22,100 billion IRRials). The total cost of soil and water degradation in
agricultural area in Iran is estimated to be approximately US $12.8 billion (about
157,000 billion IRRials), which is around 4 % of the total Gross domestic product (GDP)
Fig. 8 Population growth and gross domestic production (GDP) (1976–2010) (Source: World Bank 2009,Iranian Central Bank 2010)
I. Emadodin et al.
123

and around 35 % of the GDP in agricultural sectors annually. More specifically, sustain-
able agriculture in Iran needs:
• an increase in the efficiency of water use and an improvement of the drainage and
irrigation network;
• an educational and technical development in the different agricultural sectors;
• a development of a regional suitable method to mitigate the effects of soil erosion and
salinity;
• an ecological and economic approach in agricultural planning in the future;
• to provide suitable facilities to increase the investment in agricultural sectors; and
• an improvement of drought-resistant plants especially in horticulture;
Acknowledgments The authors gratefully thank Dr. D. Pimentel and two anonymous referees for theirinvaluable suggestions and constructive comments.
References
Abdinejad, G. A. (2007). Desert and desertification in Iran. Journal of Forest and Rangeland, Teheran, Iran,74, 23–26 (in Persian).
Abdinejad, G. A., & Nategi, D. (2010). Desert and desertification control in Iran. Tehran: Pune press (InPersian).
Ahmadi, H. (2004a). Introduction to Iranian model of desertification assessment (IMDA), Technical reportpresented to the Committee of Science and Technology, United Nations Convention to combatdesertification, the 7th session of conference of parties (COP7), p. 56, Nairobi, Kenya.
Ahmadi, H. (2004b). The study of desertification in Iran. Journal of Forest and Rangeland, Teheran, Iran(In Persian).
Ahmadi-Givi, F., & Parhizkar, D. (2008). A study of the relationship between ENSO and the distribution ofannual precipitation in Iran in the period 1971–2000. Iranian Geophysics Journal, 2, 25–37 (inPersian).
Altieri, M. A., Letourneau, D. K., & Davis, J. R. (1983). Developing sustainable agroecosystems. Biosci-ence, 33(1), 45–49.
American Society of Agronomy. (1989). Decision reached on sustainable agriculture, p. 15. Agron News,January.
Amid, M. J. (1990). Poverty, agriculture and reform in Iran. London: Routledge.Amiraslani, F., & Dragovich, D. (2011). Combating desertification in Iran over the last 50 years: An
overview of changing approaches. Journal of Environmental Management, 92, 1–13.Bennett, J., Xuehong, W., & Zhang, L. (2008). Environmental protection in China, land-use management.
Cheltenham: Edward Elgar publishing, Inc.Berry, L. (2003). Land degradation in China: Its extent and impact. Available at http://lada.virturalcentre.org
, UN, (26/3/04).Bybordi, M. (2003). Soil physics. Tehran: University of Tehran Press (In Persian).Cheraghi, S. A. M. (2004). Institutional and scientific profiles of organizations working on saline agriculture
in Iran. In F. K. Taha, S. Ismail, & A. Jaradat (Eds.), Prospects of saline agriculture in the ArabianPeninsula: Proceedings of the international seminar on prospects of saline agriculture in the GCCCountries 18–20 March 2001, Dubai, United Arab Emirates (pp. 399–412). Amherst, MA: AmherstScientific Publishers.
EEA (European Environment Agency). (2001). Proposal for a European soil monitoring and assessmentframework, Technical Report No 61, Copenhagen, Denmark. http://reports.eea.eu.int/Technical_report_No_61/en.
Ekhtesasi, M. R. (2004). Investigating morphometric and morphodynamic characteristics of wind erosion inYazd plain and determining their indices for desertification models. Ph.D. Thesis, Tehran University.
Emadodin, I., & Bork, H. R. (2011). Degradation of soils as a result of long-term human-induced trans-formation of the environment in Iran: an overview. Journal of Land Use Science. doi:10.1080/1747423X.2011.560292.
Soil degradation and agricultural sustainability
123
Emadodin, I., Reiss, S., & Bork, H. R. (2009). A study of the relationship between land management and soilaggregate stability: A case study near Albersdorf, Northern-Germany. Journal of Agriculture andBiological Sciences, 4, 48–53.
Eswaran, H., Lal, R., & Reich, P. F. (2001). Land degradation: An overview, Responses to Land Degra-dation. In Proceeding of 2nd international conference on land degradation and desertification. NewDelhi, India: Oxford Press.
FAO. (2005). Fertilizer use by crop in the Islamic Republic of Iran, First version, published by Food andAgriculture Organization of the United Nations, Rome, Italy.
FAO. (2011). Country profiles. Available at http://www.fao.org/countryprofiles/index.asp?lang=en&ISO3=IRN.
FAO (Food and Agriculture Organization of the United Nations). (2000). Global Network on Integrated SoilManagement for Sustainable Use of Salt-affected Soils. Country Specific Salinity Issues, Iran. Rome:FAO.
Farshad, A., & Zinck, J. A. (2001). Assessing agricultural sustainability using the six-pillar model: Iran as acase study. In S. Gliessman (Ed.), Agroecosystem sustainability: Developing practical strategies (pp.137–151). Boca Raton: CRC Press.
FRWO (Forests, Range and Watershed management organization). (2004). National activities program,Technical Report for United Nation Convention of Combat Desertification, Iran, Tehran.
FRWO (Forests, Range and Watershed management organization). (2008). Office of planning and statistics(In Persian). Available at http://www.pbb.frw.org.ir/.
Gliessman, S. R. (2004). Integrating agroecological processes into cropping systems research. Journal ofCrop Improvement, 11, 61–80.
Gorlach, B., Landgrebe-Trinkunaite, R., & Interwies, E. (2004). Assessing the economic impacts of soildegradation. Volume I: Literature review. Study commissioned by the European Commission, DGEnvironment, Study Contract ENV.B.1/ETU/2003/0024. Berlin: Ecologic.
Herdt, R. W., & Steiner, R. A. (1995). Agricultural sustainability, Concepts and conundrums. In V. Barnett,R. Payne, & R. Steiner (Eds.), Agricultural sustainability, economic, environmental and statisticalconsiderations (pp. 3–13). Teachester, New York, Brisbane, Toronto, Singapore: John Whiley.
Hesari, A. (2008). Urbanization in Iran (In Persian). Available at http://alef.ir/content/view/35736/.Hojjati, M. H., & Boustani, F. (2010). An assessment of groundwater crisis in Iran, case study: Fars
province. World Academy of Science, Engineering and Technology, 70, 476–480.Iranian Central Bank. (2010). http://www.cbi.ir/.Iranian Ministry of Jihad-e-Agriculture. (2009). Annual report of agriculture 2008. Department of Statistic
and Information. No. 2, Tehran, Iran: Ministry of Jihad-e-Agriculture publications (in Persian).Iranian Water Resource Management Company. (2004). Annual report of water resource in Iran. No.
1-88024, Tehran, Iran (in Persian).Iranian Water Resource Management Company. (2008). Annual report of water resource in Iran. No.
1-88028, Tehran, Iran (in Persian).Kheirabadi, M. (1991). Iranian cities: Formation and development. Austin, Texas: University of Texas
Press.Kimbrell, A. (2002). Fatal harvest: The tragedy of industrial agriculture. Washington, DC: Island Press.Lieberman, S. S. (1979). Prospects for development and population growth in Iran. Population and
Development Review, 5, 293–317.Mahdavi, A. F. (1969). Increased food through efficient fertilizer use in Iran. In T. S. Stickley, J. A. Asmer,
A. R. Saghir, N. Atallah, & P. L. Pellett (Eds.), Man, food and agriculture in the Middle East. Beirut:American University of Beirut.
McLachlan, K. (1988). The neglected garden: The politics and ecology of agriculture in Iran (p. 303).London: I.B. Tauris & Co. Ltd.
Moameni, A. (2004). An appraisal of land resources of Iran. FAO Report, unpublished.Pimentel, D., Harvey, C., Resosudarmo, P., Sinclair, K., Kurz, D., McNair, M., et al. (1995). Environmental
and economic costs of soil erosion and conservation benefits. Science, 267, 1117–1123.Qadir, M., Qureshi, A. S., & Cheraghi, S. A. M. (2008). Extent and characterization of salt-affected soils in
Iran and strategies for their amelioration and management. Land Degradation and Development, 19,214–227.
Rezaei-Moghaddam, K., Karami, E., & Gibson, J. (2005). Conceptualizing sustainable agriculture: Iran asan illustrative case. Journal of Sustainable Agriculture, 27, 25–56.
Samani, A. N., Ahmadi, H., Jafari, M., Boggs, G., Ghoddousi, J., & Malekian, A. (2009). Geomorphicthreshold conditions for gully erosion in southwestern Iran (Boushehr-Samal Watershed). Journal ofAsian Earth Sciences, 35, 180–189.
I. Emadodin et al.
123

Statistical Centre of Iran. (2010), Population estimation, country’s population, Urban and rural areas.http://www.amar.org.ir/default.aspx?tabid=52.
Sydorovych, O., & Wossink, A. (2008). The meaning of agricultural sustainability: Evidence from a con-joint choice survey. Agricultural Systems, 98, 10–20.
UNDP. (2010). Human development report. Available at http://hdrstats.undp.org/en/countries/profiles/IRN.html.United Nations. (1961). Economic commission for Asia and the far east. Multi-purpose river basin devel-
opment, Part 2D. United Nations publication, Bangkok.World Bank. (2005). Islamic Republic of Iran; Cost assessment of environmental degradation, Report No.
32043-IR.World Bank. (2009). World data indicator. Available at http://www.worldbank.org/.World Bank. (2012). World development indicator and global development finance.Zinck, J. A., Berroteran, J. L., Farshad, A., Moameni, A., Wokabi, S., & Van Ranst, E. (2004). Approaches
to assessing sustainable agriculture. Journal of Sustainable Agriculture, 23, 87–109.
Soil degradation and agricultural sustainability
123