Embed Size (px)
Citation preview
Soil databases and the problem of establishing regionalbiogeochemical trends
K A R E N W. H O L M E S *, D A R A . R O B E R T S *, S T U A R T S W E E N E Y *, I Z AYA N U M A T A *,
E R A L D O M AT R I C A R D I w , T R E N T W. B I G G S *, G E T U L I O B A T I S T A z and O L I V E R A .
C H A D W I C K *
*Geography Department, University of California, Santa Barbara, CA 93106, USA, wGeography Department, Michigan
State University, East Lansing, MI 48823, USA, zDepartment of Agricultural Science, Universidade de Taubate, CEP
12081-010, Taubate, SP, Brazil
Abstract
Regional and global environmental modeling depend on soil data for input layers or
parameterization. However, randomly located observations, such as provided by
agricultural databases, are not always representative of trends identified in field studies
conducted under carefully controlled conditions. Many researchers lament the paucity of
soil profile data in Amazonia, and suggest that given more data, regional studies would
more closely approximate field research results. We assess the ability of a well-populated
regional database collected in the southwestern Brazilian Amazon to reproduce expected
biogeochemical trends associated with forest clearing and pasture establishment, and
explore the ramifications of relying on independently collected soil data for regional
modeling. The Soteron database includes analyses of approximately 3000 soil cores
collected for zoning purposes in the state of Rondonia. Pasture ages were determined
from a time series of Landsat TM images classified using spectral mixture analysis.
Although regional averages showed some of the temporal trends expected based on
field study results (e.g. increase in pH following forest clearing), the trends were not
statistically significant. Stratification by precipitation and other variables showed
pasture age to be important but difficult to separate from other potential controls on
soil conditions, mainly because of the reduced number of observations in each stratum.
Using multiple regression, which permitted the inclusion of all potential explanatory
factors and interactions, pasture age was shown to be a statistically significant predictor
of soil conditions. However, the expected temporal sequence of changes documented by
field chronosequence studies could not be reproduced. Properties dominated by large-
scale environmental gradients – pH, sum of base cations, aluminum saturation, and
exchangeable calcium – were moderately well modeled, while those more strongly
linked to dynamic spatially heterogeneous processes such as biological cycling and land
management, particularly organic carbon and nitrogen, could not be modeled.
Management-induced soil changes occur at too fine a scale to be captured by most
maps, and the relative changes are small compared with spatial heterogeneity caused by
controls on soil development over large regions. Therefore, regardless of whether
chronosequence-derived models of biogeochemical response to land-cover change are
correct, the results of these models will not lead to spatially explicit maps that can be
validated by regional reconnaissance, nor will they facilitate realistic predictions of the
regional biogeochemical consequences of land-cover change. The change from local to
regional scale entails a change in the relative importance of processes controlling soil
property behavior.
Keywords: Brazilian Amazon, chronosequence, extrapolation, land-cover change, regional modeling,
soil database analysis
Correspondence: Karen W. Holmes, fax 1 1 805 893 3146,
e-mail: [email protected]
Global Change Biology (2004) 10, 796–814, doi: 10.1111/j.1529-8817.2003.00753.x
796 r 2004 Blackwell Publishing Ltd

Received 3 December 2002; revised version received 14 March 2003 and accepted 31 March 2003
Introduction
Global and regional predictions for climate change,
biogeochemical cycling, and agricultural sustainability
require field-measured soil properties as model input
or for parameterization (e.g. Dunne & Willmott, 1996;
Potter et al., 1998; Cramer et al., 1999; Reynolds et al.,
2000). One of the fundamental challenges for research-
ers addressing large-scale environmental phenomena is
how to scale measurements from field sites (0.01–
10 km2) to regional (410 000 km2) or global scales
(King, 1990; Rastetter et al., 1992; Wessman, 1992; Prince
& Steininger, 1999). Most field research employs
stratified random sampling designed to minimize
within-treatment heterogeneity and maximize differ-
ences among treatments. Unfortunately, this approach
restricts extrapolation of research results to a small
portion of the regional range of environmental condi-
tions, and increases uncertainty associated with quan-
titative estimates of soil properties at a regional scale.
For example, using this approach, changes in nutrient
sources to Hawaiian ecosystems could be determined
with confidence (Chadwick et al., 1999), but the land
area for which those sources were relevant declined
from nearly 100% on Hawaii to less than 2% on Kauai
(Vitousek et al., in press). In contrast, interpretation of
randomly collected data will represent a wide range of
environmental conditions; but it can misconstrue
ecological processes because of unconstrained variation
in land use and environment. For example, a study
based on a global database determined that soil carbon
turnover was independent of temperature (Giardina &
Ryan, 2000). That result was severely criticized because
other environmental factors such as land use, clay
mineralogy and concentration, and rhizosphere chem-
istry were not controlled (Davidson et al., 2000).
Quantification of soil variability at regional scales is
required for model input, but there is little agreement
on the best approach for gathering and using the
required field data.
It is possible that soil profile data combined with
remotely sensed land-cover data would provide suffi-
cient information over a broad range of geographic
conditions to allow direct quantification of regional soil
ecosystem behavior, without resorting to coarse extra-
polation (Paustian et al., 1997; Numata et al., in press).
We designed an experiment to test whether an extensive,
independently collected soil profile database combined
with a land-cover time series interpreted from satellite
imagery could be used to recreate well-documented
patterns of soil property changes following deforestation
and pasture establishment in Amazonia. Our aim was to
determine whether the database could reproduce known
biogeochemical trends at the regional scale. The data-
base used is the most extensive and systematic soil
profile collection in Amazonia (Soteron: Soils and
Terrain of Rondonia state, Brazil (Cochrane, 1998)). If
the independently collected primary data in Soteron are
not adequate for exploring biogeochemical patterns, few
Amazonian databases will do better.
In order to evaluate the Soteron database, we
compared regional changes in soil chemical properties
resulting from forest clearing and pasture establish-
ment in Rondonia (southwestern Brazilian Amazon) to
results of similar pasture aging studies conducted at the
local scale. Known as pasture chronosequences, these
studies document changes in soil nutrient status
through time at carefully constrained field sites where
environmental and land-use variation are minimized.
For the regional analysis, we used a high-resolution
time series of classified Landsat Thematic Mapper (TM)
images to assign deforestation dates to pastures
sampled by Soteron surveyors in 1996–1997. The
expected sequence of soil chemical changes following
forest clearing is well documented by pasture chron-
osequence studies: (1) soil pH, effective cation exchange
capacity (ECEC), and exchangeable base cation content
increase and remain higher than background (forest)
levels after forest removal and conversion for agricul-
ture for at least 9 years (Moraes et al., 1996; Numata,
1999; McGrath et al., 2001); (2) aluminum saturation on
the soil exchange complex declines following forest
clearing (Moraes et al., 1996; Numata, 1999); (3)
inorganic soil phosphorus increases for 3–5 years after
forest clearing, then declines (Numata, 1999; Garcia-
Montiel et al., 2000) although this signal is not always
very strong (McGrath et al., 2001); (4) C and N are
affected by deforestation, but the strong influence of
management on C and N levels make generalizations
difficult (Neill et al., 1997b; Neill & Davidson, 2000;
McGrath et al., 2001); and (5) horizons deeper than
about 20 cm are not affected by land-cover change
(McGrath et al., 2001). The forest soil nutrient levels and
the postclearing temporal changes vary spatially along
environmental gradients, making it difficult to extra-
polate results from one field site to a large area.
Traditional pasture chronosequence studies focus on
relatively few well-constrained data points to empha-
size specific differences in process domains. Seldom do
these studies collect enough data to allow viable
statistical evaluation, but they provide the best under-
standing of how soil nutrients are likely to behave in
response to land-use change. We evaluate soil property
R E G I O N A L S O I L B I O G E O C H E M I S T R Y A N A LY S I S 797
r 2004 Blackwell Publishing Ltd, Global Change Biology, 10, 796–814
changes due to forest clearing and pasture aging on a
regional scale by plotting the arithmetic mean nutrient
levels for various stratified subsets vs. pasture aging,
compare the results with the direction and magnitude
of changes determined in field studies, and assess
whether the changes observed are statistically signifi-
cant. The database includes samples from a large
region, and therefore environmental variables other
than land cover influence soil nutrient dynamics. We
use multiple regression models of soil properties to find
the best possible linear combination of pasture age,
environmental gradients, and interactions that explain
variation in soil nutrient levels.
Methods
Study area
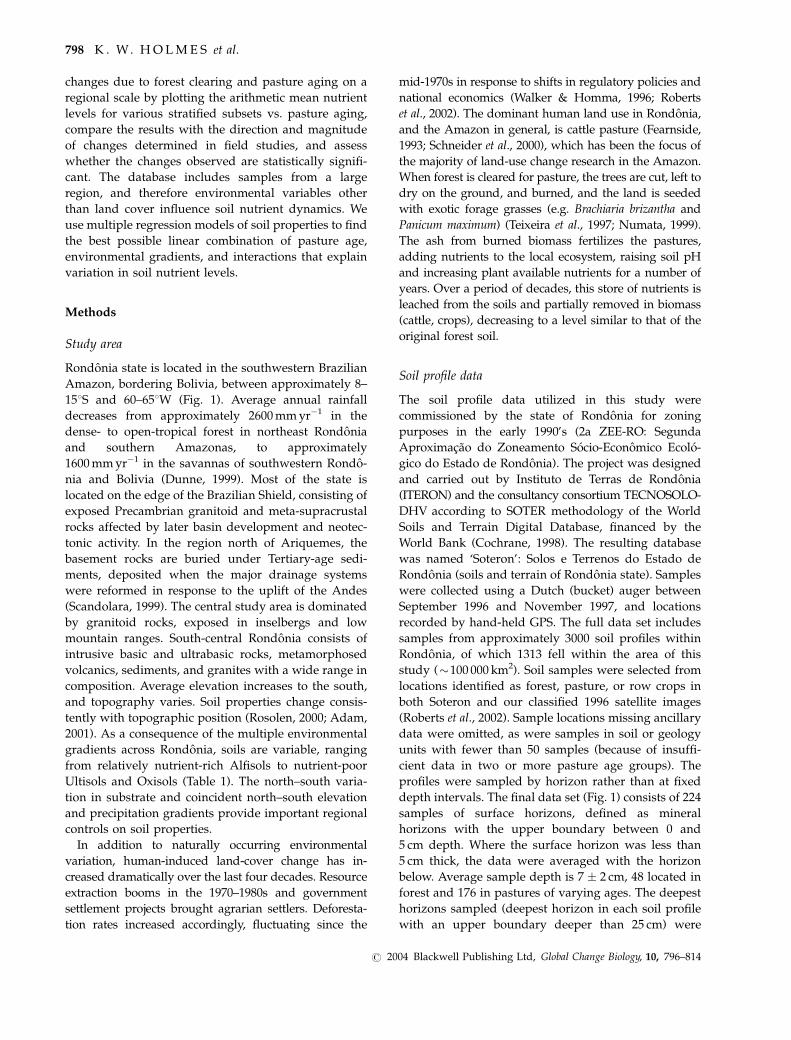
Rondonia state is located in the southwestern Brazilian
Amazon, bordering Bolivia, between approximately 8–
151S and 60–651W (Fig. 1). Average annual rainfall
decreases from approximately 2600 mm yr�1 in the
dense- to open-tropical forest in northeast Rondonia
and southern Amazonas, to approximately
1600 mm yr�1 in the savannas of southwestern Rondo-
nia and Bolivia (Dunne, 1999). Most of the state is
located on the edge of the Brazilian Shield, consisting of
exposed Precambrian granitoid and meta-supracrustal
rocks affected by later basin development and neotec-
tonic activity. In the region north of Ariquemes, the
basement rocks are buried under Tertiary-age sedi-
ments, deposited when the major drainage systems
were reformed in response to the uplift of the Andes
(Scandolara, 1999). The central study area is dominated
by granitoid rocks, exposed in inselbergs and low
mountain ranges. South-central Rondonia consists of
intrusive basic and ultrabasic rocks, metamorphosed
volcanics, sediments, and granites with a wide range in
composition. Average elevation increases to the south,
and topography varies. Soil properties change consis-
tently with topographic position (Rosolen, 2000; Adam,
2001). As a consequence of the multiple environmental
gradients across Rondonia, soils are variable, ranging
from relatively nutrient-rich Alfisols to nutrient-poor
Ultisols and Oxisols (Table 1). The north–south varia-
tion in substrate and coincident north–south elevation
and precipitation gradients provide important regional
controls on soil properties.
In addition to naturally occurring environmental
variation, human-induced land-cover change has in-
creased dramatically over the last four decades. Resource
extraction booms in the 1970–1980s and government
settlement projects brought agrarian settlers. Deforesta-
tion rates increased accordingly, fluctuating since the
mid-1970s in response to shifts in regulatory policies and
national economics (Walker & Homma, 1996; Roberts
et al., 2002). The dominant human land use in Rondonia,
and the Amazon in general, is cattle pasture (Fearnside,
1993; Schneider et al., 2000), which has been the focus of
the majority of land-use change research in the Amazon.
When forest is cleared for pasture, the trees are cut, left to
dry on the ground, and burned, and the land is seeded
with exotic forage grasses (e.g. Brachiaria brizantha and
Panicum maximum) (Teixeira et al., 1997; Numata, 1999).
The ash from burned biomass fertilizes the pastures,
adding nutrients to the local ecosystem, raising soil pH
and increasing plant available nutrients for a number of
years. Over a period of decades, this store of nutrients is
leached from the soils and partially removed in biomass
(cattle, crops), decreasing to a level similar to that of the
original forest soil.
Soil profile data
The soil profile data utilized in this study were
commissioned by the state of Rondonia for zoning
purposes in the early 1990’s (2a ZEE-RO: Segunda
Aproximacao do Zoneamento Socio-Economico Ecolo-
gico do Estado de Rondonia). The project was designed
and carried out by Instituto de Terras de Rondonia
(ITERON) and the consultancy consortium TECNOSOLO-
DHV according to SOTER methodology of the World
Soils and Terrain Digital Database, financed by the
World Bank (Cochrane, 1998). The resulting database
was named ‘Soteron’: Solos e Terrenos do Estado de
Rondonia (soils and terrain of Rondonia state). Samples
were collected using a Dutch (bucket) auger between
September 1996 and November 1997, and locations
recorded by hand-held GPS. The full data set includes
samples from approximately 3000 soil profiles within
Rondonia, of which 1313 fell within the area of this
study (�100 000 km2). Soil samples were selected from
locations identified as forest, pasture, or row crops in
both Soteron and our classified 1996 satellite images
(Roberts et al., 2002). Sample locations missing ancillary
data were omitted, as were samples in soil or geology
units with fewer than 50 samples (because of insuffi-
cient data in two or more pasture age groups). The
profiles were sampled by horizon rather than at fixed
depth intervals. The final data set (Fig. 1) consists of 224
samples of surface horizons, defined as mineral
horizons with the upper boundary between 0 and
5 cm depth. Where the surface horizon was less than
5 cm thick, the data were averaged with the horizon
below. Average sample depth is 7 � 2 cm, 48 located in
forest and 176 in pastures of varying ages. The deepest
horizons sampled (deepest horizon in each soil profile
with an upper boundary deeper than 25 cm) were
798 K . W. H O L M E S et al.
r 2004 Blackwell Publishing Ltd, Global Change Biology, 10, 796–814

separated into a second data set with a total of 206
samples at an average depth of 105 � 23 cm, 44 located
in forest and 162 in pasture.
Exchangeable Ca, Mg, Na, K, P, Al, total N, organic
carbon (OC), pH, ECEC, sum of base cations
(SumBase), and particle size were analyzed according
to the methods described by Cochrane (1998) (Table 2).
To reduce the effect of non-Gaussian distribution of the
data, variables with non-normal distributions were log
(base 2) transformed (Table 2). One hundred and forty-
one surface horizons in the complete data set were
measured for bulk density, but only one of those was in
the final data subset after sample selection as described
above. We modeled bulk density as a function of OC
and percent clay using all available data, but the best
model explained only 50% of the variability. We chose
to present soil nutrient levels as concentrations, rather
than calculate nutrient stocks based on the bulk density
estimates which would contain a large amount of
uncertainty. For general reference, the average bulk
Fig. 1 Locations of soil profiles, color coded by pasture age. The four Landsat TM scenes are: (a) Porto Velho (P232 R66), (b) Ariquemes
(P232 R67), (c) Ji-Parana (P231 R67), (d) Luiza (P231 R68).
R E G I O N A L S O I L B I O G E O C H E M I S T R Y A N A LY S I S 799
r 2004 Blackwell Publishing Ltd, Global Change Biology, 10, 796–814

density for the surface and deepest horizons, respec-
tively, are 1.26 � 0.16 and 1.30 � 0.17 g cm�3. Pasture
management, such as fertilization, crop/animal rota-
tion, and fire frequency, affects soil nutrient concentra-
tions, but this information was not included in the soil
database. Fertilization is uncommon for pastures in
Table 2 Summary of soil properties used in this study from Soteron (Cochrane, 1998)
Property Method Description
Soil reaction (pH) 1 : 5 soil : water, colomel
electrode
Degree of acidity, controls redox, solubility of
minerals, availability of nutrients
Phosphorus* (P) (ppm) Mehlich 3 method,
spectrophotometry
One of the most commonly limiting nutrients
for plants in tropics/Amazon
Calcium (Ca)* (cmolc kg�1 soil) NH4-Ac extract at pH 7,
flame photometry
Base-forming cations: Ca required for root
development
Sum of bases* (cmolc kg�1 soil)
(SumBase)
Calculated [Ca21 ]1 [Mg21 ]1 [K1 ]1 [Na1 ]: total available
base cations
Effective cation exchange
capacity* (cmolc kg�1) (ECEC)
Calculated ECEC5 [Ca21 ]1 [Mg21 ]1 [K1 ]1 [Na1 ]1
[H1 ]1 [Al31 ]:
sum total of exchangeable cations that a soil can
adsorb on clays and organic matter
% Aluminum saturation (Alsat) Exchangeable Al: extraction
in 1 M KCl
[Al31 ]*100/ECEC: high levels of Al are toxic to
many plants, and most crops
Total nitrogen* % (N) Kjeldahl procedure Biologically fixed from atmosphere, essential
component of protein
Organic carbon* % (OC) Walkley–Black procedure Soil organic matter essential to tissue development,
increases CEC, and stimulates plant growth
Clay* (%) Sedimentation cylinder Texture can be used as a proxy for available
water holding capacity, which strongly affects
availability of nutrients and water stress on plants
*log (base 2) transformed for statistical analyses.
ECEC, effective cation exchange capacity; CEC, cation exchange capacity.
Table 1 Percentage of soil types in the study area
Brazilian classification* % study area US soil order
Latossolo Vermelho Alico (LVa) 31 Oxisol
Podzolico Vermelho-Amarelo Alico (PVa) 23 Ultisol
Latossolo Amarelo Alico (LAa) 12 Oxisol
Podzolico Vermelho-Escuro (PE) 8 Alfisol
Latossolo Vermelho-Amarelo Distrofico (LVd) 7 Oxisol
Podzolico Vermelho-Amarelo Eutrofico (Pve) 6 Alfisol
Cambissolo Alico (Ca) 4 Inceptisol
Subtotal 91%
Others o2% each
% study area % Rondonia % Amazonw
Oxisol 52 48 44
Ultisol 25 23 31
Alfisol 15 11 4
Inceptisol 5 7 2
Entisol 3 11 8
Total: 100 100 89
*Units simplified from EMBRAPA (1983) state soil map: almost all units are described as associations of soils. Only the dominant
soil is listed here.wEstimates from digitized EMBRAPA (1981) soil map of Brazil.
800 K . W. H O L M E S et al.
r 2004 Blackwell Publishing Ltd, Global Change Biology, 10, 796–814

Rondonia, although redistribution of nutrients and
elements from excreta and mineral salt supplements
by cattle can potentially affect soil profile measure-
ments collected at discrete locations (Dobermann et al.,
1995).
Remote sensing time series
Land-cover maps were classified from Landsat TM
images from 1996 for Porto Velho (P232, R66), Ar-
iquemes (P232, R67), Ji-Parana (P231, R67) and Luiza
(P231, R68) (Roberts et al., 2002). Spectral mixture
models decompose spectra measured from multiple
materials within the field of view of the instrument into
estimates of fractional cover for each material. The
mixture model was calculated for each Landsat TM
scene, using reference end members (spectra of known
materials) to produce four standardized images: shade,
green vegetation, nonphotosynthetic vegetation (litter,
branches, stems) and bare soil. These four fractions
were used to train a decision tree classifier which, after
several iterations of training, leads to a full classifica-
tion of land-cover types such as forest, pasture,
secondary growth, and water (Roberts et al., 2002). A
time series of classified images (Table 3) was used to
determine the approximate timing of deforestation in
each pixel, reported as a range of time between the last
date the pixel was classified as forest, and the first time
it was classified as deforested. The ages calculated for
the 1996 images are used as the ages of each pasture in
this study. By definition, forest pixels have a pasture
age of ‘0’. The accuracy of classification and timing of
deforestation depend on cloud-free images and good
georectification. These images were registered to the
Brazilian space agency 1998 and 1999 PRODES imagery
(INPE, 1999), and accuracy was tested using digital
airborne videography (Hess et al., 2002). The average
mismatch between the georectified Landsat image and
videography was less than two pixels, or 60 m. Neither
the remote sensing data nor the soil profile data are
perfectly georeferenced, and many sample locations
recorded as pasture sites were classified by the remote
sensing as nonpasture. We ensured correct identifica-
tion of land cover and pasture ages by applying a
variable size circle (buffer) around each soil pit
projected onto the classified images to capture approxi-
mately 8100 m2 (3 � 3 30 m pixels) of the Soteron-
identified land-cover type. The dominant pasture age
from the 3 � 3 pixel area was assigned to the soil pit. If
8100 m2 of the Soteron identified land-cover was not
found within a 180 m radius circle, the profile was not
included in the study.
Ancillary environmental data sets
The spatial variability of soil properties in the Amazon
region creates problems for extrapolating results from
plot-level studies to estimate effects over larger areas
(Richter & Babbar, 1991; Tomasella & Hodnett, 1998;
Elsenbeer et al., 1999). Soil diversity in Amazonia,
although recognized, has not been well documented or
Table 3 This time series of Landsat TM images classified for land cover was used to calculate pasture ages as of 1996
Scene
Image type* Years since forest clearing (pasture age)
Porto Velho Ariquemes Ji-Parana Luiza
Date P232, R66 P232, R67 P231, R67 P231, R68
1975 19 June MSSw 191 years
1978 August MSSz
1984 24 June TM 11–13 years
1986 16 July 13 October 13 October TM
1988 1 October 21 July 30 July 30 July TM 7–9 years
1989 24 July 2 August 2 August TM
1990 12 August 5 August 5 August TM
1991 12 June TM
1992 24 July 22 June 25 July TM 1–5 years
1993 7 October 7 October 28 July TM
1994 4 June TM
1995 25 July 3 August TM
1996 26 June 11 July 20 July 20 July TM
0 years (forest)
*MSS, multi-spectral scanner; TM, thematic mapper.wWRS-1, P249,R67.zWRS-1, P248, R67. Modified from Roberts et al. (2002).
R E G I O N A L S O I L B I O G E O C H E M I S T R Y A N A LY S I S 801
r 2004 Blackwell Publishing Ltd, Global Change Biology, 10, 796–814

Fig. 2 Averages of soil properties vs. pasture age. Error bars represent � one standard deviation.
802 K . W. H O L M E S et al.
r 2004 Blackwell Publishing Ltd, Global Change Biology, 10, 796–814

mapped at a high resolution (Richter & Babbar, 1991).
Projects like RADAM (at 1 : 1 000 000 scale: RADAM,
1978) and more recent soil mapping projects (EMBRA-
PA 1983, at 1 : 500 000) begin to address these issues.
However, the final map products are large scale and
categorical, which complicates estimates of quantitative
soil properties. The state soil and geologic maps
(EMBRAPA, 1983; CPRM, 1997), an interpolated grid
of average annual precipitation (Dunne, 1999), and
terrain attributes calculated from a digital elevation
model (SEDAM, 1999) were used to approximate
environmental gradients in the study area. Variables
with a large number of categories (soil type and
geology) were aggregated into fewer categories that
retained as much as possible of the information from
the original soil map pertinent to nutrient status. The
soil map was simplified to represent Soil Order as
defined by the US Soil Taxonomy (Table 1), which
explained more soil property variance than any other
simplified categories tested. The US Soil Taxonomy is
not focused specifically on tropical soil characteristics,
and other methods for stratifying soils classified in the
Brazilian system may be more effective than those used
here (e.g. Bernoux et al., 2002). The final soil classes are
Alfisols, Ultisols, and Oxisols and the relative mineral-
derived nutrient levels of these are moderate, low, and
very low, respectively. The geology categories represent
tectono-stratigraphic domains as defined by the Com-
panhia de Pesquisa de Recursos Minerais (CPRM:
geological survey) after integrated analysis of petrolo-
gic, petrographic, geochronologic, geophysical, and
structural data. Although generalized, the seven do-
mains delineate the nutrient-supplying capacity of
deeply weathered sediments overlying granites in the
Ariquemes/PortVelho Domain (APV), granites, meta-
morphosed granites and supracrustal rocks in the
Central Rondonia Domain (CR), and mixed ultrabasics
and granites in the Nova Brasilandia Domain (NB). We
expect to see very low, low, and moderate release of
base cations from the substrate in these three domains,
but it is important to recognize that the lithology in
Rondonia is extremely heterogeneous and the maps are
of bedrock, which is not necessarily equivalent to soil
parent material. Although aggregating units may
degrade the predictive power of the geology and soil
maps, there were too few soil samples for statistical
analysis using the original lithologic units once the data
set was stratified by pasture age plus geology or soils.
Statistical analyses
We addressed pasture soil changes through time using
extensive exploratory analysis with stratification, and
regression models of soil properties as a function of the
major soil forming factors (soil, geology, precipitation,
terrain, and land use). Exploratory analysis consisted of
graphical evaluation of average soil properties vs.
pasture age, including all samples (e.g. Fig. 2) and
subsets of data (e.g. Fig. 3). The subsets of data were
selected to accentuate the environmental variability in
the study area and approximate the pasture chronose-
quence research design at the regional scale. We used
multiple regression and several alternative model
specification tests to rigorously assess the relationship
between soil properties and pasture age. The regression
models allowed use of both categorical-scale and
continuous-scale explanatory variables as well as tests
of interaction effects. The resulting models permitted us
to rank the importance of pasture age relative to
regional environmental gradients.
Our methods are a departure from simple ANOVA
tests typically applied to this kind of problem. ANOVA
has been used to evaluate the importance of categorical
variables (such as soil types) on similar ecological data
(Reiners et al., 1994; Moore, 1995; Burt & Park, 1999;
McGrath et al., 2001), although the basic assumptions of
the technique (independent samples, normal sample
distribution, and constant variance) are often violated.
Regression analysis, unlike ANOVA, is capable of
evaluating the combined effects of several explanatory
variables on the property of interest and the interac-
tions among explanatory variables.
The regression models used in this paper are of the
general form:
Y ¼ aþ bX þ gZ þ dXZ þ e;
where Y is a continuous scale dependent variable, X is a
continuous scale covariate, Z is a categorical covariate
with c categories and c–1 parameters g, XZ is an
interaction, and e represents error. This framework
enabled us to include all potential driving factors and
their interactions in one model. Model evaluation and
specification involved two steps: (1) identifying the best
model and (2) determining the relative contribution of
each explanatory variable. The best regression models
were built in an interactive, non-automated stepwise
fashion (e.g. Table 4). The model statistics were
reassessed at every step to identify the best model in
terms of fit (explained variation) and parsimony.
Specifically, independent variables were evaluated
using either t-tests (continuous scale variables) or F-
tests (categorical scale variables) (Maddala, 1992), and
those with a P-value greater than 0.15 were omitted
from the model. The 0.15 cutoff was chosen to mitigate
Type II effects balanced against Type I effects.
Once the best model was constructed, the relative
contribution of each of the independent variables was
determined and ranked based on the P-values from
R E G I O N A L S O I L B I O G E O C H E M I S T R Y A N A LY S I S 803
r 2004 Blackwell Publishing Ltd, Global Change Biology, 10, 796–814

four specification tests (F-test, Likelihood Ratio, Wald
Score Test, and the Lagrange Multiplier). The standar-
dized regression coefficients do not convey information
about the relative contribution of the predictor vari-
ables when there is a mixture of categorical and
continuous variables and interactions included in the
regression model. The alternative is to rely on P-values
resulting from specification tests comparing a restricted
model to an unrestricted model. Each such test simply
removes the single continuous variable or group of
Fig. 3 Several subsets of the pH data showing changes in pH within different precipitation zones, rocktypes, soil types, and three
geographically isolated sites (see hashed areas on Fig. 1). APV5Ariquemes/Porto Velho geologic domain (includes Porto Velho subset);
CR5Central Rondonia domain (includes Ariquemes subset); NB5Nova Brasilandia domain (includes Luiza subset).
804 K . W. H O L M E S et al.
r 2004 Blackwell Publishing Ltd, Global Change Biology, 10, 796–814

categorical variables, and evaluates how much the
model suffers as a result. The most important explana-
tory variables will cause the largest deviation between
the restricted and unrestricted models. Only the F-test
is reported here for simplicity (Table 5A and 5B). S-plus
was used for all statistical calculations (MathSoft Inc.,
2000 Professional Version 3).
The soil mantle is continuous and can be measured at
any location in the landscape, but the available mea-
surements are at a fixed set of discrete locations. It is
possible that geographic proximity can explain similar-
ity among soil measurements, inflate standard correla-
tion coefficients, and complicate inference of parameter
estimates and model specification tests. Our analysis
does not take spatial correlation into account. Thus, it is
a first-order approach designed to evaluate regional soil
characteristics based on the most commonly used
statistical methods, rather than a comprehensive spatial
analysis. The classical statistical techniques employed
require both Gaussian sample distributions and sample
independence. Our analysis meets these criteria be-
cause: (1) we use a large number of randomly selected
observations, thereby satisfying the first criterion as
specified by the Central Limit Theorem, and through
distribution transformation and (2) according to Brus &
Gruijter (1997), regardless of spatial correlation among
soil properties, samples meet the independence re-
quirement if the sample locations are random.
Results and discussion
Mean changes in soil properties through time
Averaged soil properties graphed vs. pasture age show
irregular patterns following forest clearing and burn-
ing, and standard errors are large, often obscuring the
temporal signal (Fig. 2). Aluminum saturation, pH, and
phosphorus most closely reproduce the expected
patterns documented by chronosequence studies. The
standard deviations for these, and the rest of the soil
properties, are so large that forest and pasture are not
statistically separable, and the ranges of values for
pastures of different ages are indistinguishable. Percent
clay, which should not change following deforestation,
is higher in young pastures than old pastures, but the
two populations are not statistically distinct. We expect
the effect of land-cover changes to be attenuated with
depth in soil profiles, but found a weak trend in several
soil properties with pasture age in the deepest horizons.
If we accept that land-cover change does not affect the
soil at depth, there may be a difference in the
preclearing soil properties in pastures of different ages,
introducing a bias in our interpretations.
We minimized the effect of environmental conditions
on changes in soil properties by dividing the data into
more homogeneous subsets based on soil order,
geologic domain, and precipitation regime (Fig. 3). We
Table 4 Best regression model of surface horizon pH
Predictors
pH, surface horizons
b SE Prðjbj > 0Þ F-test Pr(F) Importance
(Intercept) 0.299 0.063 o0.001
Pasture age 1 0.184 0.153 0.230
2 �0.461 0.137 0.001 7.253 o0.001 2
3 0.312 0.116 0.008
4 �0.151 0.105 0.154
Precipitation �0.440 0.066 o0.001 15.963 o0.001 1
Soil Type 1 �0.243 0.063 o0.001 6.005 o0.001 3
Geology Type 2 0.203 0.055 o0.001 7.576 o0.001 4
Interactions Age (1) : Soil (1) 0.297 0.150 0.050
Age (2) : Soil (1) �0.190 0.136 0.164 3.533 0.008 5
Age (3) : Soil (1) �0.123 0.114 0.283
Age (4) : Soil (1) 0.121 0.105 0.252
Precip : Soil1 0.145 0.062 0.020 5.481 0.020 6
Precip : Geol2 �0.125 0.064 0.051 3.848 0.051 7
Resid SE df R2 Adjusted R2 F-test Pr(F)
Full model 0.667 210 0.491 0.460 15.604 0
b5 regression coefficient; SE5 standard error; Prðjbj > 0Þ5probability that the model coefficient is greater than zero;
importance5 ranking by its usefulness as a predictor of soil pH, 1 is most important. Final models for all other properties in the
surface and deepest horizons are available from [http://www.geog.ucsb.edu/�karen/holmes_regression_models.pdf].
R E G I O N A L S O I L B I O G E O C H E M I S T R Y A N A LY S I S 805
r 2004 Blackwell Publishing Ltd, Global Change Biology, 10, 796–814

present pH (in the surface horizon) for these examples
because it is a master variable indicative of many
aspects of soil chemistry, and controls the availability of
nutrients for plant uptake (Ludwig et al., 2001). As
discussed above for average pH values vs. pasture age,
most of the subsets followed the expected pattern of a
sudden increase in pH in young pastures followed by a
slow decline, remaining higher than forest soil levels.
Subsets by soil order show moderate pH in forest sites
for Alfisols and low pH in Oxisols (Fig. 3a). All young
pastures showed an increase in pH; in the Alfisol subset
pH declined as pastures aged, but in the Oxisol subset
pH peaked in intermediate to old pastures and
remained elevated above forest levels. Ultisols were
statistically indistinguishable from Alfisols and Oxisols.
Samples subset by geologic domain showed predictable
differences in forest pH: moderately high in rocks with
elevated base cation levels (NB), low in granitoid rocks
with reduced cation supply (CR), and lowest in
sedimentary cover depleted in primary minerals
(APV) (Fig. 3b). Plots of the data divided into subsets
of high and low annual precipitation (Fig. 3c) revealed
higher precipitation areas have lower pH, presumably
because of increased leaching intensity.
We hoped to approximate pasture chronosequence
studies by minimizing the within-site environmental
Table 5 Environmental predictors ranked by their ability to help explain variability in soil properties
Dependent variables
Predictors pH OC N P SumBase ECEC Alsat Ca Clay
(a) Surface horizon samples
Pasture age 2 4 1 1 1
Precip 1 1 2 1 3 2 1
Terrain 3
Soil 3 2 3 2 2 3
Geology 4 1 4 4
Interactions
Age : soil 5 4 5 4
Precip : soil 6 3 5 3 6
Precip : geol 7
Precip : rough 5
Geol : rough 2
Full model summary
Resid SE 0.67 1.01 1.01 0.89 0.73 0.95 0.62 0.72 0.91
df 210 224 221 218 214 222 213 215 220
R2 0.49 0.02 0.00 0.14 0.45 0.20 0.50 0.45 0.19
Adjusted R2 0.46 0.01 0.00 0.11 0.42 0.19 0.47 0.42 0.17
F-test 15.60 3.52 NA 4.98 15.86 19.07 17.85 17.45 10.35
Pr(F) 0.00E1 00 6.20E�02 NA 3.02E�05 0.00E1 00 4.84E�11 0.00E1 00 0.00E1 00 6.30E�09
(b) Deepest horizon samples
Pasture age 2 2 3 1
Precip 1 1 1 1 2 2
Terrain 3 1 4 1
Soil 3 2 2 3 4
Geology 2 1
Interactions
Precip : soil 4 3 5
Precip : rough 3
Full model summary
Resid SE 0.87 1.02 1.27 0.89 0.74 0.77 0.83 0.80 0.94
df 200 202 205 200 199 203 197 197 202
R2 0.23 0.09 0.05 0.09 0.42 0.26 0.31 0.39 0.13
Adjusted R2 0.20 0.08 0.04 0.07 0.39 0.24 0.28 0.36 0.11
F-test 9.82 5.27 10.64 3.48 20.20 23.28 9.78 13.90 7.33
Pr(F) 1.76E�09 4.69E�04 1.29E�03 2.71E�03 0.00E1 00 5.44E�13 2.46E�12 0.00E1 00 1.57E�05
See Tables 2 and 4 for explanations of abbreviations.
806 K . W. H O L M E S et al.
r 2004 Blackwell Publishing Ltd, Global Change Biology, 10, 796–814

variation, and evaluate the regional range of chronose-
quence dynamics by maximizing between-site varia-
tion. However, the samples stratified by only one
environmental factor did not account for the other
environmental gradients across the study area, nor
closely followed the expected temporal trends. To better
reproduce chronosequence results, we selected subsets
of data in three distinct geographic locations where a
range of pasture ages were found, and compared soil
changes through time (Fig. 3d–f, locations shown in
hashed areas in Fig. 1). The Porto Velho subset (Fig. 3d)
receives high annual rainfall (2300 mm yr�1), and
contains Oxisols formed in highly weathered sediments
(APV). There were too few data to evaluate the full
chronosequence, but in general pH was very low,
increased from forest to young pastures, and decreased
in older pastures. The Ariquemes subset (Fig. 3e)
receives 2250 mm yr�1 average precipitation, and con-
tains Alfisols and Ultisols formed in granitoid rocks
(CR). Alfisols peaked and declined in pH through time,
and Ultisols showed the opposite pattern. The Luiza
subset (Fig. 3f) receives the least rainfall (1900 mm
yr�1), and contains mostly Alfisols formed in high-base
status rocks (NB). Forest pH was high, pH increased in
young pastures, then declined to about the same level
as in the forest. This subset contained the largest
amount of data, and thus had smaller standard
deviations than the other two subsets.
Our initial assumption was the following: if the data
set were large enough, we would see statistical
differences among the different age pasture soils. We
found that environmental variability does affect soil
properties, and that stratifying the soil data using
available ancillary maps helped to isolate the effect of
pasture age. Geology, soil type, and precipitation
regime successfully reduced the standard deviation in
pH data, and differences among the stratified subsets
are interpretable based on general soil development
principles. All sites showed an increase in pH following
deforestation and pasture establishment resulting from
the rapid incorporation of readily available base cations
from burned biomass. Soil data from the higher fertility
soil and geology types (Alfisol and NB) followed the
characteristic pattern of pH increase in young pastures
and slow decline. In contrast, at lower fertility sites pH
increased at approximately the same rates, but peaked
later (in 6–9-year-old pastures), and remained elevated.
This might be explained as ‘leaky’ biological cycling in
higher fertility soils permitting base cations to leach
from the profile, while in low nutrient soils a larger
percentage of base cations are retained in the zone of
biological influence (Jobbagy & Jackson, 2001). As
another example, pH decreases from the low rainfall
zone to higher rainfall zones, as we would predict
because high rainfall flushes exchangeable cations from
the profile, lowering pH (Brady & Weil, 1999). How-
ever, stratification reduces the sample to so few data
that it becomes difficult to statistically distinguish the
temporal signal from random noise. Taking the arith-
metic mean of soil properties is an easy, common way
to calculate regional estimates, but it pools data values
regardless of differing environmental conditions, and
stratification further reduces the number of samples
used in the calculation. Even using one of the largest
databases available for the Amazon, the complexity of
the system under study demands more detailed data
collection to successfully use this approach.
Land-cover change vs. environmental gradients
In contrast to relying on stratification and global
statistics for analyzing trends, multiple regression
allowed us to model soil properties as a function of
pasture age and environmental variables using the full
data set, and take into account interactions among the
independent variables. Although there is no reason to
assume linear dependence of soil properties on envir-
onmental gradients, multiple regression is likely to
identify first-order relationships among soil properties
and the environmental data sets chosen as proxies for
the conditions controlling soil nutrient dynamics.
However, specific model coefficients may have little
physical meaning. In surface horizons, the models
explained 40–50% of the total variance for some
variables (pH, SumBase, Alsat, CA, USA), 10–20% for
others (ECEC, clay%, P), and none of the variance for
OC and N (Table 5a). The regression models explained
much less of the overall variance for the deepest
horizons (Table 5b). These samples span a wide variety
of genetic horizons (e.g. A2, Bw, AB, Bt, C, etc.), which
adds considerable variability to the measured values
and affects statistical relationships among deepest
horizon samples. Therefore, we focus only on the effect
of pasture age relative to other environmental variables
for the deepest horizon data set, rather than assessing
the magnitudes and direction of changes in chemistry.
Variables strongly controlled by biological cycling
were difficult to model (OC, N, P to some extent), while
those more directly affected by substrate characteristics
and environmental gradients were modeled more
successfully (pH, CEC, SumBase, Alsat, Clay, �P)
(Table 5b). Land management, timing of sampling,
and sample treatment affect OC and N values, so the
inability to model these two variables without detailed
field descriptions is understandable (Neill & Davidson,
2000; Post & Kwon, 2000). The strong correlations
among pH, Ca, SumBase, and Alsat (Table 6) indicate
that calcium probably dominates soil solution buffering
R E G I O N A L S O I L B I O G E O C H E M I S T R Y A N A LY S I S 807
r 2004 Blackwell Publishing Ltd, Global Change Biology, 10, 796–814

at moderate to high pH (45), while aluminum buffers
at low pH (o5). All of these variables were modeled
fairly successfully with the proxies chosen to represent
large-scale environmental gradients. Phosphorus, which
is ultimately derived from minerals and is a highly
limiting nutrient for plant growth in the tropics
(Vitousek, 1984) is modeled moderately well, perhaps
reflecting a regional environmental gradient overprinted
by localized biological cycling. Percent clay was also
only moderately well explained by regression model-
ing, which may be a result of small-scale variability in
topographic position and geomorphic processes, which
affect both sedimentary facies and pedogenic clay
formation (Lips & Duivenvoorden, 1996, Adam, 2001).
Clay content should not be affected by pasture age, nor
was any correlation found. As expected, there were
covariations among percent clay, geology, precipitation,
and terrain.
The summary statistics from the regression models
are useful for evaluating overall reduction in variance
of the modeled data. The regression model also yields
pasture age parameter estimates comparable with
results from pasture chronosequence studies. Recall
that pasture age was defined from binary maps of
forest/nonforest, which necessitated binning samples
into coarse age categories. In theory, time elapsed since
pasture establishment would be a continuous variable,
but gaps in the satellite image time series dictated our
treatment of pasture age as categorical. Pasture age was
a significant predictor for most surface soil properties,
but the magnitude and direction of change through
time did not follow the expected patterns, as illustrated
by comparison with two pasture chronosequences from
Rondonia (Table 5a; Fig. 4). The pasture chronose-
quence data were collected for detailed biogeochemical
process research (Moraes et al., 1996; Garcia-Montiel
et al., 2000), and the analyses for the two chronose-
quences were simply averaged for each of our pasture
age categories. These are an example of the expected
trend, rather than a generic model for changes in
pasture soils following deforestation. The regression
model coefficients for SumBase and Ca increased in
young pastures, decreased sharply, increased, and
decreased again in old pastures. The trajectory for pH
was the same, although there was a slight decrease
from forest to young pastures. The intercept coefficient
for pH reflects the contribution of the forest category
plus one category of soil and geology, the other
categorical scale variables in the model. The Alsat
pattern was the inverse, as predicted from the balance
between base-forming cations and hydrogen and
aluminum which buffers soil pH (Brady & Weil,
1999). Phosphorus decreased in young pastures then
steadily increased, and decreased again in old pastures.
The confidence intervals show the 10% significance
level for each regression coefficient. When the x-axis
falls within the plotted confidence intervals, the null
hypothesis (H05 regression coefficients are equal to
zero) cannot be rejected. We used the 10% significance
level rather than the typical 5% for two reasons: (1) the
number of samples was limited, and (2) to reduce the
possibility of a Type II statistical error – failing to reject
Table 6 Correlation coefficients for soil properties and continuous field environmental variables (terrain attributes and
precipitation
pH Al-Sat P Ca ECEC Sum base Clay (%) N OC Elev. Slope Rough CTI Precip
pH 1
Al-Sat �0.81 1
Phosphorus 0.42 �0.22 1
Calcium 0.84 �0.82 0.39 1
ECEC 0.62 �0.41 0.5 0.82 1
SumBases 0.83 �0.79 0.42 0.99 0.86 1
Clay % �0.26 0.34 �0.06 �0.11 0.18 �0.09 1
Nitrogen 0.04 0.02 0.36 0.22 0.44 0.25 0.31 1
OC 0.05 0.01 0.36 0.28 0.52 0.32 0.35 0.9 1
Elevation 0.48 �0.45 0.21 0.52 0.41 0.52 �0.16 0 0.05 1
Slope 0.11 �0.1 0.01 0.1 0.07 0.1 �0.08 �0.03 �0.03 0.24 1
Roughness* 0.29 �0.31 0.03 0.29 0.18 0.29 �0.21 �0.03 �0.06 0.43 0.5 1
CTIw �0.12 0.06 �0.09 �0.14 �0.16 �0.14 0.03 0.04 0.04 �0.3 �0.57 �0.27 1
Precip �0.48 0.42 �0.24 �0.5 �0.42 �0.52 0.23 0.01 �0.06 �0.78 �0.09 �0.32 0.15 1
*Roughness5 standard deviation of elevation within a 10 km radius circle.wCTI5 soil wetness index: ln(specific catchment area/tan(slope angle)).
ECEC, effective cation exchange capacity, OC, organic carbon.
808 K . W. H O L M E S et al.
r 2004 Blackwell Publishing Ltd, Global Change Biology, 10, 796–814

a false null hypothesis. There is no clear explanation for
the lack of a pasture-age signal in the regression
coefficients.
Because all the factors that might control soil
properties were included as explanatory variables, their
relative importance for estimating soil properties could
be ranked using the F-test and its P-value. The
coefficients were standardized to allow comparison
among variables with different measurement units.
Pasture age was the most important predictor for
SumBase, Alsat, and Ca, second for pH, and fourth
for phosphorus. Interactions between pasture age and
soil type were significant for pH, Sumbase, Alsat, and
Ca. Pasture age was less important as a predictor in the
Fore
st
1–5
year
s
7–9
year
s
11–1
3 ye
ars
19 +
yea
rs
pH
-1.5
-1
-0.5
0
0.5
1
1.5
Ca
PAlsat
-1.5
-1
-0.5
0
0.5
1
1.5
Stan
dard
ized
reg
ress
ion
coef
fici
ents
Fore
st
1–5
year
s
7–9
year
s
11–1
3 ye
ars
19 +
yea
rs
Chronosequence 1Chronosequence 2Range between chronos
Modeled temporal trend
Model 90% conf. interval
Sum Base
-1 .5
-1
-0 .5
0
0.5
1
1.5
Fig. 4 Pasture age regression coefficients from each ‘best’ model for pH, SumBases, Ca, P, and Alsat, plotted with measurements from
two pasture chronosequences in Rondonia (Garcia-Montiel et al., 2000 and Moraes et al., 1996) to illustrate differences between the
modeled and expected trends. The chronosequence values were standardized and the range between the two shaded dark grey. As
noted in the main text, the regression models are of the form: Y ¼ aþ bX þ g1Z1 þ g2Z2 þ � � � þ g4Z4 þ dXZ þ e; where Z1 through Z4 are
indicator variables for pasture age. The omitted category is forest. Error bars represent the 90% confidence interval.
R E G I O N A L S O I L B I O G E O C H E M I S T R Y A N A LY S I S 809
r 2004 Blackwell Publishing Ltd, Global Change Biology, 10, 796–814

deepest soil horizons, supporting detailed field studies
that show the effects on nutrient properties from
pasture establishment do not penetrate deep in the soil
profile. Soil Order, a proxy for environmental gradients
as they relate to soil development, had some predictive
value for deepest horizon soil properties, but explained
less variance than either precipitation or pasture age.
Precipitation was by far the best predictor in both the
surface and deepest horizons. Surface horizon devel-
opment is strongly influenced by the amount of water
available for mineral weathering and leaching. The
dense grass roots in pasture soils dominate nutrient
cycling in the surface horizon, retaining limited
nutrients and allowing excess or less essential elements
to pass (Jobbagy & Jackson, 2001), while subsurface
horizons often grade into the parent material. Based on
this logic, we expected pasture age to be a dominant
determinant of surface horizon properties, and geology
to correlate more strongly with soil properties in the
deepest horizons. While we found pasture age is
indeed a strong predictor of surface horizon soil
properties and has less explanatory power at depth,
lithology explained little to none of the soil property
variance. This implies that a precipitation map is a
better predictor of soil surface and subsurface proper-
ties than a simplified soil or geology map, which could
have important implications for researchers using
available maps to extrapolate results from field sites
to larger regions.
Potential sources of error
Although we found significant correlation among
environmental drivers of soil processes and soil
properties, interpreting causality from these analyses
is complicated by the natural variability of soil forming
conditions and other considerations common to data-
base studies. These include the appropriateness of
available laboratory analyses, data location georeferen-
cing, spatial correlation among data values, correlation
among the environmental variables assumed to be
independent, the combination of data sets with differ-
ent resolutions, and sample support.
We relied on a previously assembled agricultural
database to explore research questions regarding soil
biogeochemistry. Consequently, the laboratory analyses
included were restricted to the methods previously
chosen to characterize basic soil fertility for arable
crops. Few resources were expended to run analyses
essential for Brazilian soil classification (i.e. determina-
tion of extractable silica and iron), or measures for
evaluating biogeochemical processes (bulk density,
different pools of N, C, P (Tiessen et al., 1994)). In fact,
many of the standard chemical extraction techniques
used to quantify soil nutrients were developed in
temperate climates, and may not be accurate indicators
for tropical ecosystem productivity (Silver, 1994).
Although databases can offer a large sample popula-
tion, they are not necessarily adequate for addressing
specific research questions.
The suitability of a database for a particular study is
also impacted by the locations where soils were
collected. Soil property levels are rarely homogeneous
over an area, nor is soil sampling truly random. The
appropriateness of averaging data over an area (block)
is dependent on the number of measurements and their
spatial distribution (Goovaerts, 1998). Locating sample
points within a block depends on careful georeferen-
cing to permit overlays of data from different sources,
such as soil profile data with ancillary maps or remote
sensing images. The poor match between Soteron data
and the remotely sensed time series forced the removal
of a large number of viable data, greatly reducing the
number of observations used in this study. In future
studies, this will be less problematic because hand-held
GPS units are much more reliable now than they were
in 1996–1997 when the data for Soteron were collected,
as selective availability has been turned off (National
Geodetic Survey, 2000).
Another potential bias inherited from databases is the
layout or spatial distribution of the samples. In the case
of Rondonia, correlation between soil fertility and
patterns of deforestation may bias the pasture age
relationships observed: high-fertility areas may have
been settled early and more densely than low-fertility
areas, leading to a more developed road network for
future settlement in the more fertile areas. This could
mean (1) there are more pastures in these regions, (2)
older pastures have higher natural soil fertility, and
(3) more samples were taken from these areas because
of easier access. Spatial correlation is a very real
problem in any study where classical statistical tech-
niques are applied to environmental data. In order to
reduce the possibility of a Type II error in our model
results, we constructed a 90% confidence interval
to test whether the regression coefficients for pasture
age were significantly different from zero (Fig. 4).
However, if there is strong spatial correlation among
the predictor variables, our inference tests may be
invalid.
We investigated one such case of dependence in the
predictor variables, namely the possibility that pasture
age was highly correlated with Soil Order. We
performed a simple overlay analysis using the pasture
age maps from remote sensing and the state soil map.
Indeed, a larger proportion of higher fertility soils were
converted to pasture early in the colonization move-
ment. In the oldest pasture age category (191 years),
810 K . W. H O L M E S et al.
r 2004 Blackwell Publishing Ltd, Global Change Biology, 10, 796–814

36% of pastures were established on Alfisols, 29% on
Ultisols, and 35% on Oxisols. However, in the 1–5-year
old pastures, only 20% of pastures were on Alfisols, and
25% on Ultisols, while the majority of pastures
established were on Oxisols (50%). This implies a
relationship between two of the explanatory variables,
which may influence the model results. Although some
spatial dependence may exist in the model, stability
tests suggest that it is not serious at the 5% significance
level. Spatial continuity of environmental phenomenon
is to be expected, but is not handled well by classical
statistical methods.
The natural correlations among predictor variables
can potentially impact statistical modeling, but the
ability to directly compare these data sets may be of
greater concern. Each of the data sets used in this
analysis represents a different spatial resolution or
scale, from the soil profile data (virtually point data), to
the remote sensing images (30 m pixels), soil map
(1 : 500 000), geology map (1 : 1 000 000), and precipita-
tion grid (0.5 degree pixels). In the Amazon, few
options exist for selection of specific map resolution
and sample density. Effects of mixing data collected or
reported at different resolutions has been addressed in
some areas where more data are available (Davidson &
Lefebvre, 1993), and are discussed along with the issue
of data aggregation below.
We evaluated whether a large soil profile database
combined with land-cover maps from remote sensing
could be used to quantify regional changes in soil
properties directly from primary field data, thereby
avoiding errors from extrapolation or other means of
aggregating data collected at point locations. While we
could reproduce large-scale patterns, we were unable to
reproduce patterns in nutrients strongly controlled by
spatially heterogeneous processes or the temporal
sequence of soil property changes we expected based
on chronosequence studies. It is evident that careful
aggregation of data is extremely important to account
for changes in the area represented by each sample
(sample support), even when working with a seemingly
large number of soil measurements. For Soteron,
samples from one auger core were collected at each
location, but each sample is assumed to represent an
area (field, hectare, soil map unit, grid cell) rather than
the small volume actually sampled. For agricultural soil
fertility testing, multiple samples at each site are often
mixed to better characterize field conditions (i.e.
composite sampling); but even this approach requires
a qualitative decision concerning local soil heterogene-
ity and the number and layout of samples necessary to
characterize the area. Methods for point-to-block soil
property aggregation are discussed in detail in the
literature (Rastetter et al., 1992; Wessman, 1992; Paus-
tian et al., 1997; Heuvelink & Pebesma, 1999), although
most rely on an assumption of linearity, or the ability to
mathematically model the processes controlling prop-
erty distribution. Some authors have refused to extra-
polate their field research results on the grounds that
local soil variability was extremely high, and the
properties of interest decidedly nonlinear (Elsenbeer
et al., 1999). However, regional and block soil property
estimates are essential for understanding the processes
controlling large-scale soil nutrient distribution, and the
potential feed backs that human activities may cause. It
is important that researchers using primary soil data for
regional estimates and models are aware of the
difficulties inherent in independently collected data.
Conclusions
Biogeochemical analysis over a broad range of environ-
mental conditions is essential for understanding regional
impacts of land-cover change (Neill et al., 1997a; McGrath
et al., 2001; Powers & Schlesinger, 2002). However, the high
costs of procuring suitable regional data limits the sample
size of most databases, making traditional approaches to
data analysis unreliable at the regional scale. Existing soil
databases offer the potential for exploring regional soil
ecosystem behavior, but have inherent problems, some of
which have been illustrated here.
If we were to interpret our analyses without deferring
to field chronosequence results, we would declare that
although pasture age is a useful predictor for some soil
properties, there is no clear trend in soil nutrient
behavior following forest clearing and pasture estab-
lishment. Similar results were reported in two other
regional Amazonian studies (Neill & Davidson, 2000;
McGrath et al., 2001). The fact that several independent
analyses determined no predictable temporal change in
regional soil nutrient status raises an important ques-
tion: Is there a particular spatial resolution at which the
controls on nutrient stocks determined at the local scale
no longer are useful for estimating regional concentra-
tions? Models based on mechanistic understanding
derived from carefully controlled chronosequence
studies make reasonably good predictions of the effects
of land-use change at local scales. However, these
models are likely to predict changes in soil properties
that are small relative to the spatial heterogeneity
caused by geomorphic and climatic processes acting at
local to larger spatial scales. The scale at which
management-induced changes occur is more detailed
than even the highest resolution soil maps available.
Therefore, the chronosequence models are not likely to
produce spatially explicit maps of changes in soil
properties that can be validated by regional soil
mapping and reconnaissance, regardless of whether
R E G I O N A L S O I L B I O G E O C H E M I S T R Y A N A LY S I S 811
r 2004 Blackwell Publishing Ltd, Global Change Biology, 10, 796–814
the model correctly represents soil biogeochemical
response to land-cover change.
Soil and ecosystem processes are controlled through
complex interactions of environmental variables which
models can only approximate. Theoretically, the gap
between modeling at the local level and the regional
scale should be reduced by using a regional database
informed by knowledge gained through local process
studies. We searched for regional trends similar to those
determined in local studies using a database composed
of soil profiles collected at discrete locations combined
with a remotely sensed land-cover time series, but we
were unable to reproduce the expected results. How-
ever, these profiles have been affected by localized
processes, which are poorly represented in regional
databases. For exactly this reason, researchers tradi-
tionally rely on carefully controlled local field studies to
tease apart the effect of complex environmental inter-
actions on ecosystem functioning. Our results lead us to
believe that there is a fundamental difference between
models constructed at the local and regional scales
which cannot be overcome by simply utilizing a large
regional sample population to approximate region-
wide local conditions. Locally derived physical models
may not be appropriate when applied at the regional
scale, and conversely, regional soil nutrient models may
not be reliable when constructed directly from point
data, rather than sample support appropriate to the
model resolution. In the future, regional modeling
could be enhanced by broadening sample support
using sample aggregation techniques, improved repre-
sentations of environmental conditions, and application
of geostatistical techniques that explicitly include
spatial correlation in the modeling process.
Acknowledgements
This work was supported by NASA Headquarters under EarthSystem Science Fellowship Grant NGT5-30357 and LBA EcologyGrant NCC5-282. Jaime Scandolara (CPRM, Porto Velho)supplied invaluable advice in classifying rock types in termsof weathering derived nutrient supply. The manuscript wasgreatly improved by the input from Nick Nagle and RebeccaPowell at UCSB, editorial assistance from Eric Davidson, and thecomments of several anonymous reviewers. We thank SEPLAN/PNUD for making the SOTERON database available toresearchers.
References
Adam K (2001) Soil–landscape relationship in Rondonia, Brazil.
Master’s thesis, Bern University, Bern, Switzerland, 60 pp.
Bernoux M, Carvalho MCS, Volkoff B et al. (2002) Brazil’s soil
carbon stocks. Soil Science Society of America Journal, 66, 888–
896.
Brady NC, Weil RR (1999) The Nature and Properties of Soils.
Prentice-Hall, Inc., Upper Saddle River, NJ.
Brus DJ, de Gruijter JJ (1997) Random sampling or geostatistical
modelling? Choosing between design-based and model-based
sampling strategies for soil (with Discussion). Geoderma, 80, 1–
59.
Burt TP, Park SJ (1999) The distribution of solute processes on an
acid hillslope and the delivery of solutes to a stream: I.
Exchangeable bases. Earth Surface Processes and Landforms, 24,
781–797.
Chadwick O, Derry L, Vitousek P et al. (1999) Changing sources
of nutrients during four million years of ecosystem develop-
ment. Nature, 397, 491–497.
Cochrane TT (1998) SIGTERON: Sistema de informacao geografica
para os terrenos e solos do estado de Rondonia, Brasil. Completed
by the consultancy consortium TECNOSOLO-DHV, Porto
Velho, Rondonia.
CPRM (1997) Mapa Geologico do Estado de Rondonia, Porto
Velho, RO.
Cramer W, Kicklighter DW, Bondeau A et al. (1999) Comparing
global models of terrestrial net primary productivity (NPP):
overview and key results. Global Change Biology, 5, 1–15.
Davidson EA, Lefebvre PA (1993) Estimating regional carbon
stocks and spatially covarying edaphic factors using soil maps
at three scales. Biogeochemistry, 22, 107–131.
Davidson EA, Trumbore SE, Amundson R (2000) Soil warming
and organic carbon content. Nature, 408, 789–790.
Dobermann A, Goovaerts P, George T (1995) Sources of soil
variation in an acid Ultisol of the Philippines. Geoderma, 68,
173–191.
Dunne T (1999) Amazon River Basin Precipitation 1972–1992.
Available on-line [http://www.daac.ornl.gov] from Oak
Ridge National Laboratory Distributed Active Archive Center,
Oak Ridge, Tennessee, USA, Data set.
Dunne KA, Willmott CJ (1996) Global distribution of plant-
extractable water capacity of soil. International Journal of
Climatology, 16, 841–859.
Elsenbeer H, Newton BE, Dunne T et al. (1999) Soil hydraulic
conductivities of latosols under pasture, forest and teak in
Rondonia, Brazil. Hydrological Processes, 13, 1417–1422.
EMBRAPA (1981) Mapa de Solos do Brasil, escala 1:5,000,000.
Servico Nacional de Levantamento e Conservacao de Solos,
Rio de Janeiro. Available on-line [http://grid2.cr.usgs.gov/
datasets/datalist.php3] from UNEP/GRID – hosted by US
Geological Survey Data Center, Sioux Falls, North Dakota,
USA.
EMBRAPA (1983) Mapa de levantamento de reconhecimento de
meia intensidade dos solos do estado de Rondonia, 1:500 000.
Comissao Estadual de Planejamento Agrıcola, Porto Velho.
Fearnside PM (1993) Deforestation in Brazilian Amazonia: the
effect of population and land tenure. Ambio, 22, 537–545.
Garcia-Montiel DC, Neill C, Melillo J et al. (2000) Soil
phosphorus transformations following forest clearing for
pasture in the Brazilian Amazon. Soil Science Society of America
Journal, 64, 1792–1804.
Giardina CP, Ryan MG (2000) Evidence that decomposition rates
or organic carbon in mineral soil do not vary with
temperature. Nature, 404, 858–861.
812 K . W. H O L M E S et al.
r 2004 Blackwell Publishing Ltd, Global Change Biology, 10, 796–814

Goovaerts P (1998) Regional estimation of soil properties from
local observations. In: Proceedings of the Soil Quality Workshop,
January 30–31, pp. 51–58. Alberta Agriculture Food, and Rural
Development, Edmonton, Alberta.
Hess LL, Novo EMLM, Slaymaker DM (2002) Geocoded digital
videography for validation of land-cover mapping in the
Amazon Basin. International Journal of Remote Sensing, 23,
1527–1555.
Heuvelink GBM, Pebesma EJ (1999) Spatial aggregation and soil
process modelling. Geoderma, 89, 47–65.
INPE (1999) PRODES project, conducted under the Amazon
Institutional Program. Available on-line: [http://www.grid.
inpe.br/amz/prodes2000/]. Last accessed November, 2002.
Jobbagy EG, Jackson RB (2001) The distribution of soil nutrients
with depth: global patterns and the imprint of plants.
Biogeochemistry, 53, 51–77.
King AW (1990) Translating models across scales in the land-
scape. In: Quantitative Methods in Landscape Ecology (eds Turner
MG, Gardner RH), pp. 479–517. Springer-Verlag, New York.
Lips JM, Duivenvoorden JF (1996) Regional patterns of well
drained upland soil differentiation in the middle Caqueta
basin of Colombian Amazonia. Geoderma, 72, 219–257.
Ludwig B, Khanna PK, Anurugsa B et al. (2001) Assessment of
cation and anion exchange and pH buffering in an Amazonian
Ultisol. Geoderma, 102, 27–40.
Maddala GS (1992) Introduction to Econometrics. MacMillan
Publishing Company, New York.
McGrath DA, Smith CK, Gholz HL et al. (2001) Effects of land-
use change on soil nutrient dynamics in Amazonia. Ecosys-
tems, 4, 625–645.
Moore DS (1995) The Basic Practice of Statistics. W.H. Freeman
and Company, New York.
Moraes JFL, Volkoff B, Cerri CC et al. (1996) Soil properties
under Amazon forest and changes due to pasture installation
in Rondonia, Brazil. Geoderma, 70, 63–81.
National Geodetic Survey (2000) Removal of GPS selective
availability (SA) accuracy comparisons. Available on-line
[http://www.ngs.noaa.gov/FGCS/info/sans_SA/] from the
Federal Geographic Data Committee and GPS Interagency
Advisory Council, USGS, Reston Virginia, USA.
Neill C, Davidson EA (2000) Soil carbon accumulation or loss
following deforestation for pasture. In: Global Climate Change
and Tropical Ecosystems (eds Lal R, Kimble JM, Stewart BA), pp.
197–211. CRC Press, Boca Raton, FL, USA.
Neill C, Melilllo JM, Steudler PA et al. (1997a) Soil carbon and
nitrogen stocks following forest clearing for pasture in the
southwestern Brazilian Amazon. Ecological Applications, 7,
1216–1225.
Neill C, Piccolo MC, Cerri CC et al. (1997b) Net nitrogen
mineralization and net nitrification rates in soils following
deforestation for pasture across the southwestern Brazilian
Amazon Basin landscape. Oecologia, 110, 243–252.
Numata I (1999) Analise cronossequencial da fertilidade e compacta-
cao do solo em areas de pastagem na Amazonia. MS thesis,
Departamento de Sensoriamento Remoto, Instituto Nacional
de Pesquisas Espaciais, Sao Jose dos Campos.
Numata I, Soares JV, Roberts DA et al. (2003) Relationships
among soil fertility dynamics and remotely sensed measures
across pasture chronosequences in Rondonia, Brazil. Remote
Sensing of the Environment, 87, 446–455.
Paustian K, Levine E, Post WM et al. (1997) The use of models to
integrate information and understanding of soil C at the
regional scale. Geoderma, 79, 227–260.
Post WM, Kwon KC (2000) Soil carbon sequestration and land-
use change: processes and potential. Global Change Biology, 6,
317–328.
Potter CS, Davidson EA, Klooster SA et al. (1998) Regional
application of an ecosystem production model for studies of
biogeochemistry in Brazilian Amazonia. Global Change Biology,
4, 315–333.
Powers JS, Schlesinger WH (2002) Relationships among soil
carbon distributions and biophysical factors at nested spatial
scales in rain forests of northeastern Costa Rica. Geoderma, 109,
165–190.
Prince SD, Steininger MK (1999) Biophysical stratification of the
Amazon basin. Global Change Biology, 5, 1–22.
RADAM (1978) Mapa exploratorio de solos. Projeto Radambra-
sil: Programa de Integracao Nacional, 1:1,000,000. Ministerio
das Minas e Energia, Departamento Nacional de Producao,
Rio de Janeiro.
Rastetter EB, King AW, Cosby BJ et al. (1992) Aggregating fine-
scale ecological knowledge to model coarser-scale attributes of
ecosystems. Ecological Applications, 2, 55–70.
Reiners WA, Bouwman AF, Parons WFJ et al. (1994) Tropical rain
forest conversion to pasture: changes in vegetation and soil
properties. Ecological Applications, 4, 363–377.
Reynolds CA, Jackson TJ, Rawls WJ (2000) Estimating soil water-
holding capacities by linking the Food and Agriculture
Organization soil map of the world with global pedon
databases and continuous pedotransfer functions. Water
Resources Research, 36, 3653–3662.
Richter DD, Babbar LI (1991) Soil diversity in the tropics.
Advances in Ecological Research, 21, 315–389.
Roberts DA, Numata I, Holmes KW et al. (2002) Large area
mapping of land-cover change in Rondonia using multi-
temporal spectral mixture analysis and decision tree classi-
fiers. JGR-C. Atmospheres, 107, 8073.
Rosolen V (2000) Transformacao de uma cobertura laterıtica por
hidromorfia: Estudo de uma topossequencia da Amazonia Brasileira
(Humaita – AM). PhD dissertation, Universidade de Sao Paulo,
Sao Paulo, Brasil, 201 pp.
Scandolara J (1999) Geologia e recursos minerais do Estado de
Rondonia: texto explicativo e mapa geologico do Estado de
Rondonia. CPRM, Brasılia.
Schneider RR, Arima E, Verissimo A et al. (2000) Sustainable
Amazon: Limitations and Opportunities for Rural Develop-
ment, World Bank and Imazon, Brasilia, 61 pp.
SEDAM (1999) Digital Terrain Model. Secretaria do Meio
Ambiente, Porto Velho, RO.
Silver WL (1994) Is nutrient availability related to plant nutrient
use in humid tropical forests? Oecologia, 98, 336–343.
Teixeira LB, Serrao EAS, Teixeira Neto JF (1997) Pastagens
cultivadas na Amazonia: sustentabilidade e sua relacao com a
fertilidade do solo. In: Reuniao Brasileira de Fertilidade do Solo e
Nutricao de Plantas (ed. Sociedade Brasileira de Ciencia do
R E G I O N A L S O I L B I O G E O C H E M I S T R Y A N A LY S I S 813
r 2004 Blackwell Publishing Ltd, Global Change Biology, 10, 796–814

Solo), pp. 43–78. Editora da Universidade do Amazonas,
Manaus.
Tiessen H, Cuevas E, Chacon P (1994) The role of soil organic
matter in sustaining soil fertility. Nature, 371, 783–785.
Tomasella J, Hodnett MG (1998) Estimating soil water retention
characteristics from limited data in Brazilian Amazonia. Soil
Science, 163, 190–202.
Vitousek PM (1984) Litterfall, nutrient cycling, and nutrient
limitation in tropical forests. Ecology, 65, 285–298.
Vitousek PM, Chadwick OA, Mattson P et al. (2003) Erosion and
the rejuvenation of weathering derived nutrient supply in an
old tropical landscape. Ecosystems, 6, 762–772.
Walker R, Homma AKO (1996) Land use and land cover
dynamics in the Brazilian Amazon: an overview. Ecological
Economics, 18, 67–80.
Wessman CA (1992) Spatial scales and global change: bridging
the gap from plots to GCM cells. Annual Review of Ecology and
Systematics, 23, 175–200.
814 K . W. H O L M E S et al.
r 2004 Blackwell Publishing Ltd, Global Change Biology, 10, 796–814


![Apparel-Oriented Anthropometric Database of Colombian ...• International Standard ISO 15535: General requirements for establishing anthropometric databases [6]. • International](https://img.dokumen.tips/doc/110x75/6132a61bdfd10f4dd73a9633/apparel-oriented-anthropometric-database-of-colombian-a-international-standard.jpg)