Embed Size (px)
Citation preview

environment and ecology
Cien. Inv. Agr. 38(2):277-289. 2011www.rcia.uc.cl
Introduction
Pinus radiata D. Don is the most widely plant-ed forest species in the Southern Hemisphere (Lewis and Ferguson, 1993). Its predominance
is attributable to a higher productivity, greater adaptability to soil and environmental condi-tions, better response to tree breeding and sil-viculture, and a wider end-use range than most other plantation species (Turner and Lambert, 1986, Cown, 1997).
In New Zealand, P. radiata plantations have commonly been reported to be nutrient-limited
research paper
Soil C/N influences the carbon flux and partitioning in control and fertilized mini-plots of Pinus radiata in New Zealand
Horacio E. Bown1, Michael S. Watt2, Peter W. Clinton2, and Euan G. Mason3
1Facultad de Ciencias Forestales, Universidad de Chile, Casilla 9206, Santiago, Chile.2Scion Research, PO Box 29237, Christchurch, New Zealand.
3School of Forestry, University of Canterbury, Private Bag 4800, Christchurch, New Zealand.
Abstract
H.E. Bown, M.S. Watt, P.W. Clinton, and E.G. Mason. 2011. Soil C/N influences carbon flux and partitioning in control and fertilized mini-plots of Pinus radiata in New Zealand. Cien. Inv. Agr. 38(2): 277-289. Patterns of carbon flux and partitioning were examined in highly stocked (40,000 stems ha-1) control and fertilized mini-plots of Pinus radiata D. Don at five sites, which covered a wide climatic and edaphic gradient on the South Island of New Zealand. The gross-primary productivity (GPP) and the partitioning of the GPP to the above- and below-ground productivity and respiration were determined using a carbon budget approach. All of the components of the GPP, the above-ground net primary productivity (ANPP [r2 = 0.67, P ≤ 0.01]), above-ground plant respiration (APR [r2 = 0.66, P ≤ 0.01]), and total below-ground carbon flux (TBCF [r2 = 0.41, P ≤ 0.01]) significantly increased with the GPP, but the ANPP:GPP, APR:GPP and TBCF:GPP ratios were not significantly correlated to the GPP (P > 0.41). The TBCF:GPP ratio significantly increased with the soil C:N ratio (r2 = 0.93, P ≤ 0.01), with a concomitant decrease in the APR:GPP ratio (r2 = -0.88, P ≤ 0.001) without a significant effect on the ANPP:GPP ratio (P > 0.32). None of these fractions were correlated to the soil total or extractable phosphorus (P > 0.32). Although periodic and intensive measurements were required to determine the whole carbon budget in the ten plots, by necessity, the number of sites was limited, and, therefore, our results would require further confirmation using whole carbon budgets from a wider range of soil and environmental conditions.
Key words: Gross- primary productivity, net-primary productivity, nitrogen, Pinus radiata D. Don, phosphorus, total below-ground carbon flux, whole carbon budget.
Received March 1, 2010. Accepted May 26, 2011. Corresponding author: [email protected]

ciencia e investigación agraria278
(Will, 1978, 1985); major nutrient deficiencies include nitrogen, phosphorus, magnesium and boron, although localized deficiencies of po-tassium, manganese, copper, zinc and molyb-denum have also been recorded (Will, 1985; MacLaren, 1993; Hunter et al., 1991; Mead, 2005a). Among these nutrients, nitrogen and phosphorus are the strongest soil chemistry de-terminants of productivity for P. radiata in New Zealand (Watt et al., 2005).
Since the 1950s, fertilization has been routinely used to ameliorate the nutrient deficiencies of P. radiata. Because plantation forestry was often relegated to land with low agricultural potential (Boomsma and Hunter, 1990; Hunter and Smith, 1996), fertilization has been an ef-fective management tool permitting the New Zealand forestry sector to produce fast-growing P. radiata plantations in nutrient-deficient areas (Mead and Gadgil, 1978; Mead, 2005b). There are a large number of empirical studies report-ing growth responses to fertilization, dosages, and the environmental risks associated with the use of fertilizers. However, mechanistic expla-nations about carbon allocation processes as in-fluenced by fertilization (nutrition) are lacking (Landsberg and Gower, 1997).
The assessment of the whole carbon budget is a relatively recent development, which has enabled scientists compare carbon fluxes and partitioning across different soil and environ-mental conditions. This methodology has been defined based on a carbon balance protocol (Raich and Nadelhoffer, 1989) and methods for determining plant respiration (Ryan, 1991a; 1991b; Ryan et al., 1996) and carbon allocation to roots (Giardina and Ryan, 2002; Giardina et al., 2003). Using these methods, the annual gross primary productivity (GPP), defined as the net photosynthesis summed over an annual time interval, can be estimated as the annual sum of the C partitioned to dry matter and res-piration, as follows:
GPP = ANPP + APR + TBCF, (1)
where ANPP is the above-ground net primary productivity, APR is the above-ground plant respiration, and TBCF is the total below-ground
carbon flux. Although many useful studies have been conducted using the carbon balance ap-proach (Giardana and Ryan, 2002; Giardina et al., 2003), this method has not been used to ex-amine the effects of fertilization and soil chemi-cal properties on whole carbon budgets over broad environmental ranges for pine species.
Measurements from five sites, established across a wide environmental gradient, in which P. radiata were grown in mini-plots with and without fertilization, were taken to (i) quantify the influence of fertilization and water balance on carbon allocation both within and across the site gradient and (ii) identify the soil chemical properties that are most strongly correlated with the allocation of carbon to the ANPP, APR and TBCF. The hypotheses for the study were the following: (1) The fraction of the GPP parti-tioned belowground would increase with nutri-ent deficiencies at the expense of both the ANPP and APR, (2) Carbon-use efficiency (the ratio of net- to gross-primary productivity; NPP:GPP) would be highly conservative and not influ-enced by nutrient deficiencies and water avail-ability and (3) Soil chemical properties would be correlated with the observed patterns of car-bon flux and partitioning.
Materials and methods
Trial location and experimental design
The study was conducted at five locations (out of 35) across an environmental gradient, which form part of a national trial series that has been fully described by Watt et al. (2005) (Figure 1). The climate at the sites selected for the study exhibited large differences. The mean annual temperature varied 1.7-fold from approximately 8-10 °C in Southland (sites 4 and 5) to approxi-mately 13 °C in the Nelson region (sites 1 and 2). The mean annual temperatures in Tekapo (site 3) were intermediate, compared with the other sites (10.4 °C), but this site exhibited the lowest minimum among sites, whereas the maximum was similar to those of Golden Downs (site 2) and the Rai Valley (site 1). The rainfall ranged fourfold and was 415 mm per year at Tekapo, 1129 mm at Golden Downs, 1392 mm at Long-
279VOLUME 38 Nº2 MAY – AUGUST 2011
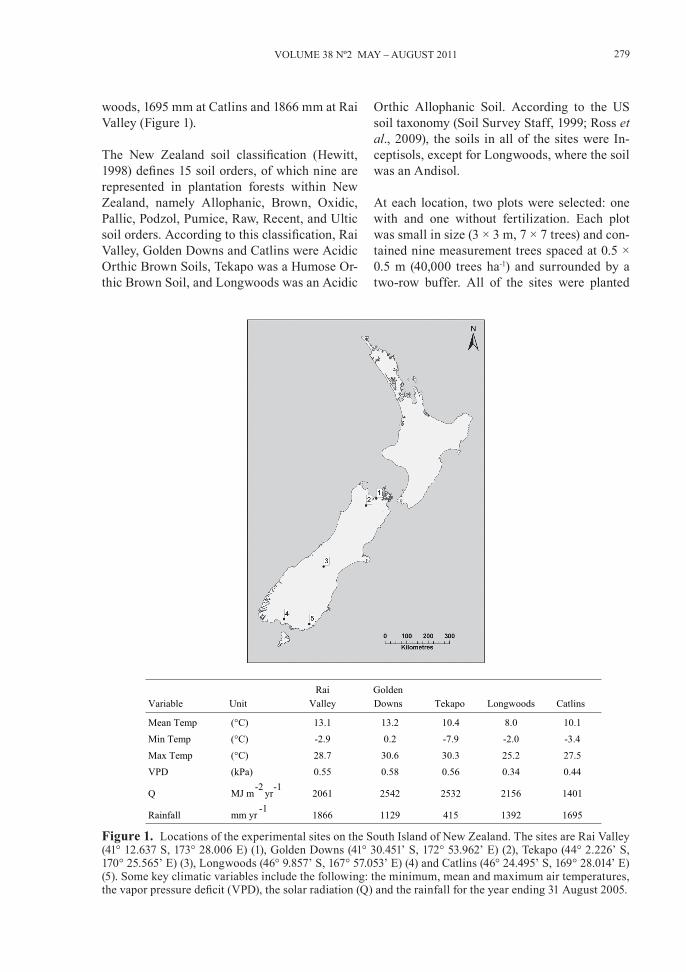
woods, 1695 mm at Catlins and 1866 mm at Rai Valley (Figure 1).
The New Zealand soil classification (Hewitt, 1998) defines 15 soil orders, of which nine are represented in plantation forests within New Zealand, namely Allophanic, Brown, Oxidic, Pallic, Podzol, Pumice, Raw, Recent, and Ultic soil orders. According to this classification, Rai Valley, Golden Downs and Catlins were Acidic Orthic Brown Soils, Tekapo was a Humose Or-thic Brown Soil, and Longwoods was an Acidic
Orthic Allophanic Soil. According to the US soil taxonomy (Soil Survey Staff, 1999; Ross et al., 2009), the soils in all of the sites were In-ceptisols, except for Longwoods, where the soil was an Andisol.
At each location, two plots were selected: one with and one without fertilization. Each plot was small in size (3 × 3 m, 7 × 7 trees) and con-tained nine measurement trees spaced at 0.5 × 0.5 m (40,000 trees ha-1) and surrounded by a two-row buffer. All of the sites were planted
Figure 1. Locations of the experimental sites on the South Island of New Zealand. The sites are Rai Valley (41° 12.637 S, 173° 28.006 E) (1), Golden Downs (41° 30.451’ S, 172° 53.962’ E) (2), Tekapo (44° 2.226’ S, 170° 25.565’ E) (3), Longwoods (46° 9.857’ S, 167° 57.053’ E) (4) and Catlins (46° 24.495’ S, 169° 28.014’ E) (5). Some key climatic variables include the following: the minimum, mean and maximum air temperatures, the vapor pressure deficit (VPD), the solar radiation (Q) and the rainfall for the year ending 31 August 2005.
Variable UnitRai Golden
Tekapo Longwoods CatlinsValley Downs
Mean Temp (°C) 13.1 13.2 10.4 8.0 10.1
Min Temp (°C) -2.9 0.2 -7.9 -2.0 -3.4
Max Temp (°C) 28.7 30.6 30.3 25.2 27.5
VPD (kPa) 0.55 0.58 0.56 0.34 0.44
Q MJ m-2
yr-1
2061 2542 2532 2156 1401
Rainfall mm yr-1
1866 1129 415 1392 1695

ciencia e investigación agraria280
with one-year-old P. radiata seedlings in the winter of 2001 and harvested at the end of the winter of 2005. On average, the trees were (± 1 standard deviation) 47 ± 11 mm in basal diam-eter and 330 ± 101 cm in total height.
Fertilization was applied in all of the plots at the time of planting in doses of 18, 6, 16.8, 4.8, 1.2 and 4.8 kg ha-1 of total elemental N, P, K, S, Mg and Ca, respectively. Thereafter, fertiliza-tion (Hydrogreen; 14% N, 5% P, 15% K, 1% S, 1.2% Mg) was applied in prescribed plots in the spring of every year between 2002 to 2004 at 612 g per plot (9 m2), which was equivalent to 95, 34, 102, 7 and 8 kg ha-1 of elemental N, P, K, S and Mg, respectively. The nitrogen in the fertilizer was provided as 44% N-NO3
- and 56% N-NH4
+.
A comprehensive set of soil physical and chemical properties was taken within each plot following the methods fully described in Watt et al. (2005). Measurements of air tem-perature and relative humidity were taken from sensors installed on a 3-m tower located adjacent to the experimental plots. A tipping bucket rain gauge positioned on the top of the tower was used to measure the above-canopy rainfall. The soil temperature was measured in each plot by sensors installed to a depth of 0-10 cm. Estimates of solar radiation were provided by the National Institute of Water and Atmospheric Research (NIWA). During the fourth year after planting (ending August 31, 2005), monthly measurements of volumet-ric water content, θ, were made to a depth of 30 cm in all of the study plots at three random locations.
Carbon balance method
Values of the GPP for each plot were determined by estimating the annual ANPP, APR and TBCF following Equation 1 using the methods fully described in Giardina et al. (2003). The net pri-mary productivity (NPP) was calculated as the GPP minus the above- and below-ground auto-trophic respiration, whereas the net ecosystem exchange was calculated as the GPP minus both the auto- and heterotrophic respiration.
Above-ground net primary productivity
The annual above-ground net primary produc-tivity (ANPP) was calculated as the sum of the leaf and wood primary productivity plus the lit-terfall. All of the trees were harvested in August 2005, and biomass equations as a function of tree diameters were developed. These equations were applied to tree diameters measured in Au-gust 2004 and August 2005, and the leaf, wood and root productivity was estimated by the dif-ference between the years. The tissue carbon concentrations determined for each plot were used to transform the dry mass to carbon con-tent. The carbon content and tree biomass at the plot level were highly correlated (C [Mg ha-1] = 0.512 Biomass [Mg ha-1], r2 = 0.99, P ≤ 0.001). The litterfall was collected monthly from Au-gust 2004 to August 2005 using four plastic containers (dimension 42 × 33 cm, 40 cm depth, 0.139 m2 horizontal area) randomly distributed within each plot. These samples were oven-dried at 70 ºC and then weighed to determine the dry mass. The C content was assumed to be 50% of litterfall (FA).
Above-ground plant respiration
The above-ground plant respiration (APR) was calculated as the sum of foliage and wood main-tenance and construction respiration. The foli-age (LRC) and wood (WR) construction respira-tion were assumed to be 25% of the foliage and wood net-primary productivity, respectively (Penning de Vries, 1972; 1975; Ryan 1991a; 1991b). The main component of the APR, the foliage maintenance respiration (LRM), was mea-sured using a portable photosynthesis system (Model 6400, Li-Cor, Lincoln, NE, USA) dur-ing night hours in April of 2005. These values were scaled over the entire growing season us-ing a Q10 equal to two, the hourly monthly air temperature averages, and the interpolated val-ues of leaf area index (Ryan 1991a).
Total below-ground carbon flux
The total below-ground carbon flux (TBCF) was calculated by the mass balance as the C root

281VOLUME 38 Nº2 MAY – AUGUST 2011
increment plus the soil surface CO2 efflux plus the C litter change minus the litterfall. We as-sumed that C was not lost by leaching and that the soil C content did not change over the fourth year of growth.
The soil surface CO2 efflux and the mineral soil temperature were measured in all ten of the plots using a soil respiration chamber (inner di-ameter of 100 mm, Model SRC-1, PP Systems, Herts, UK) connected to an infrared gas ana-lyzer (Model EGM-4, PP Systems, Herts, UK) at monthly intervals from August 2004 to Au-gust 2005. Ten soil collars made out of polyvi-nyl chloride (100 mm of inner diameter and 50 mm in length) were placed in each of 10 plots at the start of the experiment in August 2004. Heterotrophic respiration was estimated based on 3-5 deep polyvinyl chloride collars (100 mm of inner diameter and 300 mm in length) per plot, which were installed by progressively coring and removing the soil in three 10-cm steps, inserting the deep collar, visually scan-ning and removing roots from all of the 10-cm soil horizons, and, finally, by carefully restoring the soil profile inside the deep collar. The soil respiration was scaled between successive mea-surements based on the soil temperature record and the site-specific soil respiration responses to temperature derived for each plot (Q10 = 1.54 – 3.71).
Net primary productivity, Net Ecosystem Pro-ductivity and Carbon- use efficiency
There are three additional measures derived from the whole carbon budgets which were compared across sites and a fertilization treat-ment: The net primary productivity (NPP), which is the gross-primary productivity (GPP) minus autotrophic respiration (Ra); Net Ecosys-tem Productivity (NEP), which is NPP minus heterotrophic respiration (Rh); and Carbon-use efficiency (CUE), which is the ratio of NPP to GPP.
Data analysis
All of the statistical analyses were undertaken using SAS software (1996; SAS Institute, ver-
sion 9.1, Cary, NC). Variables were tested for normality and homogeneity of variance, and transformations were made as necessary to meet the underlying statistical assumptions of the models used. A two-way analysis of vari-ance (ANOVA) was carried out to test the main effects of the site and fertilization on the car-bon allocation and soil chemical characteris-tics. Pearson correlations were used to explore significant relationships between soil chemical properties and carbon partitioning variables. Analysis of covariance was used to test whether slopes and intercepts were significantly differ-ent between control and fertilized plots in the relationship between the GPP and NPP.
Results
Climatic and edaphic variation across sites
Selected sites exhibited large differences in soil physical and chemical properties. The great-est differences in the physical properties were found in textural classes, particularly the sand fraction (ranging 7-fold) and the clay fraction (ranging 3-fold) and also in the bulk density (ranging more than twofold). The soil chemical properties were strongly influenced by the site and, to a lesser extent, by fertilization (Table 1). Variation across sites was considerable for exchangeable Na (16-fold), exchangeable Ca (7-fold), Olsen and Bray P (5- to 8-fold), carbon (6-fold), nitrogen (4-fold), exchangeable Mg (4-fold), CEC (3-fold) and the C:N ratio (2-fold). Fertilization significantly increased the ex-changeable K (1.9-fold), Olsen P (2.7-fold), Bray P (3.3-fold), Inorganic P (1.9-fold) and total P (1.2-fold) and slightly decreased the pH (2%).
Carbon assimilation and partitioning
Gross (GPP) and net C fluxes (NPP, NEP) did not significantly change across sites or fertilization treatments (Table 2). The average (± 1 standard error) GPP values for the control were 4122 ± 447 g C m-2 yr-1 compared to 4628 ± 361 g C m-2 yr-1 for the fertilized plots. The relationship between the NPP and GPP was highly significant (NPP

ciencia e investigación agraria282
= 0.54 GPP, r2 = 0.71, P ≤ 0.001) and the slopes (F1,6 = 0.29, P = 0.61) and intercepts (F1,6 = 0.35, P = 0.57) of these linear relationships were not influenced by the fertilization treatment. There-fore, the carbon-use efficiency (the slope of the NPP:GPP relationship) was not significantly in-fluenced by nutrition. Neither the site nor fer-tilization treatment significantly affected the NEP:GPP fraction (0.34). Similarly, C partition-ing to the ANPP was, on average, 0.26 ± 0.02 (a range of 0.22-0.32), independent of the site and fertilization treatment.
In contrast, C partitioning to the APR and TBCF significantly differed across the sites but
was independent of the fertilization treatment (Table 2). The foliage maintenance respiration (LRM) was the largest fraction of the APR (68-87%) and was significantly influenced by the site but not the fertilization treatment (Table 2). Other components of the APR, the foliage construction respiration (LRC) and total wood respiration (WR), were independent of the site and fertilization treatment (Table 1). The soil respiration (FS) represented most of the TBCF (61%-97%) and was the only TBCF component significantly influenced by the site. The root C change (DCR) and litter layer C change (DCL) did not vary significantly with the site or fer-tilization treatment, whereas the litterfall (FA)
Table 1. Soil physical and chemical properties of control (C) and fertilized (F) plots of P. radiata at five sites on the South Island of New Zealand. Soil analyses were determined on samples extracted from the mineral soil at a depth of 0-10 cm. Water balance was determined as the average monthly volumetric water content (Ɵ) for the year ending August 31, 2005.
Rai Valley Golden Downs Tekapo Catlins Longwoods
Site C F C F C F C F C F
Sand (%) 20 20 26 26 23 23 34 34 5 5
Silt (%) 34 34 42 42 62 62 39 39 46 46
Clay (%) 46 46 31 31 15 15 27 27 49 49
Bulk density (g cm-3) 0.99 0.99 1.15 1.15 0.92 0.92 0.79 0.79 0.47 0.47
Part. density (g cm-3) 2.68 2.68 2.53 2.53 2.53 2.53 2.51 2.51 2.22 2.22
Pen. resistance (MPa) 0.77 0.77 1.23 1.23 0.78 0.78 0.68 0.68 0.71 0.71
Tot. porosity (%, v/v) 63 63 55 55 64 64 69 69 79 79
Macroporosity (%) 24 24 14 14 17 17 22 22 18 18
Carbon (%) 4.27 5.06 6.07 5.62 3.98 4.13 7.01 6.53 26.74 24.47
Total N (%) 0.23 0.23 0.25 0.23 0.29 0.28 0.31 0.34 0.85 0.80
C:N ratio 18.6 21.9 24.6 24.5 13.9 14.6 22.3 19.3 31.3 30.5
pH 4.78 4.41 4.48 4.38 5.12 5.07 4.63 4.50 4.18 4.00
CEC (cmol kg-1) 20.15 20.42 16.63 17.18 17.77 17.28 17.40 17.05 42.89 45.77
Exch. Ca (cmol kg-1) 5.21 3.07 1.67 1.50 5.89 4.06 1.00 1.19 9.27 6.58
Exch. Mg (cmol kg-1) 2.97 2.23 0.92 1.01 1.19 1.09 0.89 1.30 3.93 4.11
Exch. K (cmol kg-1) 0.75 0.90 0.49 0.73 0.56 1.05 0.32 0.84 0.44 1.22
Exch. Na (cmol kg-1) 0.31 0.34 0.18 0.06 0.18 0.17 0.27 0.34 0.00 0.68Sum bases (cmol kg-1) 9.24 6.54 3.25 3.29 7.82 6.38 2.48 3.68 13.59 12.59
Base sat. (%) 45.87 32.01 19.56 19.17 44.00 36.89 14.28 21.56 31.68 27.51
Olsen P (μg g-1) 3 10 3 26 13 30 31 65 2.5 16
Bray P (μg g-1) 4 28 12 67 37 109 49 106 4 36
Inorg. P (μg g-1) 74 148 42 162 143 227 299 409 44 202
Org. P (μg g-1) 438 383 280 273 601 587 598 657 477 492
Total P (μg g-1) 512 531 322 435 744 814 898 1065 520 694
Ɵ (m3 m-3) 0.236 0.230 0.262 0.252 0.137 0.134 0.238 0.230 0.237 0.217
Rooting depth (mm) 778 386 368 462 539 456 401 427 330 415
Water balance (mm) 183 89 96 116 74 61 96 98 78 90

283VOLUME 38 Nº2 MAY – AUGUST 2011
changed only with fertilization (Table 2). The proportion of the soil respiration (FS) represent-ed by heterotrophic respiration (Rh), at approxi-mately 0.69 ± 0.02 (± 1 standard error), was neither influenced by the site nor fertilization.
All of the components of the GPP, the ANPP (Pearson r2 = 0.67, P ≤ 0.01), the APR (r2 = 0.66, P ≤ 0.01) and the TBCF (r2 = 0.41, P ≤ 0.01), in-creased significantly with the GPP. The main component of the GPP was the TBCF (32-55%), followed closely by the APR (23-45%), whereas the ANPP represented the smallest and less vari-able fraction of the GPP (23-32%). At Tekapo and the Rai Valley, where control and fertilized plots had similar productivities, the carbon allo-cation below-ground was remarkably stable, at approximately 32% for both the control and fer-tilized plots. At Longwoods, where the control and fertilized plots exhibited the greatest differ-ence in productivity, the TBCF:GPP ratios were the highest among the sites; in addition, this ratio was 7% higher in the control plot (55%), com-pared with the fertilized plot (48%). This was largely explained by the soil respiration, the ma-jor component of the TBCF, which was the high-est at Longwoods compared to the other sites.
Potential edaphic determinants of carbon allocation
The absolute values of the GPP, ANPP, APR and TBCF were uncorrelated to the soil chemi-cal properties and volumetric water content. Ad-ditionally, the absolute values of the GPP were uncorrelated to the ANPP:GPP, APR:GPP and TBCF:GPP fractions, suggesting that the crop size did not confound the carbon partitioning among the different GPP components. In con-trast, the fractions of the GPP represented by the TBCF and APR (but not the ANPP) were well correlated with the soil C, N and C:N ratio but not with the total or extractable phosphorus, ex-changeable N, exchangeable P and volumetric water content.
A closer examination of the significant correla-tions between the GPP fractions and the soil C, N and C:N ratio revealed that the two Longwoods
plots had strong influence on the relationships be-tween the TBCF:GPP and APR:GPP against the soil C and N. Longwoods exhibited a soil C (24-27%) and N (0.80-0.85%) that were far greater than the soil C (4.1-7.0%) and N (0.23-0.34%) in the other sites. When Longwoods was taken out of the dataset, the values of the TBCF:GPP and APR:GPP were uncorrelated to the soil C and N. In contrast, the soil C:N ratio was considerably better distributed, and the Longwoods site had a smaller influence on the relationships between the TBCF:GPP and APR:GPP against the soil C:N, compared with the soil C and N. Therefore, the soil C:N ratio was selected as the only candi-date variable to describe the observed patterns of carbon partitioning.
The relationship between the C:N ratio and the fractional TBCF and APR were best described by exponential functions. The selected model showed that the TBCF increased as the soil C:N ratio increased (Figure 2a), at the expense of the above-ground plant respiration (Figure 2c). There was no significant relationship between the C:N ratio and above-ground net primary productivity (Figure 2b). C partitioning be-lowground was approximately 33% at low C:N ratios (a C:N ratio below 17), with values pro-gressively increasing to a maximum of approxi-mately 55% at soil C:N ratios of approximately 32 (Figure 2a). In contrast, the APR declined from approximately 43% at low C:N ratios (a C:N ratio below 17) to a minimum of approxi-mately 21% at soil C:N ratios of approximately 32 (Figure 2c).
Water availability did not change the partition-ing of the GPP to the TBCF or APR. Evidence of this insensitivity to water availability was observed at Tekapo and the Rai Valley sites, which exhibited extremes in the mean volu-metric water content but very little difference in the partitioning of carbon to either the TBCF (32-33%) or APR (41-45%). We also found in-significant correlations between the residuals of the TBCF:GPP and APR:GPP ratios, after correction was made for the effect of the C:N ratio (using the equations from Figure 2a and c), against the mean volumetric water content (P ≥ 0.70).

ciencia e investigación agraria284
Discussion
Experimentation in-miniature has proved to be a successful method for assessing the soil character-istics that influence tree productivity (Watt et al., 2005; Davis et al., 2007). Using this approach, tree productivity and foliage nutrient concentrations have been shown to be well correlated to the total soil N and the total and organic P. In this study, a subset of five sites was selected from the 35 sites previously described by Watt et al. (2005) and Da-vis et al. (2007), and we observed a marked effect of the soil C:N ratio (but not the total and organic P concentration) on carbon partitioning.
The differences in productivity across the sites and fertilization treatments were caused by both changes in the gross (GPP) and net C fluxes (NPP and NEP) and changes in C allocation. This is relevant because the ANPP may increase with the nutrient supply at the expense of the TBCF without major effects on the GPP. Gross and net C fluxes varied 70-110% across the sites, whereas they varied 10-20% as a result of fertil-ization (over the basal level). Average fractions of the GPP represented by the ANPP, APR and TBCF were 26%, 36% and 38%, but a consider-able variation of these fractions was observed across sites. Therefore, both differences in the C fluxes and C partitioning explained the varia-tion in the productivity across the sites and fer-tilization treatments.
The first hypothesis for this study was that the fraction of the GPP allocated to the TBCF would increase with nutrient deficiencies at the expense of both the ANPP and APR. The car-bon partitioning belowground was, by far, the main component of the whole carbon budget, ranging from 32 to 55% (average 38%) of the GPP across the sites. Although fertilization did not change the TBCF:GPP fractions, when all of the data were pooled to cover a wide site-quality gradient, the TBCF:GPP fraction increased as the soil C:N ratio raised, at the expense of the APR, suggesting that this hypothesis was true, with the exception that the ANPP was indepen-dent of the soil C:N ratio.
The second hypothesis for the study was that the carbon-use efficiency (NPP:GPP) would be high-ly conservative and not influenced by the nutrient or water availability. The carbon-use efficiency (NPP:GPP) is an important parameter in many ecosystem physiological models that are used in assessing the influence of climate change on the carbon budget of ecosystems from community to planetary scales (e.g., Ichii et al., 2005; Turner et al., 2006). In a survey of annual carbon budgets from one deciduous and six evergreen forests in New Zealand, Australia and the United States, Waring et al. (1998) have found that the NPP:GPP ratio was conservative and approximately 0.47 ± 0.04 SD, which agrees well with the 0.45 ± 0.05 SD value reported by Landsberg and Waring (1997). In the present study, the carbon-use ef-
Figure 2. Relationships between the soil C:N ratio and the ratios of (a) the TBCF to GPP (b) the ANPP to GPP and (c) the APR to GPP. Solid lines represent the best fits for the control (open symbols) and fertilized (closed symbols) plots. Plot numbers are indicated in (a) as follows: 1-2, Rai Valley; 3-4, Golden Downs; 5-6, Tekapo; 7-8, Catlins; 9-10 and Longwoods.
TBC
F : G
PP
0.1
0.2
0.3
0.4
0.5
0.6
Soil C : N ratio
15 20 25 30
AP
R :
GP
P
0.1
0.2
0.3
0.4
0.5
a
c
AN
PP
: G
PP
0.1
0.2
0.3
0.4
0.5
b
TBCF : GPP = 0.3255 + 0.5480 ( 1 - e -0.1227 C:N ) 45.7440
r 2 = 0.93, P < 0.001
APR : GPP = 0.4304 - 0.3584(1 - e -0.1418 C:N )45.2291
r2 = 0.86, P = 0.006
5 6 1
2
3
4
78
9
10

285VOLUME 38 Nº2 MAY – AUGUST 2011
ficiency (CUE) did not significantly change with the site, fertilization treatment or volumetric wa-ter content (0.54 ± 0.06 SD). These results sup-port the contention by Waring et al. (1998) that the CUE is highly conservative.
The third hypothesis for this study was that the soil chemical properties would be cor-related with the observed patterns of carbon
partitioning. We found that the soil chemi-cal properties were uncorrelated with the ab-solute values of the GPP, NPP, NEP, TBCF, ANPP and APR. However, the C partitioning belowground (TBCF:GPP) significantly in-creased with the soil C:N ratio, at the expense of the APR:GPP and without an effect on the ANPP:GPP. Other soil chemical properties or soil water content did not alter these fractions.
Table 2. Major fractions of the gross primary productivity (GPP) in control and fertilized mini-plots of Pinus radiata at five sites on the South Island of New Zealand. The major GPP fractions are the above-ground net primary productivity (ANPP), the above-ground plant respiration (APR) and the total belowground carbon flux (TBCF). The main effects of the sites (S) and fertilization treatments (F) were assessed by analysis of variance.
Carbon Budget Component
ANOVA
Units Control Fertilized Site Fert
ANPP g C m-2 yr-1 1101 ± 133 1169 ± 105 ns ns
Litterfall, FA g C m-2 yr-1 113 ± 18 173 ± 13 ns 0.47*
Live foliage C change, ΔCC g C m-2 yr-1 283 ± 26 260 ± 22 ns ns
Wood C change, ΔCw g C m-2 yr-1 704 ± 109 735 ± 87 ns ns
APR g C m-2 yr-1 1488 ± 292 1698 ± 210 0.88* ns
Fol. Const. Resp., LRC g C m-2 yr-1 98 ± 8 107 ± 7 ns ns
Fol. Maint. Resp., LRM g C m-2 yr-1 1213 ± 270 1405 ± 207 0.88* ns
Total Wood Resp., WR g C m-2 yr-1 177 ± 27 185 ± 22 ns ns
TBCF g C m-2 yr-1 1533 ± 129 1761 ± 205 ns ns
Soil C efflux, FS g C m-2 yr-1 1236 ± 189 1309 ± 186 0.92* ns
Litterfall, -FA g C m-2 yr-1 -113 ± 18 -173 ± 13 ns 0.47*
Root C change, ΔCR g C m-2 yr-1 268 ± 26 307 ± 36 ns ns
Litter layer C change, ΔCL g C m-2 yr-1 142 ± 72 319 ± 66 ns ns
GPP g C m-2 yr-1 4122 ± 447 4628 ± 361 ns ns
ANPP:GPP 0.27 ± 0.02 0.25 ± 0.01 ns ns
APR:GPP 0.35 ± 0.04 0.37 ± 0.04 0.96*** ns
TBCF:GPP 0.38 ± 0.04 0.38 ± 0.03 0.94** ns
NPP g C m-2 yr-1 2166 ± 214 2583 ± 256 ns ns
NPP:GPP 0.53 ± 0.01 0.56 ± 0.03 ns ns
NEP g C m-2 yr-1 1400 ± 198 1622 ± 143 ns ns
NEP:GPP 0.62 ± 0.06 0.73 ± 0.04 ns ns
Heterotrophic Resp., Rh: FS 0.34 ± 0.04 0.35 ± 0.02 ns ns
Significant differences are presented as the partial r2 and the following significance levels: ns, non significant; *, significant at P ≤ 0.05; **, significant at P ≤ 0.01 and ***, significant at P ≤ 0.001. Values are presented as the means and standard error with n = 5. Components of the ANPP are: FA, the C content of above-ground litterfall; ΔCC, the C content change of live foliage and ΔCw, the C content change in live branches, bark and wood. Components of the APR are: LRC, the foliage construction respiration; LRM, the foliage maintenance respiration and WR, the wood construction and maintenance respiration. Components of the TBCF are: FS, the soil respiration C efflux; ΔCR, the C content change of root biomass and ΔCL, the C content change in the litter layer. Values of FS are the sum of autotrophic (Ra) and heterotrophic (Rh) respiration. Net ecosystem productivity (NEP) is the GPP minus the auto- and heterotrophic respiration.

ciencia e investigación agraria286
Soil respiration is usually assumed to be equally divided between autotrophic (Ra) and heterotro-phic (Rh) respiration, and, therefore, the below-ground NPP is generally assumed to be half of the TBCF (Stape et al., 2004a; Law et al., 2000; Newman et al., 2006). However, the values of Ra are known to range from one- to two-thirds of the annual carbon release from soils (Raich and Nadelhoffer, 1989); thus, a better understanding on the soil, plant and environmental controls of soil respiration partitioning is required. Equally dividing the soil respiration between Ra and Rh would have resulted in biased estimates of the NPP (GPP - Ra) and carbon-use efficiency in this study.
In conclusion, the patterns of carbon alloca-tion were examined in control and fertilized mini-plots of P. radiata that covered a wide climatic and edaphic gradient on the South Is-land of New Zealand. The results of this study suggested that the fraction of the whole-carbon budget partitioned belowground progressively
increased from approximately 0.32 at soil C:N ratios below 17 to approximately 0.55 at soil C:N ratios over 32 and that this fraction was in-dependent of water availability. Because of the unusual nature of the trial and the relatively low number of sites studied, further confirma-tion, considering a wider range of forest struc-tures, soil and climatic conditions, is required.
Acknowledgments
During this work, the senior author was sup-ported by SCION, the University of Canterbury, the University of Chile and a Doctoral Scholar-ship provided by Education New Zealand. We thank Mr. Alan Leckie, Mr. Dave Conder, Mr. Nigel Pink, Mrs. Vicki Wilton and Mr. Lachlan Kirk for their kind advice and valuable techni-cal skills. The experiments and measurements undertaken for this paper comply with the cur-rent laws of New Zealand.
Resumen
H.E. Bown, M.S. Watt, P.W. Clinton y E.G. Mason. 2011. Relación C/N de los suelos influye sobre los flujos y partición de carbono en mini-parcelas con y sin fertilización de Pinus radiata, en Nueva Zelanda. Cien. Inv. Agr. 38(2):277-289. Se examinaron los flujos y partición de carbono en mini-parcelas de alta densidad (40.000 árboles ha-1) de Pinus radiata D. Don con y sin fertilización en cinco sitios que cubrían un gradiente climático y edáfico amplio en la Isla Sur de Nueva Zelanda. Se calculó la productividad primaria bruta (PPB) y su distribución aérea y bajo el suelo utilizando un enfoque de balance de carbono. Todos los componentes de PPB: la productividad primaria neta aérea, PPNA (r2 = 0.67, P ≤ 0.01); la respiración aérea de plantas, RAP (r2 = 0.66, P ≤ 0.01) y el flujo total de carbono bajo el suelo, FCBS (r2 = 0.41, P ≤ 0.01) escalaron positiva y significativamente con PPB, pero las fracciones PPNA:PPB, RAP:PPB and FCBS:PPB no se correlacionaron con la PPB (P > 0.41). La fracción FCBS:PPB aumentó significativamente con la relación C:N de los suelos (r2 = 0.93, P ≤ 0.01) con una disminución concomitante de la fracción RAP:PPB (r2 = -0.88, P ≤ 0.001) pero sin un efecto significativo sobre la fracción PPNA:PPB (P > 0.32). Ninguna de estas fracciones se correlacionó con el fósforo total o intercambiable de los suelos (P > 0.32). Aunque se requirieron mediciones intensivas y periódicas para determinar el balance de carbono en las diez parcelas, por necesidad el número de sitios fue limitado y por lo tanto nuestros resultados requerirán confirmación usando balances de carbono sobre un rango más amplio de suelos y condiciones ambientales.
Palabras clave: Balance de carbono, flujo de carbono bajo el suelo, fósforo, nitrógeno, Pinus radiata D. Don, productividad primaria bruta, productividad primaria neta.

287VOLUME 38 Nº2 MAY – AUGUST 2011
References
Battaglia, M., and P. Sands. 1997. Modelling site productivity of Eucalyptus globulus in response to climatic and site factors. Australian Journal of Plant Physiology 24:831-850.
Battaglia, M., P. Sands, D. White, and D. Mummery. 2004. CABALA: a linked carbon, water and ni-trogen model of forest growth for silvicultural decision support. Forest Ecology and Manage-ment 193:251-282.
Beets, P.N., and D. Whitehead. 1996. Carbon parti-tioning in Pinus radiata stands in relation to foli-age nitrogen status. Tree Physiology 16:131-138.
Boomsma, D.B. and I.R. Hunter. 1990. Effects of water, nutrients and their interactions on tree growth, and plantation forest management prac-tices in Australasia: A review. Forest Ecology and Management 30:455-476.
Bremner, J.M. 1965. Inorganic forms of nitrogen. In: Methods of soil analysis: Part 2, Chemical and Microbiological properties. D.D.E. C.A. Black, J.L. White, L.E. Ensminger and F.E. Clark (eds.). American Society of Agronomy, Madison, Wis-consin, USA. p. 1179-1237.
Cown, D.J. 1997. New Zealand forest management and wood quality trends. In: CTIA/IUFRO Inter-national Wood Quality Workshop: Timber man-agement toward wood quality and end-product value. S.Y. Zhang, R. Gosselin and G. Chauret (ed.), Quebec City, Canada. p. 39-54.
Davis, M.R., G. Coker, R.L. Parfitt, R. Simcock, P.W. Clinton, L.G. Garrett, and M.S. Watt. 2007. Re-lationships between soil and foliar nutrients in young densely planted mini-plots of Pinus ra-diata and Cupressus lusitanica. Forest Ecology and Management 240:122-130.
Giardina, C.P., and M.G. Ryan 2002. Total below-ground carbon allocation in a fast-growing Eu-calyptus plantation estimated using a carbon bal-ance approach. Ecosystems 5:487-499.
Giardina, C.P., M.G. Ryan, D. Binkley, and J.H. Fownes. 2003. Primary production and carbon allocation in relation to nutrient supply in a tropi-cal experimental forest. Global Change Biology 9:1438-1450.
Haynes, R.J., and K.M. Goh. 1978. Ammonium and nitrate nutrition of plants. Biological Reviews 53:465-510.
Hewitt, A. 1998. The New Zealand Soil Classifi-cation. Appendix: in Soils in the New Zealand
Landscape-the living mantle. By Les Molloy. Second edition.
Hunter, I.R., B.E. Rodgers, A. Dunningham, J.M. Prince, and A.J. Thorn. 1991. An atlas of Radiata Pine nutrition in New Zealand. In New Zealand Forest Research Institute Bulletin No 165. Ro-torua. p. 24.
Hunter, I.R., and W. Smith. 1996. Principles of forest fertilization - illustrated by New Zealand experi-ence. Fertilizer Research 43:21-29.
Ichii, K., H. Hashimoto, R. Nemani, and M. White. 2005. Modelling the interannual variability and trends in gross and net primary productivity of tropical forests from 1982 to 1999. Global and Planetary Change 48:274-286.
Jarvis, P.G. 1995. Scaling processes and problems. Plant Cell and Environment 18:1079-1089.
Johnsen, K., L. Samuelson, R. Teskey, S. McNulty and T. Fox 2001. Process models as tools in for-estry research and management. Forest Science 47:2-8.
Keyes, M.R., and C.C. Grier. 1981. Above- and be-low-ground net production in 40-year-old Doug-las fir stands on low and high productivity sites. Canadian Journal of Forest Research 11:599-605.
Landsberg, J. 2003. Modelling forest ecosystems: State of the art, challenges, and future directions. Canadian Journal of Forest Research 33:385-397.
Landsberg, J.J. 1986. Physiological ecology of for-est production. Academic Press, London. 198 pp.
Landsberg, J.J., and S.T. Gower. 1997. Applications of physiological ecology to forest management. Academic Press, San Diego. 354 pp.
Landsberg, J.J., and F.J. Hingston. 1996. Evaluating a simple radiation/dry matter conversion model using data from Eucalyptus globulus plantations in Western Australia. Tree Physiology 16:801-808.
Landsberg, J.J., and R.H. Waring 1997. A general-ized model of forest productivity using simpli-fied concepts of radiation-use efficiency, carbon balance and partitioning. Forest Ecology and Management 95:209-228.
Law, B.E., R.H. Waring, P.M. Anthoni, and J.D. Aber. 2000. Measurements of gross and net eco-system productivity and water vapour exchange of a Pinus ponderosa ecosystem, and an evalua-tion of two generalized models. Global Change Biology 6:155-168.
Lewis, N.B., and I.S. Ferguson. 1993. Management of radiata pine. Inkata Press, Melbourne. 404 pp.

ciencia e investigación agraria288
MacLaren, J.P. 1993. Radiata Pine Grower’s Manual. New Zealand Forest Research Institute Limited. FRI Bulletin No 184. 140 pp.
Mead, D.J. 2005a. Opportunities for improving plan-tation productivity. How much? How quickly? How realistic? Biomass and Bioenergy 28:249-266.
Mead, D.J. 2005b. Fertilising. In: 2005 Forestry Handbook Ed. M. Colley. New Zealand Institute of Forestry (Inc.). Christchurch, N.Z. p. 110-112.
Mead, D.J., and R.L. Gadgil. 1978. Fertilizer use in established radiata pine stands in New Zealand. New Zealand Journal of Forestry Science 8:105-134.
New Zealand Ministry for the Environment. 2006. Projected balance of emissions units during the first commitment period of the Kyoto Protocol. Ministry for the Environment Technical Report. p. 64.
Newman, G.S., M.A. Arthur, and R.N. Muller. 2006. Above- and belowground net primary production in a temperate mixed deciduous forest. Ecosys-tems 9:317-329.
NZFOA. 2007. Facts and Figures 2006/2007. New Zealand Forest Owners Association (NZFOA). Wellington. p. 28.
Parfitt, R.L., D.J. Ross, D.A. Coomes, S.J. Richard-son, M.C. Smale, and R.A. Dahlgren. 2005. N and P in New Zealand soil chronosequences and relationships with foliar N and P. Biogeochemis-try 75:305-328.
Parfitt, R.L., N.A. Scott, D.J. Ross, G.J. Salt, and K.R. Tate. 2003. Land-use change effects on soil C and N transformations in soils of high N status: comparisons under indigenous forest, pasture and pine plantation. Biogeochemistry 66:203-221.
Penning de Vries, F.W.T. 1972. Respiration and growth. In: Crop processes in controlled envi-ronments. K.E.C. A.R. Rees, D.W. Hand and R.G. Hurd (eds.). Academic Press, London. p. 327-347.
Penning de Vries, F.W.T. 1975. Use of assimilates in higher plants. In: Photosynthesis and productivity in different environments. J.P. Cooper (ed.). Cam-bridge University Press, Cambridge. p. 459-480.
Raich, J.W., and K.J. Nadelhoffer. 1989. Below-ground carbon allocation in forest ecosystems: global trends. Ecology 70:1346-1354.
Raison, R.J., and B.J. Myers. 1992. The Biology of Forest Growth experiment: linking water and nitrogen availability to the growth of Pinus ra-
diata. Forest Ecology and Management 52:279-308.
Reich, P.B., D.F. Grigal, J.D. Aber, and S.T. Gower. 1997. Nitrogen mineralization and productivity in 50 hardwood and conifer stands on diverse soils. Ecology 78:335-347.
Ross, C.W.; M.S. Watt, R.L. Parfitt, R. Simcock, J. Dando, G. Coker, P.W. Clinton, and M. Davis. 2009. Soil quality relationships with tree growth in exotic forests in New Zealand. Forest Ecology and Management 258: 2326–2334.
Ryan, M.G. 1991a. Effects of climate change on plant respiration. Ecological Applications 1:157-167.
Ryan, M.G. 1991b. A simple method for estimating gross carbon budgets for vegetation in forest eco-systems. Tree Physiology 9:255-266.
Ryan, M.G., R.M. Hubbard, S. Pongracic, R.J. Rai-son, and R.E. McMurtrie. 1996. Foliage, fine-root, woody-tissue and stand respiration in Pinus radiata in relation to nitrogen status. Tree Physi-ology 16:333-343.
Skinner, M.F., and P.M. Attiwill. 1981. The produc-tivity of pine plantations in relation to previous land use. Plant and Soil 60:161-176.
Smith, C.T., A.T. Lowe, M.F. Skinner, P.N. Beets, S.H. Schoenholtz, and S. Fang. 2002. Response of radiata pine forests to residue management and fertilization across a fertility gradient in New Zealand. Forest Ecology and Management 138:203-223.
Soil Survey Staff. 1999. Soil taxonomy. A basic sys-tem of soil classification for making and inter-preting soil surveys, 2nd ed. USDA Natural Re-sources Conservation Service Agricultural Hand-book No. 436, 2nd ed., US Government Printing Office, Washington DC. 871 pp.
Springob, G., and H. Kirchmann. 2003. Bulk soil C to N ratio as a simple measure of net N miner-alization from stabilized soil organic matter in sandy arable soils. Soil Biology and Biochemis-try 35:629-632.
Stape, J.L., D. Binkley, and M.G. Ryan. 2004b. Eu-calyptus production and the supply, use and ef-ficiency of use of water, light and nitrogen across a geographic gradient in Brazil. Forest Ecology and Management 193:17-31.
Turnbull, M.H., D.T. Tissue, K.L. Griffin, G.N.D. Rogers, and D. Whitehead. 1998. Photosynthetic acclimation to long-term exposure to elevated CO2 concentration in Pinus radiata D.Don is re-lated to age of needles. Plant, Cell and Environ-ment 21:1019-1028.
289VOLUME 38 Nº2 MAY – AUGUST 2011
Turner, D.P., W.D. Ritts, W.B. Cohen, S.T. Gower, S.W. Running, M. Zhao, M.H. Costa, A.A. Kirschbaum, J. Ham, M., S.R. Saleska, and D.E. Ahl. 2006. Evaluation of MODIS NPP and GPP products across multiple biomes. Remote Sens-ing and Environment 102:282-292.
Turner, J., and M.J. Lambert. 1986. Nutrition and nutritional relationships of Pinus radiata. An-nual Review of Ecology and Systematics 17:325-350.
Vitousek, P.M., P.A. Matson, and K. Van Cleve. 1989. Nitrogen availability and nitrification dur-ing succession: Primary, secondary, and old-field seres. Plant and Soil 115:229-239.
Waring, R.H., J.J. Landsberg, and J. Williams. 1998. Net primary production of forests: a constant
fraction of gross primary production? Tree Phys-iology 1998:129-134.
Watt, M.S., G. Coker, P.W. Clinton, M.R. Davis, R. Parfitt, R. Simcock, L. Garrett, T.W. Payn, B. Richardson, and A. Dunningham. 2005. Defining sustainability of plantation forests through iden-tification of site quality indicators influencing productivity- a national view for New Zealand. Forest Ecology and Management 216:51-63.
Will, G.M. 1978. Nutrient deficiencies in Pinus ra-diata in New-Zealand. New Zealand Journal of Forestry Science 8:4-14.
Will, G.M. 1985. Nutrient deficiencies and fertilizer use in New Zealand exotic forests. Forest Re-search Institute Bulletin No 97. Rotorua, New Zealand. p. 53.