Embed Size (px)
Citation preview
lable at ScienceDirect
Soil Biology & Biochemistry 68 (2014) 166e176
Contents lists avai
Soil Biology & Biochemistry
journal homepage: www.elsevier .com/locate/soi lbio
From the litter layer to the saprolite: Chemical changes inwater-soluble soil organic matter and their correlation tomicrobial community composition
Rachel S. Gabor a,c,e,*, Kathryn Eilers b, Diane M. McKnight c,e, Noah Fierer b,f,Suzanne P. Anderson d,e
aDepartment of Environmental Studies, University of Colorado, Boulder, CO 80309, USAbDepartment of Ecology and Evolutionary Biology, University of Colorado, Boulder, CO 80309, USAcDepartment of Civil, Environmental, and Architectural Engineering, University of Colorado, Boulder, CO 80309, USAdDepartment of Geography, University of Colorado, Boulder, CO 80309, USAe Institute of Arctic and Alpine Research, University of Colorado, Boulder, CO 80303, USAfCooperative Institute for Research in the Environmental Science, University of Colorado, Boulder, CO 80309, USA
a r t i c l e i n f o
Article history:Received 29 May 2013Received in revised form5 September 2013Accepted 27 September 2013Available online 14 October 2013
Keywords:Water soluble organic matter (WSOM)Soil depthUVevis absorbance and fluorescencespectroscopyXAD-8 resin fractionationOrganic matter/microbe interactionsEEM-PARAFAC
* Corresponding author. University of Colorado, INSCO 80303, USA. Tel.: þ1 303 735 2495.
E-mail address: [email protected] (R.S. G
0038-0717/$ e see front matter � 2013 Elsevier Ltd.http://dx.doi.org/10.1016/j.soilbio.2013.09.029
a b s t r a c t
Organic matter content and chemistry is vital to the structure and function of soil systems, but whileorganic matter is recognized as biogeochemically important, its chemical interaction with soil processesis not well understood. In this study we used fluorescence spectroscopy, which has been used extensivelyfor understanding the role of organic matter in aquatic systems, to identify chemical changes in organicmatter with depth in a soil system. Soil was collected from nine different pits in a first-order montanecatchment in the Colorado Front Range. The water-soluble soil organic matter was extracted from eachsample and fluorescence and UVevis spectroscopy was used to analyze its chemical character. Whileorganic matter chemistry had little correlation with landscape location and local vegetation, there werenoticeable consistent trends between soil horizon and organic matter chemistry in each pit. Total organicmatter decreased with depth and became less aromatic with increasing depth. This less aromatic ma-terial in the saprolite also had a greater microbial signature. The redox character of the organic matteraccompanied this change in source and molecular structure, with more oxidized character correspondingwith organic matter with more microbial input and more reduced character corresponding to organicmatter with more plant input. A concurrent investigation of the microbial population of the same soilsamples also showed microbial population composition varying more with soil depth than landscapeposition, and depth changes in microbial diversity occurred concomitantly with depth changes in organicmatter chemistry.
� 2013 Elsevier Ltd. All rights reserved.
1. Introduction
The biogeochemical processes that drive the functioning of theEarth’s critical zone are dependent on biotic and abiotic elements.Within a soil system, soil formation requires organic matter inputthat primarily originates at the top of the soil column and mineralinput that primarily originates from the bottom, creating stratifi-cation (Kögel-Knabner, 2002). Near the surface, soil horizons (O, A)are defined by their rich organic matter content, but organic matter
TAAR, 1560 30th St, Boulder,
abor).
All rights reserved.
is still present in deeper horizons and this smaller pool of organicmatter is still active in biogeochemical processes (Chorover et al.,2007; Fierer et al., 2009). In each soil horizon, production of newmaterial, transformation of existing material, and transport ofmaterial from other soil layers determine organic matter chemistry.Organic matter transformation due to interactions with microbes,plants, minerals and fungi depends not only on the amount oforganic matter present, but also on its structure and chemicalcharacter (Kalbitz et al., 2003; Marschner and Kalbitz, 2003; Sixet al., 2004). Thus, the chemistry of organic matter is partiallydetermined by its interactions with microbes but also defines thenature of those processes. However, much work is still needed tounderstand the biogeochemical relationship between organicmatter and micro-organisms in the soil system (McDowell, 2003).
R.S. Gabor et al. / Soil Biology & Biochemistry 68 (2014) 166e176 167
One key role of organic matter in natural systems is the ability ofhumic substances, a subset of organic matter, to act as an electronshuttle for bioreduction processes (Peretyazhko and Sposito, 2006).Humic substances can accept electrons from micro-organisms andthen shuttle those electrons to inorganic compounds such as ironor chromium, reducing those elements. Lovley et al. (1996) studiedthe reduction of iron by Geobacter metallireducens and found therate greatly increased in the presence of humic acids from both soiland aquatic sources. These results showed that electron shuttlingfrom humic materials had the potential to play a significant role inmicrobe-driven reduction processes in the natural environment. Inlaboratory settings, humic substances from awide range of aquatic,terrestrial, and anthropogenic sources have been shown to act aselectron shuttles in microbially-driven redox reactions and a vari-ety of microbes have been shown to utilize humics as electronacceptors (Chen et al., 2003; Peretyazhko and Sposito, 2006).These humic-mediated oxidationereduction processes have beenobserved in systems including freshwater sediments and bothanoxic and aerobic soils (Kappler et al., 2004; Rakshit et al., 2009;Brose and James, 2010).
To investigate this electron shuttle behavior, Scott et al. (1998)used electron spin resonance spectroscopy to measure the elec-tron accepting capacity of humics from a variety of sources. Theywere able to demonstrate that the quinonemoieties found in humicmaterial are the main drivers of its capacity to shuttle electrons.They found that humic material extracted from soils had a sub-stantially higher electron accepting capacity, as well as a greaterdegree of aromaticity and organic radical content, than humicmaterial extracted from aquatic sources. In addition, Roden et al.(2010) showed that humic substances in particulate form couldshuttle electrons, and thus this function was not limited to dis-solved humic material. While the particulate humics in this studyshowed only a modest electron accepting capacity compared to thedissolved species, they still significantly increased the rate of mi-crobial reduction of iron. Overall these findings suggest that humicsin soil systems have the potential to be evenmore involved in redoxreactions than humics in aquatic systems.
The optical properties of organic matter have been utilized tounderstand the chemical nature of organic matter in both soil andaquatic systems (Fellman et al., 2010). Organic matter can beseparated into chromophoric and non-chromophoric fractions, andstudies have shown that the fluorescently-active chromophoricportion of organic matter is predominately composed of humicmaterial. While only a fraction of organic matter is composed offluorescently-active material, evidence suggests that a substantialportion of that fraction contains the quinone-like moieties (Coryand McKnight, 2005) which have been shown to serve as electronshuttles within humic material. Early work on soil systems foundthat fluorescence spectroscopy could differentiate between soilorganic matter from different sources, and could detect chemicalchanges in organic matter exposed to various physical andbiogeochemical processing (Senesi et al., 1991; Zsolnay et al., 1999;Kalbitz et al., 2003). More detailed exploration of soil at depth hasshown that deeper organic matter is less aromatic and from a moremicrobial origin (Hassouna et al., 2010). Another study of soil depthprofiles found the degree of humification drops along with thearomaticity, suggesting smaller molecules may be transported tothese deeper environments (Corvasce et al., 2006). Work in aquaticsystems has demonstrated the ability of fluorescence to distinguishbetween organic matter from microbial and plant sources (Parlantiet al., 2000; McKnight et al., 2001) and the redox state of theorganic matter (Fulton et al., 2004; Miller et al., 2006; Mladenovet al., 2010). These techniques have been used extensively inaquatic systems, and they are also likely to identify importantprocesses in the soil, where they have not been as commonly used.
While many studies of humics as electron shuttles haveoccurred in controlled laboratory settings, there have been studiesin lakes, streams, and groundwater systems that provide evidenceof similar reactions happening in natural landscapes. Fluorescencetechniques, which require a sample size and concentration that canbe easily obtained in the field, as opposed to NMR or ESR, whichrequire concentrations of organic matter much higher than is foundin natural settings, have been utilized in many of these studies.Because it is a spectroscopic technique, fluorescence is also highlysensitive to the electronic state of the molecules, and thus thereduced or oxidized state of the quinone-like moieties thought todrive humic electron shuttling. Examples of systems where achange in humic redox character has been identified with fluo-rescence include sediment interstitial waters (Klapper et al., 2002),an Antarctic lake (Fulton et al., 2004), the hyporheic zone of amountain stream (Miller et al., 2006) and Bangladesh groundwater(Mladenov et al., 2010).
The electron shuttling capacity of humic material from aquatic,terrestrial, and anthropogenic sources has been established in bothdissolved and particulate forms in laboratory studies, and evidencefor this biogeochemical shuttling process has been found in nat-ural aquatic systems. However, fluorescence evidence for similarredox properties in soil systems has not been investigated. Thus, alogical next step would be to look for evidence of humic-mediatedelectron transfer within soil horizons. In this study, we investi-gated the use of fluorescence spectroscopy to identify changes inthe chemical character of organic matter in soil at various depthswith the goal of improving our understanding of the role it plays inbiogeochemical processes and saprolite formation. We extractedorganic matter from the profiles of nine soil pits dug within a first-order montane catchment of the Colorado Front Range. The water-soluble organic matter was characterized using UVevis and fluo-rescence spectroscopy to identify changes in the chemical char-acter of organic matter with soil depth. Building on the approach ofEilers et al. (2012), a PCA analysis of the microbial community wasutilized to explore whether these changes in organic matterchemistry corresponded with changes in the soil microbial com-munity. This allowed us to evaluate the hypothesis that changes insoil organic matter chemistry correspond to changes in the mi-crobial community.
2. Materials and methods
2.1. Site description and sampling
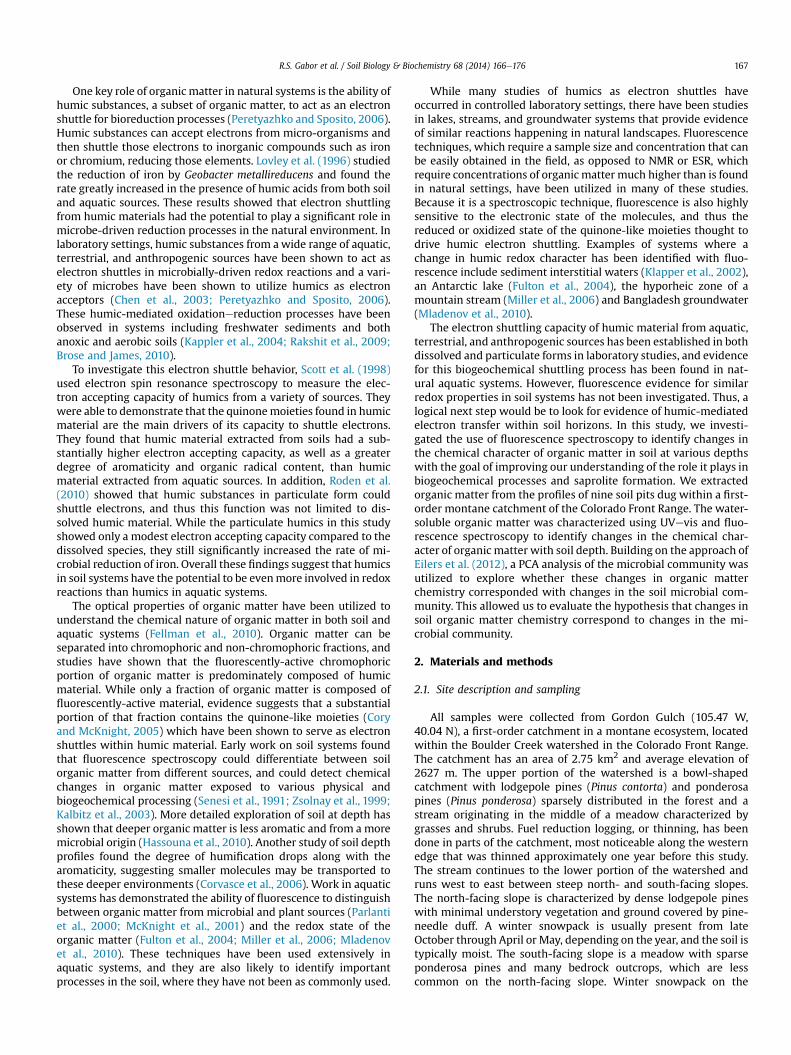
All samples were collected from Gordon Gulch (105.47 W,40.04 N), a first-order catchment in a montane ecosystem, locatedwithin the Boulder Creek watershed in the Colorado Front Range.The catchment has an area of 2.75 km2 and average elevation of2627 m. The upper portion of the watershed is a bowl-shapedcatchment with lodgepole pines (Pinus contorta) and ponderosapines (Pinus ponderosa) sparsely distributed in the forest and astream originating in the middle of a meadow characterized bygrasses and shrubs. Fuel reduction logging, or thinning, has beendone in parts of the catchment, most noticeable along the westernedge that was thinned approximately one year before this study.The stream continues to the lower portion of the watershed andruns west to east between steep north- and south-facing slopes.The north-facing slope is characterized by dense lodgepole pineswith minimal understory vegetation and ground covered by pine-needle duff. A winter snowpack is usually present from lateOctober through April or May, depending on the year, and the soil istypically moist. The south-facing slope is a meadow with sparseponderosa pines and many bedrock outcrops, which are lesscommon on the north-facing slope. Winter snowpack on the
R.S. Gabor et al. / Soil Biology & Biochemistry 68 (2014) 166e176168
south-facing slope rarely lasts and the soil is noticeably drier. Theriparian zone contains grasses and bushy vegetation as well asaspen (Populus tremuloides) stands and has multiple smallgroundwater springs that feed into the stream.
Analysis of the microbial populations in the soil profiles wasreported by Eilers et al. (2012). Along with relative microbialbiomass, microbial community composition was determined usingDNA extracted and then PCR-amplified in triplicate. Barcodedpyrosequencing of the 16S rRNA genewith the use of a primer set tocapture archaea and bacteria was then used to identify microbialphyla. Both microbial biomass and soil carbon was found todecrease exponentially with depth and bacterial diversity washighest in the upper soil horizon. Microbial community composi-tion changed significantly with depth, driven by a decline in Bac-teroidetes and increase in Verrucomicrobia in the mobile regolithregion. While microbial diversity between soil pits was significantat the surface, consistent trends with depth were identified acrossthe landscape.
Soil pits were dug through mobile regolith, extending intosaprolite where possible, with depths ranging from 30 to 165 cmbelow the surface. Pits were distributed on both north- and south-facing slopes as well as in the meadow and riparian regions, withsix pits in the upper portion of the catchment and three pits in thelower region (Fig. 1). Table 1 details the locations, surroundingvegetation, and general properties of each pit. Within the pits, Oand A soil horizons were identified. We use the term mobileregolith (MR) to describe all disaggregated and mobilized materialbeneath the organic-rich surface horizons. With the exception oftwo pits located in riparian positions (LGG2 and UGG3), all pitscontain residual soils derived from underlying rock. Most pitsextended into saprolite (S) e intact, highly weathered rock that canbe excavated with a spade. Fresh bedrock in this site is located atdepths of 10e12 m or more (Befus et al., 2011). Soil samples were
Fig. 1. Location and identification of the nine soil pits used in this study within Gordon Gulcontours, as obtained from the U.S. Geological Survey and background shading indicates foreThe thin dotted line indicates the stream in the catchment.
collected during July 2009 over a period of five days during whichthere was no measurable precipitation. Horizontal coring ofcleaned pit faces was used to collect samples from each identifiedsoil horizon, withmultiple samples collected from thicker horizons.Samples were stored in whirlpacks and placed in coolers aftercollection. In the lab, samples were stored in the dark at 4 �C untilanalyzed.
2.2. Soil properties
Soil pH was measured using a 1:2 soil:water volume ratio afterone hour of incubation, using a pH probe (Accumet AB15 basic pHmeter). Soil was oven dried for 48 h at 60 �C to calculate soilmoisture content. X-Ray Diffraction was used to measure inorganiccontent of the soil, of which iron is reported in this paper. Iron wasmeasured as iron oxide and is reported as percent of total soil(organic and inorganic) in each sample.
2.3. Soil leaching and SOM processing
Water-soluble soil organic matter (WSOM) was leached fromeach soil sample. To avoid the effect of drying and sieving on therelease of WSOM, leaching was done using field-moist, unsievedsoil (Zsolnay et al., 1999; Jones andWillett, 2006; Akagi et al., 2007).Following the method recommended in Jones and Willett (2006),80 g of soil, with rocks and large plant matter removed, was placedin a 1 L pre-combusted amber bottle with 400ml of 0.5 M K2SO4 fora 5:1 solvent:soil v/w ratio. Samples were placed on a shaker tableat 200 revolutions/minute for one hour and allowed to settle in thedark at 4 �C for 24 h. Leachate was decanted, centrifuged, andfiltered through a 0.7 mm GFF filter. Samples were acidified to a pHof 2 with HCl for storage and fractionation. At the same time as theleaching, an additional 10e12 g of soil was weighed and then
ch, a first order catchment in the Boulder Creek Watershed. Topographic map has 10 mst density, which is noticeably different between north-facing and south-facing slopes.
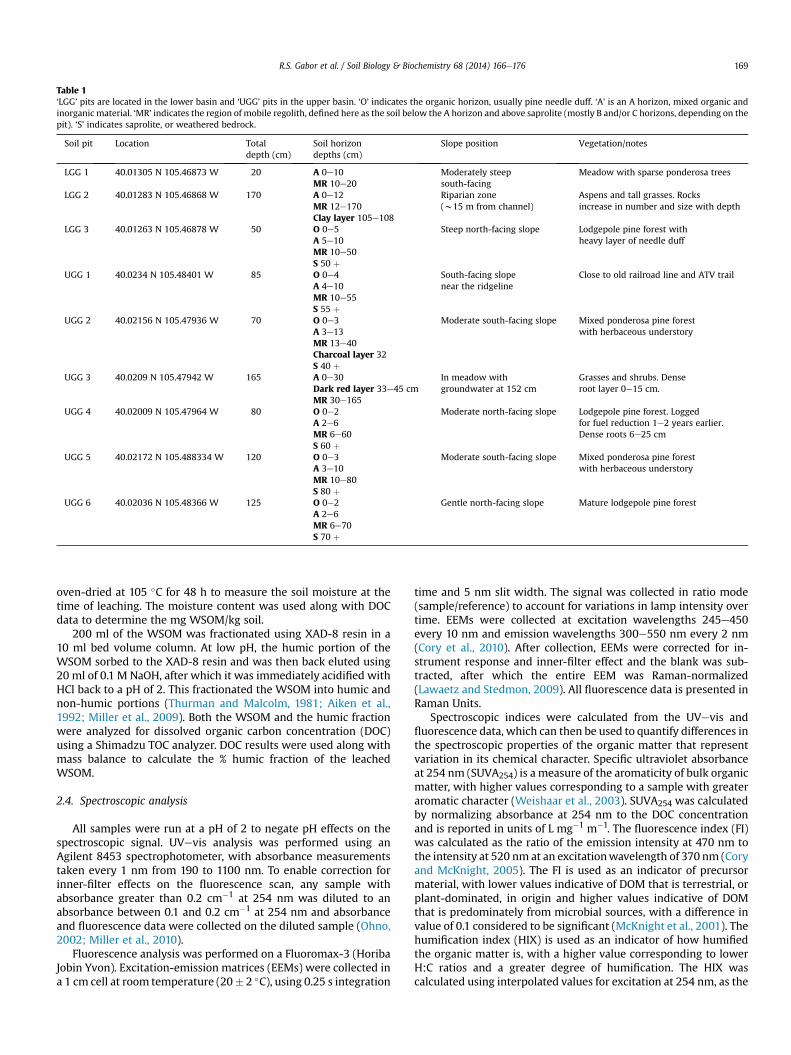
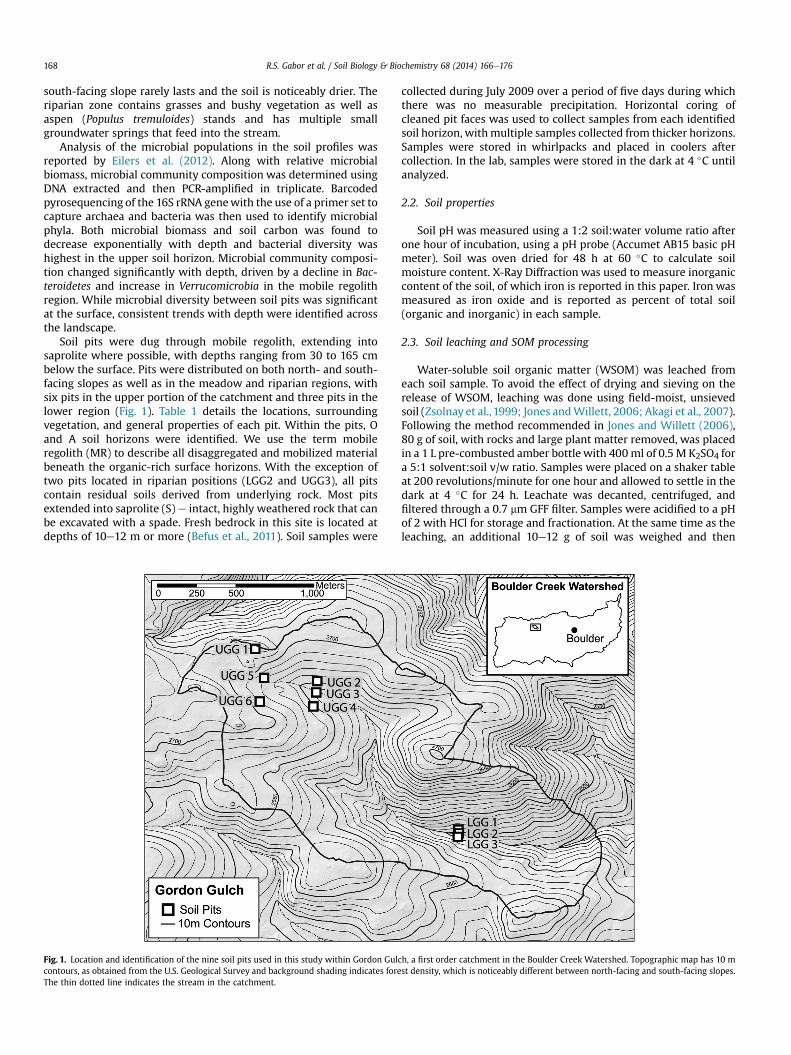
Table 1‘LGG’ pits are located in the lower basin and ‘UGG’ pits in the upper basin. ‘O’ indicates the organic horizon, usually pine needle duff. ‘A’ is an A horizon, mixed organic andinorganic material. ‘MR’ indicates the region of mobile regolith, defined here as the soil below the A horizon and above saprolite (mostly B and/or C horizons, depending on thepit). ‘S’ indicates saprolite, or weathered bedrock.
Soil pit Location Totaldepth (cm)
Soil horizondepths (cm)
Slope position Vegetation/notes
LGG 1 40.01305 N 105.46873 W 20 A 0e10MR 10e20
Moderately steepsouth-facing
Meadow with sparse ponderosa trees
LGG 2 40.01283 N 105.46868 W 170 A 0e12MR 12e170Clay layer 105e108
Riparian zone(w15 m from channel)
Aspens and tall grasses. Rocksincrease in number and size with depth
LGG 3 40.01263 N 105.46878 W 50 O 0e5A 5e10MR 10e50S 50 þ
Steep north-facing slope Lodgepole pine forest withheavy layer of needle duff
UGG 1 40.0234 N 105.48401 W 85 O 0e4A 4e10MR 10e55S 55 þ
South-facing slopenear the ridgeline
Close to old railroad line and ATV trail
UGG 2 40.02156 N 105.47936 W 70 O 0e3A 3e13MR 13e40Charcoal layer 32S 40 þ
Moderate south-facing slope Mixed ponderosa pine forestwith herbaceous understory
UGG 3 40.0209 N 105.47942 W 165 A 0e30Dark red layer 33e45 cmMR 30e165
In meadow withgroundwater at 152 cm
Grasses and shrubs. Denseroot layer 0e15 cm.
UGG 4 40.02009 N 105.47964 W 80 O 0e2A 2e6MR 6e60S 60 þ
Moderate north-facing slope Lodgepole pine forest. Loggedfor fuel reduction 1e2 years earlier.Dense roots 6e25 cm
UGG 5 40.02172 N 105.488334 W 120 O 0e3A 3e10MR 10e80S 80 þ
Moderate south-facing slope Mixed ponderosa pine forestwith herbaceous understory
UGG 6 40.02036 N 105.48366 W 125 O 0e2A 2e6MR 6e70S 70 þ
Gentle north-facing slope Mature lodgepole pine forest
R.S. Gabor et al. / Soil Biology & Biochemistry 68 (2014) 166e176 169
oven-dried at 105 �C for 48 h to measure the soil moisture at thetime of leaching. The moisture content was used along with DOCdata to determine the mg WSOM/kg soil.
200 ml of the WSOM was fractionated using XAD-8 resin in a10 ml bed volume column. At low pH, the humic portion of theWSOM sorbed to the XAD-8 resin and was then back eluted using20 ml of 0.1 M NaOH, after which it was immediately acidified withHCl back to a pH of 2. This fractionated the WSOM into humic andnon-humic portions (Thurman and Malcolm, 1981; Aiken et al.,1992; Miller et al., 2009). Both the WSOM and the humic fractionwere analyzed for dissolved organic carbon concentration (DOC)using a Shimadzu TOC analyzer. DOC results were used along withmass balance to calculate the % humic fraction of the leachedWSOM.
2.4. Spectroscopic analysis
All samples were run at a pH of 2 to negate pH effects on thespectroscopic signal. UVevis analysis was performed using anAgilent 8453 spectrophotometer, with absorbance measurementstaken every 1 nm from 190 to 1100 nm. To enable correction forinner-filter effects on the fluorescence scan, any sample withabsorbance greater than 0.2 cm�1 at 254 nm was diluted to anabsorbance between 0.1 and 0.2 cm�1 at 254 nm and absorbanceand fluorescence data were collected on the diluted sample (Ohno,2002; Miller et al., 2010).
Fluorescence analysis was performed on a Fluoromax-3 (HoribaJobin Yvon). Excitation-emission matrices (EEMs) were collected ina 1 cm cell at room temperature (20� 2 �C), using 0.25 s integration
time and 5 nm slit width. The signal was collected in ratio mode(sample/reference) to account for variations in lamp intensity overtime. EEMs were collected at excitation wavelengths 245e450every 10 nm and emission wavelengths 300e550 nm every 2 nm(Cory et al., 2010). After collection, EEMs were corrected for in-strument response and inner-filter effect and the blank was sub-tracted, after which the entire EEM was Raman-normalized(Lawaetz and Stedmon, 2009). All fluorescence data is presented inRaman Units.
Spectroscopic indices were calculated from the UVevis andfluorescence data, which can then be used to quantify differences inthe spectroscopic properties of the organic matter that representvariation in its chemical character. Specific ultraviolet absorbanceat 254 nm (SUVA254) is a measure of the aromaticity of bulk organicmatter, with higher values corresponding to a sample with greateraromatic character (Weishaar et al., 2003). SUVA254 was calculatedby normalizing absorbance at 254 nm to the DOC concentrationand is reported in units of L mg�1 m�1. The fluorescence index (FI)was calculated as the ratio of the emission intensity at 470 nm tothe intensity at 520 nm at an excitationwavelength of 370 nm (Coryand McKnight, 2005). The FI is used as an indicator of precursormaterial, with lower values indicative of DOM that is terrestrial, orplant-dominated, in origin and higher values indicative of DOMthat is predominately from microbial sources, with a difference invalue of 0.1 considered to be significant (McKnight et al., 2001). Thehumification index (HIX) is used as an indicator of how humifiedthe organic matter is, with a higher value corresponding to lowerH:C ratios and a greater degree of humification. The HIX wascalculated using interpolated values for excitation at 254 nm, as the
R.S. Gabor et al. / Soil Biology & Biochemistry 68 (2014) 166e176170
area under the peak from 435 to 480 nm emission divided by thearea under the peak from 300 to 345 nm emission (Zsolnay et al.,1999; Ohno, 2002).
2.5. Statistical analysis
In addition to the index calculations, EEMs were fit to the Cory-McKnight PARAFAC model, which was developed using samplesthat are biogeochemically representative of worldwide ecosystems(Cory and McKnight, 2005). Parallel factor analysis, or PARAFAC,separates the EEMs into component fluorophores that sum tocreate the entire fluorescence signal. The Cory-McKnight PARAFACmodel breaks each EEM into 13 component fluorophores, two ofwhich are identified as tryptophan-like and tyrosine-like. Theloadings from these two components were combined to identifythe % protein-like material present in each WSOM sample. Inaddition, the model identifies seven components as quinone-like,three of which are oxidized quinones and four are reduced qui-nones. The sum of the loadings of the reduced quinones divided bythe sum of the loadings of all seven quinones is defined as the redoxindex (RI) (Miller et al., 2006). Organic matter with quinone-likemoieties of a more reduced character has higher RI values whilemore oxidized moieties have lower values.
A 2-tailed T test was used to see if vegetation type could explaindifferences in organic matter chemistry in the surface layers of thepits. These layers were chosen because they are where the planteffect should be strongest. For this test, pits LGG1, UGG1, UGG2, andUGG5were considered to be dominated by ponderosa pine and pitsLGG3, UGG4, and UGG6 were considered to be dominated bylodgepole pine. Both FI and RI values from the top two samples ofeach pit were evaluated. A principal component analysis (PCA) wasdone using the microbial family-level relative abundances pre-sented in the supplementary data of Eilers et al. (2012). While thePCA presented in that paper included microbial data from
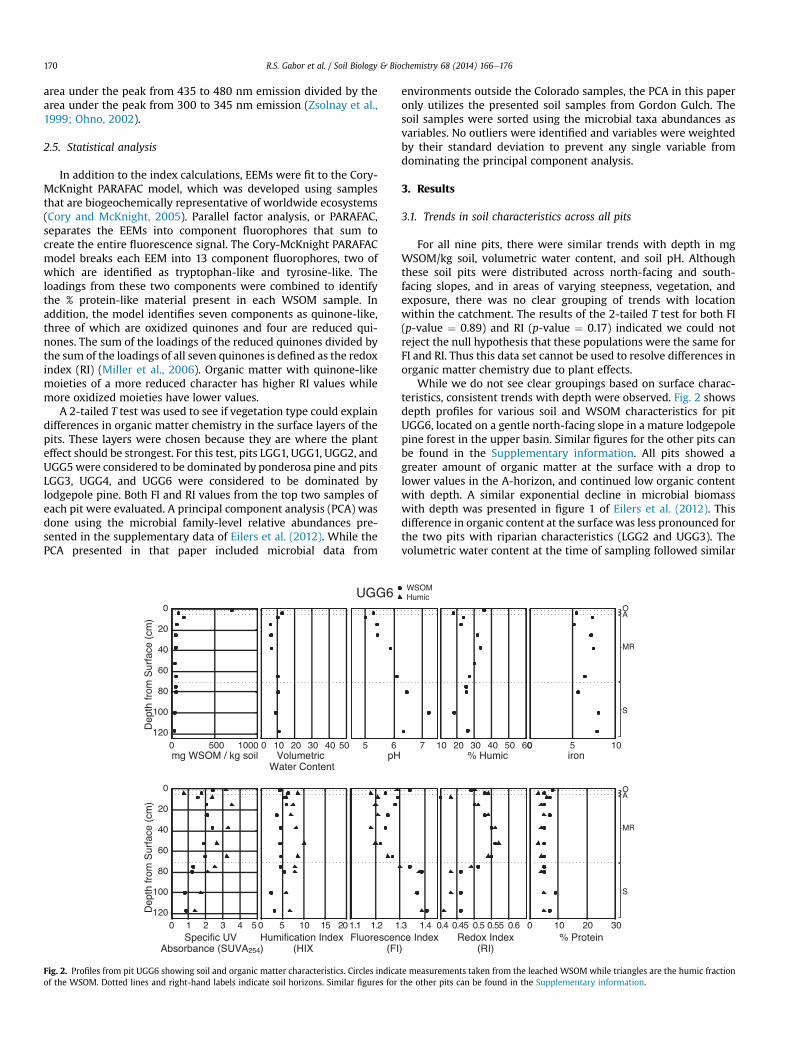
Fig. 2. Profiles from pit UGG6 showing soil and organic matter characteristics. Circles indicaof the WSOM. Dotted lines and right-hand labels indicate soil horizons. Similar figures for
environments outside the Colorado samples, the PCA in this paperonly utilizes the presented soil samples from Gordon Gulch. Thesoil samples were sorted using the microbial taxa abundances asvariables. No outliers were identified and variables were weightedby their standard deviation to prevent any single variable fromdominating the principal component analysis.
3. Results
3.1. Trends in soil characteristics across all pits
For all nine pits, there were similar trends with depth in mgWSOM/kg soil, volumetric water content, and soil pH. Althoughthese soil pits were distributed across north-facing and south-facing slopes, and in areas of varying steepness, vegetation, andexposure, there was no clear grouping of trends with locationwithin the catchment. The results of the 2-tailed T test for both FI(p-value ¼ 0.89) and RI (p-value ¼ 0.17) indicated we could notreject the null hypothesis that these populations were the same forFI and RI. Thus this data set cannot be used to resolve differences inorganic matter chemistry due to plant effects.
While we do not see clear groupings based on surface charac-teristics, consistent trends with depth were observed. Fig. 2 showsdepth profiles for various soil and WSOM characteristics for pitUGG6, located on a gentle north-facing slope in a mature lodgepolepine forest in the upper basin. Similar figures for the other pits canbe found in the Supplementary information. All pits showed agreater amount of organic matter at the surface with a drop tolower values in the A-horizon, and continued low organic contentwith depth. A similar exponential decline in microbial biomasswith depth was presented in figure 1 of Eilers et al. (2012). Thisdifference in organic content at the surfacewas less pronounced forthe two pits with riparian characteristics (LGG2 and UGG3). Thevolumetric water content at the time of sampling followed similar
te measurements taken from the leached WSOM while triangles are the humic fractionthe other pits can be found in the Supplementary information.
R.S. Gabor et al. / Soil Biology & Biochemistry 68 (2014) 166e176 171
trends, with the most moisture at the surface and a decrease withdepth. LGG2 had a less pronounced drop in moisture with depth,and UGG3 actually had volumetric water content peak around adepth of 40 cm and again at the sample around 160 cm, which wastaken near the water table. The soil pH followed an inverse trend tothe WSOM content, with pH increasing from around 5 at the sur-face down to 7 as WSOM decreased. In most cases the soil pH washighest at the bottom-most sample, although in a few pits in theupper basin where deeper saprolite was sampled, the pH becamemore acidic at the lowest sample. In pits where ironwas measured,there was a small increase in iron content of the soil with depth,from below 5% at the surface to as much as 10% in the deepestsample. This increase in iron cannot be entirely explained by thedecrease in organic matter as a percent of soil content.
The chemical character of the WSOM also changed with depth.These trends could be seen in both the total extracted WSOM(Fig. 2, circles) and the humic fraction of the WSOM (Fig. 2, tri-angles). The FI value for the humic fractionwas consistently slightlylower than for theWSOM and the RI valuewas slightly higher in thehumic fraction. For both the FI and RI, the values were almost thesame between the WSOM and humic fraction, and followed thesame overall trend with depth. For SUVA254 and HIX there was alarger difference between the values of each sample, in both caseshaving higher values for the humic portion than the total extractedWSOM, but the trends with depth still followed the same pattern.Because of the similarity of these trends, all subsequent figures andresults will focus on the humic fraction of the WSOM, whichdominates the fluorescently active, chromophoric part of theWSOM, and thus drives any overall trends in chemical fluorescence.In addition to trends in fluorescence data, soil pits had lower SUVAvalues at depth (w1) than at the surface (w4), indicating less ar-omatic, smaller molecules in the deeper part of the profile. In mostpits, the percent of the WSOM that is humic material was higher atthe surface, 40e50%, and dropped down to below 20% with depth,indicating less total humic material in deeper soil horizons.
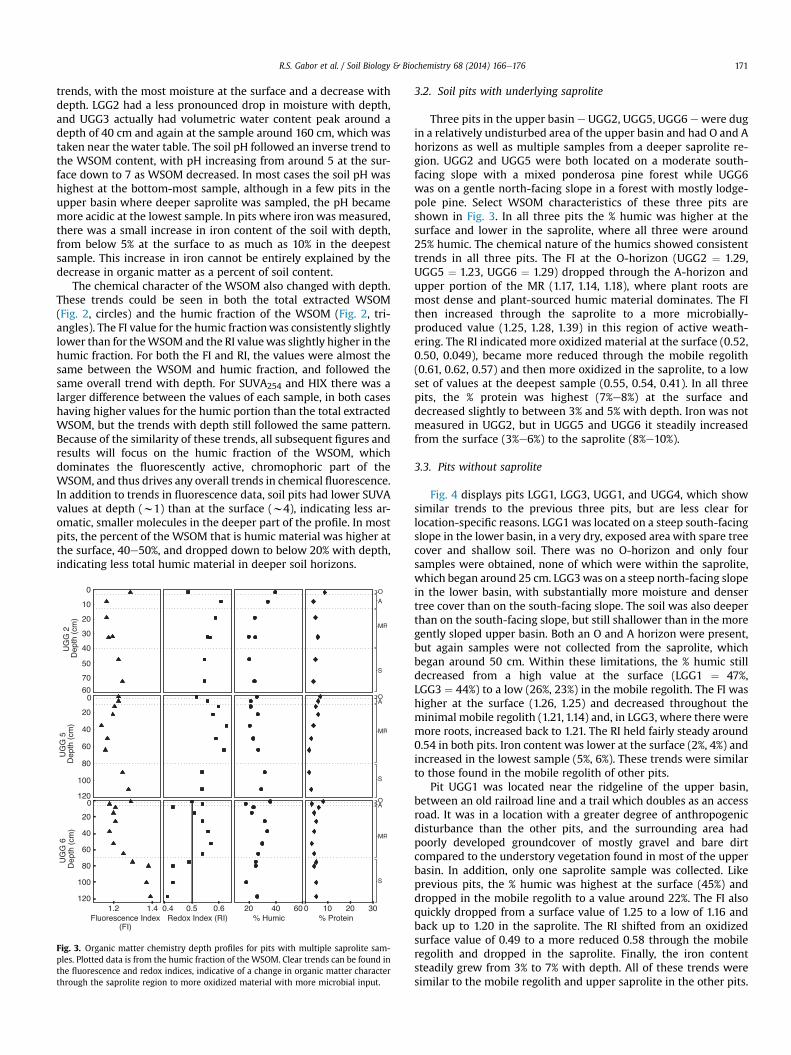
Fig. 3. Organic matter chemistry depth profiles for pits with multiple saprolite sam-ples. Plotted data is from the humic fraction of the WSOM. Clear trends can be found inthe fluorescence and redox indices, indicative of a change in organic matter characterthrough the saprolite region to more oxidized material with more microbial input.
3.2. Soil pits with underlying saprolite
Three pits in the upper basin e UGG2, UGG5, UGG6 ewere dugin a relatively undisturbed area of the upper basin and had O and Ahorizons as well as multiple samples from a deeper saprolite re-gion. UGG2 and UGG5 were both located on a moderate south-facing slope with a mixed ponderosa pine forest while UGG6was on a gentle north-facing slope in a forest with mostly lodge-pole pine. Select WSOM characteristics of these three pits areshown in Fig. 3. In all three pits the % humic was higher at thesurface and lower in the saprolite, where all three were around25% humic. The chemical nature of the humics showed consistenttrends in all three pits. The FI at the O-horizon (UGG2 ¼ 1.29,UGG5 ¼ 1.23, UGG6 ¼ 1.29) dropped through the A-horizon andupper portion of the MR (1.17, 1.14, 1.18), where plant roots aremost dense and plant-sourced humic material dominates. The FIthen increased through the saprolite to a more microbially-produced value (1.25, 1.28, 1.39) in this region of active weath-ering. The RI indicated more oxidized material at the surface (0.52,0.50, 0.049), became more reduced through the mobile regolith(0.61, 0.62, 0.57) and then more oxidized in the saprolite, to a lowset of values at the deepest sample (0.55, 0.54, 0.41). In all threepits, the % protein was highest (7%e8%) at the surface anddecreased slightly to between 3% and 5% with depth. Iron was notmeasured in UGG2, but in UGG5 and UGG6 it steadily increasedfrom the surface (3%e6%) to the saprolite (8%e10%).
3.3. Pits without saprolite
Fig. 4 displays pits LGG1, LGG3, UGG1, and UGG4, which showsimilar trends to the previous three pits, but are less clear forlocation-specific reasons. LGG1 was located on a steep south-facingslope in the lower basin, in a very dry, exposed area with spare treecover and shallow soil. There was no O-horizon and only foursamples were obtained, none of which were within the saprolite,which began around 25 cm. LGG3was on a steep north-facing slopein the lower basin, with substantially more moisture and densertree cover than on the south-facing slope. The soil was also deeperthan on the south-facing slope, but still shallower than in the moregently sloped upper basin. Both an O and A horizon were present,but again samples were not collected from the saprolite, whichbegan around 50 cm. Within these limitations, the % humic stilldecreased from a high value at the surface (LGG1 ¼ 47%,LGG3 ¼ 44%) to a low (26%, 23%) in the mobile regolith. The FI washigher at the surface (1.26, 1.25) and decreased throughout theminimal mobile regolith (1.21, 1.14) and, in LGG3, where there weremore roots, increased back to 1.21. The RI held fairly steady around0.54 in both pits. Iron content was lower at the surface (2%, 4%) andincreased in the lowest sample (5%, 6%). These trends were similarto those found in the mobile regolith of other pits.
Pit UGG1 was located near the ridgeline of the upper basin,between an old railroad line and a trail which doubles as an accessroad. It was in a location with a greater degree of anthropogenicdisturbance than the other pits, and the surrounding area hadpoorly developed groundcover of mostly gravel and bare dirtcompared to the understory vegetation found in most of the upperbasin. In addition, only one saprolite sample was collected. Likeprevious pits, the % humic was highest at the surface (45%) anddropped in the mobile regolith to a value around 22%. The FI alsoquickly dropped from a surface value of 1.25 to a low of 1.16 andback up to 1.20 in the saprolite. The RI shifted from an oxidizedsurface value of 0.49 to a more reduced 0.58 through the mobileregolith and dropped in the saprolite. Finally, the iron contentsteadily grew from 3% to 7% with depth. All of these trends weresimilar to the mobile regolith and upper saprolite in the other pits.
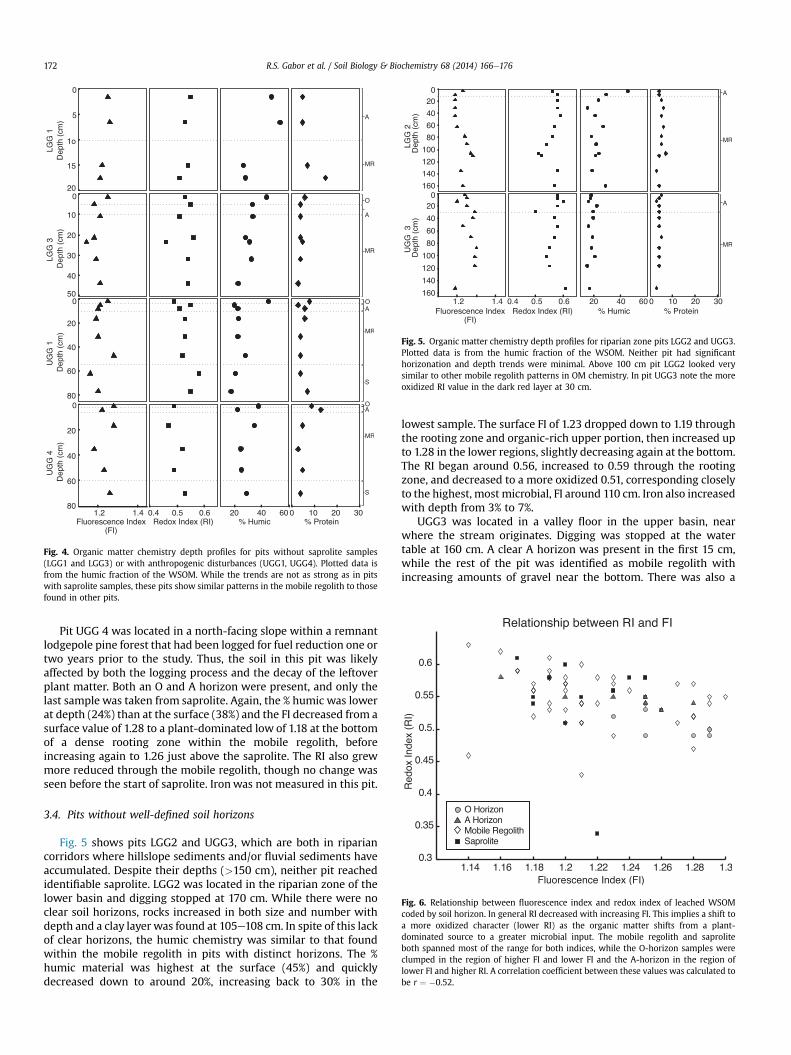
Fig. 4. Organic matter chemistry depth profiles for pits without saprolite samples(LGG1 and LGG3) or with anthropogenic disturbances (UGG1, UGG4). Plotted data isfrom the humic fraction of the WSOM. While the trends are not as strong as in pitswith saprolite samples, these pits show similar patterns in the mobile regolith to thosefound in other pits.
Fig. 5. Organic matter chemistry depth profiles for riparian zone pits LGG2 and UGG3.Plotted data is from the humic fraction of the WSOM. Neither pit had significanthorizonation and depth trends were minimal. Above 100 cm pit LGG2 looked verysimilar to other mobile regolith patterns in OM chemistry. In pit UGG3 note the moreoxidized RI value in the dark red layer at 30 cm.
Fig. 6. Relationship between fluorescence index and redox index of leached WSOMcoded by soil horizon. In general RI decreased with increasing FI. This implies a shift toa more oxidized character (lower RI) as the organic matter shifts from a plant-dominated source to a greater microbial input. The mobile regolith and saproliteboth spanned most of the range for both indices, while the O-horizon samples wereclumped in the region of higher FI and lower FI and the A-horizon in the region oflower FI and higher RI. A correlation coefficient between these values was calculated tobe r ¼ �0.52.
R.S. Gabor et al. / Soil Biology & Biochemistry 68 (2014) 166e176172
Pit UGG 4 was located in a north-facing slope within a remnantlodgepole pine forest that had been logged for fuel reduction one ortwo years prior to the study. Thus, the soil in this pit was likelyaffected by both the logging process and the decay of the leftoverplant matter. Both an O and A horizon were present, and only thelast sample was taken from saprolite. Again, the % humic was lowerat depth (24%) than at the surface (38%) and the FI decreased from asurface value of 1.28 to a plant-dominated low of 1.18 at the bottomof a dense rooting zone within the mobile regolith, beforeincreasing again to 1.26 just above the saprolite. The RI also grewmore reduced through the mobile regolith, though no change wasseen before the start of saprolite. Ironwas not measured in this pit.
3.4. Pits without well-defined soil horizons
Fig. 5 shows pits LGG2 and UGG3, which are both in ripariancorridors where hillslope sediments and/or fluvial sediments haveaccumulated. Despite their depths (>150 cm), neither pit reachedidentifiable saprolite. LGG2 was located in the riparian zone of thelower basin and digging stopped at 170 cm. While there were noclear soil horizons, rocks increased in both size and number withdepth and a clay layer was found at 105e108 cm. In spite of this lackof clear horizons, the humic chemistry was similar to that foundwithin the mobile regolith in pits with distinct horizons. The %humic material was highest at the surface (45%) and quicklydecreased down to around 20%, increasing back to 30% in the
lowest sample. The surface FI of 1.23 dropped down to 1.19 throughthe rooting zone and organic-rich upper portion, then increased upto 1.28 in the lower regions, slightly decreasing again at the bottom.The RI began around 0.56, increased to 0.59 through the rootingzone, and decreased to a more oxidized 0.51, corresponding closelyto the highest, most microbial, FI around 110 cm. Iron also increasedwith depth from 3% to 7%.
UGG3 was located in a valley floor in the upper basin, nearwhere the stream originates. Digging was stopped at the watertable at 160 cm. A clear A horizon was present in the first 15 cm,while the rest of the pit was identified as mobile regolith withincreasing amounts of gravel near the bottom. There was also a
R.S. Gabor et al. / Soil Biology & Biochemistry 68 (2014) 166e176 173
distinct red layer at 30e40 cm depth, where there was also a highvolumetric water content and increased iron content. The humiccontent fluctuated between 17% and 22%, without the larger surfacevalue found in other pits. The FI increased through the regolith from1.20 to 1.30, and then dropped back down to 1.18 in the sample atthe water table. The RI showed an increasingly oxidized characterwith depth, with values falling from 0.60 to 0.54, with a sharp, briefdrop to 0.50 in the red layer, and finally had a more reduced (0.62)value at the water table. Iron was only measured in the upperlayers, but increased from 4.5% just below the surface to 5.5% in the30 cm layer.
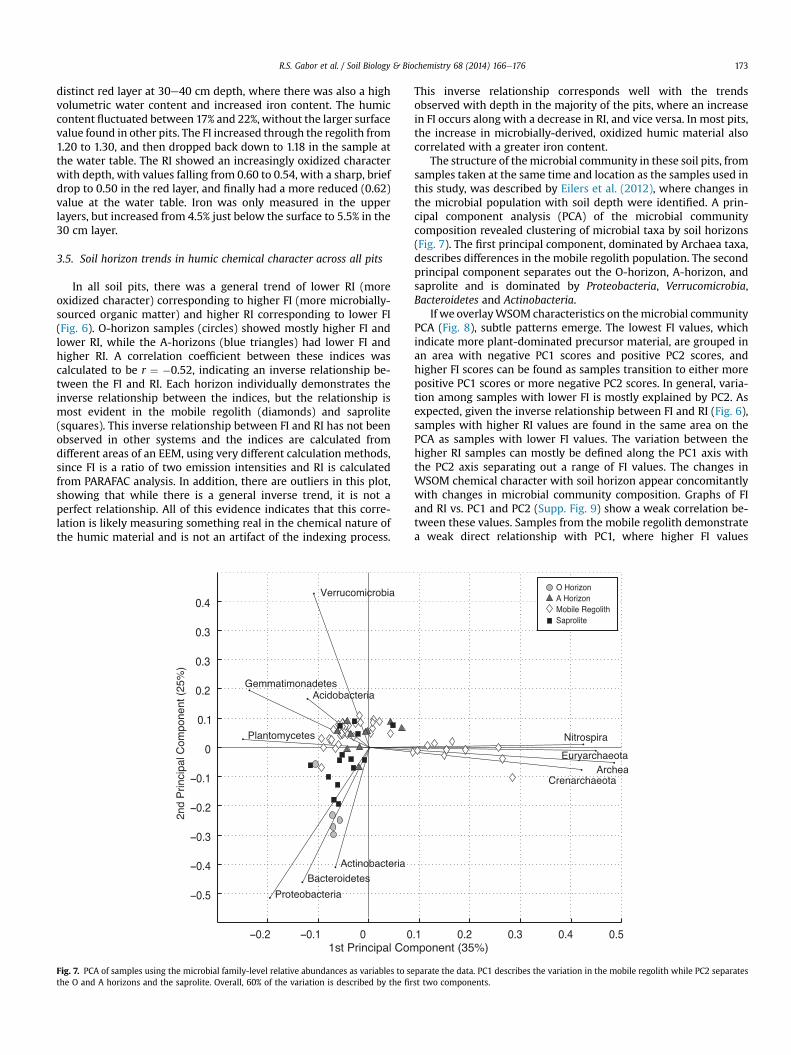
3.5. Soil horizon trends in humic chemical character across all pits
In all soil pits, there was a general trend of lower RI (moreoxidized character) corresponding to higher FI (more microbially-sourced organic matter) and higher RI corresponding to lower FI(Fig. 6). O-horizon samples (circles) showed mostly higher FI andlower RI, while the A-horizons (blue triangles) had lower FI andhigher RI. A correlation coefficient between these indices wascalculated to be r ¼ �0.52, indicating an inverse relationship be-tween the FI and RI. Each horizon individually demonstrates theinverse relationship between the indices, but the relationship ismost evident in the mobile regolith (diamonds) and saprolite(squares). This inverse relationship between FI and RI has not beenobserved in other systems and the indices are calculated fromdifferent areas of an EEM, using very different calculation methods,since FI is a ratio of two emission intensities and RI is calculatedfrom PARAFAC analysis. In addition, there are outliers in this plot,showing that while there is a general inverse trend, it is not aperfect relationship. All of this evidence indicates that this corre-lation is likely measuring something real in the chemical nature ofthe humic material and is not an artifact of the indexing process.
Fig. 7. PCA of samples using the microbial family-level relative abundances as variables to sethe O and A horizons and the saprolite. Overall, 60% of the variation is described by the fir
This inverse relationship corresponds well with the trendsobserved with depth in the majority of the pits, where an increasein FI occurs along with a decrease in RI, and vice versa. In most pits,the increase in microbially-derived, oxidized humic material alsocorrelated with a greater iron content.
The structure of themicrobial community in these soil pits, fromsamples taken at the same time and location as the samples used inthis study, was described by Eilers et al. (2012), where changes inthe microbial population with soil depth were identified. A prin-cipal component analysis (PCA) of the microbial communitycomposition revealed clustering of microbial taxa by soil horizons(Fig. 7). The first principal component, dominated by Archaea taxa,describes differences in the mobile regolith population. The secondprincipal component separates out the O-horizon, A-horizon, andsaprolite and is dominated by Proteobacteria, Verrucomicrobia,Bacteroidetes and Actinobacteria.
If we overlayWSOM characteristics on themicrobial communityPCA (Fig. 8), subtle patterns emerge. The lowest FI values, whichindicate more plant-dominated precursor material, are grouped inan area with negative PC1 scores and positive PC2 scores, andhigher FI scores can be found as samples transition to either morepositive PC1 scores or more negative PC2 scores. In general, varia-tion among samples with lower FI is mostly explained by PC2. Asexpected, given the inverse relationship between FI and RI (Fig. 6),samples with higher RI values are found in the same area on thePCA as samples with lower FI values. The variation between thehigher RI samples can mostly be defined along the PC1 axis withthe PC2 axis separating out a range of FI values. The changes inWSOM chemical character with soil horizon appear concomitantlywith changes in microbial community composition. Graphs of FIand RI vs. PC1 and PC2 (Supp. Fig. 9) show a weak correlation be-tween these values. Samples from the mobile regolith demonstratea weak direct relationship with PC1, where higher FI values
parate the data. PC1 describes the variation in the mobile regolith while PC2 separatesst two components.
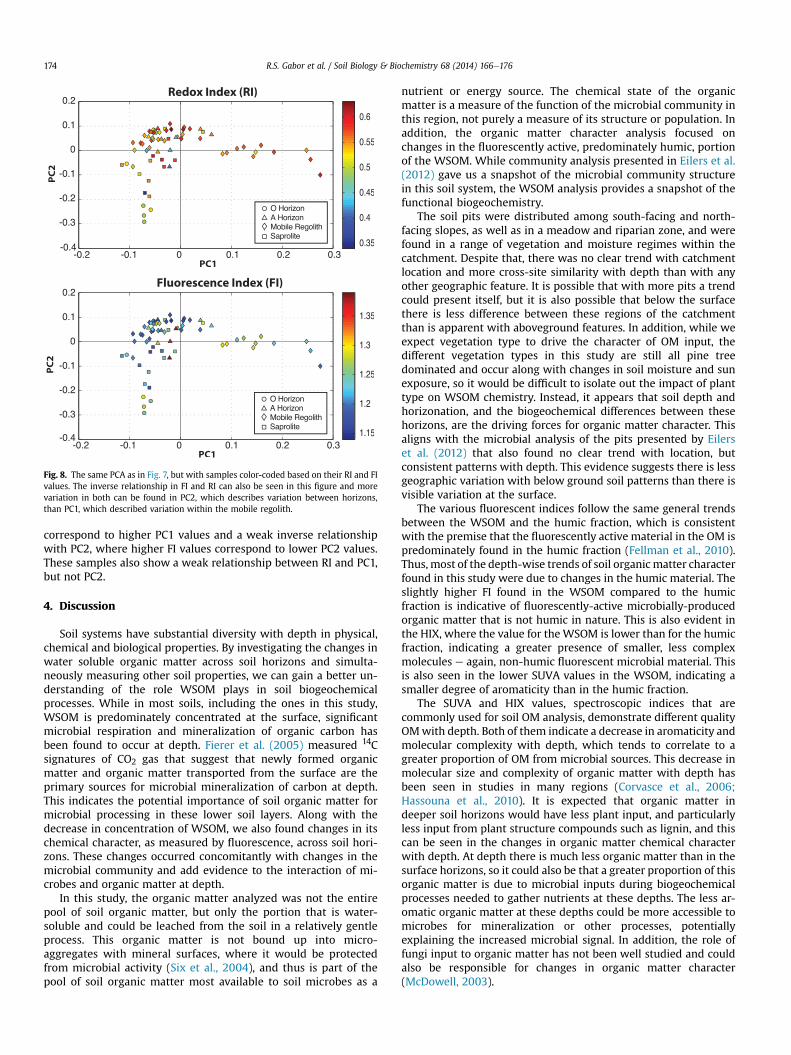
Fig. 8. The same PCA as in Fig. 7, but with samples color-coded based on their RI and FIvalues. The inverse relationship in FI and RI can also be seen in this figure and morevariation in both can be found in PC2, which describes variation between horizons,than PC1, which described variation within the mobile regolith.
R.S. Gabor et al. / Soil Biology & Biochemistry 68 (2014) 166e176174
correspond to higher PC1 values and a weak inverse relationshipwith PC2, where higher FI values correspond to lower PC2 values.These samples also show a weak relationship between RI and PC1,but not PC2.
4. Discussion
Soil systems have substantial diversity with depth in physical,chemical and biological properties. By investigating the changes inwater soluble organic matter across soil horizons and simulta-neously measuring other soil properties, we can gain a better un-derstanding of the role WSOM plays in soil biogeochemicalprocesses. While in most soils, including the ones in this study,WSOM is predominately concentrated at the surface, significantmicrobial respiration and mineralization of organic carbon hasbeen found to occur at depth. Fierer et al. (2005) measured 14Csignatures of CO2 gas that suggest that newly formed organicmatter and organic matter transported from the surface are theprimary sources for microbial mineralization of carbon at depth.This indicates the potential importance of soil organic matter formicrobial processing in these lower soil layers. Along with thedecrease in concentration of WSOM, we also found changes in itschemical character, as measured by fluorescence, across soil hori-zons. These changes occurred concomitantly with changes in themicrobial community and add evidence to the interaction of mi-crobes and organic matter at depth.
In this study, the organic matter analyzed was not the entirepool of soil organic matter, but only the portion that is water-soluble and could be leached from the soil in a relatively gentleprocess. This organic matter is not bound up into micro-aggregates with mineral surfaces, where it would be protectedfrom microbial activity (Six et al., 2004), and thus is part of thepool of soil organic matter most available to soil microbes as a
nutrient or energy source. The chemical state of the organicmatter is a measure of the function of the microbial community inthis region, not purely a measure of its structure or population. Inaddition, the organic matter character analysis focused onchanges in the fluorescently active, predominately humic, portionof the WSOM. While community analysis presented in Eilers et al.(2012) gave us a snapshot of the microbial community structurein this soil system, the WSOM analysis provides a snapshot of thefunctional biogeochemistry.
The soil pits were distributed among south-facing and north-facing slopes, as well as in a meadow and riparian zone, and werefound in a range of vegetation and moisture regimes within thecatchment. Despite that, there was no clear trend with catchmentlocation and more cross-site similarity with depth than with anyother geographic feature. It is possible that with more pits a trendcould present itself, but it is also possible that below the surfacethere is less difference between these regions of the catchmentthan is apparent with aboveground features. In addition, while weexpect vegetation type to drive the character of OM input, thedifferent vegetation types in this study are still all pine treedominated and occur along with changes in soil moisture and sunexposure, so it would be difficult to isolate out the impact of planttype on WSOM chemistry. Instead, it appears that soil depth andhorizonation, and the biogeochemical differences between thesehorizons, are the driving forces for organic matter character. Thisaligns with the microbial analysis of the pits presented by Eilerset al. (2012) that also found no clear trend with location, butconsistent patterns with depth. This evidence suggests there is lessgeographic variation with below ground soil patterns than there isvisible variation at the surface.
The various fluorescent indices follow the same general trendsbetween the WSOM and the humic fraction, which is consistentwith the premise that the fluorescently active material in the OM ispredominately found in the humic fraction (Fellman et al., 2010).Thus, most of the depth-wise trends of soil organicmatter characterfound in this study were due to changes in the humic material. Theslightly higher FI found in the WSOM compared to the humicfraction is indicative of fluorescently-active microbially-producedorganic matter that is not humic in nature. This is also evident inthe HIX, where the value for theWSOM is lower than for the humicfraction, indicating a greater presence of smaller, less complexmolecules e again, non-humic fluorescent microbial material. Thisis also seen in the lower SUVA values in the WSOM, indicating asmaller degree of aromaticity than in the humic fraction.
The SUVA and HIX values, spectroscopic indices that arecommonly used for soil OM analysis, demonstrate different qualityOMwith depth. Both of them indicate a decrease in aromaticity andmolecular complexity with depth, which tends to correlate to agreater proportion of OM from microbial sources. This decrease inmolecular size and complexity of organic matter with depth hasbeen seen in studies in many regions (Corvasce et al., 2006;Hassouna et al., 2010). It is expected that organic matter indeeper soil horizons would have less plant input, and particularlyless input from plant structure compounds such as lignin, and thiscan be seen in the changes in organic matter chemical characterwith depth. At depth there is much less organic matter than in thesurface horizons, so it could also be that a greater proportion of thisorganic matter is due to microbial inputs during biogeochemicalprocesses needed to gather nutrients at these depths. The less ar-omatic organic matter at these depths could be more accessible tomicrobes for mineralization or other processes, potentiallyexplaining the increased microbial signal. In addition, the role offungi input to organic matter has not been well studied and couldalso be responsible for changes in organic matter character(McDowell, 2003).
R.S. Gabor et al. / Soil Biology & Biochemistry 68 (2014) 166e176 175
In the surface horizons of the soil, the FI shows a mixture ofplant and microbial input to the WSOM pool and the RI indicatesrelatively oxidized material, unsurprising in an environmentexposed to substantial sun and oxygen. Just below the A horizons,where there is still more dense root coverage, the FI drops to amoreplant-dominated signal, and the RI to a more reduced character.The organic matter character then noticeably changes across theboundary between mobile regolith and saprolite. Through thesaprolite, the FI shifts to a higher, more microbial, signal, and the RIindicates more oxidized character to the OM. In addition, withinthis deeper soil many of the pits showed an increase in proteincharacter in the OM and an increase in the portion of WSOM that ishumic in nature. This increase in humic material, which corre-sponds with an increase in microbial FI signal, indicates the humicinput in these deep layers is primarily microbial in nature. Thiscould be due to microbial processing or organic matter that iscarried by water from higher in the soil column, or it could be aresult of cell lysis and exudates from the microbial population atdepth (Fierer et al., 2005; Corvasce et al., 2006).
The range of redox index found in this study is as large as thatfound in studies that compare samples over a variety of spatial andtemporal changes (Miller et al., 2006; Mladenov et al., 2010),indicating a substantial change in redox character of the organicmatter with soil depth. The more oxidized material at depth isunexpected, given the lower oxygen environment in the saproliteas compared to the surface. It could be that reduced organic matteris more labile, and thus preferentially utilized by microbes, leavingmore of the oxidized humics behind (Kalbitz et al., 2003). It is alsopossible that the more reduced OM is more tightly bound to min-eral complexes, leaving the more oxidized material to be trans-ported to deeper horizons. In addition, this more oxidizedenvironment is found in the saprolite, where the soil has not beenmixed, so the in situ production of OM in this area could lean to-wards more oxidized organic matter.
The change in redox index could also be due to biogeochemicalprocessing of existing organic matter. Microbial reduction of dis-solved humic material coupled with oxidation of iron species hasbeen observed in sediment systems (Chen et al., 2003; Kappleret al., 2004; Bauer and Kappler, 2009; Rakshit et al., 2009; Broseand James, 2010). Roden et al. (2010) demonstrated that microbescould also reduce humics in solid form, in addition to dissolved. Thecorrelation of FI and RI found here could be indicative of a similarbiogeochemical process. While the lower soil layers are notcompletely anoxic, microbes could still be reducing this humicmaterial. Organic matter in the saprolite shifted to amoremicrobialFI signal and a more oxidized RI, corresponding with an increase iniron content of the soil. In this horizon with active bedrockweathering, the humics were then more oxidized, which could bedue to electron transfer from the humics to the partially weatheredrock. In this matter, it is possible that the FI and RI changes in depthare indicative of organic matter acting as an electron shuttle be-tween microbes and bedrock, impacting the bedrock weatheringprocess.
The concomitant changes between microbial community andorganic matter character with depth indicate a possible connectionbetween these soil properties. The PCA results, which separate thesamples based on their microbial community composition, alsoplace samples from the same horizon in similar locations on thegraph, regardless of geographic pit location. Populations of Verru-comicrobia, Proteobacteria, Bacteroidetes and Actinobacteria pre-dominately define the variation between soil horizons and alsooccur along a gradient in the RI. Nitrospira, Euryarchaeota, Archaeaand Crenarchaeota predominately describe variation within themobile regolith, and separate out changes in FI And RI. There ap-pears to be changes in organic matter chemical character that occur
concomitantly with changes in the microbial community. Bycombining microbial analysis of a soil system with chemical anal-ysis of the organic matter, we can get a snapshot of not just thecommunity population and structure, but also of the biogeo-chemical role it is playing in the system. While the data presentedhere is not sufficient to identify those biogeochemical processesspecifically, it does suggest a connection with depth between mi-crobial community composition and organic matter chemistry.
5. Conclusion
Within this montane catchment, the chemical character ofwater-soluble organic matter in soil showedmuch greater variationwith depth than with landscape position and vegetation type. Thisoccurred concomitantly with changes in the microbial population,which showed more diversity with depth thanwith position acrossthe landscape. Organic matter chemistry distinctly changed be-tween soil horizons, with high plant precursor material and agenerally oxidized state in the A horizon, shifting to more reducedcharacter through the mobile regolith, and becoming moremicrobially-produced and, again, oxidized in the saprolite. Overallaromaticity andmolecular complexity also decreased with depth. Acorrelation between the FI and RI values indicates more oxidizedquinone-like moieties in organic matter with more microbial pre-cursor material. This suggests a possible correlation between mi-crobial activity and the chemical character of organic matter in soilsystems. In addition, it could be in situ evidence that, just as mi-crobes in aquatic systems use organic matter as an electron shuttlefor the reduction of iron, in terrestrial systems microbes may beutilizing humic material as an electron shuttle during bedrockweathering. This research suggests that the chemical character ofsoil organic matter and microbial activity are interdependent,although further work is needed to identify the specific relation-ship and determine which microbial taxa are actively impactingOM character.
Acknowledgments
We would like to thank Rory Cowie, Nate Rock, Jeana Lee,Spencer Debenport, the CZO field staff, and the many un-dergraduates who helped dig the pits analyzed in this study. Wewould like to thank Alex Blum and Wendy Roth for assistance withthe soil characterization and Eric Parrish for help with the figures.Mike Sanclements, Alexis Templeton, Phil Taylor, and Terry Leggprovided helpful advice for sample analysis. This study was fundedby the Boulder Creek Critical Zone Observatory (NSF-0724960).
Appendix A. Supplementary data
Supplementary data related to this article can be found at http://dx.doi.org/10.1016/j.soilbio.2013.09.029.
References
Aiken, G.R., McKnight, D.M., Thorn, K.A., Thurman, E.M., 1992. Isolation of hydro-philic organic acids from water using nonionic macroporous resins. Org. Geo-chem. 18, 567e573.
Akagi, J., Zsolnay, A., Bastida, F., 2007. Quantity and spectroscopic properties ofdissolved organic matter (DOM) as a function of soil sample treatments: air-dying and pre-incubation. Chemosphere 69, 1040e1046.
Bauer, I., Kappler, A., 2009. Rates and extent of reduction of Fe(III) compounds andO2 by humic substances. Environ. Sci. Technol. 43, 4902e4908.
Befus, K.M., Sheehan, A.F., Leopold, M., Anderson, S.P., Anderson, R.,S., 2011. Seismicconstraints on critical zone architecture, Boulder Creek watershed, front range,Colorado. Vadose Zone J. 10, 915e927.
Brose, D.A., James, B.,R., 2010. Oxidation-reduction transformations of chromium inaerobic soils and the roles of electron-shuttling quinones. Environ. Sci. Technol.44, 9438e9444.
R.S. Gabor et al. / Soil Biology & Biochemistry 68 (2014) 166e176176
Chen, J., Gu, B., Royer, R.A., Burgos, W.D., 2003. The roles of natural organic matter inchemical and microbial reduction of ferric iron. Sci. Total Environ. 307, 167e178.
Chorover, J., Kretzschmer, R., Garcia-Pichel, F., Sparks, D.L., 2007. Soil biogeochem-ical processes within the critical zone. Elements 3, 321e326.
Corvasce, M., Zsolnay, A., D’Orazio, V., Lopez, R., Miano, T., 2006. Characterization ofwater extractable organic matter in a deep soil profile. Chemosphere 62, 1583e1590.
Cory, R.M., McKnight, D.M., 2005. Fluorescence spectroscopy reveals ubiquitouspresence of oxidized and reduced quinones in dissolved organic matter. Envi-ron. Sci. Technol. 39, 8142e8149.
Cory, R.M., Miller, M.P., McKnight, D.M., Guerard, J.J., Miller, P.L., 2010. Effect ofinstrument-specific response on the analysis of fulvic acid fluorescence spectra.Limnol. Oceanogr. Methods 8, 67e78.
Eilers, K.G., Debenport, S., Anderson, S., Fierer, N., 2012. Digging deeper to findunique microbial communities: the strong effect of depth on the structure ofbacterial and archaeal communities in soil. Soil Biol. Biochem. 50, 58e65.
Fellman, J.B., Hood, E., Spencer, R.G.M., 2010. Fluorescence spectroscopy opens newwindows into dissolved organic matter dynamics in freshwater ecosystems: areview. Limnol. Oceanogr. 55, 2452e2462.
Fierer, N., Chadwick, O.A., Trumbore, S.E., 2005. Productions of CO2 in soil profiles ofa California Annual Grassland. Ecosystems 8, 412e429.
Fierer, N., Grandky, A.S., Six, J., Paul, E.A., 2009. Searching for unifying principles insoil ecology. Soil Biol. Biochem. 41, 2249e2256.
Fulton, J.R., McKnight, D.M., Foreman, C.M., Cory, R.M., Stedmon, C., Blunt, E., 2004.Changes in fulvic acid redox state through the oxycline of a permanently ice-covered Antarctic lake. Aquat. Sci. 66, 27e46.
Hassouna, M., Massiani, C., Dudal, Y., Pech, N., Theraulax, F., 2010. Changes in waterextractable organic matter (WEOM) in calcareous soil under field conditionswith time and soil depth. Geoderma 155, 75e85.
Jones, D.L., Willett, V.B., 2006. Experimental evaluation of methods to quantifydissolved organic nitrogen (DON) and dissolved organic carbon (DOC) in soil.Soil Biol. Biochem. 38, 991e999.
Kalbitz, K., Schmerwitz, J., Schwesig, D., Matzner, E., 2003. Biodegradation of soil-derived dissolved organic matter as related to its properties. Geoderma 113,273e291.
Kappler, A., Benz, M., Schink, B., Brune, A., 2004. Electron shuttling via humic acidsin microbial iron(III) reduction in a freshwater sediment. FEMS Microbiol. Ecol.47, 85e92.
Klapper, L., McKnight, D.M., Fulton, J.R., Blunt-Harris, E.L., Nevin, K.P., Lovley, D.R.,Hatcher, P.G., 2002. Fulvic acid oxidation state detection using fluorescencespectroscopy. Environ. Sci. Technol. 36, 3170e3175.
Kögel-Knabner, I., 2002. The macromolecular organic composition of plant and mi-crobial residues as inputs to soil organic matter. Soil Biol. Biochem. 34, 139e162.
Lawaetz, A.J., Stedmon, C.A., 2009. Fluorescence intensity calibration using theRaman peak of water. Appl. Spectrosc. 63, 936e940.
Lovley, D.R., Coates, J.D., Blunt-Harris, E.L., Phillips, E.J.P., Woodward, J.C., 1996.Humic substances as electron acceptors for microbial respiration. Nature 382,445e448.
Marschner, B., Kalbitz, K., 2003. Controls of bioavailability and biodegradability ofdissolved organic matter in soils. Geoderma 113, 211e235.
McDowell, W.H., 2003. Dissolved organic matter in soils e future directions andunanswered questions. Geoderma 113, 179e186.
McKnight, D.M., Boyer, E.W., Westerhoff, P.K., Doran, P.T., Kulbe, T., Andersen, D.T.,2001. Spectrofluorometric characterization of dissolved organic matter forindication of precursor organic material and aromaticity. Limnol. Oceanogr. 46,38e48.
Miller, M.P., McKnight, D.M., Cory, R.M., Williams, M.W., Runkel, R.L., 2006. Hypo-rheic exchange and fulvic acid redox reactions in an alpine stream/wetlandecosystem, Colorado Front Range. Environ. Sci. Technol. 40, 5943e5949.
Miller, M.P., McKnight, D.M., Chapra, S.C., Williams, M.W., 2009. A model ofdegradation and production of three pools of dissolved organic matter in analpine lake. Limnol. Oceanogr. 54, 2213e2227.
Miller, M.P., Simone, B.E., McKnight, D.M., Cory, R.M., Williams, M.W., Boyer, E.W.,2010. New light on a dark subject: comment. Aquat. Sci.. http://dx.doi.org/10.1007/s00027-010-0130-2.
Mladenov, N., Zheng, Y., Miller, M.P., Nemergut, D.R., Legg, T., Simone, B.,Hageman, C., Rahman, M.M., Ahmed, K.M., McKnight, D.M., 2010. Dissolvedorganic matter sources and consequences for iron and arsenic mobilization inBangladesh aquifers. Environ. Sci. Technol. 44, 123e128.
Ohno, T., 2002. Fluorescence inner-filtering correction for determining the humi-fication index of dissolved organic matter. Environ. Sci. Technol. 36, 742e746.
Parlanti, E., Worz, K., Geoffrey, L., Lamotte, M., 2000. Dissolved organic materfluorescence spectroscopy as a tool to estimate biological activity in a coastalzone submitted to anthropogenic inputs. Org. Geochem. 31, 1765e1781.
Peretyazhko, T., Sposito, G., 2006. Reducing capacity of terrestrial humic acids.Geoderma 127, 140e146.
Rakshit, S., Uchimiya, M., Sposito, G., 2009. Iron(III) bioreduction in soil in thepresence of added humic substances. Soil Sci. Soc. Am. J. 73, 65e71.
Roden, E.E., Kappler, A., Bauer, I., Jiang, J., Paul, A., Stoesser, R., Konishi, H., Xu, H.,2010. Extracellular electron transfer through microbial reduction of solid-phasehumic substances. Nat. Geosci. 3, 417e421.
Scott, D.T., McKnight, D.M., Blunt-Harris, E.L., Kolesar, S.E., Lovley, D.R., 1998.Quinone moieties act as electron acceptors in the reduction of humic sub-stances by humics-reducing microorganisms. Environ. Sci. Technol. 32, 2984e2989.
Senesi, N., Miano, T.M., Provenzano, M.R., Brunetti, G., 1991. Characterization, dif-ferentiation, and classification of humic substances by fluorescence spectros-copy. Soil Sci. 152, 259e271.
Six, J., Bossuyt, H., Degryze, S., Denef, K., 2004. A history of research on the linkbetween (micro)aggregates, soil biota, and soil organic matter dynamics. SoilTillage Res. 79, 7e31.
Thurman, E., Malcolm, R., 1981. Preparative isolation of aquatic humic substances.Environ. Sci. Technol. 15, 463e466.
Weishaar, J.L., Aiken, G.R., Bergamaschi, B.A., Fram, M.S., Fujii, R., Mopper, K., 2003.Evaluation of the specific ultraviolet absorbance as an indicator of the chemicalcomposition and reactivity of dissolved organic carbon. Environ. Sci. Technol.37, 4702e4708.
Zsolnay, A., Baigar, E., Jimenez, M., Steinweg, B., Saccomandi, F., 1999. Differentiatingwith fluorescence spectroscopy the sources of dissolved organic matter in soilssubjected to drying. Chemosphere 38, 45e50.