Embed Size (px)
Citation preview

Soil Science Society of America Journal
Disclaimer: The use of trade, firm, or corporation names is for the information and convenience of the reader. Such use does not constitute an official endorsement or approval by the USDA or the Agricultural Research Service of any product or service to the exclusion of others that may be suitable. The USDA prohibits discrimination in all its programs and activities on the basis of race, color, national origin, age, disability, and where applicable, sex, marital status, familial status, parental status, religion, sexual orientation, genetic information, political beliefs, reprisal, or because all or part of an individual’s income is derived from any public assistance program.
Soil Sci. Soc. Am. J. 81:277–288 doi:10.2136/sssaj2016.07.0216 Received 15 July 2016. Accepted 1 Dec. 2016. *Corresponding author: ([email protected]).© Soil Science Society of America, 5585 Guilford Rd., Madison WI 53711 USA. All Rights reserved.
Quantification of Soil Permanganate Oxidizable C (POXC) Using Infrared Spectroscopy
Soil Biology & Biochemistry
Labile soil carbon is an important component of soil organic matter because it embodies the mineralizable material that is associated with short-term fertil-ity. Permanganate-oxidizable C (POXC) is a widely used method for the study of labile C dynamics in soils. Rapid methods are needed to measure labile C, and better understand how this pool varies with soil C at regional scales. Infrared spectroscopy is an inexpensive way to quantify SOC and observe fluc-tuations in C functional groups. Using a sample set that encompassed several soil types and plant communities (seven different research projects, n = 496), soils were analyzed via diffuse reflectance Fourier transformed mid-infrared (MidIR, 4000–400 cm–1) and near-infrared (NIR, 10000–4000 cm–1) spectros-copy. Spectral data were used to develop calibrations for POXC, soil organic C (SOC), and total N (TN) using partial least squares (PLS) regression. The MidIR predicted POXC slightly better than the NIR, with calibration and/or valida-tion R2 values ranging from 0.77 to 0.81 depending on spectral pretreatments. Predictions for POXC were better than SOC and TN, but site variability influ-enced the calibration quality for SOC and TN. Using a selected MidIR region, which included bands correlated to POXC (3225–2270 cm–1), reduced the calibration quality, but still gave acceptable R2 values of 0.76 to 0.77 for the calibration and validation sets. We show that POXC can be predicted using NIR and MidIR spectra. Selecting informative spectral bands offers an alternative to using full spectra for PLS regressions.
Abbreviations: LFL, Living Field Laboratory; LTRAS, Long-Term Research on Agricultural Systems; MidIR, diffuse reflectance Fourier transformed mid-infrared spectroscopy; MSC, multiplicative scatter correction; OUG, Ohio Urban Garden; NIR, diffuse reflectance Fourier transformed near-infrared spectroscopy; PLS, partial least squares; PCA, principal components analysis; POXC, permanganate-oxidizable carbon; RMSE, root mean squared error; SOC, soil organic C; SNV, standard normal variate; TN, total soil N.
One of the most important aspects of agricultural soil quality pertains to the soil’s capacity to cycle nutrients and make them available to grow-ing crops. Permanganate oxidizable C reflects a fraction of labile soil C
that has been related to soil microbial biomass and particulate organic C, which are fundamental for soil C cycling (Culman et al., 2012). Also, POXC has been shown to be sensitive to changes in management as well as environmental con-ditions (de Moraes Sá et al., 2014; Margenot et al., 2015; Panettieri et al., 2015; Plaza-Bonilla et al., 2014; Xiang et al., 2015), sometimes more so than total soil C (Wang et al., 2014). The POXC is often, but not always, correlated to total soil C content (Lucas and Weil, 2012; Veum et al., 2014). Furthermore, POXC is a frac-
Francisco J. Calderón* Central Great Plains Research Station USDA–ARS Akron, CO 80720
Steve CulmanSchool of Environ. and Natural Resources Ohio State Univ. Wooster, OH 44691
Johan SixDep. of Environmental Systems Science Swiss Federal Institute of Technology Zurich
Alan J. FranzluebbersPlant Science Research USDA–ARS Raleigh, NC 27695
Meagan SchipanskiSoil and Crop Sciences Colorado State Univ. Fort Collins, CO 80523
Joshua BenistonSanta Rosa Junior CollegeSanta Rosa, CA 95401
Stuart GrandyDep. of Natural Resources and the Environ. Univ. of New Hampshire Durham, NH 03824
Angela Y. Y. KongCenter for Climate Systems Research Columbia Univ. New York, NY 10027
Core Ideas:
• Infrared spectroscopy andchemometrics can be used toquantify soil labile C.
• Soils amended with organicmaterials need to be taken intoaccount during calibrationdevelopment.
• Selection of spectral regions cangive parsimonious predictions of soiltotal and labile C.
Published April 20, 2017 #643

278 Soil Science Society of America Journal
tion of total soil C that is thought to be easily degradable by soil microbes and is also an important source of mineralizable N and P for growing crops.
Diffuse reflectance mid-infrared (MidIR) and near-infra-red (NIR) spectroscopy offer an alternative to traditional wet chemistry-based soil analyses because they are inexpensive, high-throughput, and require minimal sample preparation. The use of spectra from whole soils is desirable given that the only sample preparation needed before presentation to the instrument is dry-ing and uniform grinding (Reeves, 2003). The MidIR spectral region encompasses fundamental overtone absorbance bands from several organic and mineral functional groups such as C=C, Si–O, C–H, O–H, N–H, and C–N among others (Parikh et al., 2014; Reeves et al., 2012). In contrast, the NIR spectral region is largely made up of overtones, combination, and harmonics of C–H, N–H, and O–H vibrations. Spectral interpretation is more straightforward for the MidIR compared to the NIR due to the nature of the absorbance bands in each region (Parikh et al., 2014). Chemometric methods are necessary to obtain quan-titative information from the large amount of data contained in MidIR and NIR spectra (Bellon-Maurel and McBratney, 2011; Reeves et al., 2006, 2012; Stenberg et al., 2010). Previous work has shown that it is feasible to build reliable calibrations based on heterogeneous soil samples provided that the spectral and analyte data sets bracket the variation in the target samples (Reeves et al., 2006). Even though the NIR and MidIR spectral regions differ significantly at the theoretical level, soil properties that give good calibrations with NIR tend to calibrate well us-ing MidIR spectral data (Madari et al., 2005; Reeves, 2010). On occasion, however, one of the spectral regions outperforms the other depending on the soil property being quantified (Viscarra Rossel et al., 2006). Besides using the full spectral range, spectral region selection can be a useful strategy in calibration develop-ment, because the smaller number of spectral data points can lead to more time efficient and parsimonious multivariate mod-els (Fang et al., 2015).
Rapid and inexpensive methods are needed to assess soil constituents and labile SOC. A previous study showed that photacoustic Fourier transform infrared spectroscopy data can be used to accurately predict labile C determined by incubation and curve fitting (Peltre et al., 2014). Similarly, Thomsen et al. (2009) showed that NIR can be used to assess C lability as deter-mined by NaOCl oxidation. Veum et al. (2014) used MidIR and NIR spectra from demineralized samples to predict POXC in soils from Missouri, USA. A more comprehensive study is need-ed to ascertain the potential of infrared spectra of whole soils to predict labile C, as a proxy for soil quality, in a wider geographic context. Our objectives were to (i) determine if MidIR and NIR could be used to determine POXC, SOC, and TN on a wide range of soils, (ii) compare the calibration quality of the MidIR and NIR, and (iii) test if a specific spectral regions can be used instead of the full MidIR spectrum to develop more parsimoni-ous calibrations for POXC.
MATERIALS AND METHODSSoils
Samples included in the study came from seven different agricultural research projects with a total number of samples of 496 (Table 1). The W.K. Kellogg Biological Station (KBS) site was located in Hickory Corners, MI (42°24¢ N, 85°22¢ W), on Kalamazoo (fine-loamy, mixed, mesic Typic Hapludalfs) and Oshtemo (coarse-loamy, mixed, mesic Typic Hapludalfs) soil se-ries. The Long-Term Research on Agricultural Systems (LTRAS; currently known as the Russell Ranch Sustainable Agriculture Facility) site was located in Winters, CA (38°36¢ N, 121°50¢ W) on a Yolo silt loam (fine-silty, mixed nonacid, thermic Typic Xerorthents) and Rincon silty clay loam (fine, montmorillon-itic, thermic Mollic Haploxeralfs). The Niles site was located in Niles, KS (38°58¢ N, 97°28¢ W) on a Geary silt loam (fine-silty, mixed, superactive, mesic Udic Argiustolls). The NY-Grain site was located in Seneca and Yates Counties, NY (42°39¢ to 42°44¢ N, 77°04¢ to 76°43¢ W) on sandy clay loams, silt loams, and clay loams (mixed, active Hapludalfs). The Watkinsville site was located in Watkinsville, GA (33°52¢ N, 83°25¢ W) on Cecil–Madison–Pacolet (fine, kaolinitic, thermic Typic Kanhapludult) soil series with sandy loam, loam, or sandy clay loam surface textures. The Ohio Urban Garden (OUG) samples came from urban vacant lots in Youngstown, OH (41°04¢ N, 80°40¢ W). The soils were obtained from an experiment testing the use of organic amendments, which included unamended soils, com-post amended soils, as well as compost-biochar combinations (Beniston et al., 2015). The Living Field Laboratory (LFL) proj-ect was established in 1993 to examine the effect of cover crops on corn rotations at the KBS site (42°24¢ N, 85°24¢ W, 288 m a.s.l.) on sandy loam Haplic Luvisols (Snapp et al., 2010). All samples were collected, composited and air-dried immediately. Sampling dates and depth varied by study, as outlined in the ref-erences listed in Table 1.
Permanganate oxidizable C analyses were based on the labo-ratory procedures and calculations of Weil et al. (2003). Briefly, 2.5 g of soil were mixed with 18 mL of deionized water and 2 mL of 0.2 M KMnO4 solution. The mixtures were shaken for 2 min at 240 oscillations per minute. Samples were allowed to settle for 10 min., after which 0.5 mL of the supernatant was mixed with 49.5 mL of deionized water. Then, 200 mL of each sample was loaded into a 96-well plate containing a set of KMnO4 stan-dards. Absorbance was measured at 550 nm with a SpectraMax M5 (Molecular Devices, Sunnyvale, CA). Total SOC and TN were measured with a direct combustion analyzer, as detailed in Culman et al. (2012).
Infrared SpectroscopyDiffuse reflectance mid-infrared and NIR calibrations were
performed with spectra from neat soil samples, not diluted with KBr (Reeves et al., 2001). The samples were ground with a mor-tar and pestle, then dried at 60°C overnight before scanning. The dried and ground samples were scanned using a Pike AutoDIFF diffuse reflectance accessory (Pike Technologies, Madison, WI)

www.soils.org/publications/sssaj 279
in line with a Digilab FTS 7000 spectrometer (Varian, Inc., Palo Alto, CA). Potassium bromide and sulfur were used as back-ground samples for the MidIR and NIR, respectively. A quartz beam splitter and lead selenide detector were used for the NIR scans, and a KBr beam splitter and deuterated triglycine sulfate detector were used for the MidIR scans. Each spectrum consist-ed of 64 co-added scans from 10,000 to 4000 cm–1 for the NIR and 4000 to 400 cm–1 for the MidIR. The NIR spectra are made up of 3113 data points, and the MidIR spectra have 1868 data points. All spectral data were collected as pseudo-absorbance, referred to as absorbance throughout the text. Organic band as-signments follow Parikh et al. (2014) unless otherwise specified.
Correlation of Spectral and Analyte DataA correlation analysis was performed to identify which
spectral bands are more informational in regards to the POXC, SOC, and TN. Before the correlation analysis, the MidIR and NIR spectral data were baseline corrected using the baseline off-set feature of Unscrambler 10.3 (Camo Software, Oslo, Norway). Then the Pearson correlation coefficient (R) between the base-line corrected spectral data and the POXC, SOC, and TN data were calculated with the correl function of Microsoft Excel 2007.
Principal Components AnalysisTo examine the variability in spectral data across all sites,
Principal Components Analysis (PCA) of the MidIR data was done with Unscrambler 10.3. The spectral data were mean cen-tered before the PCA analysis. The Hotelling’s T2 statistic was used to show the leverage for each sample. An F-test was used to determine its critical limit, and is used to spot spectral outliers.
Sample Selection for the Partial Least Squares Regressions
The Kennard-Stone Sample Selection function of Unscrambler 10.3 was used to select sample subsets for the calibration and validation sample sets. The sample set was split evenly into 248 samples each for the calibration and validation sets. Samples in the calibration set were not part of the validation set. The Kennard-Stone function uses PCA results to uniformly allocate the calibration and validation samples according to the multivariate space in the spectral data (Kennard and Stone, 1969). Separate Kennard-Stone selections were completed for the MidIR and NIR data sets. For the MidIR sample selection, the average (standard deviation) SOC for the calibration set was 16.6 (12.6) g kg–1, and 16.0 (12.1) g kg–1 for the valida-tion set. The average (standard deviation) TN for the calibra-tion set was 1.43 (0.92) g kg–1, and 1.41 (0.91) g kg–1 for the validation set. The average (standard deviation) POXC for the calibration set was 568.3 (334.4) g kg–1, for the calibration set, and 553.6 (327.3) g kg–1 for the validation set. Even though the Kennard-Stone uses variation in the spectral data as the sole cri-terion to separate the calibration sets, all sites were represented in the calibration and validation sets.
Tabl
e 1.
Sit
es in
clud
ed in
the
stu
dy. V
alue
s ar
e m
ean
± s
tand
ard
erro
r.Pr
ojec
t nam
eLo
catio
nD
escr
iptio
nPO
XC
†So
il or
gani
c ca
rbon
Tota
l Nn
Ref
eren
ce
mg
C k
g-1
soil
g C
kg-
1 so
ilg
C k
g-1
soil
Wat
kins
ville
Geo
rgia
Cro
plan
d an
d pa
stur
e un
der d
iffer
ent m
anag
emen
t re
gim
es a
nd la
nd-u
se h
isto
ries
813.
8 ±
38.
7918
.8 ±
1.1
1.4
± 0
.111
2Fr
anzl
uebb
ers
et a
l., 2
000;
Fra
nzlu
ebbe
rs a
nd
Stue
dem
ann,
200
2
Livi
ng F
ield
Lab
orat
ory
(LFL
)M
ichi
gan
Con
tinuo
us c
orn
vs. C
orn-
soyb
ean-
whe
at in
3
man
agem
ents
292.
3 ±
7.6
8.5
± 0
.32.
2 ±
0.4
144
Cul
man
et a
l., 2
013
NY-
Gra
inN
ew Y
ork
Gra
in fa
rms
over
gra
dien
t of s
oil f
ertil
ity63
1.0
± 1
1.7
18.3
± 0
.41.
7 ±
0.0
118
Schi
pans
ki e
t al.,
201
0; S
chip
ansk
i and
D
rink
wat
er, 2
011
Nile
sK
ansa
sN
ever
-till
ed a
nnua
l cro
p co
nver
sion
from
tall
gras
s pr
airi
e46
4.9
± 5
5.1
15.5
± 1
.51.
5 ±
0.1
36B
enis
ton,
200
9
Long
-Ter
m R
esea
rch
on
Agr
icul
tura
l Sys
tem
s (L
TRA
S)N
ear
Dav
is,
Cal
iforn
iaLo
ng-t
erm
sys
tem
s st
udy
with
cro
p ro
tatio
ns a
nd
cove
r cr
ops
250.
2 ±
11.
59.
5 ±
0.2
1.0
± 0
.060
Kong
et a
l., 2
005
Ohi
o U
rban
Gar
den
(OU
G)
Youn
gsto
wn,
O
hio
Urb
an a
gric
ultu
re e
xper
imen
t with
com
post
, co
mpo
st+
bioc
har,
com
post
+in
tens
ive
cove
r cr
oppi
ng80
3.3
± 7
6.4
56.0
± 6
.24.
1 ±
0.4
24B
enis
ton
et a
l., 2
015
Kello
gg B
iolo
gica
l Sta
tion
(KB
S)M
ichi
gan
Long
-ter
m e
xper
imen
t; ro
w c
rops
, her
bace
ous
and
woo
dy p
eren
nial
s78
3.5
± 3
1.0
20.2
± 1
.51.
8 ±
0.1
56G
rand
y an
d R
ober
tson
, 200
7
† PO
XC
, per
man
gana
te o
xidi
zabl
e ca
rbon
.

280 Soil Science Society of America Journal
Partial Least Squares CalibrationsThe nonlinear iterative partial least squares PLS method
of Unscrambler 10.3 (Camo Software, Oslo, Norway) was used to generate the calibration and validation results (Martens and Naes, 1989). The PLS regression is commonly used to deal with correlated prediction variables (such as infrared spectra), and can be applied when the prediction variables are more numerous than the observations. No spectral outliers were omitted from the calibration models. All NIR and MidIR spectral data were mean centered before the PLS regressions. As explained below, samples from one of the sites were excluded from a subsequent set of calibrations due to a deviation in the SOC to POXC re-lationship. Separate PLS regressions were performed with de-trending, multiplicative scatter correction (MSC), and standard normal variate (SNV) pretreatments of the absorbance data. Detrending involves subtraction of a polynomial or linear fit to reduce baseline artifacts such as tilt, which is sometimes an issue in NIR spectra. The MSC, SNV, and detrending pretreatments were all done in combination with mean centering. The optimal number of factors was determined by the software using the rela-tionship between the explained variances for the calibration and validation sets.
RESULTSBands in the MidIR and NIR Spectra by Site
The NIR spectra from the different sites had relatively few features compared to the MidIR region (Fig. 1). Peaks observed in the NIR spectra consist of combinations and overtones from the MidIR, with mixed information about organic material, iron oxides, clays and carbonates (Stenberg et al., 2010). Absorbance
at the higher wavenumbers approaches the visible range and could be indicative of darker soils with iron containing miner-als. The main NIR absorbance peaks observed occurred in three spectral ranges: around 7070 cm–1 between the first and second overtone region, between 5330 and 4920 cm–1 in the first over-tone region and combination region, and at 4400 to 4325 cm–1 in the combination region.
In the MidIR range, absorption near 3624 to 3620 cm–1, ob-served as a sharp peak in all sites (Fig. 1b), is due to inner hydroxyl groups in clay lattice sheets (Madejová, 2003). A weak band at 3695 cm–1 in most of the sites could be attributed to clay O–H stretching. This band is more pronounced in the Watkinsville soil, which also has sharp peaks at 3455 and 3535 cm–1 due to clay O–H stretching. Between 3450 to 3300 cm–1 is a broad and slight rise in absorbance due to hydrogen bonded O–H and N–H stretching (Parikh et al., 2014), which has greater O–H influence at the higher range. Between 2925 to 2850 cm–1 are the aliphatic C–H anti-symmetric and symmetric stretch bands, observable in most sites except LTRAS, which has low SOM. It has to be noted that absorbance between 2925 to 2850 cm–1 can also be due to carbonates (Legodi et al., 2001). The carbonate band at 2520 cm–1 (Calderón et al., 2011b), is only observed as a very small rise, espe-cially in the Niles average spectrum. The triplet of silicate peaks between 2000 and 1780 cm–1 is due to quartz or kaolinite, as well as sands (Nguyen et al., 1991). All soil spectra contain a peak at 1680 with a shoulder at 1611cm–1 which can be assigned to sev-eral moieties including amide C=O stretch (amide I) and quinone or ketone C=O stretch at the higher wavenumbers, and/or aro-matic C=C stretch and/or carboxylate C–O asymmetric stretch at the lower wavenumbers (Parikh et al., 2014). The small peak
Fig. 1. Diffuse reflectance Fourier transform near-infrared (A) and mid-infrared (B) average spectra for each site. The absorbance was offset to avoid overlap and aid visualization.

www.soils.org/publications/sssaj 281
at 1520 cm–1 is due to the amide II band, and/or aromatic C=C from lignin (Baes and Bloom, 1989). The peak at 1420 cm–1, with the shoulder at 1360 cm–1 is due to aliphatic C–H bending (Haberhauer and Gerzabek, 1999). The inverted peaks between 1220 and 1060 cm–1 are caused by specular reflection from soil minerals in the neat samples. The peak at 810 cm–1 is assigned to amorphous silica.
Correlation of POXC with SOC and TNDue to the diversity of the sample set, the SOC had a
wide range, from 0.8 to 108 g kg–1 (Fig. 2). Likewise the TN ranged from 0.3 to 7.9 g kg–1. The POXC had maxima around 1400 mg C kg–1. The best fit between SOC and POXC was hy-perbolic rather than linear (R2 = 0.71), given that SOC values higher than ~50 g kg–1 were not associated with further increas-es in POXC values. The OUG samples are responsible for the marked deviation from the regression line among the high SOC soil samples (Fig. 2). Without OUG samples, the best fit relation-ship is linear (R2 = 0.99). This indicates that the POXC values for OUG fall below the best fit line not due to POXC saturation but rather to the different quality of the soil C caused by the history
of amendments that may not have entered the slightly more pro-cessed POXC pool. The TN and POXC had very similar correla-tion pattern to that of SOC and POXC, given that SOC and TN were themselves highly linearly correlated (R2 = 0.95).
Spectral DiversityIdeally, the spectra for a calibration set should form a co-
hesive set to avoid calibration performance artifacts caused by bimodal distributions. The spectra from the different sites all formed a single cloud in multivariate space, although scores along PC1 and PC2 do show separations between individual sites within that cloud (Fig. 3a). Samples from KBS and some samples from Watkinsville had low Component 1 scores, and loadings indicate that this was due to low clay (3620 cm–1) and clay/amide-like absorbance (1649 cm–1; Fig. 3b). Component 2 clearly separated LFL from Niles and LTRAS due to differ-ences in texture as shown by loadings from clay and Si–O bands. Component 2 also separates KBS from Niles and LTRAS. A few MidIR spectral outliers in the LFL and LTRAS sets were detected according to the Hotelling T2 statistic. However, these samples were not excluded from the PLS regressions as there was no specific reason to suspect that their C pool data were faulty, and because of our aim to ascertain the value of infrared-based
Fig. 2. Hyperbolic fit lines for the soil organic carbon (SOC) vs. permanganate oxidizable carbon (POXC) (A), and soil total nitrogen (TN) vs. POXC (B). Kellogg Biological Station samples are in black, Living Field Laboratory samples are in red, Long-Term Research on Agricultural Systems samples are in green, Niles samples are in yellow, NY-Grain samples are in blue, Watkinsville samples are in light blue, and Ohio Urban Garden samples are in pink.
Fig. 3. Principal components analysis of the mid-infrared spectra data of all the sites. Scores (A), and component 1 and 2 loadings (B). The variation explained by each component is shown in parenthesis. The Hotelling T2 ellipse in Panel A shows the spectral outliers.

282 Soil Science Society of America Journal
calibrations for POXC in a wide geographic scale. The OUG samples, which had an anomalous relationship between POXC and SOC (Fig. 2), were not spectral outliers (Fig. 3).
MidIR and NIR Partial Least Squares Calibrations for POXC
The MidIR and NIR spectral data were used to generate predictive PLS models for POXC (Fig. 4). The MidIR spectra produced calibrations for POXC, with R2 that varied from 0.78 to 0.81 depending on the mathematical pretreatment of the ab-sorbance data (Table 2). The validation R2 were similar to the calibration R2. The SNV, detrending, and MSC pretreatments all gave small improvements in R2 and RMSE over the mean centering alone with SNV but detrending was slightly better. Calibrations performed with the NIR attained R2 of 0.73 to 0.88, but the validation R2 were lower, ranging from 0.66 to 0.76. As with the MidIR, the detrended pretreatment of the NIR spectra gave best calibration and validation results compared to the rest of the pretreatments. Figure 5 shows the degradation of the vali-dation quality after eight PLS factors with the NIR. Calibrations for SOC and TN had R2 and RMSE of lower quality than those for the POXC regardless of the spectral range used, with calibra-tion R2 always below 0.59 for all three spectral pretreatments.
Correlation of POXC with MidIR and NIR Spectral Bands
A correlation analysis between the MidIR absorbance and the POXC, SOC, and TN data shows that the three analytes were positively correlated with absorbance at 2930 to 2850 cm–1 (R > 0.38), attributed to aliphatic C–H stretch (Fig. 6a). The correlation with POXC and the peak at 2920 cm–1 was slightly stronger (R2 = 0.43) than the correlation with SOC (R2 = 0.39). In contrast, the POXC, SOC, and TN were all negatively cor-related to quartz absorbance between ~2050 and 1835 cm–1. Permanganate oxidizable C has a higher R2 than SOC and TN for the region between 2730 and 2530 cm–1, a region as-signed to carboxylic acid H-bonded O–H (Parikh et al., 2014). Conversely, POXC has a negative correlation coefficient for the 3380 to 3100 cm–1 region assigned to O–H, N–H and at lower range to aromatic C–H stretch.
The correlation patterns with the NIR data were similar for POXC, SOC, and TN. The highest R scores were achieved between 4875 and 4650 cm–1, whereas the lowest R scores oc-curred between 5350 and 5180 cm–1 (Fig. 6b). The POXC had the highest absolute values for the R scores in these two NIR spectral regions. While it is not straightforward to assign spe-cific chemistries to absorbances within the NIR, soil absorbance bands between 2050 and 2150 nm (4875–4650 cm–1) have been assigned to 4n1 overtones of polysaccharide C–O, and to over-tones of amine N–H (Viscarra Rossel and Behrens, 2010).
Partial Least Squares using Selected MidIR Spectral Region
Besides the calibrations utilizing the full MidIR spectral range, calibrations were also calculated using a selected spectral region determined by the R coefficient between the MidIR spec-tral data and POXC. The region between 3225 and 2270 cm–1 encompasses absorbance for aliphatic C–H and O–H plus N–H, and contains spectral bands that are the most positively correlated with the POXC (Fig. 6). This region is mainly or-ganic, and has little mineral interference in soils that are low in carbonates, such as those in the data set (Reeves, 2012). The se-lected region contains 27% of the data in the full MidIR range, with a total of 496 spectral data points. In both the SOC and TN cases the calibration quality deteriorated by using the selected re-gion rather than the full MidIR spectrum. The SOC prediction with the selected region had R2 of 0.48 and 0.60 for the calibra-tion and validation, with RMSE of 9.0 and 7.6. The TN predic-tion attained R2 of 0.46 and 0.55 for the calibration and valida-tion, with RMSE of 0.67 and 0.61. The POXC prediction with the selected region, however, had a slight deterioration in quality compared to the PLS using the full MidIR spectrum, with an R2 of 0.76 and 0.77 for the calibration and validation, and RMSE of 162.0 and 154.0 (Fig. 7). It should be noted that a correlation of the single absorbance at 2920 cm–1 and the POXC data had a R2 of 0.43, showing that a single point calibration is not sufficient for predicting POXC.
Fig. 4. Partial least squares regression predicted permanganate oxidizable carbon (POXC) vs. reference POXC values for the calibration (black dots) and the validation (red dots) for the mid-infrared and near-infrared data. The spectral data were pre-treated with detrending for both the mid-infrared range (A) and the near-infrared range (B).

www.soils.org/publications/sssaj 283
Site Effects on Calibration Quality
The predictive ability of the cali-brations varied widely between sites (Table 3). Calibrations based on the full MidIR spectrum had the best predictions for the LTRAS and Niles samples, while the OUG had the largest RMSE, regardless of whether the full spectrum or selected region was used for the PLS regression. The POXC prediction for KBS, LFL, and Niles deteriorated with the selected MidIR region relative to the full spec-trum. As with the MidIR, the PLS regression based on the NIR also had the LTRAS site with the lowest RMSE of the prediction, and OUG with the poorest predictions for the three analytes. The NIR-based pre-dictions for TN and SOC followed similar patterns to those of the POXC, with the OUG site samples having the poorest cali-bration results.
The unusual relationship between POXC and SOC ob-served in the OUG samples (Fig. 2) prompted us to carry out additional PLS calibrations leaving out the OUG samples (Table 4). A comparison of the PLS calibrations including all sites (Table 2) with the PLS calibrations without the OUG sites (Table 4) shows that predictions for POXC were not mark-edly affected by the removal of the OUG samples from the set. However, predictions for SOC and TN were markedly better when the OUG samples were excluded, as indicated by increased R2 and decreased RMSE.
DISCUSSIONOur results show that both the MidIR and NIR data can be
used to determine POXC on a wide range of soils. Calibrations for TN and SOC were not as good as they were for POXC when the full sample set was used. However, calibration qual-ity improved markedly when the OUG samples were removed. Therefore, this work shows that anomalous soils in the sample set have to be identified and taken into account to properly pre-dict soil C pools with infrared spectral data. Selected spectral regions could be used instead of the full MidIR spectrum in cali-brations for POXC, albeit a slightly increased RMSE.
Others have found that, depending on the soil, SOC can sometimes be positively correlated with POXC (Lucas and Weil, 2012; Culman et al., 2012; Veum et al., 2014). Veum et al. (2014) showed that POXC correlates positively with other measures of soil quality such as enzyme activities and aggrega-tion in a soil from the North American Corn Belt. In this study, with a more geographically diverse sample set, POXC had a hyperbolic correlation to SOC and TN. There was a point af-ter ~50 g kg–1 of POXC content where POXC declined with increasing SOC. This hyperbolic relationship is largely a result
of the OUG samples not conforming to the best fit line, and to some extent a methodological artifact with the upper detection limit of POXC. The methodological artifact occurs when calcu-lating POXC with the assumptions laid out by Weil et al. (2003). Using 2.5 g of soil, 1440 mg POXC kg soil–1 is the maximum amount detectable in a sample as 100% of the permanganate is oxidized at 1440 mg POXC. Increasing the detection limits would require method manipulation beyond the scope of this
Table 2. Spectral pretreatment effects on partial least squares calibration quality using mid-infrared (MidIR) and near-infrared (NIR) spectral data. Calibration (Cal) and valida-tion (Val) sets consisted of different samples selected using the Kennard-Stone function. Permanganate oxidizable C units are mg C kg-1 soil, SOC and TN units are g C kg-1 soil. Note that the standard normal variate (SNV), detrending (Detrend), and multiplicative scatter correction (MSC) were all applied together with mean centering.
POXC SOC TN
FactorsR2
(Cal/Val)RMSE
(Cal/Val)R2 (Cal/Val)
RMSE (Cal/Val)
R2 (Cal/Val)RMSE
(Cal/Val)
MidIRMean center 6 0.78/0.77 157.1/156.0 0.44/0.55 9.4/8.0 0.45/0.55 0.68/0.61SNV 9 0.81/0.81 144.3/144.3 0.54/0.70 8.5/6.7 0.54/0.66 0.62/0.53Detrend 8 0.81/0.81 145.8/143.8 0.52/0.64 8.6/7.2 0.52/0.63 0.63/0.55MSC 9 0.81/0.80 145.1/146.6 0.55/0.69 8.5/6.8 0.54/0.65 0.62/0.53
NIRMean center 9 0.83/0.75 126.6/174.9 0.58/0.52 7.5/9.1 0.56/0.51 0.57/0.67SNV 7 0.83/0.71 130.0/188.5 0.56/0.47 7.7/9.5 0.54/0.47 0.59/0.70Detrend 8 0.88/0.76 110.1/169.5 0.59/0.50 7.4/9.2 0.58/0.51 0.56/0.67MSC 5 0.73/0.66 161.7/201.4 0.49/0.40 8.3/10.1 0.43/0.37 0.65/0.76
Fig. 5. Explained variances for the near-infrared and mid-infrared partial least squares regressions. The spectral data were pre-treated with detrending for both the mid-infrared range (A) and the near-infrared range (B).

284 Soil Science Society of America Journal
study, such as increasing the concentration of permanganate or decreasing the amount of soil reacted. Deviations from the con-ventional POXC method would also make it impossible to com-pare our results to those of others.
The main reason for the hyperbolic fit in our sample set was due to the anomalous OUG samples, given that the relationship
is linear without the OUG in the regression. The nonlinear re-lationship below the upper limit occurs because OUG received organic amendments that altered the relationship between labile and total soil C. The OUG also have higher light fraction POM, which is not well correlated with POXC (Culman et al., 2012). The hyperbolic relationship may also be indicating that in gen-eral, soils high in SOC tend to have proportionally less labile C than soils with lower SOM. However, this would be difficult to argue, given the previous consideration that maximum detection of POXC was already achieved. While the relationship between different C pools is still an active area of study, previous work comparing asymptotic vs. linear C saturation fit has indicated that relatively labile soil C can approach a maximum level as SOC increases (Six et al., 2002).
Previous work has shown that MidIR bands in diffuse re-flectance spectra can offer a semi-quantitative estimate of organ-ic moieties and minerals (Calderón et al., 2013). Diffuse reflec-tance spectra do not fully conform to Beer-Lambert law due to the uncertain path length and low penetration of the MidIR en-ergy (Calderón et al., 2013; Margenot et al., 2015). Nevertheless, increases in absorbance bands can lead to useful hypothesis gen-eration and also to assessment of management effects on SOC of soils with similar mineral backgrounds (Calderón et al., 2011a). There was high spectral diversity between the sites included in this study, although no single site formed a separate cluster from the whole set as illustrated with the PCA. The main spectral differences accounting for most of the variation between the sites are due to mineral bands. Minerals make up a larger por-tion of the soil’s mass than the organic materials, and it is thus expected that soils of different age and parent material have different MidIR absorbance patterns. The spectra associated with Watkinsville and KBS have particularly high absorbance for the lattice clay band at 3620 cm–1, as well as at 1649 cm–1, which is often assigned to amides but is also present in clay spec-tra (Madejová, 2003). The Watkinsville and KBS samples also have MidIR bands consistent with higher sand content, with high absorbance at 1790 to 2000 cm–1 and at the specular re-flection inversion between 1220 and 1060 cm–1. The LFL also has distinct clay and Si–O signals relative to Niles and LTRAS. Given that excluding the mineral bands from the calibration set did not drastically decrease the calibration performance, we can conclude that mineral absorbances do not contribute to chemo-metric analysis of labile C.
This study shows that PLS calibrations based on NIR and MidIR spectral data can be used to generate useable calibrations for POXC, with R2 < 0.8, and the predictions were slightly bet-ter for MidIR compared to NIR as shown by the validation coef-ficient of determination. The RMSE is a measure of the disper-sion of the calibration or validation samples around the regres-sion line, and it showed the differences between POXC values and the predictions using absorbance data in the same units as those of the variable in question. The minimal advantage of the MidIR over the NIR in terms of the POXC calibration quality is reflected on the mixed RMSE results.
Fig. 6. Correlation coefficients of specific spectral bands with soil organic carbon (SOC), permanganate oxidizable carbon (POXC) and total soil nitrogen (TN) for the mid-infrared range (A) and the near-infrared range (B).
Fig. 7. Partial least squares (PLS) regression predicted permanganate oxidizable carbon (POXC) vs. reference POXC values for the calibration (black dots) and the validation (red dots) for a selected region of the mid-infrared data. Only the region between 3225 and 2270 cm-1 was used for the PLS regression.
www.soils.org/publications/sssaj 285
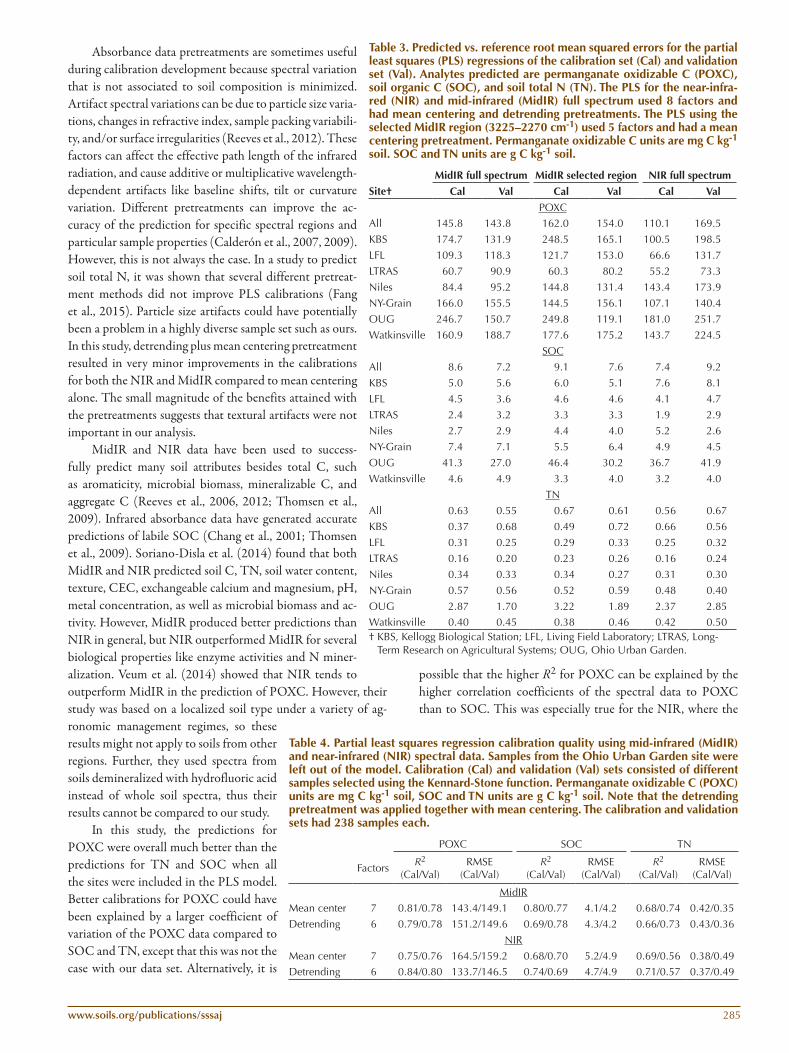
Absorbance data pretreatments are sometimes useful during calibration development because spectral variation that is not associated to soil composition is minimized. Artifact spectral variations can be due to particle size varia-tions, changes in refractive index, sample packing variabili-ty, and/or surface irregularities (Reeves et al., 2012). These factors can affect the effective path length of the infrared radiation, and cause additive or multiplicative wavelength-dependent artifacts like baseline shifts, tilt or curvature variation. Different pretreatments can improve the ac-curacy of the prediction for specific spectral regions and particular sample properties (Calderón et al., 2007, 2009). However, this is not always the case. In a study to predict soil total N, it was shown that several different pretreat-ment methods did not improve PLS calibrations (Fang et al., 2015). Particle size artifacts could have potentially been a problem in a highly diverse sample set such as ours. In this study, detrending plus mean centering pretreatment resulted in very minor improvements in the calibrations for both the NIR and MidIR compared to mean centering alone. The small magnitude of the benefits attained with the pretreatments suggests that textural artifacts were not important in our analysis.
MidIR and NIR data have been used to success-fully predict many soil attributes besides total C, such as aromaticity, microbial biomass, mineralizable C, and aggregate C (Reeves et al., 2006, 2012; Thomsen et al., 2009). Infrared absorbance data have generated accurate predictions of labile SOC (Chang et al., 2001; Thomsen et al., 2009). Soriano-Disla et al. (2014) found that both MidIR and NIR predicted soil C, TN, soil water content, texture, CEC, exchangeable calcium and magnesium, pH, metal concentration, as well as microbial biomass and ac-tivity. However, MidIR produced better predictions than NIR in general, but NIR outperformed MidIR for several biological properties like enzyme activities and N miner-alization. Veum et al. (2014) showed that NIR tends to outperform MidIR in the prediction of POXC. However, their study was based on a localized soil type under a variety of ag-ronomic management regimes, so these results might not apply to soils from other regions. Further, they used spectra from soils demineralized with hydrofluoric acid instead of whole soil spectra, thus their results cannot be compared to our study.
In this study, the predictions for POXC were overall much better than the predictions for TN and SOC when all the sites were included in the PLS model. Better calibrations for POXC could have been explained by a larger coefficient of variation of the POXC data compared to SOC and TN, except that this was not the case with our data set. Alternatively, it is
possible that the higher R2 for POXC can be explained by the higher correlation coefficients of the spectral data to POXC than to SOC. This was especially true for the NIR, where the
Table 3. Predicted vs. reference root mean squared errors for the partial least squares (PLS) regressions of the calibration set (Cal) and validation set (Val). Analytes predicted are permanganate oxidizable C (POXC), soil organic C (SOC), and soil total N (TN). The PLS for the near-infra-red (NIR) and mid-infrared (MidIR) full spectrum used 8 factors and had mean centering and detrending pretreatments. The PLS using the selected MidIR region (3225–2270 cm-1) used 5 factors and had a mean centering pretreatment. Permanganate oxidizable C units are mg C kg-1 soil. SOC and TN units are g C kg-1 soil.
MidIR full spectrum MidIR selected region NIR full spectrum
Site† Cal Val Cal Val Cal Val
POXCAll 145.8 143.8 162.0 154.0 110.1 169.5
KBS 174.7 131.9 248.5 165.1 100.5 198.5
LFL 109.3 118.3 121.7 153.0 66.6 131.7
LTRAS 60.7 90.9 60.3 80.2 55.2 73.3
Niles 84.4 95.2 144.8 131.4 143.4 173.9
NY-Grain 166.0 155.5 144.5 156.1 107.1 140.4
OUG 246.7 150.7 249.8 119.1 181.0 251.7
Watkinsville 160.9 188.7 177.6 175.2 143.7 224.5
SOC
All 8.6 7.2 9.1 7.6 7.4 9.2
KBS 5.0 5.6 6.0 5.1 7.6 8.1
LFL 4.5 3.6 4.6 4.6 4.1 4.7
LTRAS 2.4 3.2 3.3 3.3 1.9 2.9
Niles 2.7 2.9 4.4 4.0 5.2 2.6
NY-Grain 7.4 7.1 5.5 6.4 4.9 4.5
OUG 41.3 27.0 46.4 30.2 36.7 41.9
Watkinsville 4.6 4.9 3.3 4.0 3.2 4.0
TN
All 0.63 0.55 0.67 0.61 0.56 0.67
KBS 0.37 0.68 0.49 0.72 0.66 0.56
LFL 0.31 0.25 0.29 0.33 0.25 0.32
LTRAS 0.16 0.20 0.23 0.26 0.16 0.24
Niles 0.34 0.33 0.34 0.27 0.31 0.30
NY-Grain 0.57 0.56 0.52 0.59 0.48 0.40
OUG 2.87 1.70 3.22 1.89 2.37 2.85Watkinsville 0.40 0.45 0.38 0.46 0.42 0.50† KBS, Kellogg Biological Station; LFL, Living Field Laboratory; LTRAS, Long-
Term Research on Agricultural Systems; OUG, Ohio Urban Garden.
Table 4. Partial least squares regression calibration quality using mid-infrared (MidIR) and near-infrared (NIR) spectral data. Samples from the Ohio Urban Garden site were left out of the model. Calibration (Cal) and validation (Val) sets consisted of different samples selected using the Kennard-Stone function. Permanganate oxidizable C (POXC) units are mg C kg-1 soil, SOC and TN units are g C kg-1 soil. Note that the detrending pretreatment was applied together with mean centering. The calibration and validation sets had 238 samples each.
POXC SOC TN
Factors R2 (Cal/Val)
RMSE (Cal/Val)
R2 (Cal/Val)
RMSE (Cal/Val)
R2 (Cal/Val)
RMSE (Cal/Val)
MidIRMean center 7 0.81/0.78 143.4/149.1 0.80/0.77 4.1/4.2 0.68/0.74 0.42/0.35
Detrending 6 0.79/0.78 151.2/149.6 0.69/0.78 4.3/4.2 0.66/0.73 0.43/0.36
NIR
Mean center 7 0.75/0.76 164.5/159.2 0.68/0.70 5.2/4.9 0.69/0.56 0.38/0.49Detrending 6 0.84/0.80 133.7/146.5 0.74/0.69 4.7/4.9 0.71/0.57 0.37/0.49

286 Soil Science Society of America Journal
absorbance at 5350–5180 cm–1 and at 4875 to 4650 cm–1 were better correlated to POXC than to SOC. In the MidIR, carbox-ylic acid H-bonded O–H absorbances at 3380 to 3100 cm–1, as well as bands at 2930 to 2850 cm–1 were more correlated to POXC content than to SOC content. Previous work has shown that the asymmetric and symmetric stretching of C–H in CH2 at 2930 and 2850 cm–1 is related to the decomposition state of soils, and has been used in band ratio analysis to study labile soil C (Veum et al., 2014), and could serve as an indicator of SOC lability in some soils (Demyan et al., 2012). The aliphatic C–H MidIR band correlates with total aliphatic C–H as measured by NMR (Veum et al., 2014), but the presence of carbonates in the soil sample can complicate this assignment in calcareous soils (Legodi et al., 2001). Because of this, future studies should evalu-ate the relationship between absorbance at 2930 to 2850 cm–1 and POXC in highly calcareous soils.
The MidIR spectrum, when collected at the range and reso-lution used in this study, contains more than 1800 data points. This prompts the question of whether some of the spectral infor-mation is in effect noise that could be omitted from the calibra-tion. For this reason, we explored the possibility of using a re-duced range of spectral data, informing the selection with a cor-relation analysis between the POXC and the absorbance data. A previous study showed that POXC correlates with the aliphatic C–H spectral bands in soils from the Central Valley of California under organic vegetable production (Margenot et al., 2015). The results from our study on soils from a wide geographic area and under different agricultural managements further corroborate the finds that POXC was related to aliphatic C–H compounds. Restricting the spectral range used in the chemometric analysis to the aliphatic C–H region and adjacent bands, did not mark-edly reduce the calibration quality for POXC. The region selec-tion approach showed potential given that the resulting calibra-tion could be considered useful if a R2 of 0.77 is acceptable.
A fundamental issue affecting chemometric prediction of soil attributes is how many different types of soils can be pre-dicted with a single calibration (Viscarra Rossel and Behrens, 2010). In this study, we showed that removing the OUG sam-ples from the calibration set markedly improved the prediction of SOC, but not POXC. Several studies have examined the use of localized versus large-scale calibrations (Cobo et al., 2010; Guerrero et al., 2010; Minasny et al., 2009; Reeves and Smith, 2009; Wetterlind et al., 2010). However, there is no consensus about the precise basis on which decisions about calibration sets should be made. In this study it is apparent that the OUG samples should require a separate calibration for SOC, while they could be included with the rest of the sites when calibrating for POXC. The OUG site was not a spectral outlier, but had a relatively low number of samples, and high standard error for the POXC and SOC. The different biochar and compost amend-ments likely added inordinate amounts of non-resident and stable SOC. Besides, the OUG project was based on a highly diverse set of urban soils with high levels of spatial heterogeneity (Beniston and Lal, 2012). We hypothesize that the addition of
compost might have altered the chemistry of the SOC enough that the relationship between POXC and the molecular makeup of the SOC was altered and the calibration was not able to prop-erly predict POXC in those particular samples.
CONCLUSIONSThe PLS calibrations for POXC using NIR data gave ac-
ceptable results, whereas calibrations using MidIR were of slight-ly better quality. Selecting specific regions within the MidIR gave comparable calibrations to those using the whole spectrum. Aliphatic C-H and carboxylic acid H-bonded OH bands were highly correlated to POXC, suggesting that they should be con-sidered of particular importance for the study of labile soil C, and can be used in a reduced spectral data set to predict POXC. The chemometric quantitation for SOC benefitted from the ex-clusion of samples from an urban site in which a variety of or-ganic amendments had been deployed, affecting the relationship between SOC and POXC. Our results have broader implica-tions for the study of SOC and soil quality given that a rapid and accurate method for quantifying labile soil C is needed. Further studies should examine the feasibility of using new generation handheld spectrometers for the determination of soil quality pa-rameters in the field.
ACKNOWLEDGMENTSThe authors would like to thank Sieglinde Snapp, Rattan Lal, Laurie Drinkwater, G. Phil Robertson and Jerry Glover for their contribution to this research.
REFERENCESBaes, A.U., and P.R. Bloom. 1989. Diffuse reflectance and transmission
Fourier transform infrared (DRIFT) spectroscopy of humic and fulvic acids. Soil Sci. Soc. Am. J. 53:695–700. doi:10.2136/sssaj1989.03615995005300030008x
Bellon-Maurel, V., and A. McBratney. 2011. Near-infrared (NIR) and mid-infrared (MIR) spectroscopic techniques for assessing the amount of carbon stock in soils- Critical review and research perspectives. Soil Biol. Biochem. 43:1398–1410.
Beniston, J. 2009. Soil organic carbon dynamics and tallgrass prairie land management. M.S. Thesis. Ohio State Univ., Columbus, OH.
Beniston, J., and R. Lal. 2012. Improving soil quality for urban agriculture in the North Central U.S. In: R. Lal and B. Augustin, editors, Carbon sequestration in urban ecosystems. Springer, Dordrecht, the Netherlands. p. 279–313. doi:10.1007/978-94-007-2366-5_15
Beniston, J.W., R. Lal, and K. Mercer. 2015. Assessing and managing soil quality for urban agriculture in a degraded vacant lot soil. Land Degrad. Dev. 27(4). doi:10.1002/ldr.2342
Calderón, F., M. Haddix, R. Conant, K. Magrini-Bair, and E.A. Paul. 2013. Diffuse-reflectance Fourier-transform mid-infrared spectroscopy as a method of characterizing changes in soil organic matter. Soil Sci. Soc. Am. J. 77:1591–1600. doi:10.2136/sssaj2013.04.0131
Calderón, F.J., M.M. Mikha, M.F. Vigil, D.C. Nielsen, J.G. Benjamin, and J.B. Reeves. 2011a. Diffuse-reflectance mid-infrared spectral properties of soils under alternative crop rotations in a semi-arid climate. Commun. Soil Sci. Plant Anal. 42:2143–2159. doi:10.1080/00103624.2011.596243
Calderón, F.J., J.B. Reeves, H.P. Collins, and E.A. Paul. 2011b. Chemical differences in soil organic matter fractions determined by diffuse-reflectance mid-infrared spectroscopy. Soil Sci. Soc. Am. J. 75:568–579. doi:10.2136/sssaj2009.0375
Calderón, F.J., J.B. Reeves, J.G. Foster, W.M. Clapham, J.M. Fedders, M.F. Vigil, and W.B. Henry. 2007. Comparison of diffuse reflectance Fourier transform mid-infrared and near-infrared spectroscopy with grating-based near-infrared for the determination of fatty acids in forages. J. Agric. Food

www.soils.org/publications/sssaj 287
Chem. 55:8302–8309. doi:10.1021/jf0712907Calderón, F.J., M.F. Vigil, J.B. Reeves, and D.J. Poss. 2009. Mid-infrared and near-
infrared calibrations for nutritional parameters of triticale (Triticosecale) and pea (Pisum sativum). J. Agric. Food Chem. 57:5136–5142. doi:10.1021/jf803936x
Chang, C., D.A. Laird, M.J. Mausbach, and J.C.R. Hurburgh. 2001. Near-infrared reflectance spectroscopy-Principal components regression analyses of soil properties. Soil Sci. Soc. Am. J. 65:480–490. doi:10.2136/sssaj2001.652480x
Cobo, J.G., G. Dercon, T. Yekeye, L. Chapungu, C. Kadzere, A. Murwira, R. Delve, and G. Cadisch. 2010. Integration of mid-infrared spectroscopy and geostatistics in the assessment of soil spatial variability at landscape level. Geoderma 158:98–411. doi:10.1016/j.geoderma.2010.06.013
Culman, S.W., S.S. Snapp, M.A. Freeman, M.E. Schipanski, J. Beniston, R. Lal, L.E. Drinkwater, A.J. Franzluebbers, J.D. Glover, S.A. Grandy, J. Six, J.E. Maul, S.E. Mirksy, J.T. Spargo, and M.M. Wander. 2012. Permanganate oxidizable carbon reflects a processed soil fraction that is sensitive to management. Soil Sci. Soc. Am. J. 76:494–504. doi:10.2136/sssaj2011.0286
Culman, S.W., S.S. Snapp, J.M. Green, and L.E. Gentry. 2013. Short- and Long-Term labile soil carbon and nitrogen dynamics reflect management and predict corn agronomic performance. Agron. J. 105: 493–502.
de Moraes Sá, J.C., F. Tivet, R. Lal, C. Briedis, D.C. Hartman, J.Z. dos Santos, and J.B. dos Santos. 2014. Long-term tillage systems impacts on soil C dynamics, soil resilience and agronomic productivity of a Brazilian Oxisol. Soil Tillage Res. 136:38–50. doi:10.1016/j.still.2013.09.010
Demyan, M.S., F. Rasche, E. Schulz, M. Breulmann, T. Muller, and G. Cadisch. 2012. Use of specific peaks obtained by diffuse reflectance Fourier transform mid-infrared spectroscopy to study the composition of organic matter in a Haplic Chernozem. Eur. J. Soil Sci. 63:189–199. doi:10.1111/j.1365-2389.2011.01420.x
Fang, X.-R., H.-L. Zhang, L.-X. Huang, and Y. He. 2015. Measurement of soil total nitrogen using near infrared spectroscopy combined with RCA and SPA. Guangpuxue Yu Guangpu Fenxi 35:1248–1252.
Franzluebbers, A.J., and J.A. Stuedemann. 2002. Particulate and non-particulate fractions of soil organic carbon under pastures in the Southern Piedmont USA. Environ. Poll. 116:S53–S62. doi:10.1016/S0269-7491(01)00247-0
Franzluebbers, A.J., J.A. Stuedemann, H.H. Schomberg, and S.R. Wilkinson. 2000. Soil organic C and N pools under long-term pasture management in the Southern Piedmont USA. Soil Biol. Biochem. 32:469–478. doi:10.1016/S0038-0717(99)00176-5
Grandy, A.S., and G.P. Robertson. 2007. Land-use intensity effects on soil organic carbon accumulation rates and mechanisms. Ecosystems 10:58–73. doi:10.1007/s10021-006-9010-y
Guerrero, C., R. Zornoza, I. Gomez, and J. Mataix-Beneyto. 2010. Spiking of NIR regional models using samples from target sites: Effect of model size on prediction accuracy. Geoderma 158:66–77. doi:10.1016/j.geoderma.2009.12.021
Haberhauer, G., and M.H. Gerzabek. 1999. Drift and transmission FT-IR spectroscopy of forest soils: An approach to determine decomposition processes of forest litter. Vib. Spectrosc. 19:413–417. doi:10.1016/S0924-2031(98)00046-0
Kennard, R.W., and L.A. Stone. 1969. Computer aided design of experiments. Technometrics 11:137–148. doi:10.1080/00401706.1969.10490666
Kong, A.Y.Y., J. Six, D.C. Bryant, R.F. Denison, and C. van Kessel. 2005. The relationship between carbon input, aggregation, and soil organic carbon stabilization in sustainable cropping systems. Soil Sci. Soc. Amer. J., 69:1078–1085. doi:10.2136/sssaj2004.0215
Legodi, M.A., D. de Waal, J.H. Potgieter, and S.S. Potgieter. 2001. Rapid determination of CaCO3 in mixtures using FT-IR spectroscopy. Miner. Eng. 14:1107–1111. doi:10.1016/S0892-6875(01)00116-9
Lucas, S.T., and R.R. Weil. 2012. Can a labile carbon test be used to predict crop responses to improve soil organic matter management? Agron. J. 104:1160–1170. doi:10.2134/agronj2011.0415
Madari, B.E., J.B. Reeves, M.R. Coelho, P.L.O.A. Machado, and H. De-Polli. 2005. Mid- and near-infrared spectroscopic determination of carbon in a diverse set of soils from the Brazilian National Soil Collection. Spectrosc. Lett. 38:721–740. doi:10.1080/00387010500315876
Madejová, J. 2003. FTIR techniques in clay mineral studies. Vib. Spectrosc. 31:1–10. doi:10.1016/S0924-2031(02)00065-6
Margenot, A.J., F.J. Calderón, T.M. Bowles, S.J. Parikh, and L.E. Jackson. 2015.
Soil organic matter functional group composition in relation to organic carbon, nitrogen, and phosphorus fractions in organically managed tomato fields. Soil Sci. Soc. Am. J. 79:772–782. doi:10.2136/sssaj2015.02.0070
Martens, H., and T. Naes. 1989. Multivariate calibration. John Wiley & Sons, Chichester, UK.
Minasny, B., G. Tranter, A.B. McBratney, D.M. Brough, and B.W. Murphy. 2009. Regional transferability of midinfrared diffuse reflectance spectroscopic prediction for soil chemical properties. Geoderma 153:155–162. doi:10.1016/j.geoderma.2009.07.021
Nguyen, T.T., L.J. Janik, and M. Raupach. 1991. Diffuse reflectance infrared Fourier-transform drift- Spectroscopy in soil studies. Aust. J. Soil Res. 29:49–67. doi:10.1071/SR9910049
Panettieri, M., A.E. Berns, H. Knicker, J.M. Murillo, and E. Madejón. 2015. Evaluation of seasonal variability of soil biogeochemical properties in aggregate-size fractioned soil under different tillages. Soil Tillage Res. 151:39–49. doi:10.1016/j.still.2015.02.008
Parikh, S.J., K.W. Goyne, A.J. Margenot, F.N.D. Mukome, and F.J. Calderón. 2014. Soil chemical insights provided through vibrational spectroscopy. Adv. Agron. 126:1–148. doi:10.1016/B978-0-12-800132-5.00001-8
Peltre, C., S. Bruun, C. Du, I.K. Thomsen, and L.S. Jensen. 2014. Assessing soil constituents and labile soil organic carbon by mid-infrared photoacoustic spectroscopy. Soil Biol. Biochem. 77:41–50. doi:10.1016/j.soilbio.2014.06.022
Plaza-Bonilla, D., J. Álvaro-Fuentes, and C. Cantero-Martínez. 2014. Identifying soil organic carbon fractions sensitive to agricultural management practices. Soil Tillage Res. 139:19–22. doi:10.1016/j.still.2014.01.006
Reeves, J.B. 2003. Mid-infrared diffuse reflectance spectroscopy: Is sample dilution with KBr necessary, and if so, when? Am. Lab. 35:24–28.
Reeves, J.B. 2010. Near- versus mid-infrared diffuse reflectance spectroscopy for soil analysis emphasizing carbon and laboratory versus on-site analysis: Where are we and what needs to be done? Geoderma 158:3–14. doi:10.1016/j.geoderma.2009.04.005
Reeves, J.B. 2012. Mid-infrared spectral interpretation of soils: Is it practical or accurate? Geoderma 189-190:508–513. doi:10.1016/j.geoderma.2012.06.008
Reeves, J.B., R.F. Follett, G.W. McCarty, and J.M. Kimble. 2006. Can near or mid-infrared diffuse reflectance spectroscopy be used to determine soil carbon pools? Commun. Soil Sci. Plant Anal. 37:2307–2325. doi:10.1080/00103620600819461
Reeves, J.B., G.W. McCarty, and V.B. Reeves. 2001. Mid-infrared diffuse reflectance spectroscopy for the quantitative analysis of agricultural soils. J. Agric. Food Chem. 49:766–772. doi:10.1021/jf0011283
Reeves, J.B., and D.B. Smith. 2009. The potential of mid- and near-infrared diffuse reflectance spectroscopy for determining major- and trace-element concentrations in soils from a geochemical survey of North America. Appl. Geochem. 24:1472–1481. doi:10.1016/j.apgeochem.2009.04.017
Reeves, J.B., G.W. McCarty, F.J. Calderón, and W.D. Hively. 2012. Advances in spectroscopic methods for quantifying soil carbon. Elsevier, Walthham, MA. doi:10.1016/B978-0-12-386897-8.00020-6
Schipanski, M.E. and L.E. Drinkwater. 2011. Nitrogen fixation of red clover interseeded with winter cereals across a management-induced fertility gradient. Nutr. Cycl. Agroecosyst. 90:105–119. doi:10.1007/s10705-010-9415-z
Schipanski, M.E., L.E. Drinkwater, and M.P. Russelle. 2010. Understanding the variability in soybean nitrogen # xation across agroecosystems. Plant Soil 329:379–397. doi:10.1007/s11104-009-0165-0
Six, J., R.T. Conant, E.A. Paul, and K. Paustian. 2002. Stabilization mechanisms of soil organic matter: Implications for C saturation of soils. Plant Soil 241:155–176. doi:10.1023/A:1016125726789
Snapp, S.S., L.E. Gentry, and R. Harwood. 2010. Management intensity– not biodiversity–the driver of ecosystem services in a long-term row crop experiment. Agric. Ecosyst. Environ. 138:242–248. doi:10.1016/j.agee.2010.05.005
Soriano-Disla, J.M., L.J. Janik, R.A. Viscarra Rossel, L.M. Macdonald, and M.J. Mclaughlin. 2014. The performance of visible, near-, and mid-infrared reflectance spectroscopy for prediction of soil physical, chemical, and biological properties. Appl. Spectrosc. Rev. 49:139–186. doi:10.1080/05704928.2013.811081
Stenberg, B., R.A. Viscarra Rossel, A.M. Mouazen, and J. Wetterlind. 2010. Visible and near infrared spectroscopy in soil science. Adv. Agron. 107:163–215. doi:10.1016/S0065-2113(10)07005-7
Thomsen, I.K., S. Bruun, L.S. Jensen, and B.T. Christensen. 2009. Assessing soil carbon lability by near infrared spectroscopy and NaOCl oxidation. Soil

288 Soil Science Society of America Journal
Biol. Biochem. 41:2170–2177. doi:10.1016/j.soilbio.2009.08.002Veum, K.S., K.W. Goyne, R.J. Kremer, R.J. Miles, and K.A. Sudduth. 2014.
Biological indicators of soil quality and soil organic matter characteristics in an agricultural management continuum. Biogeochemistry 117:81–99. doi:10.1007/s10533-013-9868-7
Viscarra Rossel, R.A., and T. Behrens. 2010. Using data mining to model and interpret soil diffuse reflectance spectra. Geoderma 158:46–54. doi:10.1016/j.geoderma.2009.12.025
Viscarra Rossel, R.A., D.J.J. Walvoort, A.B. McBratney, L.J. Janik, and J.O. Skjemstad. 2006. Visible, near infrared, mid infrared or combined diffuse reflectance spectroscopy for simultaneous assessment of various soil properties. Geoderma 131:59–75. doi:10.1016/j.geoderma.2005.03.007
Wang, F., Y. Tong, P. Gao, J. Zhang, R.R. Weil, and J.N. Coffie. 2014. Organic amendments to a wheat crop alter soil aggregation and labile carbon
on the loess plateau, China. Soil Sci. 179:166–173. doi:10.1097/SS.0000000000000049
Weil, R.R., R.I. Kandikar, M.A. Stine, J.B. Gruver, and S.E. Samson-Liebig. 2003. Estimating active carbon for soil quality assessment: A simplified method for laboratory and field use. Am. J. Altern. Agric. 18:3–17. doi:10.1079/AJAA2003003
Wetterlind, J., B. Stenberg, and M. Soderstrom. 2010. Increased sample point density in farm soil mapping by local calibration of visible and near infrared prediction models. Geoderma 156:152–160. doi:10.1016/j.geoderma.2010.02.012
Xiang, H., L. Zhang, and D. Wen. 2015. Change of Soil Carbon Fractions and Water-Stable Aggregates in a Forest Ecosystem Succession in South China. Forests 6:2703–2718. doi:10.3390/f6082703