Embed Size (px)
Citation preview

Software performance tuning of software
product family architectures: two case studies
in the real-time embedded systems domain
Christian Del Rosso
Nokia Research CenterP.O. Box 407 FIN-00045
NOKIA GROUP (Finland)Phone: +358718036604Fax: +358718036856
Abstract
Software performance is an important non-functional quality attribute and soft-ware performance evaluation is an essential activity in the software developmentprocess. Especially in embedded real-time systems, software design and evaluationare driven by the needs to optimize the limited resources, to respect time deadlinesand, at the same time, to produce the best experience for end-users. Software prod-uct family architectures add additional requirements to the evaluation process. Inthis case, the evaluation includes the analysis of the optimizations and tradeoffs forthe whole products in the family. Performance evaluation of software product fam-ily architectures requires knowledge and a clear understanding of different domains:software architecture assessments, software performance and software product fam-ily architecture. We have used a scenario-driven approach to evaluate performanceand dynamic memory management efficiency in one Nokia software product familyarchitecture. In this paper we present two case studies. Furthermore, we discuss theimplications and tradeoffs of software performance against evolvability and main-tenability in software product family architectures.
Key words: Software Performance, Software Product Family, SoftwareArchitecture Assessments, Embedded Real-Time Systems, Dynamic MemoryManagement.
Email address: [email protected] (Christian Del Rosso).
Preprint submitted to Elsevier Science 12 July 2007

1 Introduction
Software performance is an important non-functional quality attribute of asoftware system. Performance and memory efficiency influence the cost, thequality and the success of a product, Ran and Lencevicius (2003). Embeddedreal-time systems add more requirements to software performance with definedtime deadlines and constraints in terms of CPU power, memory consumptionand power management. The limited resources require a carfull design. Designchoices must be targeted to limited resources and real-time deadlines. The lackof performance means time deadlines not respected and failures in achievinga successful user experience.
The ideal situation for addressing software performance is during the designstage. Performance models are created to evaluate the impact of the expectedworkload. Consequently specific design choices are reflected in the softwarearchitecture. Unfortunately, performance is usually not considered enough atdesign stage and, only later, in the development stage, attempts are made torecover weaknesses and software design flaws. The reasons for not consideringperformance from the beginning vary from tight deadlines in the software de-velopment to a potential ”we will fix it later” attitude. However, this strategyincludes potential problems in terms of cost and development time needed tore-architect the software architecture.
An additional dimension is introduced when performance is to be evaluatedand improved for a software product family architecture. A software productfamily architecture is an architecture for a set of related products. Products ina family share a common reference architecture and part of the code. There-fore, improving the performance of a software product family means enhancingthe performance of all the products in the family, or a few of them, while notaffecting the performance of the others negatively.
In this paper we first present the method and then two case studies of per-formance tuning of the S40 Nokia software product family architecture. TheS40 is one of the main Nokia’s software product family architectures. Wehave adapted the Software Performance Engineering method (SPE), Smithand Williams (1995), to the software product family domain. The method isscenario-based and it can be used to evaluate and assess the performance ofa software product family architecture during the whole software life cycle.The method is not tied to a specific modeling technique, and depending onthe stage in the software life cycle, simulation, prototyping and measurementtechniques can be applied.
The first case study focuses the analysis on the performance of the Nokia S40core software architecture. The second case study describes the analysis of
2

dynamic memory management systems in the context of the Nokia S40. Inthe case studies we have reported our main findings and reasoned on how toaddress performance tuning of software product family architectures. We havepresented our results accurately; however, for confidentiality reasons, detaileddescription of the software architecture assessed had to be excluded from thispaper.
The structure of the paper is as follows. Section 2 gives an introduction on thebasic concepts of software product family architectures. The problem state-ment and challenges of performance tuning software product family architec-tures are described in section 3. Section 4 describes the method and its varioussteps. Section 5 presents an introduction to the case studies, the S40 softwareproduct family and on the background of our work. The first case study andits results are in sections 6 and 7. Section 8 introduces the domain of dynamicmemory management in the context of embedded real-time systems, this in-troduction is related to the second case study. The second case study andits results are in sections 9 and 10. The metrics used in case study two aredescribed in appendix A. The related work is in section 12, and the discussionon performance tuning of software product family architectures is on section11. The conclusion and future work are in section 13.
2 Software Product Family Architecture (SPF)
A software product family architecture is an architecture for a set of relatedproducts. The products in the family share a common asset, part of the codeand have a common reference architecture, Jazayeri et al. (2000); Bosch (2000);Clements and Northrop (2002); Gomaa (2004). The main benefits and advan-tages of software product family architectures are an improved software qualityand the decrease of time-to-market of the products. In a competitive marketwith the trend of shortening the software life cycle of products, software prod-uct family architectures represent a key software asset in a company portfolio.
A software product family shares common assets called commonalities, how-ever, the differentiation of the products come from an architecture that allowsthe extension and the instantiation of different products from the same coreasset. Different products will have a different set of features and therefore theywill be able to differentiate themselves in the market.
We define feature in our context as a user visible functional requirement. Afeature in a mobile phone can be web browsing or FM radio. Through featuremodeling, the architecture supports the variability of products. A variabilityrepresents the control point in the architecture where the change and extensioncan be made with the degree of variation allowed.
3

A classification of feature can be described using UML (Unified Modeling Lan-guage), Rumbaugh et al. (2005). UML has not specifically addressed featuremodeling but the conceptual definition of feature can be described using UMLstereotypes. The basic conceptual classification of feature using UML stereo-types is in figure 1. A feature can be core or optional. A core feature is a featurewhich every product in the family has. A core feature is depicted in UML withthe stereotype <<core feature>> followed by the feature name. An optionalfeature is a feature provided only by some of the members of the productfamily. An optional feature is depicted with the UML stereotype <<optionalfeature>> followed by the feature name. Core and optional features can befurther specified as immutable and parametrized. Immutable features are in-stantiated in the products without further changes. An immutable featurecan be a core or an optional feature and is depicted with the UML stereotypeas <<immutable-core feature>> or as <<immutable-optional feature>> fol-lowed by the feature name. A parametrized feature, instead, defines a featurewhich is instantiated using one or more parameters whose values are defined atsystem configuration time. The specifications of the parameters is done usingUML tags. A parametrized feature is depicted with the UML stereotype as<<parametrized-core feature>> or as <<parametrized-optional feature>>
followed by the feature name and the list of tags with their assigned values. Forexample, <<parametrized-optional feature>> mediaplayer type=high−end.
<<feature>>
<<core feature>> <<optional feature>>
<<parameterized-
optional feature>>
<<parameterized-
core feature>>
<<immutable-core
feature>>
<<immutable-
optional feature>>
Fig. 1. Feature characterization in UML
The study of feature analysis and modeling is called domain engineering andseveral publications explore and present methods to model and analyze fea-tures in a software product family, Van Gurp et al. (2001); Svahnberg et al.(2005). Feature modeling has been introduced in the FODA method (Feature-Oriented Domain Analysis), Kang et al. (1990), but other feature model-ing methods include FORM (Feature-Oriented Reuse Method with Domain-Specific Reference Architectures), Kang et al. (1998), and the work by Grisset al. (1998).
Modeling features includes the understanding of their dependencies and thecreation of feature dependency graphs where links establish dependency rela-tions at the feature level. From the feature model it is possible to link featuresto the architecture design and to the implementation. Figure 2 represents,
4

conceptually, the dependency relationships among the different models in aUML diagram.
Feature
Architecturalcomponent
Source codecomponent
1..*
1..*
1..* 1..*
1..*
1..*
Fig. 2. Dependency between features, architecture design and source code level
The concept represented by figure 2 will be important in the following sec-tions when we will refer to this mapping for the scenario selection step and forthe optimizations. The traceability through the three different levels makesit possible to understand the impact of changes and improvements from theuser scenarios (containing features) to the architectural components and toactual source code modules in the software products and vice versa. Linksat each level of abstraction must be consistent in all the other levels. A linkbetween features in the feature dependency model implies an existing linkat architectural level between the components that implement those features.Subsequently, dependencies in the architectural level must be consistent withdependencies in the source code level. Software re-engineering, static and dy-namic architecture analysis study these models for architecture consistencychecks and analysis, Riva (2004); Del Rosso (2005b).
3 Problem Statement
Software evaluation for a software product family means the inclusion of thewhole products of the family in the process. Performance improvements canbe targeted to the whole software product family, to a specific product orto a subset of the products in the family, e.g. high-end products or low-endproducts. In order to accomplish this task, a clear understanding of the dif-ferent characteristics of the products in the family is needed and a detailedevaluation of the tradeoffs is necessary.
The quality of a software product is defined by a set of non-functional qualityattributes such as security, performance, evolvability, maintenability, etc. Theability to achieve the desired targets is done by a careful design and analy-sis of the tradeoffs of a software product. Non-functional quality attributesdo not live in isolation and may have conflicting requirements and demand
5

different design decisions. For example, security and reliability conflict withperformance.
An additional complexity in the evaluation process is introduced when theanalysis of the tradeoffs not only includes the non-functional quality attributesof a product but of a family of products. Conflicts in quality attributes in afamily appear when different products have different targets and markets,what in the marketing jargon is called segmentation. For example, multimediadevices and low-cost devices have conflicting requirements between perfor-mance and the cost of the products.
Enhancements and optimizations can involve refactoring the software archi-tecture of the product or refactoring the reference architecture of the softwareproduct family. The software architect performing the evaluation must notonly have a good understanding of software performance but also have anexpertise in domain analysis and software product family architectures.
Currently, assessment and evaluation methods have focused on single softwaresystems and considered and analyzed the improvements on their software ar-chitecture. On the other side, software product family research has not stressedthe analysis on the tradeoffs of non-functional quality attributes, especiallyperformance. We aim in this paper to contribute to the research literatureby presenting case studies of the analysis of software performance in softwareproduct family architectures in the industrial realm.
4 Software Performance tuning for SPF
The software performance tuning method for software product family archi-tectures presented in this paper is scenario-based. Key performance scenariosare selected and analyzed during the analysis. Scenarios contain the executionof one of more features of the products. We define feature in this paper as auser visible characteristic of the system, for example, video call. The steps ofthe software performance method are represented in the activity diagram infigure 3. The process is iterative and the analysis can be further refined andimproved by re-running the needed steps.
Our approach follows the SPE method, Smith and Williams (1995), and theactivity diagram and the steps described below reflect this fact. However, wehad to adapt the SPE method to the software product family domain. In thiscontext, we had to revise and adapt the key performance selection step, step1 in the diagram 3 and section 4.1 in the text, to take into account domainand feature analysis. Additionally, we added the analysis and tradeoffs for thesoftware product family, step 5 in the diagram 3 and section 4.5 in the text. In
6

the software product family domain the analysis and tradeoffs have to considera set of products rather than a single product.
Key PerformanceScenarios Selection
Establish Performance Objectives/Prepare Simulation Plans
Conduct Simulations/Perform Performance Models
Evaluate Simulation Results/Evaluate Performance Models
Analysis and Tradeoffsfor the Software Product Family
Analysize at which step theimprovements must be made
[satisfied]
[Not satisfied]
[step 5]
[step 4]
[step 3]
[step 2]
[step 1]
Fig. 3. Software Performance Method for SPF steps
4.1 Key Performance Scenarios Selection
The first step in the process is the selection of key performance scenarios.Scenarios define the focus of the analysis and the features included in thescenarios are considered for improvement. Key performance scenarios include
7
features that are frequently used by the end-user, thus, optimizations will havea direct impact on the user experience. Features that are resources intensiveand are particularly demanding in terms of CPU power and memory usagemust be considered even if they are rarely used. Considering real-time systems,features with real-time requirements must be considered. The importance ofthe features also come from the customer and marketing department within acompany.
In a product family architecture, scenarios can cover features instantiated in allthe products of the family, the so called core features, or can include optionalfeatures targeting a particular set of products in the family. By selecting corefeatures, all products will be directly involved in the analysis. However, newfeatures are introduced all the time during the software life cycle and we maywant to focus on newer features, that are usually particularly performance andresources demanding, and explore their impact on the software architecture.In this case, the task of the assessment will be to optimize one particularproduct or a subset of the products in the family.
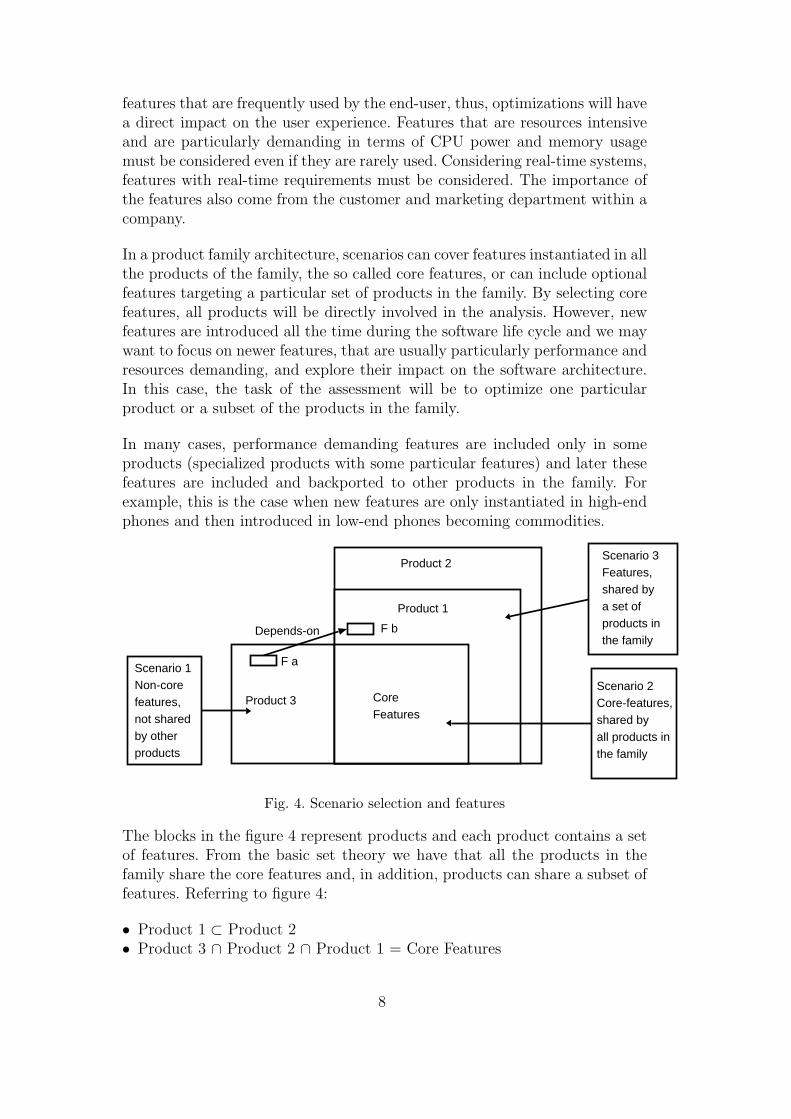
In many cases, performance demanding features are included only in someproducts (specialized products with some particular features) and later thesefeatures are included and backported to other products in the family. Forexample, this is the case when new features are only instantiated in high-endphones and then introduced in low-end phones becoming commodities.
Product 3 CoreFeatures
Product 1
Product 2
F a
F bDepends-on
Scenario 1Non-corefeatures, not sharedby other products
Scenario 2Core-features,shared by all products inthe family
Scenario 3Features,shared by a set ofproducts inthe family
Fig. 4. Scenario selection and features
The blocks in the figure 4 represent products and each product contains a setof features. From the basic set theory we have that all the products in thefamily share the core features and, in addition, products can share a subset offeatures. Referring to figure 4:
• Product 1 ⊂ Product 2• Product 3 ∩ Product 2 ∩ Product 1 = Core Features
8

Figure 4 gives a graphic representation of the dependencies between scenariosand software products. From figure 4 we have scenarios with:
• only core features• features shared with a set of other products• features not shared with other products
Features have dependencies which must be identified and understood in orderto make the necessary improvements. Methods such as FODA, Kang et al.(1990), aim at feature dependency and analysis, the so-called domain analysis,see section 2. Domain analysis is not in the scope of this paper. However,subsection 4.5 and section 11 discuss the implications of feature dependenciesfor software performance tuning.
The scenario selection process is iterative and scenarios are ranked, prioritizedand selected by the stakeholders according to the technical and business im-portance of the features. The stakeholders are the people that have a stake andcontribute to the evolution of the architecture: the software product familyarchitect, architects, software developers, etc. At the end of the process, thescenarios selected must reflect the focus of the analysis and they must be ina manageable number, a number that depends on the time for the evaluationand on the analysis’scope.
4.2 Establish Performance Objectives and Prepare Simulations Plan
In this second step we define the performance objectives and prepare the sim-ulation plans. A set of metrics and objectives must be listed in order to com-pare the results obtained with the objectives established. This step includesthe definition of the metrics, the variables to measure and the definition ofthe particular analysis technique to be used in the following step.
4.3 Conduct Simulations and Perform Performance Models
The third step in the process includes performance modeling, simulations orsoftware performance measurements. Members of the product family are usedas representatives for the study and, modelling and simulations are based ontheir performance and workload or, expected one, if the software is on earlydevelopment stage.
Depending on the software stage in the life cycle, different techniques can beused. Simulations, modeling and prototyping can be used in the early stages.For studying software performance in real-time systems RMA (Rate Mono-
9

tonic Analysis), Liu and Layland (1973), queuing theory and Markov mod-els can be used. A good reference on performance analysis and modeling isthe book by Jain (1990). In later stages of development, measurement tech-niques can be applied to the software systems. Trace instrumentation, Metzand Lencevicius (2003); Metz et al. (2005); Del Rosso (2004), is a measure-ment technique where additional code is included in the source code and tracesfrom the running system are extracted to trace the values of the needed vari-ables. With data collected from the measurements, the dynamic view of thearchitecture can be reconstructed and the performance measured, Del Rosso(2005b).
4.4 Evaluate Simulation Results and Performance Models
The fourth step in the process is the evaluation of the simulations and theperformance models. In this phase, we compare the results obtained in theprevious step with the objectives established. In addition, the hotspots andthe bottlenecks found in the architecture are analyzed and design decisionsare taken.
At architectural level we look for software anti-patterns, Smith and Williams(1995); Williams and Smith (2000). Anti-patterns document common mistakesfound in software design and anti-patterns literature not only documents badarchitecture design choices but provides ways to re-architect the system whilepreserving the semantics. Software patterns can be applied to the softwaredesign, Buschmann et al. (1996); Gamma et al. (1995), in the problematicareas. When a more extensive re-architecting activity is needed to cover theentire software architecture and not only a part of it, we apply architecturalstyles. Examples of architectural styles are the pipe and filter and the layeredstyle, Shaw and Garlan (1996).
Improvements can be done at different levels of abstraction. Optimizations atthe design level are very important, without a proper architecture a softwarecannot achieve its objectives. However, while optimizations at design level arestill very important, optimizations at the source code level play an importantrole. Refactoring can be done at the code level, Fowler (1999). In addition,algorithms and data structures must be investigated. A quick sort is fasterthan a bubble sort and a hash table gives a faster access then a sequentialaccess to data structures.
Evaluating software performance implies a thorough analysis of the tradeoffs.Quality attributes may have conflicting requirements and tradeoffs are neces-sary. For example, security and fault tolerance come at the expenses of per-formance. At the end, improvements must be evaluated against their impact
10

on the software architecture.
4.5 Analysis and Tradeoffs for the Software Product Family
The fifth step in the process is the evaluation of the performance models andthe analysis of the tradeoffs for the software product family architecture.
Once the bottlenecks and hotspots are found, the proposed solution must beevaluated for its impact on the software product family. The impact analysis,Gomaa (2004), is the evaluation of the impact of the proposed solution on theproducts of the family following the dependencies at the feature, architecturaland source code level.
Even if different products do not share common features (except for the corefeatures), features may have a dependency relation. An example is representedin figure 4 where product 3 and product 2 have a dependency between fea-tures Fa and Fb. The feature dependency relation implies a dependency at thearchitectural level and consequently at the source code level. Dependency rela-tionships must be consistent along all the three layers of abstraction presentedin figure 2.
An example of features dependency from the mobile phones domain is rep-resented by the Music Player and the Playing Ring Tones features. The twofeatures are distinct. The first feature is the music player application whilethe second feature plays the appropriate ring tone in case of various eventssuch as an incoming phone call or an incoming SMS. A mobile phone hasthe Playing Ring Tones feature since it is a core feature, but might not havethe Music Player feature which allows to play music files in different formats,e.g. windows media files, MP3, AAC. However, if we want the Playing RingTones feature to play files with codecs supported by the music player and notonly by the ring tone codecs, then a dependency relationship is created by theshared codecs modules. Once this architectural decision is made, changes inthe codecs modules will affect both features. A discussion on managing fea-tures dependency, problems and solutions in mobile software is discussed byMaccari and Heie (2005).
We must notice that the inclusion of the same feature by more products doesnot necessarily imply that the same feature is instantiated using the sameimplementation. Parametrized features, as described in fig 1, are features in-stantiated with different parameters including, eventually, different implemen-tations.
With the understanding of the impact of the improvements on the productfamily architecture we must include the analysis of the tradeoffs. While in a
11

single product architecture the analysis of the tradeoffs is between quality at-tributes in the product, by adding the product family dimension, the analysisof the tradeoffs is augmented with the analysis of the tradeoffs between qualityattributes, sometimes with conflicting requirements among the products in thefamily. Conflicting quality attribute requirements, in a single product archi-tecture, arise when the tradeoffs are between different non-functional qualityattributes such as security and performance. In a software product family,we may additionally have conflicting requirements for the same quality at-tributes. For example, improving the performance in low-end products mayimply a different architecture than the one needed in high-end products.
4.6 Iteration
The performance assessment process is iterative and improvements to the out-come can be made in every single step of the process. The scenario selectionstep can be used to improve the focus of the analysis and scenarios can beredefined and refined. Additional stakeholders can be included in the process.Performance objectives and simulation plans may be revised considering theoutcome of previous iterations. Furthermore, we may want to set more chal-lenging objectives and investigate other variables in the system. Additionalsimulations and performance models provide a deeper investigation of the sys-tem. In addition, alternative models may provide a different perspective for thesolution of the problem. The results of new simulations and performance mod-els must be analyzed and considered. The new findings should be comparedwith the previous iterations. Different architecture solutions may be investi-gated. The impact analysis will then consider the performance, implicationsand tradeoffs of the alternative solutions.
The decision to iterate is commonly done at the end of the process. Only atthe end of the process we are able to estimate the benefits and to quantify theoutcome of the analysis in terms of performance gained against the tradeoffs.However, nothing prevents reiterations in the early phases of the process. Theonly limitation is that the path must follow the directions of the activity dia-gram. The conclusion of the assessment must produce a quantifiable evidenceof the benefits, a clear description of the tradeoffs and the implications of thesolution.
5 Background of our work
Within Nokia we have three different mobile software platform architectures,the Series 30, Series 40 and Series 60. The case studies in this paper concerned
12

the Nokia’s Series 40 (S40) mobile terminals software architecture. Series 40is a Nokia proprietary software platform that has been in use for over 15years. It has been mainly deployed in low and middle-range products, as itcombines ease of use with low memory consumption and lightweight processorrequirements, both key factors in the cost of manufacturing a mobile terminal.
The Series 40 architecture was created in the mid 1990s when mobile phoneswere not the same devices we see today. A mobile phone at that time had basicfeatures such as voice and messaging. Essentially, most of today’s applicationswere not supported and in some cases not even conceivable at the time thearchitecture was designed. Examples of such requirements are: color displays,enhanced phonebook, multimedia (camera, messaging, gallery, ring tones) andthird-generation (high-bandwidth) protocols.
Furthermore, advances from component-based research and software engineer-ing together with new market demands brough the need to expand the scopeof our software. From a basic software architecture where mobile softwarewas created, the organization moved to a software product family platform.The new software platform architecture had to provide consumers with morechoices and serve several user segments. The architecture, and the organi-zation, consequently, had to be expanded and adapted to a product familyarchitecture, see section 2.
From a handful mobile phone models delivered in the first few years of theearly 90’, we now launch more than 50 mobile phones a year, in differentgeographical locations and serving several user segments. One of the biggestachievement of the Series 40 mobile phone platform is that it has been able tostretch and incorporate new requirements for over 15 years and still continuesto be the Nokia’s most profitable platform.
The development of the Series 40 software is geographically distributed overseven sites, located in three continents and separated by several time zones.Cultural, language, time-zone differences have contributed to the challengesof its software development. The S40 software has been development in dis-tributed fashion simultaneously and the documentation is not an exception.The ability of the development teams and a central architecture managementboard ensured a sort of controlled way to manage software evolution and soft-ware architecture documentation.
During the years, new requirements have been incorporated in the S40 softwareproduct family architecture and each of the requirements have had an impacton the overall architecture evolution and, in our case, in the overall softwareperformance. One way to ensure software evolution is through software archi-tecture evaluations and assessments, Del Rosso (2006a). As a software systemevolves to support new requirements, potential new performance problems
13
may arise. The software architect must consider, in industrial domain, thefeasibility of the solution and balance the performance gained against theanalysis of the cost through a careful tradeoff analysis. In this context, eval-uating performance for embedded real-time systems, means undertanding theratio between functionality and the cost of the required hardware, Ran andLencevicius (2003).
As researchers in the corporate research center we had the opportunity toperform various assessments over the years and act as consultants for the NokiaMobile Phone business unit, Del Rosso (2006a). The performance evaluationsand assessments case studies presented in this paper represent part of theresearch we have worked on during these years. The purpose of the case studieswas to determine how the current Series 40 architecture performed and whatshould have been changed in order to fulfill the new requirements. The outcomeof the assessments had to be pragmatic, it had to consider therefore cost andtime-to-market constraints, and give clear directions and solutions in a fixedperiod of time. On the other side, significant innovations and improvementshad to be considered and experimented.
6 Case Study 1
In this case study we analyzed the performance of the S40 mobile phoneplatform. The project was commissioned by the Mobile Phone business unitto our team in the corporate research center.
In the scenario selection phase we agreed to focus on the reference architectureof the product family. The reference architecture represented the core featuresand the core software from where each new product had to be derived. Thespecific product architecture is derived from the common reference architec-ture by adding features. Our work was a first attempt to understand how thecurrent architecture performed and to reason on the current design decisions.The software product family had the ability to deliver more than 50 productvariants a year and each variant had its own specific settings. It was clear thatin order to be effective and have an impact we had to have a clear and welldelimited focus.
The reference architecture and consequently the core features represented ourtarget. The core features were shared by all the products in the family andoptimizations on the core part had the immediate advantage to impact all themember in the family. Eventually, new requirements would demand specificstudies and a re-run of the process to focus on them. The reasoning to select thescenarios followed the advices given in section 4 and features frequently usedby end-users were considered. Prioritization, ranking and discussions helped in
14

Scenarios Core/Optional
defined Products with the feature
Phone Start-Up Core Feature
Scrolling the Phonebook Core Feature
Incoming Call Core Feature
Table 1Scenarios Selected
reducing the scenarios. Examples of some of the scenarios analyzed are shownin table 1.
To understand the implications for the product family, we used two handsetsas representatives for the analysis. The handsets were part of the same productfamily. One handset had a more complete and advanced set of features whilethe other had basic features. In addition, the handset with advanced featurescontained all the features included in the basic handset. Conceptually, referringto figure 4, the advanced handset corresponds to Product 2 while the basichandset corresponds to Product 1.
We chose to use trace instrumentation to profile software performance. Byrunning the scenarios in the handsets we extracted the run-time traces whichwere then stored in text log files. Only significant events were recorded and,it was part of the analysis to define what information and data were requiredfor our work.
Performance profiling using trace instrumentation has the advantage of ex-tracting exactly the rum-time system properties as compared with modelingand simulation. On the other hand, traces added to the original source codeaffect software performance so that software system performance can be dis-torted and thus the measurements, Steward (2001). A compromise is the bestsolution and a tradeoff between added traces and the information needed mustbe considered, Metz and Lencevicius (2003); Metz et al. (2005).
From the data gathered we proceeded to reconstruct the dynamic and staticviews of our software architecture. A software architecture can be documentedusing different views. For further information on documenting software ar-chitectures and the use of architectural views see, Clements et al. (2002a).Choosing the architectural views to reconstruct and analyze required a goodknowledge of the specific system. The Series 40 platform architecture uti-lizes message passing as a communication paradigm. Analyzing the run-timeproperties of the systems meant considering the software performance of themessage passing system.
We created various dynamic and static analysis tools to reconstruct the dy-
15

Fig. 5. From the Data to the Views
namic and static views of the software. For the dynamic views we used thetraces collected as input, while for the static analysis we used the actual sourcecode. Figure 5 shows the process and the various phases in the architecturalviews reconstruction.
In total, we used five different architectural views to analyze the software per-formance: the CPU load view, the message statics view, the run-time couplingview, the message sequence chart view, and the static analysis view, see figure6.
The CPU load view showed the CPU usage of the processes in the system. Themessage statistics view showed the percentage of CPU time spent on handlingdifferent message types during the scenarios. The run-time coupling view rep-resented the run-time dependencies of the processes in the scenarios analyzedand the weights in the arcs expressed, in our case, the number of messagesexchanged. The message sequence charts view showed message sequence chartdigrams with time stamps. The static analysis view was used to analyzed thearchitectural dependencies of the system extraced from the source code, Riva(2004). The static view included architecture component dependencies andfunction call dependencies.
In the analysis, the CPU load view was the first view to be begin with. Pro-cesses to be considered were the ones who consumed most of the CPU timeor demanded high processing time but for a short time. In the CPU load viewdiagram, the two behaviors were represented respectively by long execution
16

Time
B
A
t1
% C
PU
Lo
ad
BAm1m2m1
t1
t2
t3
....
A
120
B
C320
262
CPU Load View MSC View
Message Statistics ViewRun−Time Coupling View
Statistics by Message Type
m1 203 msg.; 4% CPU time
m2 179 msg.; 3.5% CPU time
m3 60 msg.; 3.2% CPU time
m4 22 msg.; 1.3% CPU time
Static Analysis ViewModule A
....
send(m1,B)
.....
Fig. 6. Architectural Views Reconstructed
time and peaks.
After the CPU load view, we analyzed the message passing system perfor-mance. Sending messages itself is not a time-consuming activity but messagesgenerate processing activities. There were different kinds of messages, and inthe message statistics view we considered their type. A message could be arequest for a particular resource, a service request, an acknowledgment or con-tain only data. By marking the begin and end of the processing time of themessage in the traces we were able to identify the time spent in serving aspecific message type.
After the message statistics view, we considered the run-time coupling view.The run-time coupling view considered the number of messages exchangedbetween processes as a coupling measure. Highly coupled processes had highranked arcs in the directed weighted graph. Figure 6 shows an example of therun-time coupling view when three processes, A, B and C are involved.Wechose the number of messages exchanged to consider the overhead createdby the processes’context switch activity. In a multi-tasking system, contextswitches, when the processor switch between various processes, happens allthe time. With the context switch there is the additional overhead to save andrestore the process’s context afterward. In a message passing system, whenthe message crosses the process’s address space boundary, a context switchhappens with the consequent processing time overhead.
Context switches can be limited by merging highly coupled processes. How-ever, other considerations must be taken into account when merging run-timeentities, such as architecture modularity and organizational issues. For exam-ple, the software architecture might have been arranged in that way consider-ing the organizational structure and geographical boundaries of the develop-
17

ment teams and its structure may be difficult to change. The discussion of therelationships and dependencies between software architecture and organiza-tional structure is beyond the focus of this paper. However, the topic has beeninvestigated in the literature, Conway (1968); Cockburn (1996); Herbsleb andGrinter (1999).
Additionally, by watching the run-time coupling of the architecture consid-erations can be made regarding its structure. The coupling view is the run-time network topology of the system and anti-patterns can be discovered,Fowler (1999), for example the god Class anti-pattern described in Smith andWilliams (1995).
Continuing with the analysis, we have the static analysis view. The staticanalysis view was the software architecture reconstructed from the softwaresource code. The static analysis was used as a support for the dynamic analysis.Run-time dependencies were traced back to source code dependencies. In thisway, the software run-time views were complemented with the static softwarearchitecture view, enhancing software comprehension. In our work, we usedthe tools and work done by Riva, Riva (2004).
The views were used to analyze the system from a certain perspective. How-ever, only the combined use of the views had the ability to provide detailedinformation from different angles. In this paper we focus on the software prod-uct family domain but a discussion on the how to create the views and theiruse has been described in our previous work, Del Rosso (2005b).
7 Results
We used the combination of the different views for the architecture recon-struction and understanding. The architectural views were reconstructed forboth the handsets we had and we analyzed their commonalities and differencesin performance and run-time dynamics. Once a bottleneck was discovered wehad to consider the potential solutions and impact in the product and productfamily architecture.
At the end of our work we had two main findings. We discovered a breakof an architectural rule during the system start-up and we identified the godclass antipattern, Smith and Williams (1995), in the reference product familyarchitecture.
The break in the architectural rule was found due to an anomalous activ-ity that was consuming an unexpected high CPU time with an associatedhigh number of messages at phone start-up. The high number of messages
18

exchanged and the peak in CPU load view were just the manifestation of theproblem. After further analysis, we found that an architectural rule had beenbroken and it was because legacy code was left from the previous architecturedesign and it had not been removed. The fault did not cause any visible fail-ure such as system crashes, however, software performance was affected. Thephone start-up feature constitutes one of the basic and fundamental func-tionalities of a mobile phone. The affected source code was shared by all themembers of the product family. Consequently, the improvement had an im-mediate effect on the software product family performance.
In addition, we identified a god class antipattern in the run-time reconstruc-tion of the architecture. The god class antipattern, in a message passing sys-tem, is represented by a task which concentrates most of the intelligence andperforms most of the work while other tasks in the systems are relegated tominor and supporting roles. Messages were sent to one main task which had tohandle them by performing additional processing operations and eventually,send back the results of the computation. The god class affects the perfor-mance of the system since it constitutes a bottleneck. Additionally, with itslow modularity the god class shows a poor architectural choice which affectsthe maintainability and evolution of the system. The god class antipatternwas a run-time architectural pattern of the S40 software platform architec-ture. The pattern was in the core architecture and it was the result of a hecticarchitecture evolution of over 15 years.
Summarizing, we considered core features in the scenario selection phase tofocus on the S40 core software platform. We analyzed the performance of thephone software by reconstructing the dynamic and static views of the S40software architecture. In the analysis, we found bottlenecks and problems inthe core architecture. Additionally, as part of the analysis, we considered theimplication and impact for the software product family. Core features areshared by all the products in the family and imply a shared architecture andsource code between the products. The architectural problems were in thecore components, and as a consequence, performance improvements affectedthe entire set of products. As part of the process, we demonstrated that theimprovements did not influence negatively the performance of other products.The check was done by analyzing the feature dependency diagrams, the ar-chitectural views and, by iterating the performance analysis process with theimprovements in place.
19

8 Dynamic Memory Management and Embedded Real-Time Sys-tems
A dynamic memory management system has to keep track of memory blocks inuse in the system and at the same time it has to optimize the usage of memory.Knuth defined dynamic storage algorithms as the algorithms for reservingand freeing variable-size blocks of memory from a large storage area, wherethese blocks are to consist of consecutive memory locations, Knuth (1997).The study of dynamic memory allocation algorithms was started in the 70s,Randell and Kuehner (1968); Purdom and Stigler (1970); Knowlton (1965);Wilson et al. (1995).
Optimization of memory usage and software performance have been the focusof the research community since the early days when resources were limitedand processing power scarce. In embedded real-time systems the considera-tions above still hold. In addition, the total cost of the devices still heavilydepends on the amount of memory embedded.
The difference between embedded real-time systems and the PC world do notend in the constrained environment of the former. In the system considered inthis paper and, in most of the existing embedded systems at the moment on themarket, there is no memory compaction and no virtual memory functions. Inaddition, in real-time systems, performance is not the only thing that matters;strict time deadlines must be respected. The failure to respect a deadline canlead, for example, to the dropping of a phone call.
Only algorithms with explicit memory management have been examined inthe case study, despite the popularity of garbage collection algorithms, theirperformance and memory requirements are still inadequate for the use in em-bedded systems, Berger and Hertz (2005).
A dynamic memory management system is made of algorithms and data struc-tures. General purpose algorithms and custom algorithms have been describedin the literature. Examples of general purpose algorithms are best-fit, first-fit,the Doug Lea algorithm, Lea (2006), (which is used in the GNU libc), andthe Windows XP allocator, Ritcher (1997). On the other side, custom algo-rithms have been implemented to optimize and exploit regularities in realprogram behavior. Examples of custom allocators are the Apache web serverallocator, Apache Foundation (2006), the C++ Standard Template libraryallocator, SGI (2006), and the GCC compiler allocator, Free Software Foun-dation (2006). The use of custom algorithms do not always bring clear benefitsand their use must be careful considered and applied only when the benefitsare clear and quantified, Berger and Zorn (2002).
When considering dynamic memory management systems, designing the algo-
20

16B 24B 32B ...... 512B 576B 640Bsize
sorted bins
chunks
+Heap
Allocated Memory
Free Memory
Fig. 7. Pool System plus Heap
rithm is not enough, data structures are also important. Different heap layoutscan be used and their properties must be considered. For example, MicrosoftC++ uses one heap for allocations of less than 200 bytes, and a second heapfor all other allocations, Microsoft Corporation (1997). Segregated free listsare preallocated lists of fixed size chunks of memory. They have been designedto handle fixed size blocks allocations and their advantage is on speed andmemory fragmentation especially in system where many small blocks are al-located, Noble and Weir (2001). The Doug Lea algorithm for example, Lea(2006), uses segregated free lists, using exact size bins of a multiple of 8 bytes,each for objects smaller than 64 bytes; for larger objects it is a pure best-fitallocator and for very large requests (larger than 128K) it relies on the systemmemory mapping facilities (if supported).
In the case study presented we have simulated two different memory layouts.The first layout was made of a contiguous memory block of memory, thatwe have called the heap, and the second layout was made of a heap plus asegregated free list data structure, see figure 7.
9 Case Study 2
The scope of our study was the analysis and the evaluation of dynamic mem-ory systems for the Series 40 software product family architecture. Multimediafeatures have gradually been introduced in mobile phones and their require-ments are demanding especially in embedded systems where memory and CPUpower are limited. The S40 software product family had a dynamic memorymanagement, based on a heap plus pool data structure, common for all themembers of the product family. However, the S40 software architecture hadevolved and a quantitative assessment was needed in order to assess how wellthe current memory management system performed.
In order to evaluate the impact of the features on the memory system we chose
21

a set of key scenarios containing core features and non-core features. Some ofthe key performance scenarios selected were:
• Sending and Receiving 5 MMS of 100 KB each• Downloading and playing a Java Midlet• Browsing the Web• Phone Start-Up
We created a simulation environment to simulate different dynamic memorymanagement systems and to extract the metrics described in appendix A. Thesimulation environment design had to be extensible and permit to easily addnew heap layouts and algorithms. Its design followed the Abstract Factorypattern and the Builder pattern, Gamma et al. (1995). For a reference on howto design a simulation environment for dynamic memory management see DanLo et al. (2004).
The workload was collected from data of allocations and deallocations in thesystem while running the scenarios and the traces were stored in text log files.Life-time and size distribution of the requests are very important for the studyof fragmentation and using real workload was an advantage. In our study wewere helped by the fact that we were analyzing a software already developedand we could extract real traces by executing the scenarios. In early designstages, mathematical functions to determine the size and the life time distri-bution of the requests can be used. Uniform and the (negative) exponentialhave been used in the literature; however, the assumption of randomness andindependence of the distribution of the life time and size of the blocks tend tobe false for most real programs, Wilson et al. (1995).
In a product family architecture, different products have different features andtherefore generate different workloads. Simulating multimedia features meantto analyze high-end products. On the other hand, simulation of core featuresfocused on requirements and needs of low-end products. Taking into accountthe scope of the analysis, we selected a multimedia phone model, a phone witha superset of the features included in other products. The phone supportedcore features plus additional multimedia features. Conceptually, the selectedphone corresponds to product 2 in figure 4 and phones without multimediafeatures can be compared to product 1.
Table 2 presents the data characteristics of a few scenarios analyzed. To betterunderstand the product family domain, we added an additional column tothe table to list the products implementing the determined feature and tospecify whether the feature was optional or part of the core. In table 2 theproducts listed serve as a demonstrative example; the data characteristics ofthe scenarios are real. The last column in table 2 is important since it connectsa feature to patterns of memory usage and to the products implementing the
22

Scenarios Number of Obj Average Obj Size Largest Block Size Core/Optional
defined Allocated (Bytes) (Bytes) Products with the feature
Sending and Receiving 5 MMS of 100 KB each 781563 92.67 96793 Optional: P1, P2
Downloading and playing 119932 83.87 46363 Optional: P1, P2, P3
a Java Midlet
Browsing the Web 201744 70.90 38859 Optional: P1, P2, P3
Phone Start-Up 26811 50.02 18400 Core Feature
Table 2Characteristics of the scenarios
Sending and Receiving Free Block Metric− Smallest−Biggest Internal Fragmentation Internal Fragmentation
5 MMS of 100KB Average Size (Bytes) Block Metric (Bytes) Worst-Case (Bytes) Average Value (Bytes)
heap bf 16489.97 669876 19454 16511.55
heap pool bf 85265.69 327264 13601 11299.17
Table 3metrics and statistics for sending and receiving 5 MMS scenario
Phone Start-Up Free Block Metric− Smallest−Biggest Internal Fragmentation Internal Fragmentation
Average Size (Bytes) Block Metric (Bytes) Worst-Case (Bytes) Average Value (Bytes)
heap bf 52607.85 1175668 16972 11776.28
heap pool bf 321533.67 660204 8857 6863.53
Table 4metrics and statistics in phone start-up
feature.
During the one year the case study lasted we simulated 12 algorithms with 2different data structures. The two data structures used were the heap and heapwith a pool system, see figure 7. The algorithms simulated included first-fit,best-fit and other algorithms with various heuristics, e.g. deferred coalescing offreed blocks. In total, we investigated the performance and memory efficiencyof 24 dynamic memory management systems. Simulating only 4 scenarios foreach of the 24 dynamic memory management systems means creating 96 differ-ent outcomes that must be analyzed. Herein the need to focus in the analysisand the importance of selecting a manegeable number of scenarios.
In this paper we report a significant example from our work. The case studypresents the discussion of the best-fit algorithm used with the two differentheap layouts. In the simulation, we also included the original dynamic memorymanagement used in the Nokia S40 architecture. The performance of the S40dynamic memory management set the reference point for the study and furtherproposed improvements had to be compared with its performance. However,for confidentiality reasons we cannot describe its internal structure.
In table 3 and table 4 we have summarized the metrics extracted for two ofthe scenarios that were more dissimilarly in the data workloads. In tables 5and 6 are presented the performance metrics.
23

Performance Metric− Performance Metric− Performance Metric− Performance Metric−
5 MMS of 100KB Worst Case Allocation Average Scans Allocation Worst Case Deallocation Average Scans Deallocation
heap bf 192 69.12 198 56.31
heap pool bf 30 9.89 16 6.20
Table 5Performance, sending and receiving 5 MMS of 100KB scenario
Phone Start-Up Performance Metric− Performance Metric− Performance Metric− Performance Metric−
Worst Case Allocation Average Scans Allocation Worst Case Deallocation Average Scans Deallocation
heap bf 157 31.24 169 30.70
heap pool bf 5 1.00 2 1.00
Table 6Performance, phone start-up scenario
10 Results
The result presented does not and does not want to cover and present thedefinitive study on the best dynamic memory management system. The sci-entific literature has thoroughly investigated and analyzed dynamic memorymanagement systems given determined patterns of allocations Grunwald andZorn (1993); Wilson et al. (1995). An entire book describes how to managedynamic memory in systems with limited memory Noble and Weir (2001)and dynamic memory management systems have been specifically designedfor multithreaded applications Berger et al. (2000). The scope of our work isto reason and present a discussion on how to address and improve memoryusage in software product family architectures.
Assessing the software architecture for evolution means to estimate and eval-uate the capacity of the architecture to incorporate new features. Multime-dia features constitute particular challenges in the embedded systems domain.Larger memory and demanding performance requirements are the characteris-tics of multimedia features. However, the range of products in the S40 productfamily includes also basic products with core features and sometimes, with nomultimedia features at all. Following the rationales described in section 4, weapproached the problem by simulating scenarios including multimedia featuresand core features. At the end, we wanted to ascertain whether the dynamicmemory management system used in the S40 was adequate or if specific andtargeted product optimizations were needed.
The patterns of data allocation of the features varied quite much. Table 2shows how the largest block size increased from the phone start-up scenarioto the MMS sending scenario. Multimedia features need to allocate largercontiguous memory blocks than core features. And, in case a large enoughmemory block is not available, the allocation fails affecting consequently thestability of the system, see 8. This trend is not going to change since multime-dia features, such as video streaming, will require larger and contiguous free
24

memory blocks in the heap.
Comparing the value of the FBM metric for the two different data structuresused, the heap and the heap with a pool system, in table 3 and table 4,we can see that a heap with a pool system achieved a better usage of thememory. The heap with a pool system presented a higher value for the FBMmetric, consequently, it presented a more compacted heap in both scenarios.To evaluate and understand whether the allocators could have failed during thescenarios, the SBBM metric was considered. The SBBM metric is a watermark;if its value is lower than the largest block allocated during the simulation ofthe scenario, a system failure may occur. Furthermore, values too close to thepotential failure point must be avoided. In both the scenarios simulated, thevalue of the SBBM metric was above the largest block allocation of 100KB,see table 2, for both the allocators. However, the SBBM metric value halvedin the sending and receiving 5 MMS scenario. Considering the SBBM metric,the heap data structure performed better than the heap with a pool datastructure since it provided a much larger SBBM value. This result showed alimitation of the heap with the pool data structure for large block allocationscompared to the heap data structure.
Regarding the allocators performance, tables 5 and 6 show that the heap witha pool clearly outperforms the heap data structure. The explanation comesfrom the fact that the majority of the allocations were still small memoryblocks, as shown by the average size of the requests, see table 2. Requestsin the pool are served using a FIFO (First In First Out) policy while in theheap, the free list data structure must be traversed to serve the allocationsand deallocations. Considering fragmentation, a pool system does not presentexternal fragmentation, but it can have internal fragmentation. However, inthe simulation, the internal fragmentation was lower in the heap with a pooldata structure.
Overall, the simulation of the best-fit with the two data structures showedthat the heap with a pool was the more suitable data structure for the systemconsidered. Small block allocations were better served by a data structure witha heap and a pool, Noble and Weir (2001). Additional optimizations for thepool data structure are still possible. For example, we used genetic algorithmsto define the size of the pool data structure given the allocations workload,Del Rosso (2006).
On the other hand, the pool had limitations with large block allocations.Large block allocations need a system where large and contiguous free mem-ory blocks are available. If the trend of the increase in size of memory allo-cations holds and from the considerations above, optimizations for small andlarge block allocations may require a different dynamic memory managementsystem. In this context, dynamic memory management from the PC world,
25

memory compaction, garbage collectors or more advanced allocators couldgradually be investigated and introduced in the embedded systems domain,Lea (2006); Wilson (1992); Berger et al. (2000). The results and distintionsbetween multimedia phones and low-end phones may have been predictablebut the analysis highlighted and presented quantified results. With quantifieddata we had the possibility to assess the risks and analyze the tradeoffs in theproduct family.
To summarize, different phones have different features and we considered fea-tures and scenarios as a way to identify different products. The scenario selec-tion phase and feature analysis helped in defining the focus and the context ofthe analysis at the beginning. In the simulation, expertise in dynamic memorymanagement was necessary. In the analysis we considered the performance andmemory efficiency of different dynamic memory management systems. Fur-thermore, we focused on the improvements and tradeoffs for the S40 softwareproduct family. In our case, the dynamic memory management system wasbased on a heap with a pool data structure, it was part of the platform andall the products used the same implementation. Given the different features’requirements, the analysis considered the tradeoff of custom dynamic memorymanagement systems for different mobile phones against a common dynamicmemory management system that could work well enough for the situation.Analyzing the tradeoffs between memory efficiency and software product fam-ily evolution, we chose a common dynamic memory management system basedon the heap with a pool data structure. The evaluation found no real need fora targeted optimization given the current workload. Therefore, an additionalvariation point in the software product family architecture was avoided.
A common dynamic memory system simplifies the management of the productfamily; it works with performance compromises but it was shown to be goodenough for the system studied at that point in time.
11 Software Performance Tuning for Software Product Families
Performance analysis of software product family architectures concerns theevaluation and analysis of features, see figure 2. In this context, the selectedscenarios express the link between features and products to be analyzed, seefigure 1. Subsequently, architectural transformations and code optimizationsare performed. Figure 2 is traversed in the other directions too, from thesource code and the software architecture level to the feature level. At theend, the impact of the improvements are evaluated against all the products inthe family.
Depending on the stage of the software in the life cycle, different techniques
26
can be used. Simulation, modeling and prototyping techniques are applied inthe early software stages. Measurements and profiling can be utilized in laterstages. Different architectural transformations can be applied to the architec-ture design and they differ to the extent in which they cover the architecture.The transformation can have an architecture wide impact by imposing an ar-chitectural style, Shaw and Garlan (1996); Buschmann et al. (1996), or coveronly a part of the architecture by applying design patterns, Gamma et al.(1995); Fowler (1999).
Architectural changes to the product family reference architecture have a wideand deep impact considering that all the products in the family will be affected,positively or negatively. When changes are specifically targeted to the productarchitecture, improvements are made to the quality of the product; however,architectural transformations may imply changes to the reference architectureor to a common architectural component, thus, affecting other products in thefamily.
In the first case study, in section 6, we have shown how optimizations made tothe reference product family architecture benefit the entire line of products.In that case, improvements were made at a system start-up component and onthe core architectural design. However, in some cases, changes may negativelyaffect some products in the family and their impact must be evaluated andanalyzed.
In the second case study, in section 9, to respond to conflicting requirementsfor low-end and high-end phones for memory management, we made some con-siderations during the analysis. While a common design approach to differentrequirements (low-end, high-end phones patterns of memory allocations) maynot be good for some products in the family, a compromise was consideredgood enough, for the system considered, at that point in time.
Adding targeted optimizations to different products have clear advantages interms of performance. However, the product family’s architecture maintain-ability decrease with the introduction of different software modules havingdifferent implementations and parameters. Increasing the variability of theproduct family architecture erodes its benefits. Quality and time-to marketget their strengths from the commonalities in the product family architecturewhich also ease the software maintenance activity. The time spent on softwaremaintenance is expensive and has been estimated to cover 80% of the activitiesof the software development process, Pigoski (1996); Glass (2003).
The increase of commonalities follows the natural process of the product familyevolution. Features descension is the process of features once instantiated onlyin particular products of the family and then, included in all the products ofthe family, as commodities, Lehman (1994); Maccari and Heie (2005). For
27

example, this is the case of multimedia features included first only in high-endphones and then incorporated as core set features of the product family.
However, even though the trend is toward an increase of commonalities, theanalysis and the evaluation of the product line may highlight a divergence inthe product line evolution. A product line divergence happens if a special fo-cus and different architectural choices are needed for a subset of the productsof the family or if a new subset of products are created due to the integrationof new features. In these situations a split in the product family can happenwith the creation of a new branch. The branch can then follow its own evo-lutionary path (software product family cloning) or can be incorporated ina hierarchical tree in the product family architecture as described in Bosch,Bosch (2000), as specialization. The second alternative has the advantage ofexploiting the commonalities of the product family while developing solutionsmore appropriate for its own evolution.
A careful analysis of the tradeoffs is essential in software performance analysisand the advantages and disadvantages of every choice must be considered.There is not a general solution for the tradeoffs analysis. Given a set of dif-ferent architectural design solutions, the chief architects, the assessment teamtogether with the system’s stakeholders must evaluate them and set the pri-orities of the assessment. For example, the analysis may set to what degree acompromise is made between software performance, software modularity andorganizational issues.
To conclude, the process of software performance evaluation requires a clearunderstanding of different domains: software architecture assessments, soft-ware performance and software product family architecture.
12 Related Work
A method to evaluate the performance of a software product family archi-tecture includes the understanding of the different domains presented in thissection. The software performance scientific literature does not have explic-itly targeted software product family architectures and vice versa, softwareproduct family architecture literature does not mention software performance.Our aim is to enhance the current state of the art with the discussion of theconvergence of the study of software performance in software product familyarchitectures.
The evaluation and optimization of software product family architectures re-quire the convergence of several domains and research areas. The performanceanalysts must understand and be familiar with the domain of software ar-
28

chitecture assessments, software performance and software product family ar-chitectures. In addition, depending on the evaluation, other domains can beincluded, for example, dynamic memory management and embedded real-timesystems architectures.
Software architecture assessments have been used to evaluate software qual-ity attributes such as evolvability, maintenability and other non-functionalquality attributes that affect the whole software architecture. Different assess-ment methods have been experimented in the scientific literature. Scenario-based assessment methods include the SAAM (Software Architecture AnalysisMethod), Kazman et al. (1996), and the ATAM (Architecture Tradeoffs Anal-ysis Method), Kazman et al. (2000), developed at the Carnegie Mellon Soft-ware Engineering Institute and described in the book, Clements et al. (2002b).Bengtsson and Bosch, Bengtsson and Bosch (1998), propose a scenario-basedassessment method with emphasis on architecture (re)design. A summary andan analysis of different scenario-based assessment methods is described in Do-brica and Niemela (2002). To date, none of the scenario assessment methodshave explicitly investigated the evaluation of product family architectures.Even though, publications are recently focusing on the subject, Olumofin andMisic (2005).
Performance is a non-functional quality attribute that is estimated using dif-ferent quantitative techniques. RMA (Rate Monotonic Analysis), Klein et al.(1993); Liu and Layland (1973), is used to estimate the schedulability of tasksin real-time systems. Queuing networks are used to create models and to esti-mate performance and resources usage. Petri nets are used to model concurrentsystems and network protocols. Markov chains represent another quantitativemodeling technique to study performance analysis.
In the early phases of a software development project when performance mea-surements of the software cannot be made, modeling, simulations and pro-totyping techniques are fundamental and, a good reference on modeling andperformance analysis is given by Jain (1990). Later, in the software develop-ment stage, measurements, instrumentation and profiling techniques can beused to tune the existing software, Metz and Lencevicius (2003); Metz et al.(2005).
Dynamic memory management is a topic that has been studied for a long timebut it is still an important area where improvements can be made. A good sur-vey and one of the most cited papers on dynamic memory management is thesurvey by Wilson et al. (1995). Dynamic memory management for embeddedreal-time systems involves optimizations for limited resources and small blockallocations; design patterns for systems with limited memory are described inthe book by, Noble and Weir (2001). On the other hand, embedded devicesare becoming more and more advanced with several functionalities. Appli-
29

cations that once ran only in the PC world are now found in mobile phonescalled smart-phones. The trend is toward larger memory allocations and mem-ory systems with an architecture similar to desktop computers. Approachesoptimized for multithreaded and distributed applications may gradually beintroducted in the embedded domain on the high-end segment, Berger et al.(2000).
Model predictions and analysis techniques are included in software perfor-mance evaluation methods to offer a quantitative approach to construct soft-ware systems that meet performance objectives. The most well known methodis the SPE (Software Performance Engineering) method by Smith and Williams(1995). SPE uses models to evaluate the tradeoffs and design choices to im-prove the architecture design and the implementation of software systems.The Pasa method Williams and Smith (2002) illustrates the use of SPE whenapplied to software performance assessments.
A software component has been defined as unit of composition with contractu-ally specified interfaces and explicit context dependencies only. A software com-ponent can be deployed independently and is subject to composition rules, Wecket al. (1998). Research on component-based software engineering, Szyperski(1997), has also focused on performance evaluations and assessments. For ex-ample, predictable assembly focuses on assembling component-based systemsthat predictably meet their quality attributes, Hissam et al. (2003). Scenario-based approaches have been used to predict real-time properties and qualitiesof component-based systems, Bondarev et al. (2004); de Jonge et al. (2003).The SPE method has been adapted and used to analyzed the performance ofcomponent-based systems, Bertolino and Mirandola (2003b,a).
Even though component-based systems share a common conceptual base withsoftware product family architectures there are various elements and conceptswhich differentiate them. Components in the software product family domaintend to be relatively large and have the concepts of variability and common-ality, Van Gurp et al. (2001); Svahnberg et al. (2005). A component in thesoftware product family domain has still the property of easily incorporate newrequirements but it must also cover the differences in component requirementsbetween various products.
Product family architectures may include low-end and high-end products. Ad-ditionally, different design choices may have been implemented and instanti-ated in different product categories. A thorough analysis of the tradeoffs anddesign alternatives must be investigated and this was one of the scopes ofour paper. To our knowledge, none of the work on software performance havefocused on software product family architectures. We have applied and ex-tended the SPE to cover software product family architectures emphasizingthe analysis of the tradeoffs, design and implementation choices, Del Rosso
30

(2005a, 2006b, 2004).
Several publications in the literature cover the design and the evolution of asoftware product family, a list of relevant books include Jazayeri et al. (2000);Bosch (2000); Clements and Northrop (2002); Gomaa (2004). However, noneof them investigate software performance and its impact on software designand evolution of a software product family.
13 Conclusion and future work
In this work we have described performance evaluations of real-time embeddedsystems in the context of software product family architectures. Evaluatingperformance on these various domains constituted the main challenge.
The approach we have used is scenario-based and scenarios are used to specifythe focus of the analysis. In the scenario selection phase, domain analysis isperformed to delimit the part of the product family architecture we want to an-alyze. After the scenarios selection phase, simulations and performance modelsare used. In the analysis phase, the improvements are considered against theimpact on the architecture. The analysis of the tradeoffs includes the investi-gation of the impact on the product family architecture.
We have used the approach within a Nokia product family architecture and wehave reported two case studies. The first case study concerned the performancetuning of the software core platform and its core features. The second casestudy focused on dynamic memory management efficiency and on the impactof multimedia features on the software product family architecture.
In section 11, we have analyzed and discussed the impact of different opti-mizations on product family architectures and suggested the advantages anddisadvantages of different architectural choices.
In future work, we plan to continue the study of how to improve softwareperformance in the context of software product family architectures. An addi-tional interesting topic is to study other non-functional quality attributes andtheir impact on software product family architectures.
Acknowledgements
This work is the result of architecture evaluations carried out by the NokiaResearch Center for the Nokia Mobile Phones business unit during a three year
31

period. In this regard, I would like to thank Andy Turner and Erling Stagefor the cooperation and support in our work. I would like to thank Jan Bosch,Jilles Van Gurp, Adrian Flanagan, Jianli Xu, Yaojin Yang, Claudio Riva andall the anonymous reviewers who have contributed to the improvement of thequality of the paper.
A Fragmentation and Memory Efficiency
Memory fragmentation is the result of allocations and deallocations made bythe software during its lifetime which divides the memory into used and unusedareas. For every memory allocation request, the dynamic memory system mustfind a large enough free block in due time. As consequence of high fragmenta-tion, a large-enough contiguous memory block may not be found, leading toerrors and system failures. The failure to deallocate a block in due time mayaffect the normal software operation with no predictable consequences.
The metrics presented in the subsections below aim to highlight potentialproblems in the dynamic memory management system and offer guidance inthe analysis. Fragmentation and memory efficiency metrics measure the effi-ciency of memory usage. On the other hand, performance metrics are used toevaluate whether the system is able to satisfy time deadlines and performance.
Other measures of fragmentation have been described, Johnstone and Wilson(1998); Wilson et al. (1995), however we needed to focus on the characteris-tics of real-time embedded systems. Strict real-time deadlines makes the useof memory compaction algorithms and garbage collectors inconvenient and,explicit memory allocators still outperform allocators with indirect memoryaccess in terms of performance and memory usage, Berger and Hertz (2005);Prechelt (2000). Enhancing the memory usage in embedded real-time systemsmeans limiting the fragmentation, in order to have large enough free blocks toserve future allocation requests, and to ensure real-time requirements. Metricsthat measure fragmentation, memory usage efficiency and performance in thecontext of embedded real-time systems must be able to highlight these issues.
A.1 Smallest-Biggest Block Metric (SBBM)
When serving a request, the main concern of the dynamic memory system isto find a large enough free block. Because of fragmentation, a large enough freeblock may not be found even though the aggregate amount of free memory ishigher than the request. In the case that a free block is not found, a failurearises.
32

t1
t2
t3
10KB 14KB 6KB Biggest allocable block= 14KB
Biggest allocable block= 16KB
Biggest allocable block= 22KB
Smallest block= 14KB10KB 16KB 6KB
22KB 12KB 6KB
Allocated Memory Free Memory
Fig. A.1. Smallest-Biggest Block Metric
t
KB
100
Heap-size
SBBM
Largest allocated block
Fig. A.2. Smallest-Biggest Block Metric
The Smallest-Biggest Block Metric (SBBM) is extracted by analyzing theheap during the entire simulation and by recording the largest free block inthe memory. At the end of the simulation, the minimum of these values is theSBBM metric, see figure A.1.
If shown in a graph, the value of SBBM represented as a function of thetime is a monotonically decreasing function. A request larger than the SBBMmay have failed during the simulation. The graph in figure A.2 shows anhypothetical situation where this happens. In the figure, the SBBM metricvalue is smaller than the largest memory request during the simulation anda potential software failure might have happened. The metric is expressed inbytes.
33
A.2 Free Block Metric - Average Size (FBM-AS)
The Free Block Metric − Average Size (FBM−AS) is the average size of freeblocks in the heap during the simulation. The metric is expressed in Bytes.The metric highlights the fact that a heap with larger free blocks, on average,is more compact, and therefore, less fragmented.
The metric is expressed in Bytes to compare the average value with the largestrequest during the simulation of the scenario. However, to compare this frag-mentation value with other heap sizes, the metric can be normalized to theheap size and a value between 0 and 1 can be returned. In case of 1 we have afree heap with no allocations and, in case of values close to 0 we have a heapthat is very fragmented.
A.3 Internal Fragmentation (IF)
Internal fragmentation measures the memory wasted (in Bytes) when a requestis served by a larger free block. The memory wasted is internal to the allocatedblock, therefore, it is called internal fragmentation.
Unfortunately it is not always possible to allocate exactly the free block size, asrounding up the requests, for example, contributes to the internal fragmenta-tion. In some allocators, the free block is split and only the necessary chunk ofmemory is allocated; however, leaving small blocks in the memory contributesto the increase of the external fragmentation, especially if the remaining chunkof free memory is smaller than the minimum block size allocable in the system.
As an example, segregated free lists do not contribute to the external fragmen-tation, but they do contribute to the internal fragmentation when a requestis served by a larger chunk of free memory.
A.4 Performances Metric (PM)
A different approach is needed when measuring performance in a simulationenvironment. In this case, performance cannot be measured using the execu-tion time.
The metric described here measures the performance using the number ofscans in the data structure needed to allocate and deallocate a memory block.Whenever an application requests a free block, the dynamic memory manage-ment system must find, in due time, a large enough free block. At the same
34

time, when a block is deallocated, it must be inserted at the right place inthe list of free blocks. For example, a size-ordered free list will require theinsertion of a freed block at the right position in the list according to its size.
The allocators used in the experiment have implemented the free list using alinked list data structure. Performance is measured in this case as the numberof scans in the linked list. A different data structure can be used withoutinvalidating the metric. The performance metrics have been used for memoryallocations and deallocations to measure the average and the worst case value.The worst case value is important when evaluating real-time systems.
These performance metrics have the benefit of being CPU independent. There-fore, the metric values are not influenced by the trace instrumentation tech-nique used for extracting the data. Including trace instrumentation in thesource code adds performance overhead that is not easy to calculate and insome cases can harm and corrupt the performance measurements, Steward(2001), even though attempts have been made to limit the problem, Metz andLencevicius (2003); Metz et al. (2005).
References
Apache Foundation, 2006. Apache web server: http://www.apache.org.Bengtsson, P., Bosch, J., June 1998. Scenario-based software architecture
reengineering. Proceedings of the Fifth International Conference on Soft-ware Reuse (ICSR), 308–317.
Berger, E. D., Hertz, M., October 2005. Quantifying the performance ofgarbage collection vs. explicit memory management. Proceedings of the20th annual ACM SIGPLAN conference on Object oriented programmingsystems languages and applications 40 (10), 313 – 326.
Berger, E. D., McKinley, K. S., Blumofe, R. D., Wilson, P. R., November2000. Hoard: a scalable memory allocator for multithreaded applications.Proceedings of the ninth international conference on Architectural supportfor programming languages and operating systems 28,34 (5,5), 117–128.
Berger, E. D., Zorn, Benjamin G.and McKinley, K. S., November 2002.Reconsidering custom memory allocation. Proceedings of the Conferenceon Object-Oriented Programming: Systems, Languages, and Applications(OOPSLA).
Bertolino, A., Mirandola, R., 2003a. Modeling and analysis of non-functionalproperties in component-based systems. Proc. International Workshop onTest and Analysis of Component Based Systems TACoS 2003 82 (6).
Bertolino, A., Mirandola, R., 2003b. Towards component based software per-formance engineering. Proc. 6th Workshop on Component-Based SoftwareEngineering: Automated Reasoning and Prediction, 1–6.
Bondarev, E., Muskens, J., de With, P., Chaudron, M., Lukkien, J., 2004. Pre-
35

dicting real-time properties of component assemblies: A scenario-simulationapproach. In: EUROMICRO ’04: Proceedings of the 30th EUROMICROConference (EUROMICRO’04). IEEE Computer Society, Washington, DC,USA, pp. 40–47.
Bosch, J., 2000. Design and Use of Sofware Architectures. Addison Wesley.Buschmann, F., Meunier, R., Rohnert, H., Sommerlad, P., Stal, M., Sommer-
lad, P., 1996. Pattern-Oriented Software Architecture, Volume 1: A Systemof Patterns. John Wiley & Sons.
Clements, P., Bachmann, F., Bass, L., Garlan, D., Ivers, J., Little, R., Nord,R., Stafford, J., 2002a. Documenting Software Architectures: Views andBeyond. Addison-Wesley.
Clements, P., Kazman, R., Klein, M., 2002b. Evaluating Software Architec-ture. Addison-Wesley.
Clements, P., Northrop, L., 2002. Software Product Lines. Addison Wesley.Cockburn, A., 1996. The interaction of social issues and software architecture.
Commun. ACM 39 (10), 40–46.Conway, M., 1968. How do committees invent. Datamation 14 (4), 28–31.Dan Lo, C.-T., Srisa-an, W., Chang, J. M., August 2004. The design and
analysis of a quantitative simulator for dynamic memory management. TheJournal of Systems and Software 72 (3), 443–453.
de Jonge, M., Muskens, J., Chaudron, M., 2003. Scenario-based predictionof run-time resource consumption in component-based software systems.Proceedings of the 6th ICSE Workshop on Component-based Software En-gineering (CBSE6), 19–24.
Del Rosso, C., March 24-26 2004. The process of and the lessons learned fromperformance tuning of a product family software architecture for mobilephones. Proceedings of the 8th European Conference on Software Mainte-nance and Reengineering Tampere, Finland.
Del Rosso, C., 2005a. Dynamic memory management for software productfamily architectures in embedded real-time systems. Proceedings of the5th Working IEEE/IFIP Conference on Software Architecture (WICSA’05),211–212.
Del Rosso, C., November 2005b. Performance analysis framework for largesoftware intensive systems with a message passing paradigm. Proceedingsof 20th Annual ACM Symposium on Applied Computing, track EmbeddedSystems: Applications, Solutions, and Techniques (EMBS), Santa Fe, NewMexico, March 13 -17, 2005.
Del Rosso, C., 2006a. Continuous evolution through software architecture eval-uation. Journal of Software Maintenance and Evolution: Research and Prac-tice 18 (5), 351 – 383.
Del Rosso, C., April 2006b. Experiences of performance tuning software prod-uct family architectures using a scenario-driven approach. Proceedings ofthe 10th International Conference on Evaluation and Assessment in Soft-ware Engineering (EASE), British Computer Society, 30–39.
Del Rosso, C., 2006. Reducing internal fragmentation in segregated free lists
36

using genetic algorithms. Proceedings of the 2nd International ACM Work-shop on Interdisciplinary Software Engineering Research (WISER), 143 –150.
Dobrica, L., Niemela, E., July 2002. A survey on software architecture analysismethods. IEEE Transaction on Software Engineering 28 (7), 638–652.
Fowler, M., 1999. Refactoring, improving the Design of the existing code.Addison Wesley.
Free Software Foundation, 2006. Gcc home page: http://gcc.gnu.org/.Gamma, E., Helm, R., Johnson, R., Vlissides, J., 1995. Design Patterns. Ad-
dison Wesley.Glass, R. L., 2003. Facts and Fallacies of Software Engineering. Addison Wes-
ley.Gomaa, H., 2004. Designing Software Product Lines with UML. Addison Wes-
ley.Griss, M. L., Favaro, J., D’Alessandro, M., June 1998. Integrating feature
modeling with rseb. Proceedings of the Fifth International Conference onSoftware Reuse, 76–85.
Grunwald, D., Zorn, B., August 1993. Customalloc: Efficient synthesized mem-ory allocators. Journal Software: Practice and Experience 23 (8), 851–869.
Herbsleb, J. D., Grinter, R. E., 1999. Splitting the organization and integratingthe code: Conway’s law revisited. In: ICSE ’99: Proceedings of the 21stinternational conference on Software engineering. IEEE Computer SocietyPress, Los Alamitos, CA, USA, pp. 85–95.
Hissam, S., Moreno, G., Stafford, J., Wallnau, K., 2003. Enabling predictableassembly. J. Syst. Softw. 65 (3), 185–198.
Jain, R., 1990. Art of Computer System Performance Analysis. John Wiley &Sons.
Jazayeri, M., Van Der Linden, F., Ran, A., 2000. Software Architecture forProduct Families. Addison Wesley.
Johnstone, M. S., Wilson, P. R., October 1998. The memory fragmentationproblem: Solved? Proceedings of the 1st international symposium on Mem-ory Management 34 (3).
Kang, K., Cohen, S., Hess, J., Novak, W., Peterson, A., S., 1990. Feature-oriented domain analysis (foda). Software Engineering Institute, CarnegieMellon University technical report (CMU/SEI-90-TR-021).
Kang, K., Kim, S., Lee, J., Shin, E., Hu, M., January 1998. Form: A feature-oriented reuse method with domain-specific reference architectures. Annalsof Software Engineering 5 (0), 143–168.
Kazman, R., Abowd, G., Bass, L., Clements, P., November 1996. Scenario-based analysis of software architecture. IEEE Software, 47–55.
Kazman, R., Klein, M., Clements, P., 2000. Atam: A method for architectureevaluation. Technical Report CMU/SEI-2000-TR-004.
Klein, M., Ralya, T., Pollak, B., Obenza, R., Gonzales Harbour, M., 1993. APractitioners Handbook for Real-Time Analisys. Kluwer Academic.
Knowlton, K. C., October 1965. A fast storage allocator. Communications of
37

the ACM 8 (10), 623 – 624.Knuth, D. E., 1997. The Art of Computer Programming, Vol 1, Third Edition.
Addison Wesley.Lea, D., 2006. A memory allocator. http://gee.cs.oswego.edu/dl/html/malloc.html.Lehman, M. M., 1994. Software Evolution. John J. Marciniak (Editor), John
Wiley & Sons.Liu, C. L., Layland, J. W., 1973. Scheduling algorithms for multiprogramming
in a hard real-time environment. Journal of the ACM (JACM) 20 (1), 40 –61.
Maccari, A., Heie, A., February 2005. Managing infinite variability in mobileterminal software. Software: Practice and Experience 35 (6), 513 – 537.
Metz, E., Lencevicius, R., May 3-11 2003. Efficient instrumentation for perfor-mance profiling. Proceedings of the ICSE Workshop on Dynamic Analysis,(WODA).
Metz, E., Lencevicius, R., Gonzalez, T. F., 2005. Performance data collec-tion using a hybrid approach. In: ESEC/FSE-13: Proceedings of the 10thEuropean software engineering conference held jointly with 13th ACM SIG-SOFT international symposium on Foundations of software engineering.ACM Press, New York, NY, USA, pp. 126–135.
Microsoft Corporation, 1997. Microsoft Windows NT 4.0 Online Documenta-tion. Microsoft Corporation, Redmon, Washington.
Noble, J., Weir, C., 2001. Small Memory Software: Patterns for system withlimited memory. Addison Wesley.
Olumofin, F., Misic, V., 2005. Extending the atam architecture evaluationto product line architectures. Proceedings of the 5th IEEE/IFIP WorkingConference on Software Architecture. (WICSA).
Pigoski, T. M., 1996. Practical Software Maintenance: Best Practices for Man-aging Your Software Investment. John Wiley & Sons.
Prechelt, L., October 2000. An empirical comparison of seven programminglanguages. IEEE Computer 33 (10), 23–29.
Purdom, P. W. J., Stigler, S. M., October 1970. Statistical properties of thebuddy system. Journal of the ACM (JACM) 17 (4), 683 – 697.
Ran, A., Lencevicius, R., 2003. Making sense of runtime architecture for mo-bile phone software. In: ESEC/FSE-11: Proceedings of the 9th Europeansoftware engineering conference held jointly with 11th ACM SIGSOFT in-ternational symposium on Foundations of software engineering. ACM Press,New York, NY, USA, pp. 367–370.
Randell, B., Kuehner, C. J., May 1968. Dynamic storage allocation systems.Communications of the ACM 11 (5), 297 – 306.
Ritcher, J., 1997. Advanced Windows, 3rd edition. Microsoft Press.Riva, C., October 2004. View-based software architecture reconstruction. PhD
dissertation, Vienna University of Technology.Rumbaugh, J., Jacobson, I., Booch, G., 2005. The Unified Modeling Language
Reference Manual, second edition. Addison-Wesley.SGI, 2006. Standard template library: http://www.sgi.com/tech/stl/allocators.html.
38

Shaw, M., Garlan, D., 1996. Software Architecture: Perspective on an Emerg-ing Discipline. Prentice Hall.
Smith, C. U., Williams, L. G., 1995. Performance Solutions. Addison Wesley.Steward, D., April 2001. Measuring execution time and real-time performance.
Embedded Systems Conference (ESC).Svahnberg, M., Van Gurp, J., Bosch, J., 2005. A taxonomy of variability re-
alization techniques. Software: Practice and Experience 35, 705–754.Szyperski, C., 1997. Component Software - Beyond Object-Oriented Program-
ming. Addison-Wesley.Van Gurp, J., Bosch, J., Svahnberg, M., 2001. On the notion of variability in
software product lines. Proceedings of the Working IEEE/IFIP Conferenceon Software Architecture, WICSA, 45–54.
Weck, W., Bosch, J., Szyperski, C., 1998. Proceedings of the third Interna-tional Workshop on Component-Oriented Programming (WCOP) (10).
Williams, L. G., Smith, C. U., ISBN:1-58113-195-X 2000. Software perfor-mance antipatterns. Proceedings of the second international workshop onSoftware and performance, 127 – 136.
Williams, L. G., Smith, C. U., 2002. pasaSM : An architectural approach to
fixing software problems. Proceedings of the third international workshopon Software and Performance (ISBN:1-58113-563-7), 179 – 189.
Wilson, P., November 1992. Uniprocessor garbage collection techniques. Inter-national Workshop on Memory Management, Lecture Notes in ComputerScience (637), 1–42.
Wilson, P. R., Johnstone, M. S., Neely, M., Boles, D., September 1995. Dy-namic storage allocation: A survey and critical review. Proc. Int. Workshopon Memory Management Kinross, Scotland, UK.
39
![Structured Merge with Auto-Tuning: Balancing Precision … · Structured Merge with Auto-Tuning: Balancing Precision and Performance ... [Software Engineering]: ... structured merge](https://img.dokumen.tips/doc/110x75/5afef5ba7f8b9a256b8dd1dc/structured-merge-with-auto-tuning-balancing-precision-merge-with-auto-tuning.jpg)