Embed Size (px)
Citation preview

SoftwareQuarterly M&A Update: Q3 2020
Solganick.com

© 2020 Solganick & Co. All Rights Reserved. 2Software M&A Report – Q3 2020
Solganick & Co.’s Team Offers Deep Software M&A Expertise
• Solganick & Co. is a data-driven investment bank focused on M&A advisory services exclusively for software and tech-enabled services companies
─ Represents both buyers and sellers of companies seeking to maximize shareholder value
─ Formed in 2009 by experienced investment bankers─ Completed over $20B in transactions to date
• Our experienced team of investment bankers come from top firms within the industry
─ Team collectively brings over 100 years of experience
• We have the understanding and experience to quickly determine our clients strategic and financial objectives, in order to manage our client’s transaction from start to finish
• Recognized as a Top Investment Bank by Axial (#2 Software Investment Bank), Most Influential Investment Bankers, and Largest Investment Banks by The Los Angeles Business Journal
Software Sectors Covered
Enterprise Software and SaaS
Artificial Intelligence and Machine Learning
Business Intelligence & Data Analytics
Customer Relationship Management
Healthcare IT
Supply Chain Management
Logistics Software
Mobile Software and Applications
Cybersecurity

© 2020 Solganick & Co. All Rights Reserved. 3Software M&A Report – Q3 2020
Select Representative Transactions
© 2020 Solganick & Co. All Rights Reserved. 4Software M&A Report – Q3 2020
Transaction Case Study: Learn on Demand Systems
• Solganick & Co. was hired by the selling shareholders of Learn on Demand Systems to explore its growth/minority control investment alternatives due to two of its co-founders exiting the business due to retirement
• A confidential and targeted process was run by Solganick to select private equity firms, leading to multiple offers received
• Learn on Demand Systems selected Quad Partners due to its deep domain expertise within the education, learning/training technology sectors as well as a strong valuation for the business
• Deal terms were undisclosed

© 2020 Solganick & Co. All Rights Reserved. 5Software M&A Report – Q3 2020
Table of Contents
• Executive Summary
• Public Markets: Software Sectors
• Public Markets: Valuation Multiples
• Public Markets: Margins
• Public Markets: Market Returns by Sector, Last Twelve Months
• M&A Activity: Select M&A Transactions
• Public Markets: Select IPOs
• Financing Activity: Select Financing Deals
• Solganick & Co. Team
• Appendix: Public Company Valuation Tables

© 2020 Solganick & Co. All Rights Reserved. 6Software M&A Report – Q3 2020
Executive Summary
• Relative to somewhat weak Q2, software M&A activity returned in Q3 2020
─ The initial uncertainty and need to stabilize existing operations and portfolio companies subsided, allowing for renewed focus on transaction pursuit
─ Debt-financing availability returned in Q3, further enabling market participants to transact
• Certain subsectors are particularly well-positioned to succeed post-pandemic
─ Communications and connectivity-focused companies have benefitted from the sudden shift to remote work and education, a trend that is anticipated to persist longer-term given widespread adoption
─ SaaS-based business models are continuing to be highly resilient and sought-after
• Significant software transactions included:
─ Clarivate's $6.8 billion acquisition of CPA Global
─ Roper's $5.4 billion acquisition of Vertafore
─ AVEVA’s $5.0 billion acquisition of OSIsoft
• IPO and financing activity during the quarter was extremely robust
─ Snowflake, Rocket Companies and Palantir entered the public marketplace with over $120 billion in combined market capitalization
Quarterly M&A Deal Volume
Source: 451 Research
Average

© 2020 Solganick & Co. All Rights Reserved. 7Software M&A Report – Q3 2020
Public MarketsSoftware Sectors
BI & Analytics Infrastructure Security Vertically Focused Diversified Financial

© 2020 Solganick & Co. All Rights Reserved. 8Software M&A Report – Q3 2020
Public MarketsSoftware Sectors
ERP Technical App CRM/Marketing SaaSHealthcare

© 2020 Solganick & Co. All Rights Reserved. 9Software M&A Report – Q3 2020
Public MarketsValuation Multiples: EV to Revenue and EBITDA
EV / LTM Revenue (Sept. 2020) EV / LTM EBITDA (Sept. 2020)
Median
Median
Source: CapitalIQ

© 2020 Solganick & Co. All Rights Reserved. 10Software M&A Report – Q3 2020
Public MarketsRevenue Growth and EBITDA Margins
Revenue Growth (Sept. 2020 NTM) EBITDA Margin (Sept. 2020 LTM)
Median
Median
Source: CapitalIQ
© 2020 Solganick & Co. All Rights Reserved. 11Software M&A Report – Q3 2020
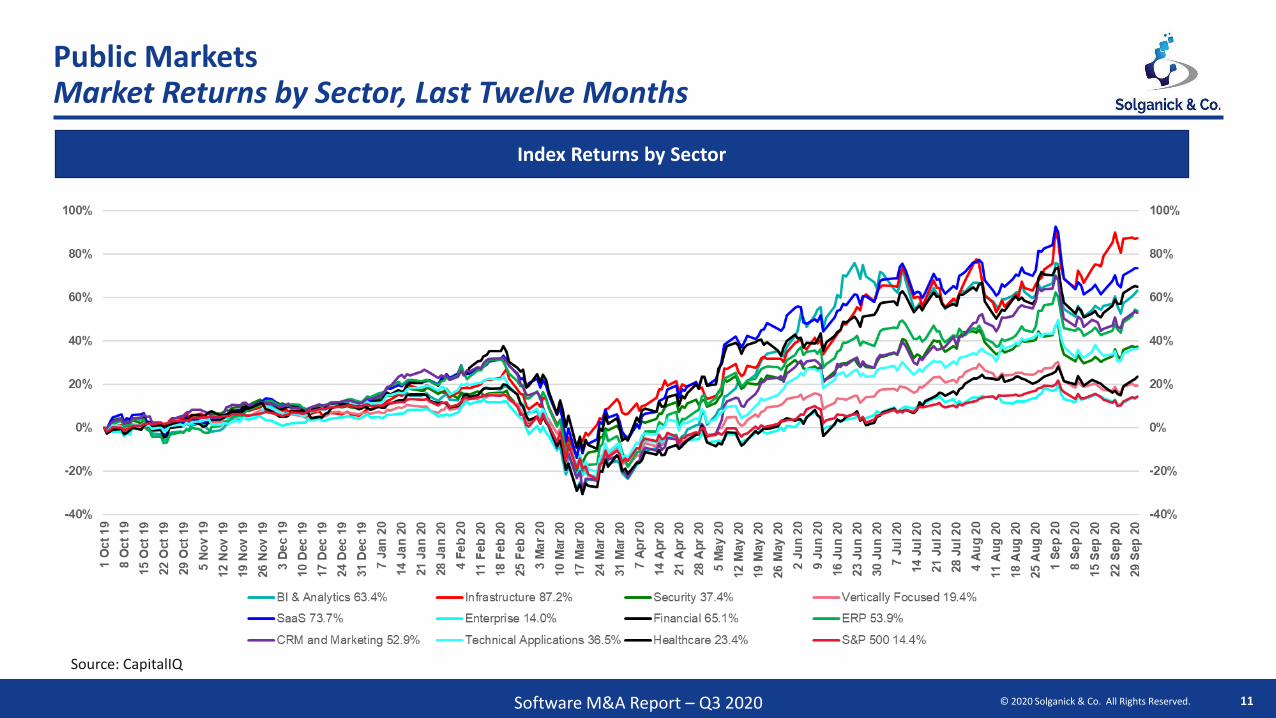
Public MarketsMarket Returns by Sector, Last Twelve Months
Index Returns by Sector
Source: CapitalIQ

© 2020 Solganick & Co. All Rights Reserved. 12Software M&A Report – Q3 2020
M&A ActivitySelect M&A Transactions
Date Target Acquirer Target DescriptionTransaction
SizeEV/ Revenue
Multiple
9/30/20RVC Medical IT is an independent software vendor offering acomprehensive Healthcare Enterprise Imaging software suite.
NA NA
9/29/20SaltStack intelligent IT automation software is used to helpthe largest businesses in the world manage and secure theirdigital infrastructure.
NA NA
9/28/20MobileIron offers a mobile-centric, zero trust securityapproach that verifies user, device, application, network, andsecurity threat.
$872M 4.3x
9/28/20Awake Security is a provider of an NTA solution that's capableof detecting and visualizing behavioral, mal-intent andcompliance incidents.
$185M 9.6x
9/21/20ZeniMax is a company connecting developers, artists,designers and programmers to create entertainment content.
$7.5B 70.4x
9/14/20Insurance Technologies provides innovative sales andregulatory automation solutions to the insurance andfinancial services industries.
NA NA
9/8/20Chef is a continuous automation platform powered bycommunity and open-source software engines.
$220M 3.2x

© 2020 Solganick & Co. All Rights Reserved. 13Software M&A Report – Q3 2020
M&A ActivitySelect M&A Transactions
Date Target Acquirer Target DescriptionTransaction
SizeEV/ Revenue
Multiple
8/31/20Rosetta Stone provides technology-based language learningsolutions, including software, online services, and audiopractice tools.
$792M 4.0x
8/31/20Epicor Software provides business software solutions to themanufacturing, distribution, retail, hospitality and servicesindustries.
$4.7B 5.9x
8/27/20Open Systems International is a supplier company of openautomation solutions for real-time management andoptimization.
$1.6B 9.6x
8/27/20Signal Sciences is a software as a service platform providingsecurity monitoring and defense for your web applications.
$775M 31.0x
8/13/20Vertafore provides software and critical information to solvebusiness challenges and capture new opportunities in theinsurance industry.
$5.4B 9.0x
8/12/20Linx Retail provides management software solutions for theretail market in Brazil and internationally through itssubsidiaries.
$1.1B NA
7/31/20Consignor Group is a software company focused on deliverymanagement solutions for the e-commerce industry andindustrial companies.
$1.5B NA
© 2020 Solganick & Co. All Rights Reserved. 14Software M&A Report – Q3 2020
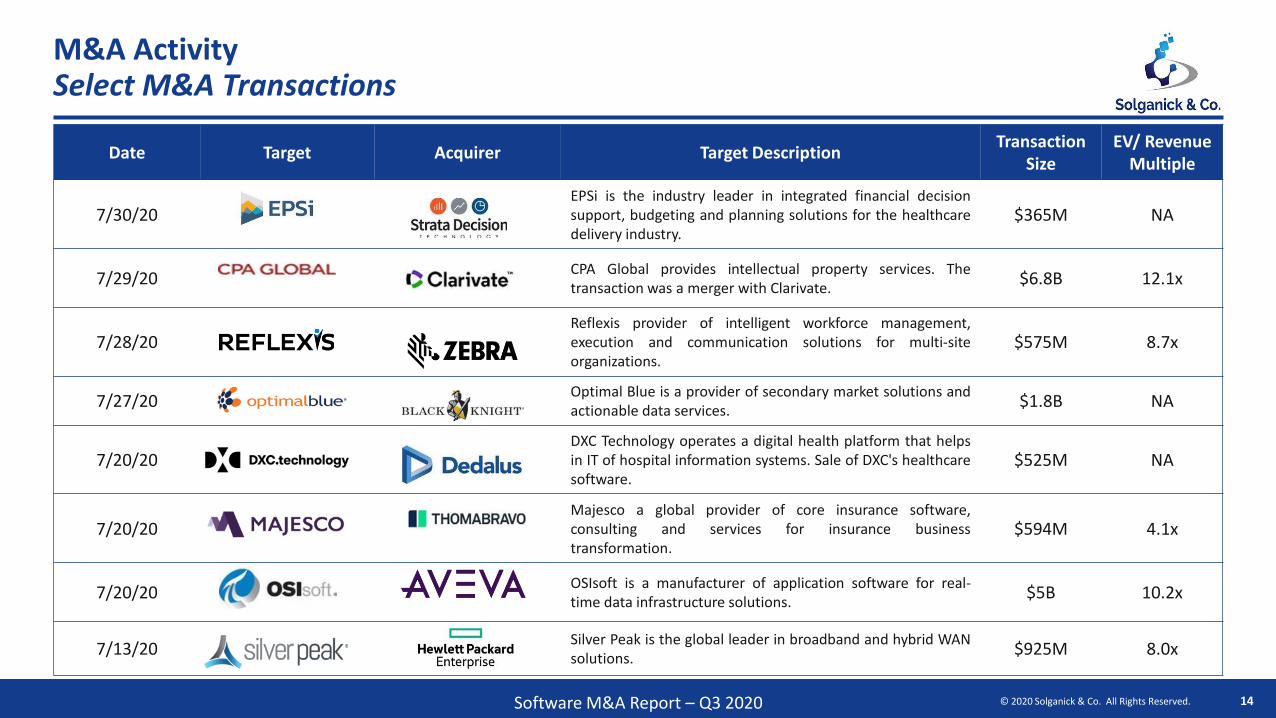
M&A ActivitySelect M&A Transactions
Date Target Acquirer Target DescriptionTransaction
SizeEV/ Revenue
Multiple
7/30/20EPSi is the industry leader in integrated financial decisionsupport, budgeting and planning solutions for the healthcaredelivery industry.
$365M NA
7/29/20CPA Global provides intellectual property services. Thetransaction was a merger with Clarivate.
$6.8B 12.1x
7/28/20Reflexis provider of intelligent workforce management,execution and communication solutions for multi-siteorganizations.
$575M 8.7x
7/27/20Optimal Blue is a provider of secondary market solutions andactionable data services.
$1.8B NA
7/20/20DXC Technology operates a digital health platform that helpsin IT of hospital information systems. Sale of DXC's healthcaresoftware.
$525M NA
7/20/20Majesco a global provider of core insurance software,consulting and services for insurance businesstransformation.
$594M 4.1x
7/20/20OSIsoft is a manufacturer of application software for real-time data infrastructure solutions.
$5B 10.2x
7/13/20Silver Peak is the global leader in broadband and hybrid WANsolutions.
$925M 8.0x

© 2020 Solganick & Co. All Rights Reserved. 15Software Quarterly Report – Q3 2020
Public MarketsSelect IPOs
IPO Date Company DescriptionAmount Raised
Market Cap at IPO
9/30/20Palantir Technologies Inc. develops software to analyze information. They offer solutionssupport many kinds of data including structured, unstructured, relational, temporal, andgeospatial. Palantir Technologies serves customers worldwide.
Direct Listing $21.0B
9/17/20Sumo Logic, Inc. provides cloud-based log management and analytics services. They enableenterprises to collect and analyze machine data from virtual sources like servers and databases.
$326M $2.7B
9/17/20Unity Software Inc. provides software solutions. They offer graphic tools to create, run, andmonetize real-time 2D and 3D content for cell phones, tablets, PCs, and consoles.
$1.3B $17.0B
9/16/20Snowflake Inc. provides software solutions. They develop database architecture, datawarehouses, query optimization, and parallelization solutions.
$3.4B $70.0B
9/16/20Jfrog Inc was founded in 2012. The company's line of business includes providing computerprogramming services.
$509M $5.7B
8/6/20Rocket Companies, Inc. is a Michigan based holding company consisting of tech-driven realestate, mortgage and financial services businesses, including simple and fast digital solutions.
$1.8B $36.0B
8/5/20Rackspace Technology, Inc. provides information technology services. They offer managed cloudand hosting, compliance assistance, enterprise security, and data protection services.
$704M $4.2B
7/14/20nCino, Inc. provides cloud banking solutions. They improve employee efficiency while enhancingthe customer experience for onboarding, loans, and deposits across all lines of business.
$250M $6.9B
7/2/20Lemonade, Inc. operates as an insurance company. They offer artificial intelligence (AI) basedtechnology for fire, property, liability, and other related insurance policy settlements.
$319M $3.0B

© 2020 Solganick & Co. All Rights Reserved. 16Software M&A Report – Q3 2020
Financing ActivitySelect Financing Deals
Date Company Lead Investor Description SizeFunding Round
9/24/20Nuvia develops processors intended to create high-performance silicon design for a compute-intensive world. It designs processing chipsets for data center servers.
$240M Series B
9/23/20Attentive is a personalized mobile messaging platform. Automatically sends engaging text messages to each subscriber at every step of the customer lifecycle.
$230M Series D
9/9/20
Sprinklr is a provider of enterprise software for customer experience management. Its helps brands understand the conversations that matter most on channels like social media, messaging, blogs, and review sites.
$200M Private Equity
8/12/20
Gong.io provides a sales conversation intelligence platform created to improve sales calls and demos. Its sales platform utilizes artificial intelligence automatically to record, transcribe, and analyzes every sales call/conversation.
$200M Series D
7/3/20
UiPath designs and develops robotic process automation software. Offers foolproof development tools, automation of intricate processes, enhanced control, cloud and on-premise deployment, and robust governance.
$225M Series E

© 2020 Solganick & Co. All Rights Reserved. 17Software M&A Report – Q3 2020
Solganick & Co. Team

© 2020 Solganick & Co. All Rights Reserved. 18Software M&A Report – Q3 2020
Solganick & Co. Team
Aaron Solganick CEO and Founder
William BilleaudManaging Director
Frank GrantManaging Director
Possesses 25 years of experience in M&A andinvestment banking and has completed over $8 billionin M&A and capital markets transactions. Prior tofounding Solganick & Co. in 2009, Aaron held seniorInvestment banking positions with B. Riley FBR, KPMGCorporate Finance, SG Capital, Southwest Securitiesand Bear Sterns, all focused on Software and ITServices. Aaron also worked in CorporateDevelopment/M&A for Perot Systems Corporation, anIT services and outsourcing firm later sold to DellComputer Corp after its IPO. Aaron holds an MBA fromSouthern Methodist University (SMU Cox School ofBusiness), his BBA in Finance from the University ofNorth Texas and has completed Executive Educationfrom Columbia University.
Bill is an investment banker, international businessexecutive and investor bringing 30+ years of leadershipexperience, shaped by focus in Corporate Finance,Professional Services and IT. He is good at growingorganizations rapidly, profitably and globally. He built 3global businesses 100+ people, 90+ managementconsulting, IT and corporate finance projects worth+$20M revenues, and successfully restructuredthe turnaround 4 PE portfolio companies, 110+%increase, $30M revenues and 55% improvement toEBITDA. He graduated from the University of Illinois atUrbana-Campaign with a B.A. in Political Science, andhas also attained an MBA from the Richard A. ChaifetzSchool of Business at Saint Louis University.
Frank advises entrepreneurs, emerging growthcompanies, venture capital firms and investors onstrategic matters. Past clients have included Zillow,StubHub, eBay, Andreesen Horowitz, BenchmarkCapital and Accel Partners. He is a member of theYurok Tribe of California and advise companies on awide range of tribal related matters, including federalIndian law, gaming, energy and other economicdevelopment opportunities. I coordinate on theformation of tribal economic developmentcorporations and assist tribes with investing inbusiness interests ranging from restaurants and hotels,to retail shopping centers and energy generationfacilities. He earned an MBA from Stanford GraduateSchool of Business and a JD from Stanford Law School(with a B.A. from U.C. Berkeley).

© 2020 Solganick & Co. All Rights Reserved. 19Software M&A Report – Q3 2020
Solganick & Co. Team
Quan VuManaging Director
Cameron O’LearyVice President
Sam DiSalvoVice President
Quan is a Managing Director heading the firm’shealthcare group. Previously, he was an investmentbanker with Morgan Stanley and Goldman Sachswhere he worked on public and private healthcareM&A transactions for large enterprise clients. Hisstrategy and corporate development experienceinclude leadership roles at Amgen, ImpactLaboratories, Anthem, and Opiant Pharmaceuticals. Incorporate development, he was a Vice President for apublicly traded firm where he led all strategic M&Ainitiatives. In addition, Quan was an economic andstrategy consultant for LEGC where he ran economicmodels and evaluated strategic growth initiatives forlarge clients. He received a BA in Economics atUniversity of California Los Angeles, Summa CumLaude.
Cameron focuses on buy-side and sell-side M&A in ITservices, healthcare IT, software, and tech-enabledservices companies. He is responsible for dealorigination, management, sourcing buyers, valuations,and leading the entire M&A process from start tofinish. Prior to Solganick & Co., he worked withinvestment bank, Harbor Ridge Capital, in Los Angeles,and private equity firm, Brook Venture Partners, inBoston. Cameron has completed numerous M&Atransactions for mid-market enterprise clients.Cameron received his BA in Economics fromthe University of Colorado Boulder and is in theprocess of attaining his Master of Liberal Arts (ALM),Ext. Studies – Finance from Harvard University.
Sam is a Vice President leading the origination andmanagement of the firm's healthcare group. Sambrings over 15 years of experience in healthcareinvestment banking, valuation, and financial advisoryservices. Prior to joining Solganick, Sam was a VicePresident in the Mergers and Acquisitions practice ofKaufman, Hall & Associates, a fully integrated advisoryservices platform with a focus on the healthcareservices sector. There he completed over 100investment banking, strategic advisory, and valuationengagements. Sam started his career at HuronConsulting Group and Wellspring Partners in Chicagoin its Business Valuation and Financial and EconomicConsulting practice. He graduated Cum Laude with aBachelor of Science in Business Administration fromMiami University.

© 2020 Solganick & Co. All Rights Reserved. 20Software M&A Report – Q3 2020
Contact Us
Office Locations
Team Contact Information
Los Angeles
1240 Rosecrans Ave, Suite 120
Manhattan Beach, California 90266
Dallas
1920 McKinney Ave, Suite 700
Dallas, Texas 75201
San Francisco
650 California Street, Suite 700
San Francisco CA 94108
Aaron Solganick
CEO and Founder
(310) 713-4764
Bill Billeaud
Managing Director
(214) [email protected]
Quan Vu
Managing Director
(310) 498-6602
Frank Grant
Managing Director
(702) [email protected]
Cameron O’Leary
Vice President
(508) 726-9387
Sam DiSalvo
Vice President
(614) 506-6677

© 2020 Solganick & Co. All Rights Reserved. 21Software M&A Report – Q3 2020
Appendix

© 2020 Solganick & Co. All Rights Reserved. 22Software M&A Report – Q3 2020
Public Company Market Performance and Metrics Business Intelligence & Analytics
BI & Analytics Revenue
Growth
EBITDA
Margin
Company Ticker Stock Price Market Cap
Enterprise
Value
Sept. 2020
LTM Rev.
Sept. 2020
LTM EBITDA
Sept. 2020
LTM
Sept. 2020
NTM
Sept. 2020
LTM
Sept. 2020
NTM
Sept. 2020
NTM
Sept. 2020
NTM
As of: 9/30/2020
Cloudera, Inc. CLDR 10.89$ 3,368$ 3,005$ 835$ (116)$ 3.6x 3.4x NM 15.2x 5% 23%
Datadog, Inc. DDOG 102.16$ 30,989$ 30,150$ 540$ 27$ 62.7x 45.4x NM NM 38% NM
Domo, Inc. DOMO 38.33$ 1,122$ 1,153$ 191$ (82)$ 6.0x 5.4x NM NM 13% NM
Dynatrace, Inc. DT 41.02$ 11,530$ 11,838$ 618$ 116$ 20.5x 17.2x NM 64.9x 19% 27%
Elastic N.V. ESTC 107.89$ 9,308$ 8,990$ 467$ (113)$ 19.3x 15.6x NM NM 24% NM
Inovalon Holdings, Inc. INOV 26.45$ 4,109$ 5,055$ 651$ 190$ 7.7x 7.0x 26.3x 20.4x 10% 34%
Medallia, Inc. MDLA 27.42$ 4,033$ 3,747$ 441$ (121)$ 8.5x 7.5x NM 117.1x 14% 6%
New Relic, Inc. NEWR 56.36$ 3,395$ 3,068$ 641$ (64)$ 4.9x 4.5x NM 43.6x 11% 10%
NICE Ltd. NICE 773.90$ 48,549$ 46,853$ 1,644$ 460$ 8.4x 8.1x 30.1x 25.5x 4% 32%
Palantir Technologies Inc. PLTR 9.50$ 15,673$ 16,816$ 1,000$ (1,130)$ 18.7x 13.4x NM NM 39% NM
PagerDuty, Inc. PD 27.11$ 2,153$ 1,797$ 189$ (43)$ 9.5x 7.9x NM NM 20% NM
Talend S.A. TLND 39.04$ 1,232$ 1,227$ 276$ (50)$ 4.6x 4.1x NM NM 12% NM
Teradata Corporation TDC 22.70$ 2,474$ 2,674$ 1,839$ 177$ 1.5x 1.5x 16.1x 6.7x (0%) 22%
Veritone, Inc. VERI 9.16$ 253$ 203$ 53$ (43)$ 4.0x 3.4x NM NM 17% NM
Mean 9,871$ 9,755$ 670$ (57)$ 9.0x 7.6x 24.2x 22.3x 16% 22%
Median 3,714$ 3,407$ 579$ (46)$ 8.0x 7.2x 26.3x 25.5x 13% 23%
Source: CapitalIQ
Note: Averages shown exclude EV/Revenue multiples exceeding 25x and exclude EV/ EBITDA multiples exceeding 50x
EV/ Revenue
Multiples EV/ EBITDA MultiplesMarket Data ($ millions)

© 2020 Solganick & Co. All Rights Reserved. 23Software M&A Report – Q3 2020
Public Company Market Performance and Metrics Infrastructure
Infrastructure Revenue
Growth
EBITDA
Margin
Company Name Ticker Stock Price Market Cap
Enterprise
Value
Sept. 2020
LTM Rev.
Sept. 2020
LTM EBITDA
Sept. 2020
LTM
Sept. 2020
NTM
Sept. 2020
LTM
Sept. 2020
NTM
Sept. 2020
NTM
Sept. 2020
NTM
As of: 9/30/2020
Akamai Technologies, Inc. AKAM 110.54$ 17,985$ 18,279$ 3,124$ 1,204$ 6.0x 5.6x 15.9x 13.0x 7% 43%
Appian Corporation APPN 64.75$ 4,523$ 4,319$ 292$ (27)$ 15.4x 14.4x NM NM 7% NM
Citrix Systems, Inc. CTXS 137.71$ 17,012$ 18,074$ 3,237$ 853$ 5.6x 5.7x 20.9x 18.0x (2%) 32%
Cloudflare, Inc. NET 41.06$ 12,553$ 11,895$ 389$ (43)$ 34.1x 25.4x NM NM 34% NM
Commvault Systems, Inc. CVLT 40.80$ 1,893$ 1,551$ 685$ 39$ 2.3x 2.3x 41.4x 12.9x 0% 18%
Fastly, Inc. FSLY 93.68$ 9,840$ 9,486$ 267$ (39)$ 38.5x 27.7x NM NM 39% NM
Juniper Networks, Inc. JNPR 21.50$ 7,133$ 7,152$ 4,431$ 749$ 1.6x 1.6x 9.4x 7.8x 1% 20%
Limelight Networks, Inc. LLNW 5.76$ 703$ 700$ 235$ 20$ 3.1x 2.8x 37.2x 19.9x 9% 14%
NetApp, Inc. NTAP 43.84$ 9,733$ 8,875$ 5,479$ 1,180$ 1.6x 1.6x 7.5x 7.5x (1%) 22%
Nutanix, Inc. NTNX 22.18$ 4,595$ 4,518$ 1,308$ (710)$ 3.5x 3.5x NM NM (0%) NM
Verint Systems Inc. VRNT 48.18$ 3,151$ 3,641$ 1,260$ 217$ 2.9x 2.8x 16.8x 11.0x 5% 25%
VeriSign, Inc. VRSN 204.85$ 23,528$ 24,127$ 1,255$ 865$ 19.4x 18.8x 27.9x 26.6x 3% 71%
Zoom Video Communications, Inc. ZM 470.11$ 133,709$ 132,300$ 1,347$ 261$ 98.3x 46.2x NM 147.3x 113% 31%
Mean 18,951$ 18,840$ 1,793$ 351$ 6.1x 5.9x 22.1x 14.6x 16% 31%
Median 9,733$ 8,875$ 1,260$ 217$ 5.6x 5.6x 18.9x 13.0x 5% 25%
Source: CapitalIQ
Note: Averages shown exclude EV/Revenue multiples exceeding 25x and exclude EV/ EBITDA multiples exceeding 50x
EV/ Revenue
Multiples EV/ EBITDA MultiplesMarket Data ($ millions)

© 2020 Solganick & Co. All Rights Reserved. 24Software M&A Report – Q3 2020
Public Company Market Performance and Metrics Cybersecurity
Security Revenue
Growth
EBITDA
Margin
Company Name Ticker Stock Price Market Cap
Enterprise
Value
Sept. 2020
LTM Rev.
Sept. 2020
LTM EBITDA
Sept. 2020
LTM
Sept. 2020
NTM
Sept. 2020
LTM
Sept. 2020
NTM
Sept. 2020
NTM
Sept. 2020
NTM
As of: 9/30/2020
Check Point Software Technologies Ltd. CHKP 120.34$ 16,872$ 12,912$ 2,045$ 934$ 6.4x 6.2x 14.1x 12.7x 3% 49%
Citrix Systems, Inc. CTXS 137.71$ 17,012$ 18,074$ 3,237$ 853$ 5.6x 5.7x 20.9x 18.0x (2%) 32%
Cloudflare, Inc. NET 41.06$ 12,553$ 11,895$ 389$ (43)$ 34.1x 25.4x NM NM 34% NM
CrowdStrike Holdings, Inc. CRWD 137.32$ 30,135$ 29,116$ 654$ (84)$ 44.5x 30.0x NM NM 48% NM
CyberArk Software Ltd. CYBR 103.42$ 4,006$ 3,389$ 450$ 31$ 7.5x 6.8x 63.8x 36.0x 10% 19%
F5 Networks, Inc. FFIV 122.77$ 7,510$ 7,202$ 2,351$ 644$ 3.1x 3.0x 11.9x 8.8x 4% 34%
FireEye, Inc. FEYE 12.35$ 2,762$ 2,870$ 928$ (41)$ 3.1x 3.1x NM 19.8x 2% 16%
Fortinet, Inc. FTNT 117.81$ 19,065$ 17,582$ 2,458$ 531$ 7.5x 6.5x 35.0x 22.6x 15% 29%
Mimecast Limited MIME 46.92$ 2,970$ 2,993$ 462$ 99$ 6.8x 5.9x 33.7x 29.7x 15% 20%
MobileIron, Inc. MOBL 7.01$ 831$ 756$ 213$ (34)$ 3.5x 3.7x NM NM (5%) NM
NortonLifeLock Inc. NLOK 20.84$ 12,317$ 14,877$ 2,454$ 929$ 6.1x 5.9x 16.0x 11.3x 2% 53%
Okta, Inc. OKTA 213.85$ 27,392$ 26,819$ 704$ (152)$ 38.1x 29.4x NM NM 30% NM
Palo Alto Networks, Inc. PANW 244.75$ 23,587$ 23,318$ 3,408$ 82$ 6.8x 5.8x 283.7x 25.2x 18% 23%
Proofpoint, Inc. PFPT 105.55$ 6,084$ 5,947$ 1,018$ 31$ 6.1x 5.4x 257.6x 34.7x 13% 16%
Qualys, Inc. QLYS 98.01$ 3,847$ 3,456$ 353$ 140$ 10.1x 9.1x 25.8x 21.5x 11% 42%
Splunk Inc. SPLK 188.13$ 30,175$ 30,785$ 2,343$ (398)$ 13.1x 12.0x NM 219.5x 9% 5%
Mean 13,570$ 13,249$ 1,467$ 220$ 6.6x 6.1x 22.5x 21.8x 13% 28%
Median 12,435$ 12,404$ 973$ 57$ 6.8x 6.1x 29.8x 22.1x 11% 26%
Source: CapitalIQ
Note: Averages shown exclude EV/Revenue multiples exceeding 25x and exclude EV/ EBITDA multiples exceeding 50x
EV/ Revenue
Multiples EV/ EBITDA MultiplesMarket Data ($ millions)

© 2020 Solganick & Co. All Rights Reserved. 25Software M&A Report – Q3 2020
Public Company Market Performance and Metrics Vertically-Focused
Vertically-Focused Revenue
Growth
EBITDA
Margin
Company Name Ticker Stock Price Market Cap
Enterprise
Value
Sept. 2020
LTM Rev.
Sept. 2020
LTM EBITDA
Sept. 2020
LTM
Sept. 2020
NTM
Sept. 2020
LTM
Sept. 2020
NTM
Sept. 2020
NTM
Sept. 2020
NTM
As of: 9/30/2020
2U, Inc. TWOU 33.86$ 2,411$ 2,561$ 722$ (65)$ 3.8x 3.2x NM 127.4x 19% 2%
Allscripts Healthcare Solutions, Inc. MDRX 8.14$ 1,327$ 2,291$ 1,676$ 112$ 1.3x 1.3x 20.3x 7.3x (1%) 19%
Amdocs Limited DOX 57.41$ 7,637$ 7,525$ 4,169$ 884$ 1.8x 1.8x 8.6x 7.3x 2% 24%
AppFolio, Inc. APPF 141.81$ 4,864$ 4,922$ 305$ 27$ 17.0x 13.9x 178.6x 79.7x 22% 17%
Black Knight, Inc. BKI 87.05$ 13,527$ 14,543$ 1,197$ 436$ 12.3x 11.1x 44.0x 22.4x 11% 49%
Blackbaud, Inc. BLKB 55.83$ 2,694$ 3,262$ 908$ 150$ 3.6x 3.6x 22.3x 14.6x (1%) 25%
Castlight Health, Inc. CSLT 1.13$ 170$ 143$ 146$ (11)$ 1.0x 1.2x NM NM (17%) NM
CDK Global, Inc. CDK 43.59$ 5,298$ 7,835$ 1,959$ 641$ 4.0x 4.0x 11.2x 10.6x 0% 38%
Cerner Corporation CERN 72.29$ 22,076$ 23,152$ 5,553$ 1,284$ 4.1x 4.1x 19.2x 12.8x 0% 32%
CoreLogic, Inc. CLGX 67.67$ 5,379$ 6,910$ 1,849$ 483$ 3.8x 3.5x 14.8x 11.3x 8% 31%
Danaher Corporation DHR 215.33$ 152,757$ 173,778$ 18,887$ 4,887$ 9.2x 7.5x 35.6x 26.4x 23% 28%
Envestnet, Inc. ENV 77.16$ 4,149$ 4,736$ 974$ 168$ 4.9x 4.6x 31.3x 20.7x 8% 22%
Guidewire Software, Inc. GWRE 104.27$ 8,704$ 8,020$ 742$ 38$ 10.8x 11.0x 211.5x NM (2%) NM
HealthStream, Inc. HSTM 20.07$ 642$ 527$ 246$ 41$ 2.1x 2.4x 12.7x 16.6x (12%) 15%
RealPage, Inc. RP 57.64$ 5,698$ 6,390$ 1,115$ 206$ 6.0x 5.3x 32.7x 19.5x 13% 27%
Roper Technologies, Inc. ROP 395.11$ 41,372$ 45,368$ 5,417$ 1,937$ 8.4x 7.5x 23.7x 20.5x 11% 37%
Tyler Technologies, Inc. TYL 348.56$ 14,026$ 13,643$ 1,122$ 230$ 12.3x 11.6x 62.1x 40.5x 6% 29%
Veeva Systems Inc. VEEV 281.19$ 42,411$ 40,973$ 1,283$ 359$ 31.9x 26.5x 114.2x 68.8x 21% 38%
Mean 18,619$ 20,366$ 2,682$ 656$ 6.3x 5.7x 23.0x 17.7x 6% 27%
Median 5,539$ 7,218$ 1,159$ 218$ 4.5x 4.4x 27.5x 20.0x 7% 28%
Source: CapitalIQ
Note: Averages shown exclude EV/Revenue multiples exceeding 25x and exclude EV/ EBITDA multiples exceeding 50x
EV/ Revenue
Multiples EV/ EBITDA MultiplesMarket Data ($ millions)

© 2020 Solganick & Co. All Rights Reserved. 26Software M&A Report – Q3 2020
Public Company Market Performance and Metrics Diversified
Diversified Revenue
Growth
EBITDA
Margin
Company Name Ticker Stock Price Market Cap
Enterprise
Value
Sept. 2020
LTM Rev.
Sept. 2020
LTM EBITDA
Sept. 2020
LTM
Sept. 2020
NTM
Sept. 2020
LTM
Sept. 2020
NTM
Sept. 2020
NTM
Sept. 2020
NTM
As of: 9/30/2020
Cisco Systems, Inc. CSCO 39.39$ 166,755$ 152,915$ 49,301$ 16,476$ 3.1x 3.2x 9.3x 8.8x (2%) 36%
Dell Technologies Inc. DELL 67.69$ 50,545$ 100,072$ 91,506$ 9,368$ 1.1x 1.1x 10.7x 8.9x (2%) 12%
HP Inc. HPQ 18.99$ 26,083$ 28,822$ 56,788$ 5,236$ 0.5x 0.5x 5.5x 6.4x (1%) 8%
International Business Machines CorporationIBM 121.67$ 108,357$ 164,155$ 75,030$ 17,930$ 2.2x 2.2x 9.2x 8.5x (1%) 26%
Microsoft Corporation MSFT 210.33$ 1,591,704$ 1,537,322$ 147,114$ 70,199$ 10.7x 9.8x 22.8x 21.0x 10% 47%
Oracle Corporation ORCL 59.70$ 179,750$ 208,862$ 39,217$ 16,789$ 5.3x 5.2x 12.4x 10.7x 2% 49%
SAP SE SAP 132.76$ 158,094$ 167,636$ 27,840$ 7,570$ 6.0x 5.8x 21.4x 17.0x 3% 34%
Mean 325,898$ 337,112$ 69,542$ 20,510$ 4.1x 4.0x 13.0x 11.6x 1% 30%
Median 158,094$ 164,155$ 56,788$ 16,476$ 3.1x 3.2x 10.7x 8.9x (1%) 34%
Source: CapitalIQ
Note: Averages shown exclude EV/Revenue multiples exceeding 25x and exclude EV/ EBITDA multiples exceeding 50x
EV/ Revenue
Multiples EV/ EBITDA MultiplesMarket Data ($ millions)

© 2020 Solganick & Co. All Rights Reserved. 27Software M&A Report – Q3 2020
Public Company Market Performance and Metrics Financial
Financial Revenue
Growth
EBITDA
Margin
Company Name Ticker Stock Price Market Cap
Enterprise
Value
Sept. 2020
LTM Rev.
Sept. 2020
LTM EBITDA
Sept. 2020
LTM
Sept. 2020
NTM
Sept. 2020
LTM
Sept. 2020
NTM
Sept. 2020
NTM
Sept. 2020
NTM
As of: 9/30/2020
Anaplan, Inc. PLAN 62.58$ 8,747$ 8,495$ 398$ (119)$ 21.3x 17.4x NM NM 23% NM
Bill.com Holdings, Inc. BILL 100.31$ 8,043$ 7,348$ 169$ (28)$ 46.6x 39.8x NM NM 17% NM
BlackLine, Inc. BL 89.63$ 5,100$ 4,889$ 336$ 6$ 15.2x 13.5x NM 122.1x 13% 11%
Coupa Software Incorporated COUP 274.24$ 18,881$ 19,029$ 458$ (31)$ 41.5x 34.5x NM 180.4x 20% 19%
Fiserv, Inc. FISV 103.05$ 69,007$ 91,715$ 15,065$ 4,850$ 6.4x 5.8x 20.2x 15.1x 9% 39%
Intuit Inc. INTU 326.21$ 85,404$ 81,990$ 7,679$ 2,432$ 10.7x 9.9x 33.7x 26.2x 7% 38%
Jack Henry & Associates, Inc. JKHY 162.59$ 12,461$ 12,316$ 1,711$ 463$ 7.3x 7.0x 26.6x 22.8x 4% 31%
MSCI Inc. MSCI 356.78$ 29,840$ 31,998$ 1,658$ 954$ 19.7x 18.2x 34.5x 32.2x 8% 57%
Mean 29,685$ 32,223$ 3,434$ 1,066$ 13.4x 12.0x 28.8x 24.1x 13% 32%
Median 15,671$ 15,673$ 1,058$ 235$ 17.4x 15.5x 30.2x 29.2x 11% 34%
Source: CapitalIQ
Note: Averages shown exclude EV/Revenue multiples exceeding 25x and exclude EV/ EBITDA multiples exceeding 50x
Market Data ($ millions)
EV/ Revenue
Multiples EV/ EBITDA Multiples

© 2020 Solganick & Co. All Rights Reserved. 28Software M&A Report – Q3 2020
Public Company Market Performance and Metrics Healthcare
Healthcare Revenue
Growth
EBITDA
Margin
Company Name Ticker Stock Price Market Cap
Enterprise
Value
Sept. 2020
LTM Rev.
Sept. 2020
LTM EBITDA
Sept. 2020
LTM
Sept. 2020
NTM
Sept. 2020
LTM
Sept. 2020
NTM
Sept. 2020
NTM
Sept. 2020
NTM
As of: 9/30/2020
Allscripts Healthcare Solutions, Inc. MDRX 8.14$ 1,327$ 2,291$ 1,676$ 112$ 1.3x 1.3x 20.3x 7.3x (1%) 19%
Castlight Health, Inc. CSLT 1.13$ 170$ 143$ 146$ (11)$ 1.0x 1.2x NM NM (17%) NM
Cerner Corporation CERN 72.29$ 22,076$ 23,152$ 5,553$ 1,284$ 4.1x 4.1x 19.2x 12.8x 0% 32%
Change Healthcare Inc. CHNG 14.51$ 4,415$ 9,467$ 1,647$ (389)$ 10.6x 2.9x NM 9.7x 264% 30%
Computer Programs and Systems, Inc. CPSI 27.61$ 389$ 480$ 268$ 36$ 1.8x 1.8x 13.3x 9.9x 1% 18%
Evolent Health, Inc. EVH 12.41$ 1,063$ 1,338$ 987$ 28$ 1.4x 1.3x 112.2x 37.7x 6% 4%
Health Catalyst, Inc. HCAT 36.60$ 1,453$ 1,280$ 179$ (52)$ 7.5x 6.5x NM NM 15% NM
HealthEquity, Inc. HQY 51.37$ 3,948$ 4,780$ 724$ 216$ 6.6x 6.4x 22.1x 21.8x 3% 29%
Inovalon Holdings, Inc. INOV 26.45$ 4,109$ 5,055$ 651$ 190$ 7.7x 7.0x 26.3x 20.4x 10% 34%
IQVIA Holdings Inc. IQV 157.63$ 30,150$ 42,074$ 10,956$ 1,973$ 3.8x 3.6x 21.4x 17.0x 6% 21%
Model N, Inc. MODN 35.28$ 1,219$ 1,143$ 161$ 2$ 7.3x 6.8x NM 54.0x 8% 13%
NextGen Healthcare, Inc. NXGN 12.74$ 849$ 883$ 545$ 44$ 1.6x 1.6x 20.6x 9.1x 1% 18%
Phreesia, Inc. PHR 32.13$ 1,220$ 1,167$ 134$ (7)$ 8.7x 7.6x NM 217.3x 15% 3%
Simulations Plus, Inc. SLP 75.36$ 1,500$ 1,493$ 42$ 15$ 37.3x 31.3x 98.1x 71.9x 19% 44%
Tabula Rasa HealthCare, Inc. TRHC 40.77$ 882$ 1,102$ 293$ (5)$ 3.7x 3.3x NM 28.8x 11% 12%
Veeva Systems Inc. VEEV 281.19$ 42,411$ 40,973$ 1,283$ 359$ 31.9x 26.5x 114.2x 68.8x 21% 38%
Mean 7,324$ 8,551$ 1,578$ 237$ 4.8x 4.0x 20.5x 17.4x 23% 22%
Median 1,390$ 1,415$ 598$ 32$ 5.4x 3.9x 21.8x 21.1x 7% 20%
Source: CapitalIQ
Note: Averages shown exclude EV/Revenue multiples exceeding 25x and exclude EV/ EBITDA multiples exceeding 50x
Market Data ($ millions)
EV/ Revenue
Multiples EV/ EBITDA Multiples

© 2020 Solganick & Co. All Rights Reserved. 29Software M&A Report – Q3 2020
Public Company Market Performance and Metrics ERP
ERP Revenue
Growth
EBITDA
Margin
Company Name Ticker Stock Price Market Cap
Enterprise
Value
Sept. 2020
LTM Rev.
Sept. 2020
LTM EBITDA
Sept. 2020
LTM
Sept. 2020
NTM
Sept. 2020
LTM
Sept. 2020
NTM
Sept. 2020
NTM
Sept. 2020
NTM
As of: 9/30/2020
Anaplan, Inc. PLAN 62.58$ 8,747$ 8,495$ 398$ (119)$ 21.3x 17.4x NM NM 23% NM
Ceridian HCM Holding Inc. CDAY 82.65$ 12,151$ 12,636$ 842$ 99$ 15.1x 14.3x 113.3x 78.7x 5% 18%
Paycom Software, Inc. PAYC 311.30$ 17,932$ 17,872$ 814$ 252$ 22.6x 19.9x 67.2x 53.2x 13% 37%
Paylocity Holding Corporation PCTY 161.42$ 8,687$ 8,583$ 570$ 99$ 15.3x 13.9x 84.6x 57.8x 10% 24%
SAP SE SAP 132.76$ 158,094$ 167,636$ 27,840$ 7,570$ 6.0x 5.8x 21.4x 17.0x 3% 34%
ServiceNow, Inc. NOW 485.00$ 93,023$ 91,879$ 4,221$ 603$ 23.2x 18.8x 162.7x 61.4x 24% 31%
Shopify Inc. SHOP 1,022.97$ 124,677$ 120,830$ 2,457$ 94$ 58.1x 41.4x NM NM 40% NM
Slack Technologies, Inc. WORK 26.86$ 15,324$ 14,654$ 768$ (228)$ 19.1x 14.8x NM NM 29% NM
Technology One Limited ASX: TNE 7.94$ 2,535$ 2,482$ 294$ 88$ 8.4x 7.8x 28.2x 22.7x 8% 34%
WiseTech Global Limited ASX: WTC 25.79$ 8,311$ 8,132$ 429$ 112$ 18.9x 16.2x 72.5x 47.6x 17% 34%
Workday, Inc. WDAY 215.13$ 51,020$ 50,404$ 3,995$ 80$ 12.6x 11.0x NM 44.3x 15% 25%
Zendesk, Inc. ZEN 102.92$ 11,880$ 11,729$ 976$ (62)$ 12.7x 10.5x NM 103.1x 21% 10%
Mean 42,699$ 42,944$ 3,634$ 716$ 15.9x 13.7x 24.8x 32.9x 17% 28%
Median 13,738$ 13,645$ 828$ 97$ 17.1x 14.5x 72.5x 53.2x 16% 31%
Source: CapitalIQ
Note: Averages shown exclude EV/Revenue multiples exceeding 25x and exclude EV/ EBITDA multiples exceeding 50x
Market Data ($ millions)
EV/ Revenue
Multiples EV/ EBITDA Multiples

© 2020 Solganick & Co. All Rights Reserved. 30Software M&A Report – Q3 2020
Public Company Market Performance and Metrics Technical Applications
Technical Applications Revenue
Growth
EBITDA
Margin
Company Name Ticker Stock Price Market Cap
Enterprise
Value
Sept. 2020
LTM Rev.
Sept. 2020
LTM EBITDA
Sept. 2020
LTM
Sept. 2020
NTM
Sept. 2020
LTM
Sept. 2020
NTM
Sept. 2020
NTM
Sept. 2020
NTM
As of: 9/30/2020
Altair Engineering Inc. ALTR 41.98$ 3,069$ 3,036$ 460$ 42$ 6.7x 6.5x 82.2x 91.8x 2% 7%
ANSYS, Inc. ANSS 327.23$ 28,073$ 27,874$ 1,544$ 511$ 18.3x 16.5x 53.5x 37.9x 11% 43%
Aspen Technology, Inc. AZPN 126.59$ 8,573$ 8,752$ 590$ 268$ 14.8x 12.0x 32.7x 21.6x 23% 56%
Autodesk, Inc. ADSK 231.01$ 50,656$ 51,219$ 3,541$ 737$ 14.5x 12.7x 69.5x 37.0x 14% 34%
Cadence Design Systems, Inc. CDNS 106.63$ 29,728$ 29,235$ 2,523$ 730$ 12.0x 10.8x 42.9x 28.8x 11% 37%
PTC Inc. PTC 82.72$ 9,605$ 10,511$ 1,458$ 389$ 7.5x 7.0x 30.3x 21.5x 7% 32%
Roper Technologies, Inc. ROP 395.11$ 41,372$ 45,368$ 5,417$ 1,937$ 8.4x 7.5x 23.7x 20.5x 11% 37%
Synopsys, Inc. SNPS 213.98$ 32,474$ 32,103$ 3,511$ 856$ 9.1x 8.1x 37.5x 24.9x 13% 32%
Trimble Inc. TRMB 48.70$ 12,186$ 13,935$ 3,134$ 717$ 4.4x 4.5x 19.4x 20.0x (0%) 22%
Mean 23,971$ 24,670$ 2,464$ 687$ 10.6x 9.5x 31.1x 26.5x 10% 34%
Median 28,073$ 27,874$ 2,523$ 717$ 9.1x 8.1x 37.5x 24.9x 11% 34%
Source: CapitalIQ
Note: Averages shown exclude EV/Revenue multiples exceeding 25x and exclude EV/ EBITDA multiples exceeding 50x
Market Data ($ millions)
EV/ Revenue
Multiples EV/ EBITDA Multiples

© 2020 Solganick & Co. All Rights Reserved. 31Software M&A Report – Q3 2020
Public Company Market Performance and Metrics CRM and Marketing
CRM and Marketing Revenue
Growth
EBITDA
Margin
Company Name Ticker Stock Price Market Cap
Enterprise
Value
Sept. 2020
LTM Rev.
Sept. 2020
LTM EBITDA
Sept. 2020
LTM
Sept. 2020
NTM
Sept. 2020
LTM
Sept. 2020
NTM
Sept. 2020
NTM
Sept. 2020
NTM
As of: 9/30/2020
Brightcove Inc. BCOV 10.24$ 404$ 395$ 191$ 11$ 2.1x 2.1x 42.2x 42.5x 2% 5%
Cardlytics, Inc. CDLX 70.57$ 1,926$ 1,841$ 189$ (33)$ 9.2x 9.2x NM NM 1% NM
ChannelAdvisor Corporation ECOM 14.47$ 415$ 364$ 140$ 29$ 2.7x 2.5x 12.9x 10.9x 5% 23%
HubSpot, Inc. HUBS 292.23$ 13,315$ 12,952$ 817$ 6$ 17.0x 14.3x NM 135.5x 19% 11%
LivePerson, Inc. LPSN 51.99$ 3,440$ 3,469$ 344$ (35)$ 10.7x 8.8x NM 145.4x 21% 6%
Medallia, Inc. MDLA 27.42$ 4,033$ 3,747$ 441$ (121)$ 8.5x 7.5x NM 117.1x 14% 6%
NICE Ltd. NICE 773.90$ 48,549$ 46,853$ 1,644$ 460$ 8.4x 8.1x 30.1x 25.5x 4% 32%
Pegasystems Inc. PEGA 121.04$ 9,733$ 9,793$ 995$ (93)$ 9.9x 8.5x NM 189.0x 17% 4%
salesforce.com, inc. CRM 251.32$ 228,701$ 225,606$ 19,380$ 3,120$ 11.6x 10.1x 72.3x 33.6x 16% 30%
Sprout Social, Inc. SPT 38.50$ 2,025$ 1,921$ 124$ (43)$ 16.5x 13.3x NM NM 24% NM
SVMK Inc. SVMK 22.11$ 3,102$ 3,226$ 359$ (48)$ 9.4x 7.9x NM 63.7x 20% 12%
TechTarget, Inc. TTGT 43.96$ 1,211$ 1,208$ 138$ 33$ 8.9x 8.4x 37.1x 25.6x 6% 33%
Upland Software, Inc. UPLD 37.70$ 1,108$ 1,591$ 280$ 51$ 6.1x 5.6x 31.5x 16.9x 8% 33%
Verint Systems Inc. VRNT 48.18$ 3,151$ 3,641$ 1,260$ 217$ 2.9x 2.8x 16.8x 11.0x 5% 25%
Yext, Inc. YEXT 15.18$ 1,816$ 1,723$ 331$ (91)$ 5.2x 4.5x NM NM 17% NM
Mean 21,529$ 21,222$ 1,776$ 231$ 8.6x 7.6x 28.4x 23.7x 12% 18%
Median 3,102$ 3,226$ 344$ 6$ 8.9x 8.1x 31.5x 38.0x 14% 18%
Source: CapitalIQ
Note: Averages shown exclude EV/Revenue multiples exceeding 25x and exclude EV/ EBITDA multiples exceeding 50x
Market Data ($ millions)
EV/ Revenue
Multiples EV/ EBITDA Multiples

© 2020 Solganick & Co. All Rights Reserved. 32Software M&A Report – Q3 2020
Public Company Market Performance and Metrics SaaS
Table continued on following page
SaaS Revenue
Growth
EBITDA
Margin
Company Name Ticker Stock Price Market Cap
Enterprise
Value
Sept. 2020
LTM Rev.
Sept. 2020
LTM EBITDA
Sept. 2020
LTM
Sept. 2020
NTM
Sept. 2020
LTM
Sept. 2020
NTM
Sept. 2020
NTM
Sept. 2020
NTM
As of: 9/30/2020
Anaplan, Inc. PLAN 62.58$ 8,747$ 8,495$ 398$ (119)$ 21.3x 17.4x NM NM 23% NM
AppFolio, Inc. APPF 141.81$ 4,864$ 4,922$ 305$ 27$ 17.0x 13.9x 178.6x 79.7x 22% 17%
Atlassian Corporation Plc TEAM 181.79$ 45,077$ 43,975$ 1,710$ 97$ 27.2x 22.9x NM 89.8x 19% 25%
BlackLine, Inc. BL 89.63$ 5,100$ 4,889$ 336$ 6$ 15.2x 13.5x NM 122.1x 13% 11%
Box, Inc. BOX 17.36$ 2,718$ 2,900$ 737$ 18$ 3.9x 3.6x 163.7x 16.2x 9% 22%
Coupa Software Incorporated COUP 274.24$ 18,881$ 19,029$ 458$ (31)$ 41.5x 34.5x NM 180.4x 20% 19%
DocuSign, Inc. DOCU 215.24$ 39,855$ 39,868$ 1,164$ (101)$ 34.3x 24.9x NM 208.0x 37% 12%
Dropbox, Inc. DBX 19.26$ 7,961$ 7,934$ 1,856$ 322$ 4.4x 4.0x 28.9x 14.4x 11% 28%
Everbridge, Inc. EVBG 125.73$ 4,348$ 4,326$ 253$ (39)$ 18.5x 14.6x NM 280.2x 27% 5%
Five9, Inc. FIVN 129.68$ 8,473$ 8,360$ 399$ 17$ 22.5x 19.5x NM 116.1x 16% 17%
HubSpot, Inc. HUBS 292.23$ 13,315$ 12,952$ 817$ 6$ 17.0x 14.3x NM 135.5x 19% 11%
Mimecast Limited MIME 46.92$ 2,970$ 2,993$ 462$ 99$ 6.8x 5.9x 33.7x 29.7x 15% 20%
New Relic, Inc. NEWR 56.36$ 3,395$ 3,068$ 641$ (64)$ 4.9x 4.5x NM 43.6x 11% 10%
Okta, Inc. OKTA 213.85$ 27,392$ 26,819$ 704$ (152)$ 38.1x 29.4x NM NM 30% NM
Mean 36,725$ 36,159$ 2,483$ 249$ 13.9x 12.7x 31.3x 31.4x 21% 18%
Median 13,315$ 12,952$ 814$ 6$ 16.8x 13.9x 78.5x 84.8x 20% 17%
Source: CapitalIQ
Note: Averages shown exclude EV/Revenue multiples exceeding 25x and exclude EV/ EBITDA multiples exceeding 50x
EV/ EBITDA MultiplesMarket Data ($ millions)
EV/ Revenue
Multiples

© 2020 Solganick & Co. All Rights Reserved. 33Software M&A Report – Q3 2020
Public Company Market Performance and Metrics SaaS
SaaS Revenue
Growth
EBITDA
Margin
Company Name Ticker Stock Price Market Cap
Enterprise
Value
Sept. 2020
LTM Rev.
Sept. 2020
LTM EBITDA
Sept. 2020
LTM
Sept. 2020
NTM
Sept. 2020
LTM
Sept. 2020
NTM
Sept. 2020
NTM
Sept. 2020
NTM
As of: 9/30/2020
Paycom Software, Inc. PAYC 311.30$ 17,932$ 17,872$ 814$ 252$ 22.6x 19.9x 67.2x 53.2x 13% 37%
Paylocity Holding Corporation PCTY 161.42$ 8,687$ 8,583$ 570$ 99$ 15.3x 13.9x 84.6x 57.8x 10% 24%
PayPal Holdings, Inc. PYPL 197.03$ 231,175$ 227,845$ 20,299$ 4,184$ 11.9x 9.7x 59.9x 34.4x 22% 28%
Pluralsight, Inc. PS 17.13$ 1,917$ 2,127$ 376$ (115)$ 5.9x 5.2x NM NM 14% NM
Proofpoint, Inc. PFPT 105.55$ 6,084$ 5,947$ 1,018$ 31$ 6.1x 5.4x 257.6x 34.7x 13% 16%
RingCentral, Inc. RNG 274.61$ 24,429$ 24,749$ 1,102$ (9)$ 24.0x 19.6x NM 150.8x 22% 13%
salesforce.com, inc. CRM 251.32$ 228,701$ 225,606$ 19,380$ 3,120$ 11.6x 10.1x 72.3x 33.6x 16% 30%
ServiceNow, Inc. NOW 485.00$ 93,023$ 91,879$ 4,221$ 603$ 23.2x 18.8x 162.7x 61.4x 24% 31%
Shopify Inc. SHOP 1,022.97$ 124,677$ 120,830$ 2,457$ 94$ 58.1x 41.4x NM NM 40% NM
Slack Technologies, Inc. WORK 26.86$ 15,324$ 14,654$ 768$ (228)$ 19.1x 14.8x NM NM 29% NM
Smartsheet Inc. SMAR 49.42$ 5,961$ 5,486$ 327$ (85)$ 16.8x 13.2x NM NM 27% NM
Square, Inc. SQ 162.55$ 72,096$ 72,064$ 7,652$ 86$ 12.2x 8.3x NM 141.6x 48% 6%
Twilio Inc. TWLO 247.09$ 36,618$ 35,410$ 1,545$ (219)$ 25.4x 19.9x NM 262.5x 28% 8%
Wix.com Ltd. WIX 254.85$ 14,047$ 13,503$ 911$ (121)$ 15.8x 12.3x NM 91.7x 28% 13%
Workday, Inc. WDAY 215.13$ 51,020$ 50,404$ 3,995$ 80$ 12.6x 11.0x NM 44.3x 15% 25%
Yext, Inc. YEXT 15.18$ 1,816$ 1,723$ 331$ (91)$ 5.2x 4.5x NM NM 17% NM
Zendesk, Inc. ZEN 102.92$ 11,880$ 11,729$ 976$ (62)$ 12.7x 10.5x NM 103.1x 21% 10%
Adjusted Mean 36,725$ 36,159$ 2,483$ 249$ 13.9x 12.7x 31.3x 31.4x 21% 18%
Median 13,315$ 12,952$ 814$ 6$ 16.8x 13.9x 78.5x 84.8x 20% 17%
Source: CapitalIQ
Note: Averages shown exclude EV/Revenue multiples exceeding 25x and exclude EV/ EBITDA multiples exceeding 50x
EV/ EBITDA MultiplesMarket Data ($ millions)
EV/ Revenue
Multiples

© 2020 Solganick & Co. All Rights Reserved. 34Software M&A Report – Q3 2020
Definitions and Disclosures
Definitions of Financial Terms Used in this Quarterly Industry UpdateEnterprise Value (EV): Market Value of Equity + Market Value of Debt – Cash
EBITDA: Earnings Before Interest, Taxes, Depreciation and Amortization
Latest Twelve Months (LTM): Financial information is as of the latest twelve months through the date of this quarterly industry report
Next Twelve Months (NTM): Financial information estimated for the next twelve-month time period, representing the mean of equity analyst expectations
Disclosures and LimitationsThis quarterly industry research report is for informational and discussion purposes only. Information presented herein is not investment adviceof any kind to any person and does not constitute a recommendation as to the purchase or sale of any securities nor interests or as to any othercourse of action. General, financial, and statistical information concerning the details of this report and related industry are from third partysources and direct research that Solganick & Co. believes to be reliable. Solganick & Co. has accurately reflected such information in this researchreport; however, Solganick & Co. makes no representation as to the sources’ accuracy or completeness and has accepted this informationwithout further verification. All forward looking statements in this report may not be achieved and thus there is no guarantee of such statements.
Neither all nor any part of the content of this report may be conveyed to the public through advertising, public relations, news, sales, mail, directtransmittal, or other media without the prior written consent of Solganick & Co. Solganick & Co.’s research is as of the date reported herein.Solganick & Co. has no direct client affiliation with any of the companies used as a basis for research in this report, nor does Solganick & Co. holdany investments in the companies listed herein. The content of this report may be used, in part, as a basis for any work that Solganick & Co.performs for you in the future at the sole discretion of Solganick & Co.


![Q3 FY16 Performance Update [Company Update]](https://img.dokumen.tips/doc/110x75/577ca52b1a28abea748b69f1/q3-fy16-performance-update-company-update.jpg)