Embed Size (px)
Citation preview
Software for Online Student Interaction
Marcelo Clerici-Arias Page 1 of 31 [email protected] January 5, 2000
Software for Online Student Interaction
Marcelo Clerici-Arias Introductory Economics Center
Department of Economics Stanford University
579 Serra Mall
Department of Economics Stanford, CA 94305
Email: [email protected]
Voice: (650) 725-8763 Fax: (650) 725-5702
Abstract: The Introductory Economics Center at Stanford University wants to improve the teaching and learning of economics through a wide range of methods. Among other things, we have focused on using technology to improve the delivery of information inside and outside of the classroom and to improve interaction among students and instructors in a large class setting. This paper concentrates on the online interaction of students partly aided by software we have developed at the Introductory Economics Center. This is a preliminary version, a set of notes written to accompany the poster presentation at the 2000 ASSA meetings. Please do not quote. If you are interested in learning more about the software or other things we do at the Introductory Economics Center, please contact the author.
Software for Online Student Interaction
Marcelo Clerici-Arias Page 2 of 31 [email protected] January 5, 2000
Overview
• = Introduction • = Online office hours
o Classification of online office hours o Conclusions
• = Online experiments o Online vs. classroom experiments o Free rider experiment o Expectations experiment o Classroom: Double oral auction experiment o Conclusions
• = Conclusions • = Figures • = Appendix A: manual and handout for free rider experiment • = Appendix B: manual and handout for expectations experiment • = Appendix C: manual for double oral auction • = Appendix D: useful weblinks and bibliography for technology • = Appendix E: useful weblinks and bibliography for experiments
Software for Online Student Interaction
Marcelo Clerici-Arias Page 3 of 31 [email protected] January 5, 2000
Introduction
Our experimentation with tools for online student interaction started thanks to the initiative of John Taylor, professor of economics at Stanford University and director of the Introductory Economics Center, and a grant from Stanford’s Center for Technology in Teaching and Learning. The work described here was started in mid-1997 by the author and John Taylor.Scott Kush participated in the first year of the project as a research assistant, jointly programming with the author the first version of the online experiments and helping set up the live webcast of online office hours. The author has remained involved in this area, developing the last two versions of the online experiments.
Online office hours We have tried different kinds of online office hours in Econ 1 at Stanford. 1. Chatroom This is the simplest kind of online office hours, where we installed a chat server and integrated a java applet into our website to create a chatroom for Econ 1. The chatroom was not always open; we specified one- or two-hour periods of time when the instructor would be available to answer questions and chat with the students. 2. Chatroom, audio/video and whiteboard (NetMeeting) We also tried installing an ILS (internet locator service) server and running office hours in NetMeeting. Having the whiteboard available was a big advantage because both students and instructors could draw graphs to aid their verbal explanations, but we were heavily limited by our big Macintosh population. We have discontinued using NetMeeting for that reason. 3. Audio/video live webcast with chatroom, combining physical and online office hours One quite successful form of online office hours has combined physical and virtual office hours. Students come to the instructor’s office hours, and they chat and ask questions as usual. The instructor and the students frequently use a physical whiteboard in the instructor’s office to draw economic graphs. Until now, we are describing traditional office hours. However, we have set up a video camera capturing everything that is drawn on the whiteboard and a microphone capturing everything said in the room. The video and audio signals are transmitted live on the internet and anyone can listen in and view what’s going on using the RealVideo plug-in in their web browser. Online communication works both ways: remote students can ask questions on a chatroom and the instructor sees them immediately as the office hours continue. The instructor can answer the questions orally and with the aid of the physical whiteboard, so both the on-site and remote students can listen to the explanation.
Software for Online Student Interaction
Marcelo Clerici-Arias Page 4 of 31 [email protected] January 5, 2000
4. Audio/video live webcast with chatroom and whiteboard The last step starts with the setup described in (3) and extends it with the use of an electronic whiteboard. These are designed to be purely online office hours, and we avoid the restriction of the Windows platform by using a java whiteboard. Conclusions The last two kinds of office hours seem to be the most successful. In the case of (3), the combination of physical and virtual office hours worked seamlessly and the students in the office did not seem to be negatively affected by the camera and the microphone. (Of course this setup was only used during open office hours and not during meetings with individual students.) The students not present in the office enjoyed the opportunity to listen in office hours and participate if they wanted to. Some students wanted to learn from other students’ questions and answers or did not want to miss anything that could be said during office hours. These students also mentioned that they appreciated that they could also view the online office hours asynchronously, hours, days or weeks after they had happened. In our experience, online office hours work better when they are short, focused, and usually associated with an upcoming evaluation.
Online experiments Online vs. classroom experiments Economics 1 at Stanford is a one-quarter course where we teach both micro and macroeconomics, so we can dedicate a limited amount of time to running experiments in the classroom. The author runs anywhere from two to four experiments each time he teaches principles of economics, and all instructors run at least one experiment per quarter. Given the nature of Econ 1 at Stanford, with over one thousand students a year and lecture halls with capacity for 600 people, time and size restrictions led us to look into conducting experiments online. Online experiments allow us to run more complex and time consuming experiments with a larger population of students, with participants in different physical locations. Online experiments are also good for data recording, either for pedagogical or research purposes, much more easily than in a classroom experiment. However, online experiments also have some disadvantages when compared to the more traditional classroom experiments. On the instructors’ side, online experiments require programming expertise or access to programmers, and software and support can prove to be much more expensive than classroom experiments. The different medium results in a different kind of experience and it may also cause some changes in the behavior of participants.
Software for Online Student Interaction
Marcelo Clerici-Arias Page 5 of 31 [email protected] January 5, 2000
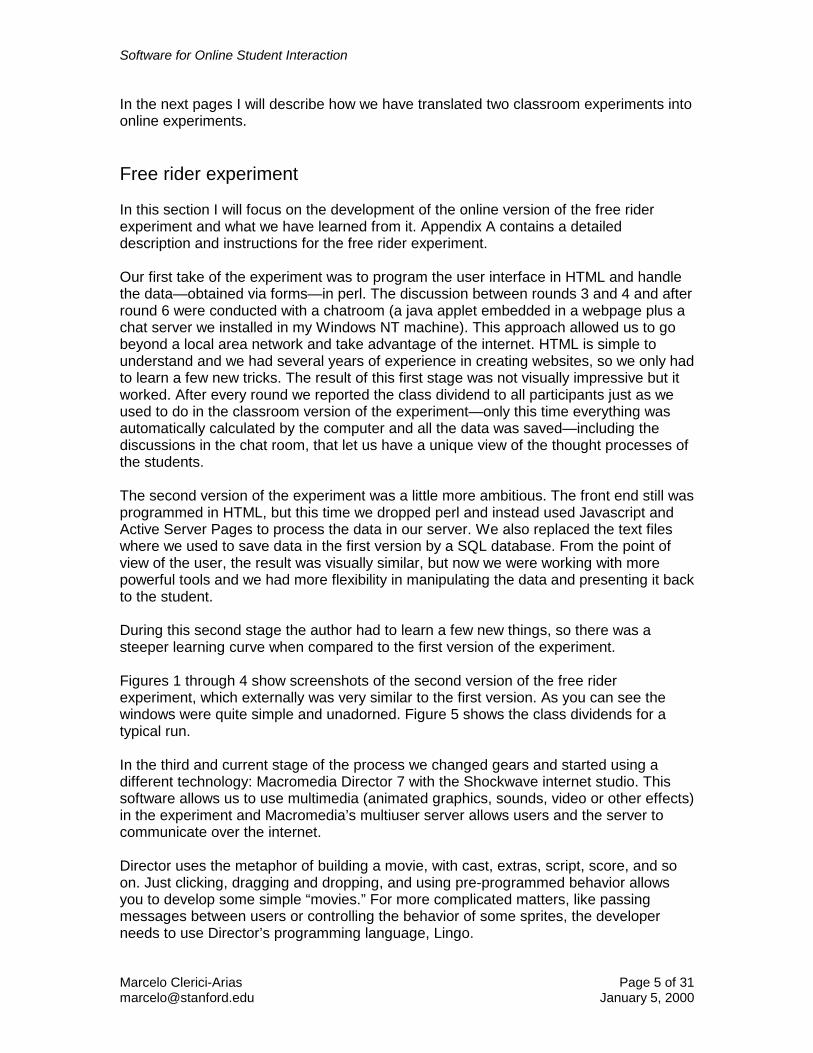
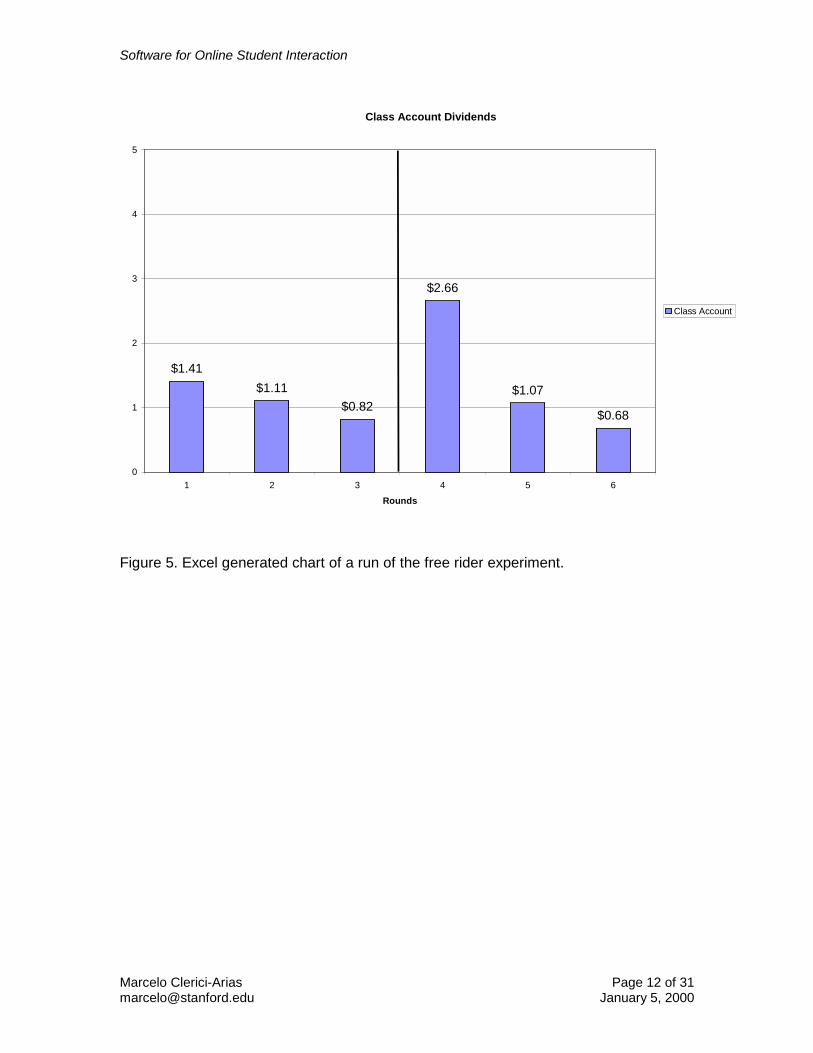
In the next pages I will describe how we have translated two classroom experiments into online experiments. Free rider experiment In this section I will focus on the development of the online version of the free rider experiment and what we have learned from it. Appendix A contains a detailed description and instructions for the free rider experiment. Our first take of the experiment was to program the user interface in HTML and handle the data—obtained via forms—in perl. The discussion between rounds 3 and 4 and after round 6 were conducted with a chatroom (a java applet embedded in a webpage plus a chat server we installed in my Windows NT machine). This approach allowed us to go beyond a local area network and take advantage of the internet. HTML is simple to understand and we had several years of experience in creating websites, so we only had to learn a few new tricks. The result of this first stage was not visually impressive but it worked. After every round we reported the class dividend to all participants just as we used to do in the classroom version of the experiment—only this time everything was automatically calculated by the computer and all the data was saved—including the discussions in the chat room, that let us have a unique view of the thought processes of the students. The second version of the experiment was a little more ambitious. The front end still was programmed in HTML, but this time we dropped perl and instead used Javascript and Active Server Pages to process the data in our server. We also replaced the text files where we used to save data in the first version by a SQL database. From the point of view of the user, the result was visually similar, but now we were working with more powerful tools and we had more flexibility in manipulating the data and presenting it back to the student. During this second stage the author had to learn a few new things, so there was a steeper learning curve when compared to the first version of the experiment. Figures 1 through 4 show screenshots of the second version of the free rider experiment, which externally was very similar to the first version. As you can see the windows were quite simple and unadorned. Figure 5 shows the class dividends for a typical run. In the third and current stage of the process we changed gears and started using a different technology: Macromedia Director 7 with the Shockwave internet studio. This software allows us to use multimedia (animated graphics, sounds, video or other effects) in the experiment and Macromedia’s multiuser server allows users and the server to communicate over the internet. Director uses the metaphor of building a movie, with cast, extras, script, score, and so on. Just clicking, dragging and dropping, and using pre-programmed behavior allows you to develop some simple “movies.” For more complicated matters, like passing messages between users or controlling the behavior of some sprites, the developer needs to use Director’s programming language, Lingo.
Software for Online Student Interaction
Marcelo Clerici-Arias Page 6 of 31 [email protected] January 5, 2000
I have found Director easy enough to use—at least, anyone who feels comfortable with the technology involved in versions 1 and 2 should feel more than comfortable with Director—and it allows the developer to create attractive, user friendly online experiments more easily than other technologies I have tested. The big disadvantage of this technology is its price. Even the academic version of Director 7 is expensive—$700. This purchase limits you to 50 simultaneous connections, though you can pay for additional connections. By comparison, you could program the first two versions of the free rider experiment for little or no money invested in software. Of course, there are non-monetary costs that have to be considered. We have an alpha version of this experiment ready which we will probably beta test this quarter. A final, stable version should be ready in the spring or summer. Adaptive and rational expectations experiment This experiment tries to simulate the formation of adaptive and rational expectations. Appendix B contains a detailed description and handouts with instructions. The expectations experiment involves two levels of interaction among students. First, small teams of students are playing the role of industrial sectors in a fictional economy, and teammates discuss their strategy privately, so we need independent means of communication for each industrial sector. Second, all players need to discuss the results at the end of the experiment, so we need something that allows everyone to chat. There is even a third level of communication: the messages sent from the instructor to every player and to each industrial sector. Players are also handling more information than in the free rider experiment. They have to consider historical data on inflation generated prior to the beginning of the experiment, plus after round 14 they also have to take into account data on changes in the money supply. Beyond the differences in the mechanics of the experiments, the technologies behind them are the same. We have developed versions of the expectations experiment for the first two technological stages, but we have not started porting it into Director. Double oral auction As a final example of an experiment, Appendix C contains the description of the well known double oral auction as we run it at Stanford. We have not created an online version of this experiment, but we have seen the Caltech version of an online market in action and it is quite impressive.
Software for Online Student Interaction
Marcelo Clerici-Arias Page 7 of 31 [email protected] January 5, 2000
Conclusions Online experiments are fun to develop and fun to play, but they are also costly. I think it would be very useful to research the differential impact on learning from online vs. classroom experiments and then do a cost-benefit analysis of these two approaches. I see at least two other areas of future work in online experiments for pedagogical purposes. First, the translation of other classroom experiments to online versions. Second, the creation of new experiments that cannot be run in the classroom because of their characteristics or complexity.
Software for Online Student Interaction
Marcelo Clerici-Arias Page 8 of 31 [email protected] January 5, 2000
Figure 1. Login window of free rider experiment, version 2. The first version was similar.
Software for Online Student Interaction
Marcelo Clerici-Arias Page 9 of 31 [email protected] January 5, 2000
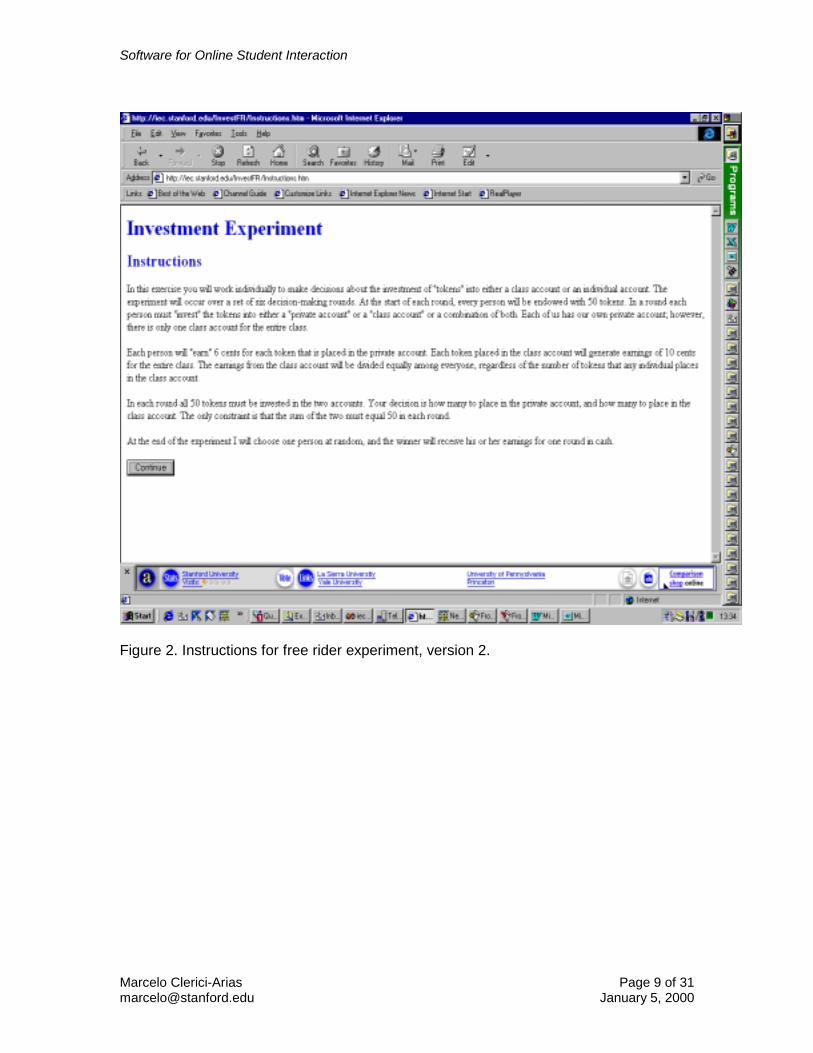
Figure 2. Instructions for free rider experiment, version 2.
Software for Online Student Interaction
Marcelo Clerici-Arias Page 10 of 31 [email protected] January 5, 2000
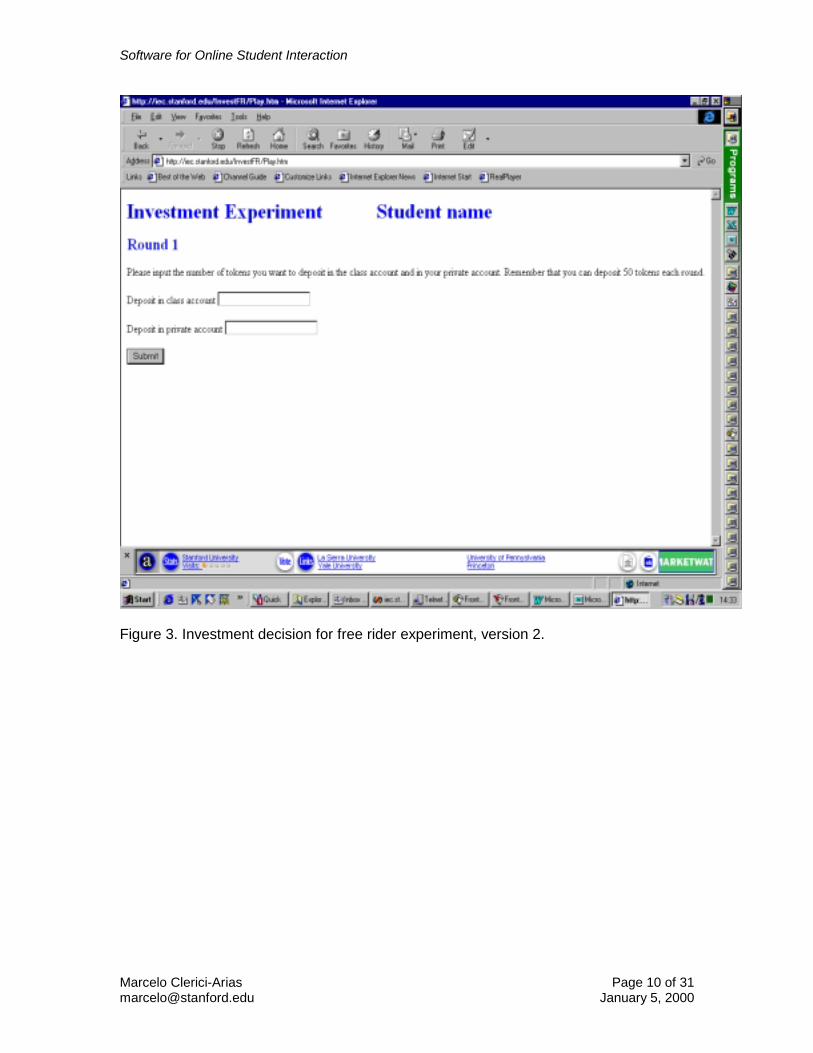
Figure 3. Investment decision for free rider experiment, version 2.
Software for Online Student Interaction
Marcelo Clerici-Arias Page 11 of 31 [email protected] January 5, 2000
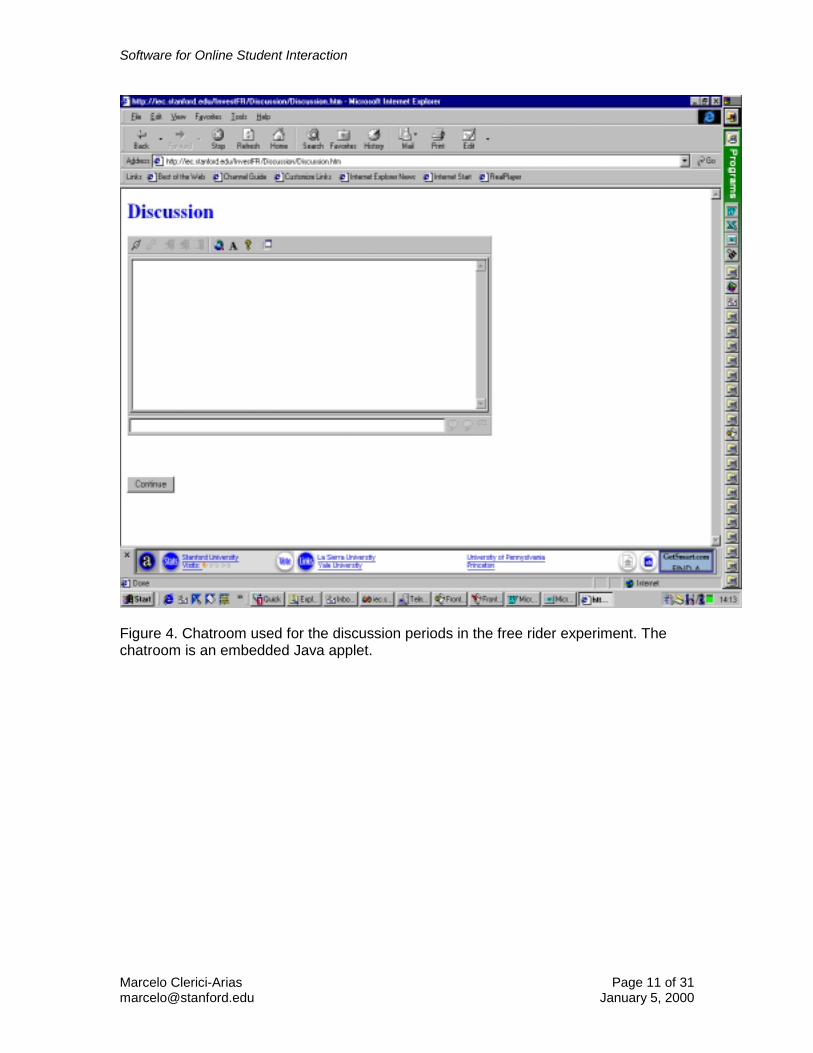
Figure 4. Chatroom used for the discussion periods in the free rider experiment. The chatroom is an embedded Java applet.
Software for Online Student Interaction
Marcelo Clerici-Arias Page 12 of 31 [email protected] January 5, 2000
Class Account Dividends
$1.41$1.11
$0.82
$2.66
$1.07
$0.68
0
1
2
3
4
5
1 2 3 4 5 6
Rounds
Class Account
Figure 5. Excel generated chart of a run of the free rider experiment.
Software for Online Student Interaction
Marcelo Clerici-Arias Page 13 of 31 [email protected] January 5, 2000
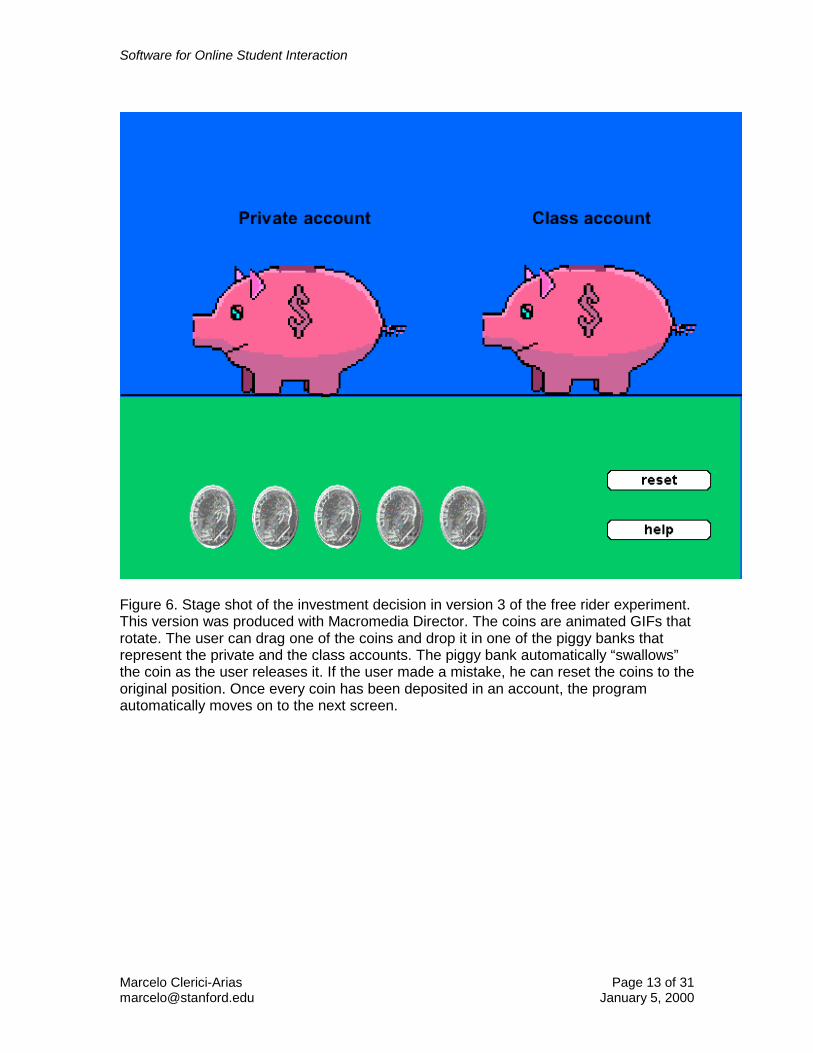
Figure 6. Stage shot of the investment decision in version 3 of the free rider experiment. This version was produced with Macromedia Director. The coins are animated GIFs that rotate. The user can drag one of the coins and drop it in one of the piggy banks that represent the private and the class accounts. The piggy bank automatically “swallows” the coin as the user releases it. If the user made a mistake, he can reset the coins to the original position. Once every coin has been deposited in an account, the program automatically moves on to the next screen.
Software for Online Student Interaction
Marcelo Clerici-Arias Page 14 of 31 [email protected] January 5, 2000
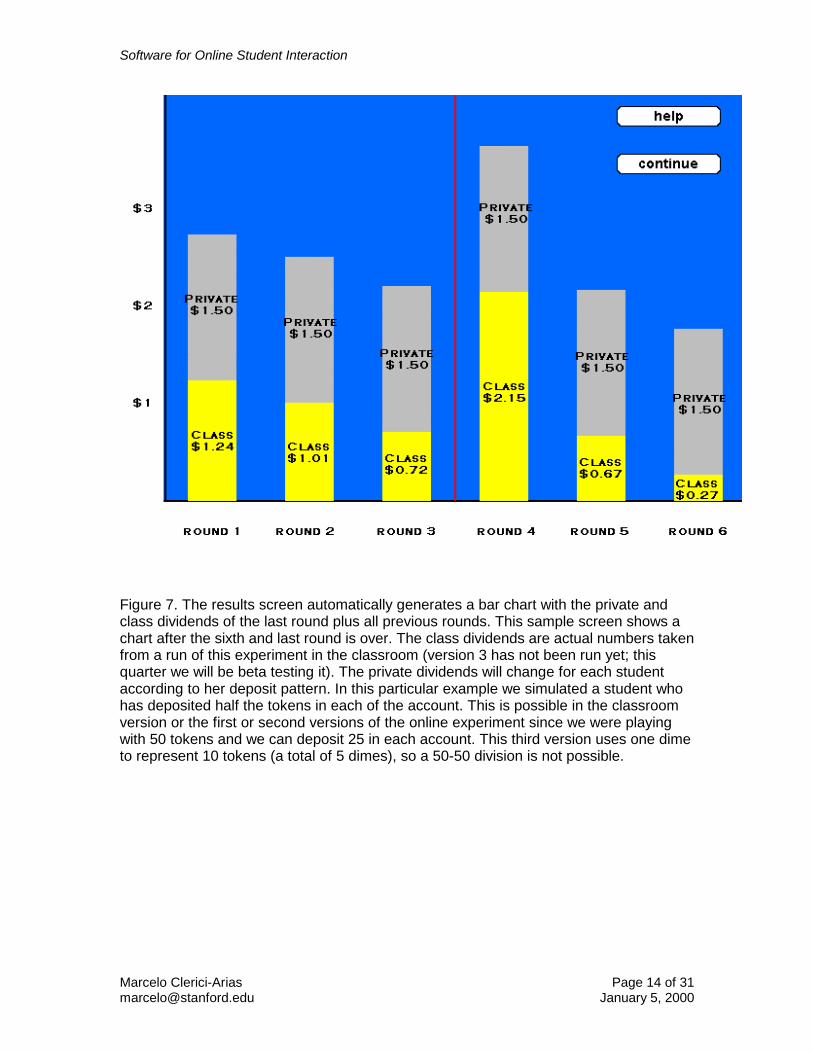
Figure 7. The results screen automatically generates a bar chart with the private and class dividends of the last round plus all previous rounds. This sample screen shows a chart after the sixth and last round is over. The class dividends are actual numbers taken from a run of this experiment in the classroom (version 3 has not been run yet; this quarter we will be beta testing it). The private dividends will change for each student according to her deposit pattern. In this particular example we simulated a student who has deposited half the tokens in each of the account. This is possible in the classroom version or the first or second versions of the online experiment since we were playing with 50 tokens and we can deposit 25 in each account. This third version uses one dime to represent 10 tokens (a total of 5 dimes), so a 50-50 division is not possible.
Software for Online Student Interaction
Marcelo Clerici-Arias Page 15 of 31 [email protected] January 5, 2000
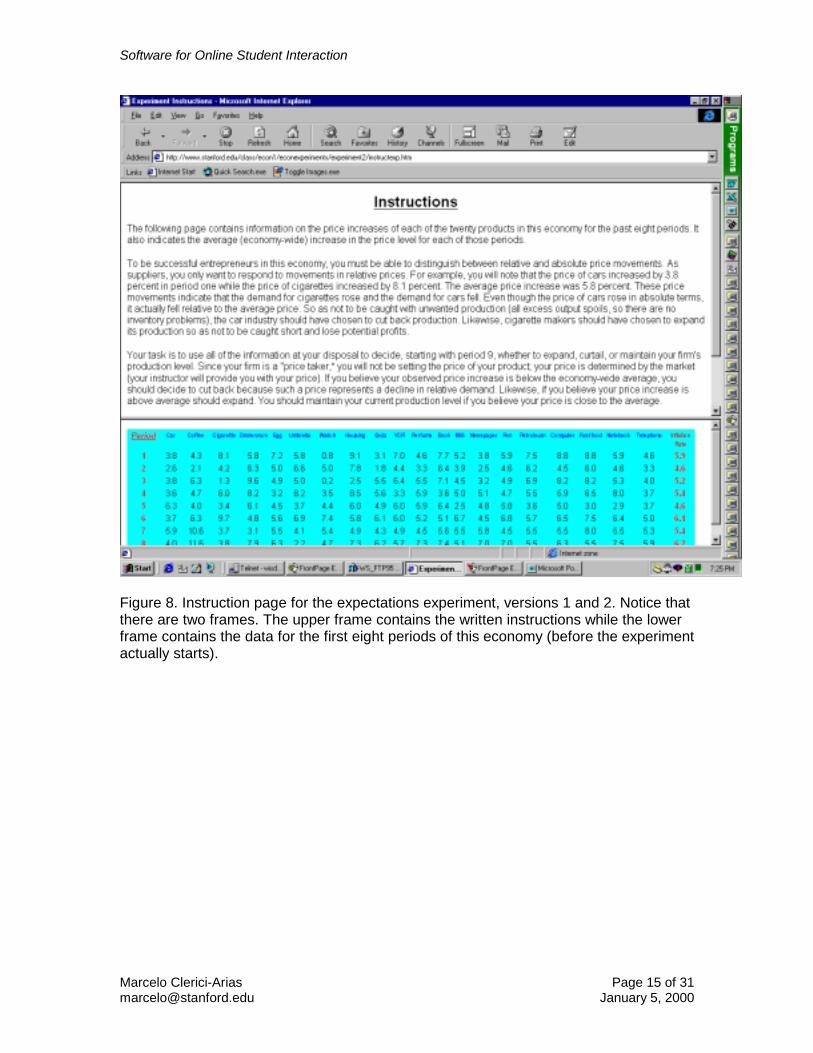
Figure 8. Instruction page for the expectations experiment, versions 1 and 2. Notice that there are two frames. The upper frame contains the written instructions while the lower frame contains the data for the first eight periods of this economy (before the experiment actually starts).
Software for Online Student Interaction
Marcelo Clerici-Arias Page 16 of 31 [email protected] January 5, 2000
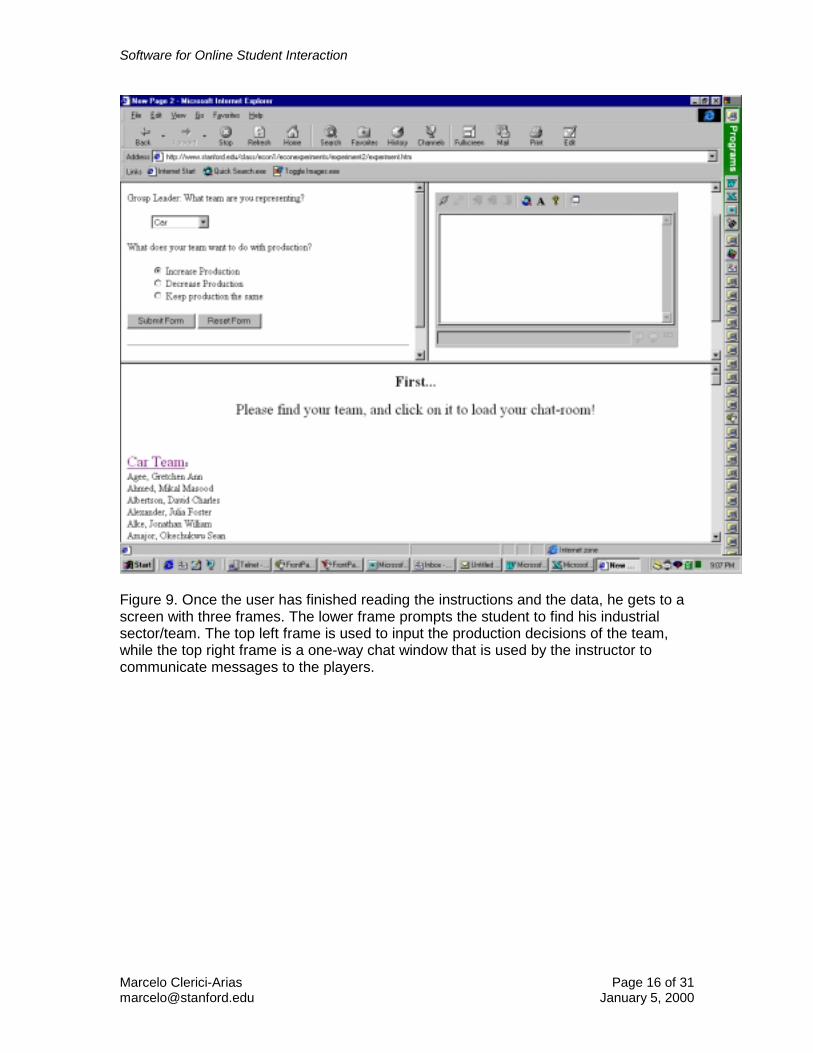
Figure 9. Once the user has finished reading the instructions and the data, he gets to a screen with three frames. The lower frame prompts the student to find his industrial sector/team. The top left frame is used to input the production decisions of the team, while the top right frame is a one-way chat window that is used by the instructor to communicate messages to the players.
Software for Online Student Interaction
Marcelo Clerici-Arias Page 17 of 31 [email protected] January 5, 2000
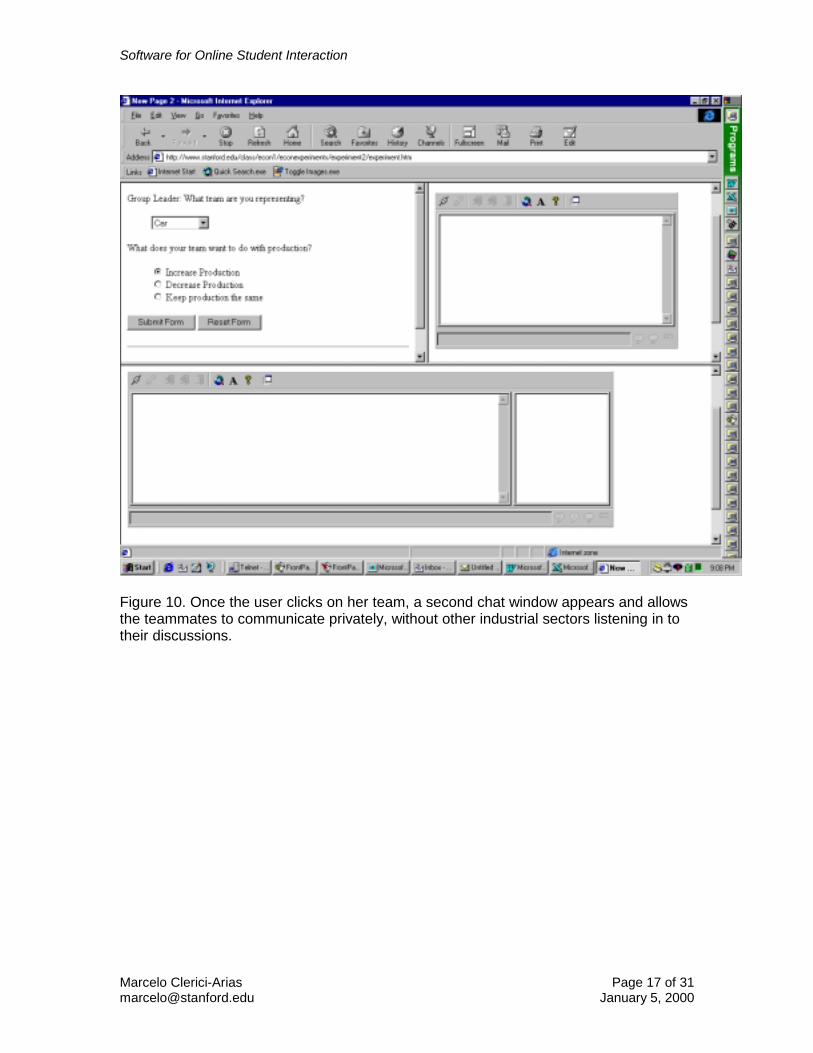
Figure 10. Once the user clicks on her team, a second chat window appears and allows the teammates to communicate privately, without other industrial sectors listening in to their discussions.
Software for Online Student Interaction
Marcelo Clerici-Arias Page 18 of 31 [email protected] January 5, 2000
Expectations Experiment
0
2
4
6
8
10
12
14
1 2 3 4 5 6 7 8 9 10 11 12 13 14 15 16 17 18 19 20Period
Incr
ease
(%)
InflationM
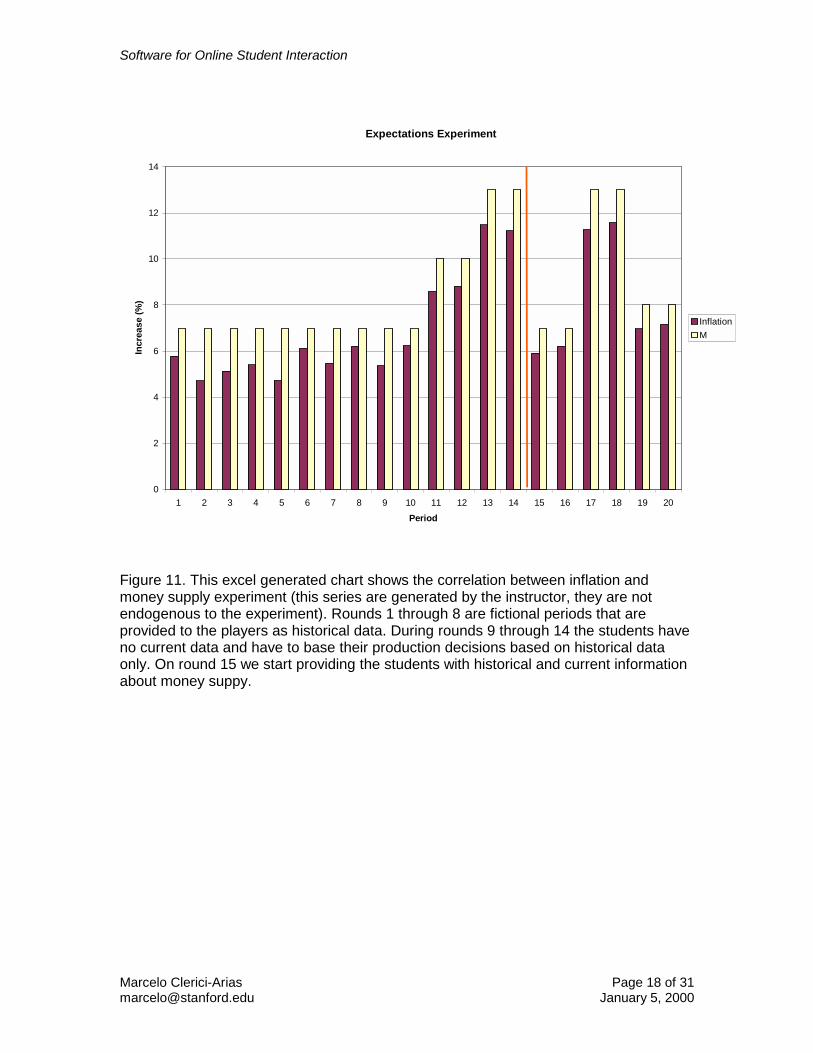
Figure 11. This excel generated chart shows the correlation between inflation and money supply experiment (this series are generated by the instructor, they are not endogenous to the experiment). Rounds 1 through 8 are fictional periods that are provided to the players as historical data. During rounds 9 through 14 the students have no current data and have to base their production decisions based on historical data only. On round 15 we start providing the students with historical and current information about money suppy.
Software for Online Student Interaction
Marcelo Clerici-Arias Page 19 of 31 [email protected] January 5, 2000
Appendix A: Free rider experiment in the classroom The following pages include a brief manual for the person conducting the experiment, a handout with instructions for the students, and a handout with cutout deposit slips that students use during the experiment. Free Riding Intended audience: students of Principles of Economics or Intermediate Microeconomics. This experiment works well both in small and large class settings. Keywords: free rider, public goods, prisoner’s dilemma, oligopoly. Requirements: • = Copies of handouts 1 and 2 (hard copies included) for all students. Mechanics: (1) In order to reduce possible biases, it is important that the experiment is not labeled
as a “free riding” or �public goods” experiment and that it be administered before any theoretical class on these topics. However, the experiment can be used even after students know about public goods, perhaps to illustrate the difficulties of reaching the socially optimal equilibrium despite the knowledge of it.
(2) Start the class by distributing one copy of handout 1 and ten copies of handout 2 per student and answer any questions relative to the mechanics of the experiment. Do not discuss optimal strategies.
(3) Students have one or two minutes to decide the allocation of their tokens and write it down in the first copy of handout 2.
(4) Collect the investment slips, compute the return of the class account, and report the result. Instruct students to calculate their own private returns. Individual decisions should not be made public, since it is important that students do not know their classmates decisions. Note: you may need the help of a teaching assistant or a student to calculate the return, while you answer questions. For a large lecture, you will need a small army of helpers to ensure a quick calculation of the class dividend.
(5) Play two more rounds, always reporting the return of the class account. By now you should have a sizable amount of free riding.
(6) At this point (right after the third round) you might want to leave the class for a few minutes and let the students talk about different strategies. When you come back, students might have planned a group response to increase their payoffs.
(7) Play another round. We expect free riding to be less, but it should still be there, since some students should realize that there is nothing keeping them from
Software for Online Student Interaction
Marcelo Clerici-Arias Page 20 of 31 [email protected] January 5, 2000
reneging on their promise to invest in the class account, and therefore have an even higher individual return.
(8) Play two more rounds, for a total of six. More and more students should free ride. (9) After the experiment is over, you can discuss the theoretical aspects of free riding,
and refer the students to the (usually) rich results of the experiment. Variations: • = The same experiment can be conducted with small groups as decision makers
instead of individuals. • = You can offer money proportional to their earnings or the earnings of a randomly
selected student for a randomly selected round. Some instructors offer extra credit points proportional to earnings, though I am not particularly fond of this procedure.
References: • = Jane Leuthold, “Free Rider Experiment for the Large Class,” Journal of Economic
Education. Fall 1993. • = Jim Barbour, “How to use the public foods experiment in the classroom: an
interactive session,” Eastern Economic Association meetings. Boston, March 1994.
Software for Online Student Interaction
Marcelo Clerici-Arias Page 21 of 31 [email protected] January 5, 2000
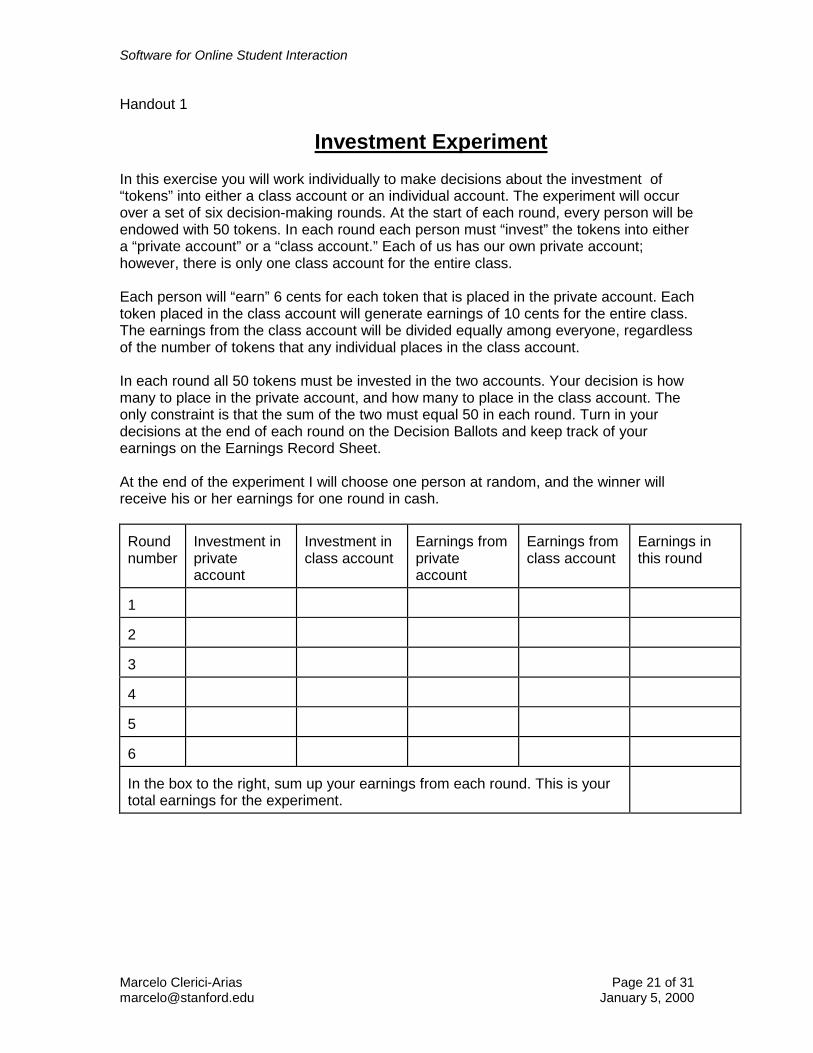
Handout 1 Investment Experiment In this exercise you will work individually to make decisions about the investment of “tokens” into either a class account or an individual account. The experiment will occur over a set of six decision-making rounds. At the start of each round, every person will be endowed with 50 tokens. In each round each person must “invest” the tokens into either a “private account” or a “class account.” Each of us has our own private account; however, there is only one class account for the entire class. Each person will “earn” 6 cents for each token that is placed in the private account. Each token placed in the class account will generate earnings of 10 cents for the entire class. The earnings from the class account will be divided equally among everyone, regardless of the number of tokens that any individual places in the class account. In each round all 50 tokens must be invested in the two accounts. Your decision is how many to place in the private account, and how many to place in the class account. The only constraint is that the sum of the two must equal 50 in each round. Turn in your decisions at the end of each round on the Decision Ballots and keep track of your earnings on the Earnings Record Sheet. At the end of the experiment I will choose one person at random, and the winner will receive his or her earnings for one round in cash. Round number
Investment in private account
Investment in class account
Earnings from private account
Earnings from class account
Earnings in this round
1
2
3
4
5
6
In the box to the right, sum up your earnings from each round. This is your total earnings for the experiment.
Software for Online Student Interaction
Marcelo Clerici-Arias Page 22 of 31 [email protected] January 5, 2000
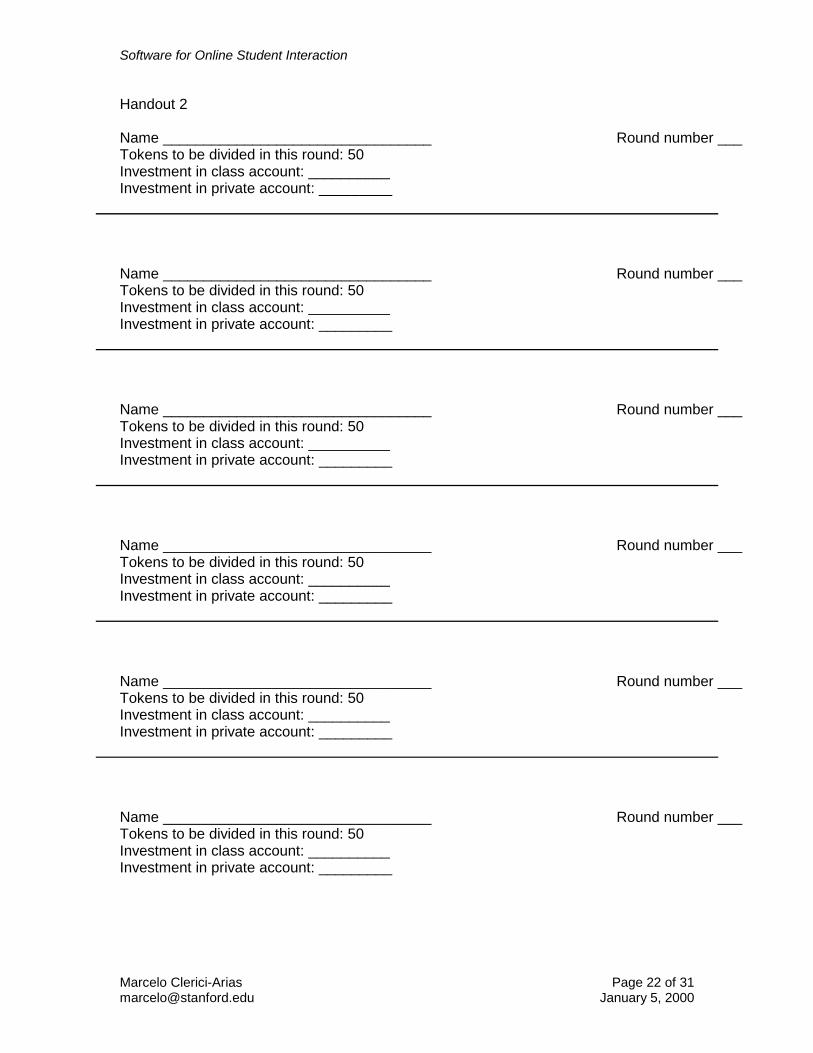
Handout 2 Name _________________________________ Round number ___ Tokens to be divided in this round: 50 Investment in class account: __________ Investment in private account: _________ Name _________________________________ Round number ___ Tokens to be divided in this round: 50 Investment in class account: __________ Investment in private account: _________ Name _________________________________ Round number ___ Tokens to be divided in this round: 50 Investment in class account: __________ Investment in private account: _________ Name _________________________________ Round number ___ Tokens to be divided in this round: 50 Investment in class account: __________ Investment in private account: _________ Name _________________________________ Round number ___ Tokens to be divided in this round: 50 Investment in class account: __________ Investment in private account: _________ Name _________________________________ Round number ___ Tokens to be divided in this round: 50 Investment in class account: __________ Investment in private account: _________
Software for Online Student Interaction
Marcelo Clerici-Arias Page 23 of 31 [email protected] January 5, 2000
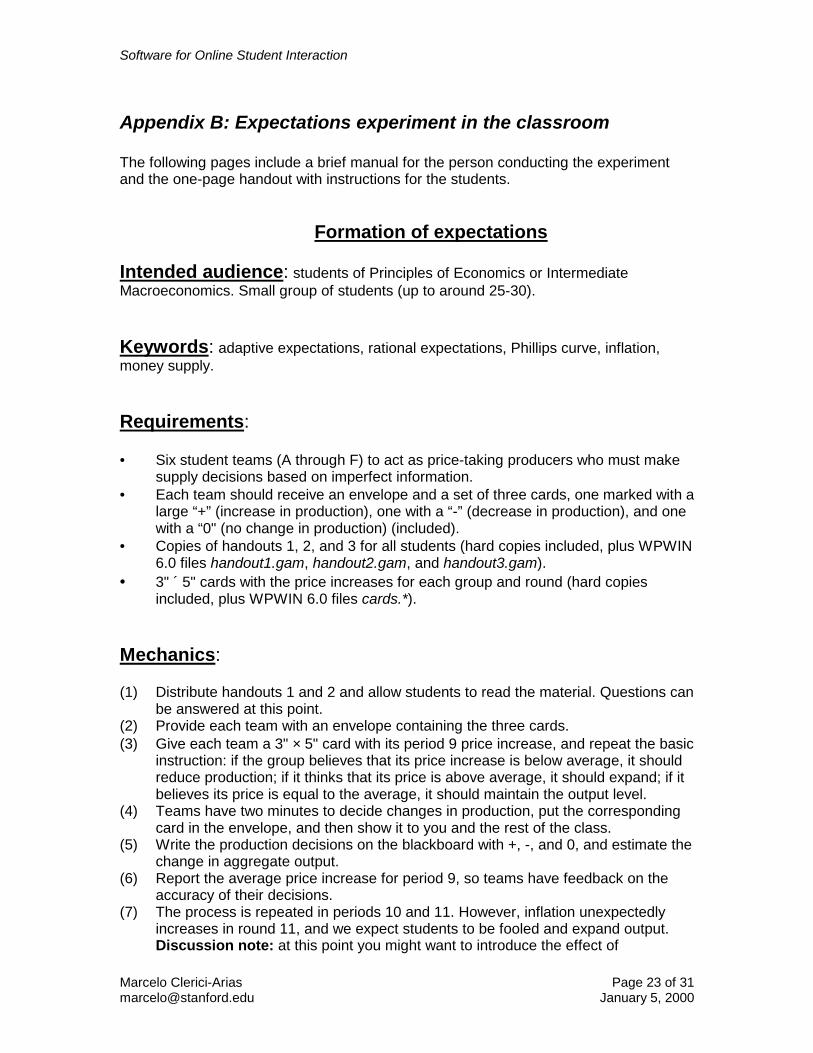
Appendix B: Expectations experiment in the classroom The following pages include a brief manual for the person conducting the experiment and the one-page handout with instructions for the students. Formation of expectations Intended audience: students of Principles of Economics or Intermediate Macroeconomics. Small group of students (up to around 25-30). Keywords: adaptive expectations, rational expectations, Phillips curve, inflation, money supply. Requirements: • = Six student teams (A through F) to act as price-taking producers who must make
supply decisions based on imperfect information. • = Each team should receive an envelope and a set of three cards, one marked with a
large “+” (increase in production), one with a “-” (decrease in production), and one with a “0" (no change in production) (included).
• = Copies of handouts 1, 2, and 3 for all students (hard copies included, plus WPWIN 6.0 files handout1.gam, handout2.gam, and handout3.gam).
• = 3" ´ 5" cards with the price increases for each group and round (hard copies included, plus WPWIN 6.0 files cards.*).
Mechanics: (1) Distribute handouts 1 and 2 and allow students to read the material. Questions can
be answered at this point. (2) Provide each team with an envelope containing the three cards. (3) Give each team a 3" × 5" card with its period 9 price increase, and repeat the basic
instruction: if the group believes that its price increase is below average, it should reduce production; if it thinks that its price is above average, it should expand; if it believes its price is equal to the average, it should maintain the output level.
(4) Teams have two minutes to decide changes in production, put the corresponding card in the envelope, and then show it to you and the rest of the class.
(5) Write the production decisions on the blackboard with +, -, and 0, and estimate the change in aggregate output.
(6) Report the average price increase for period 9, so teams have feedback on the accuracy of their decisions.
(7) The process is repeated in periods 10 and 11. However, inflation unexpectedly increases in round 11, and we expect students to be fooled and expand output. Discussion note: at this point you might want to introduce the effect of
Software for Online Student Interaction
Marcelo Clerici-Arias Page 24 of 31 [email protected] January 5, 2000
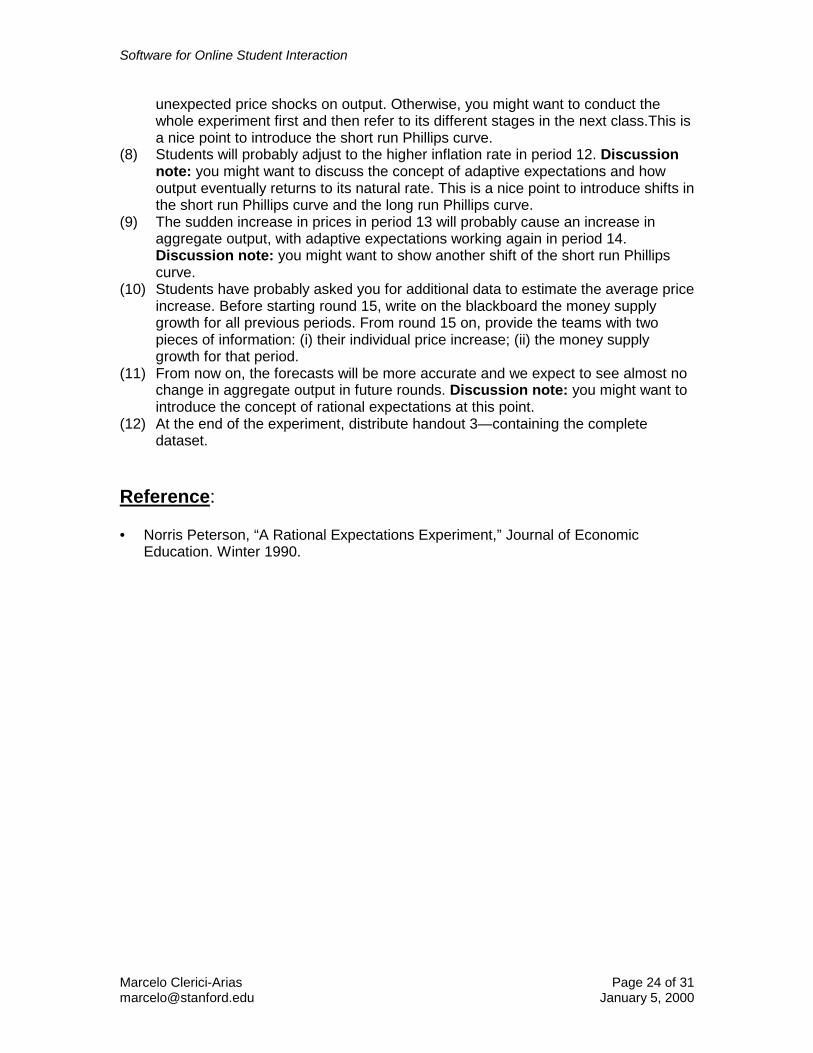
unexpected price shocks on output. Otherwise, you might want to conduct the whole experiment first and then refer to its different stages in the next class.This is a nice point to introduce the short run Phillips curve.
(8) Students will probably adjust to the higher inflation rate in period 12. Discussion note: you might want to discuss the concept of adaptive expectations and how output eventually returns to its natural rate. This is a nice point to introduce shifts in the short run Phillips curve and the long run Phillips curve.
(9) The sudden increase in prices in period 13 will probably cause an increase in aggregate output, with adaptive expectations working again in period 14. Discussion note: you might want to show another shift of the short run Phillips curve.
(10) Students have probably asked you for additional data to estimate the average price increase. Before starting round 15, write on the blackboard the money supply growth for all previous periods. From round 15 on, provide the teams with two pieces of information: (i) their individual price increase; (ii) the money supply growth for that period.
(11) From now on, the forecasts will be more accurate and we expect to see almost no change in aggregate output in future rounds. Discussion note: you might want to introduce the concept of rational expectations at this point.
(12) At the end of the experiment, distribute handout 3—containing the complete dataset.
Reference: • = Norris Peterson, “A Rational Expectations Experiment,” Journal of Economic
Education. Winter 1990.
Software for Online Student Interaction
Marcelo Clerici-Arias Page 25 of 31 [email protected] January 5, 2000
Handout 1: Instructions
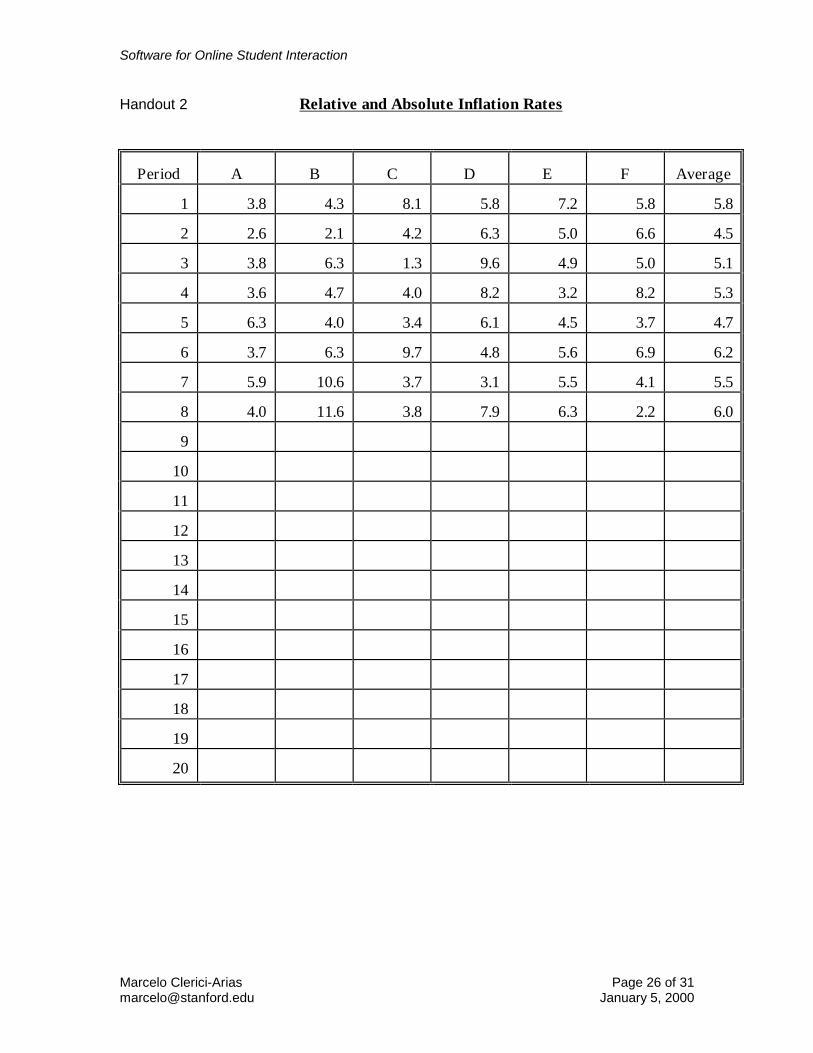
The following page contains information on the price increases of each of the six products in this economy for the past eight periods. It also indicates the average (economy-wide) increase in the price level for each of those periods. To be successful entrepreneurs in this economy, you must be able to distinguish between relative and absolute price movements. As suppliers, you only want to respond to movements in relative prices. For example, you will note that the price of firm A's product increased by 3.8 percent in period one while the price of firm C's product increased by 8.1 percent. The average price increase was 5.8 percent. Clearly these price movements indicate that the demand for product C rose and the demand for product A fell. Even though A's price rose in absolute terms, it actually fell relative to the average price. So as not to be caught with unwanted production (all excess output spoils, so there are no inventory problems), firm A should have chosen to cut back production. Likewise, C should have chosen to expand its production so as not to be caught short and lose potential profits. Your task is to use all of the information at your disposal to decide, starting with period 9, whether to expand, curtail, or maintain your firm's production level. Since your firm is a "price taker,” you will not be setting the price of your product; your price is determined by the market" (your instructor will provide you with your price). If you believe your observed price increase is below the economy-wide average, you should decide to cut back because such a price represents a decline in relative demand. Likewise, if you believe your price increase is above average should expand. You should maintain your current production level if you believe your price is close to the average. Signify expansion by selecting the "plus" card, contraction by the "minus" card, and maintenance of current output by the “zero” card. Sound too simple? There is a catch: Your instructor will give you the price increase for your product, but you will not be able to observe the average price level in any given period until the subsequent period. You will have to forecast it. As is evident from the table, inflation has averaged a little over 5 percent over the last eight periods. You may wish to use this history, or any other information your instructor may provide, as a guide in making your forecast.
Software for Online Student Interaction
Marcelo Clerici-Arias Page 26 of 31 [email protected] January 5, 2000
Handout 2 Relative and Absolute Inflation Rates
Period
A
B
C
D
E
F
Average
1
3.8
4.3
8.1
5.8
7.2
5.8
5.8
2
2.6
2.1
4.2
6.3
5.0
6.6
4.5
3
3.8
6.3
1.3
9.6
4.9
5.0
5.1
4
3.6
4.7
4.0
8.2
3.2
8.2
5.3
5
6.3
4.0
3.4
6.1
4.5
3.7
4.7
6
3.7
6.3
9.7
4.8
5.6
6.9
6.2
7
5.9
10.6
3.7
3.1
5.5
4.1
5.5
8
4.0
11.6
3.8
7.9
6.3
2.2
6.0
9
10
11
12
13
14
15
16
17
18
19
20

Software for Online Student Interaction
Marcelo Clerici-Arias Page 27 of 31 [email protected] January 5, 2000
Handout 3 Relative and Absolute Inflation Rates
Period
A
B
C
D
E
F
Average
M
1
3.8
4.3
8.1
5.8
7.2
5.8
5.8
7
2
2.6
2.1
4.2
6.3
5.0
6.6
4.5
7
3
3.8
6.3
1.3
9.6
4.9
5.0
5.1
7
4
3.6
4.7
4.0
8.2
3.2
8.2
5.3
7
5
6.3
4.0
3.4
6.1
4.5
3.7
4.7
7
6
3.7
6.3
9.7
4.8
5.6
6.9
6.2
7
7
5.9
10.6
3.7
3.1
5.5
4.1
5.5
7
8
4.0
11.6
3.8
7.9
6.3
2.2
6.0
7
9
6.8
6.5
5.9
2.4
7.2
2.3
5.2
7
10
10.1
6.9
3.8
2.9
5.8
7.1
6.1
7
11
5.7
6.8
6.4
11.1
8.4
10.3
8.1
10
12
7.2
6.1
8.5
7.0
10.6
10.0
8.2
10
13
10.8
9.0
13.9
14.1
8.6
12.7
11.5
13
14
10.7
10.2
13.5
15.6
9.0
8.1
11.2
13
15
6.9
1.0
5.1
9.0
4.9
6.4
5.6
7
16
4.1
6.1
2.3
8.0
5.7
6.8
5.5
7
17
11.7
9.3
7.8
8.3
12.4
13.8
10.6
13
18
7.8
10.2
8.6
10.0
12.4
16.6
10.9
13
19
4.6
8.5
3.8
6.8
6.1
4.5
5.7
8
20
3.6
4.5
0.7
5.7
11.2
8.1
5.6
8
Software for Online Student Interaction
Marcelo Clerici-Arias Page 28 of 31 [email protected] January 5, 2000
Appendix C: Double oral auction experiment in the classroom The following pages include a brief manual for the person conducting the experiment. The handouts for this experiment include two sets of instructions (one for the students playing the role of buyers, another one for the students playing the role of sellers), three sets of ten cards each, and a transaction record sheet, for a total of 35 pages. These materials are available in electronic form from the author upon request. Double Oral Auction Intended audience: students of Principles of Economics. Keywords: competitive markets, demand, supply, marginal cost, marginal utility, equilibrium price, double oral auction. Requirements: • = A minimum of 10 and a maximum of 20 participants (though a total of 40 students
could be accommodated by pairing them up). • = Copies of instructions to buyers (half the class) and sellers (half the class). Hard
copies included. • = One copy of the transactions record for you. A hard copy is included. • = Three sets of cards (one for buyers, one for sellers without tax, one for sellers with
tax). Hard copies are included. • = One assistant. Mechanics: (1) Distribute schedules and instructions as people enter the class. Be sure that you
have an equal number of buyers and sellers (buyers on one side of the room, sellers on the other). If there is an odd student, let him/her assist you by writing bids and asks on the blackboard. Note: please make sure you have 10 buyers and 10 sellers. If more students show up, have them pair up with another students (so, for example, two students would be just one buyer).
(2) Begin to read instructions five minutes into the class (otherwise you will not finish the experiment within a fifty-minute class period). Do not accept latecomers in the experiment.
(3) Answer questions regarding the mechanics of the experiment (not about strategies!) while your assistant distributes the cards to buyers and sellers. There is a letter on each card, and it is important that the cards be distributed in alphabetical order. Buyers’ cards have uppercase letters, while sellers’ cards have lowercase letters. There are two sets of sellers’ cards: with and without tax. The
Software for Online Student Interaction
Marcelo Clerici-Arias Page 29 of 31 [email protected] January 5, 2000
cards without tax should be distributed first (there is a small ‘T’ written by the seller’s letter of identification).
(4) Begin the practice round at about 10 minutes into the class, and end it 5 minutes later. You should conduct the auction while your assistant writes the asks and bids on the blackboard. You should keep the rate of bidding and asking at a slow enough pace so that both you and your assistant can keep up with it.
(5) Begin the second round (the first “real” one) and finish it after twelve minutes, or when there are no bids or asks for a couple of minutes—whatever comes first.
(6) After the second round, change the sellers’ cards without telling them that they are now being charged a $6 excise tax.
(7) Run the third round just as you ran the second one. (8) After the experiment is over, you can show your students what equilibrium price
and quantity were predicted by the theory and what happened in the auction. Show them the demand and supply schedules and the effects of the tax in the final round.
Variations: If the class is too big to allow the participation of all students, you could either select a group of students while the others observe, or you could defer the experiment to the weekly TA sections, that usually have 25 students or less. References: • = Peter Gray and Charles R. Plott, “Multiple Unit Oral Double Auction,” mimeo,
California Institute of Technology. • = Actual experiment done in Elementary Economics by John Taylor.
Software for Online Student Interaction
Marcelo Clerici-Arias Page 30 of 31 [email protected] January 5, 2000
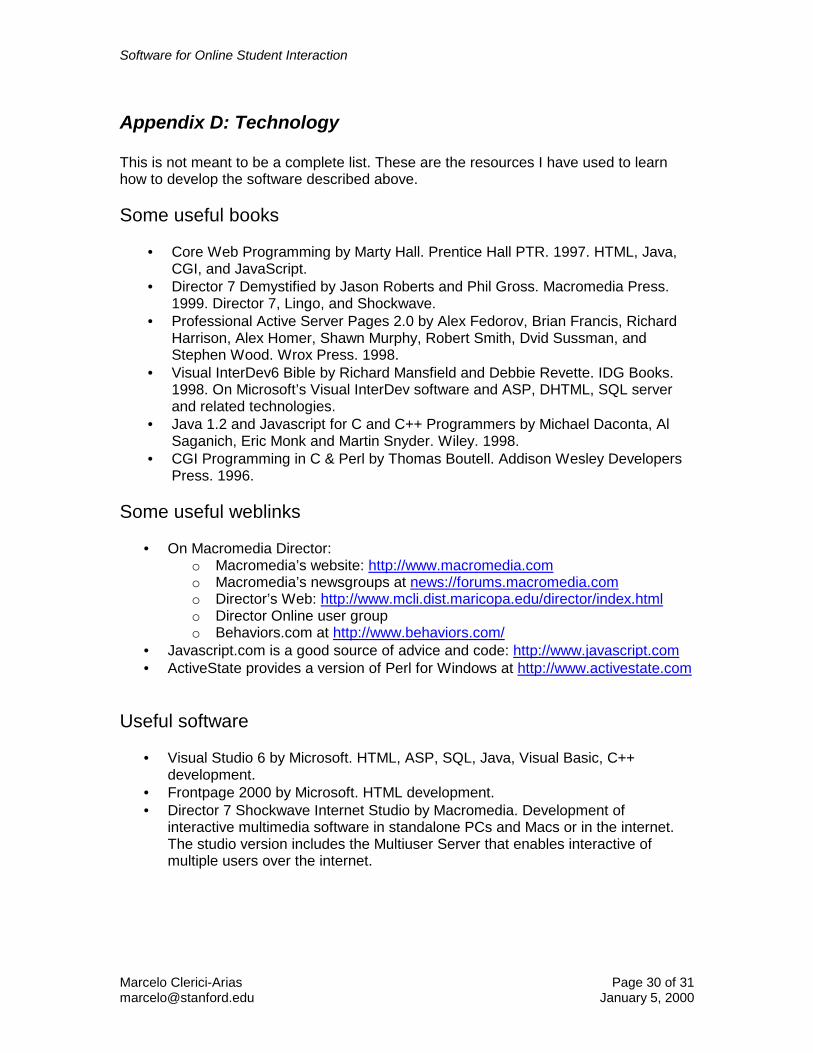
Appendix D: Technology This is not meant to be a complete list. These are the resources I have used to learn how to develop the software described above. Some useful books
• = Core Web Programming by Marty Hall. Prentice Hall PTR. 1997. HTML, Java, CGI, and JavaScript.
• = Director 7 Demystified by Jason Roberts and Phil Gross. Macromedia Press. 1999. Director 7, Lingo, and Shockwave.
• = Professional Active Server Pages 2.0 by Alex Fedorov, Brian Francis, Richard Harrison, Alex Homer, Shawn Murphy, Robert Smith, Dvid Sussman, and Stephen Wood. Wrox Press. 1998.
• = Visual InterDev6 Bible by Richard Mansfield and Debbie Revette. IDG Books. 1998. On Microsoft’s Visual InterDev software and ASP, DHTML, SQL server and related technologies.
• = Java 1.2 and Javascript for C and C++ Programmers by Michael Daconta, Al Saganich, Eric Monk and Martin Snyder. Wiley. 1998.
• = CGI Programming in C & Perl by Thomas Boutell. Addison Wesley Developers Press. 1996.
Some useful weblinks
• = On Macromedia Director: o Macromedia’s website: http://www.macromedia.com o Macromedia’s newsgroups at news://forums.macromedia.com o Director’s Web: http://www.mcli.dist.maricopa.edu/director/index.html o Director Online user group o Behaviors.com at http://www.behaviors.com/
• = Javascript.com is a good source of advice and code: http://www.javascript.com • = ActiveState provides a version of Perl for Windows at http://www.activestate.com
Useful software
• = Visual Studio 6 by Microsoft. HTML, ASP, SQL, Java, Visual Basic, C++ development.
• = Frontpage 2000 by Microsoft. HTML development. • = Director 7 Shockwave Internet Studio by Macromedia. Development of
interactive multimedia software in standalone PCs and Macs or in the internet. The studio version includes the Multiuser Server that enables interactive of multiple users over the internet.
Software for Online Student Interaction
Marcelo Clerici-Arias Page 31 of 31 [email protected] January 5, 2000
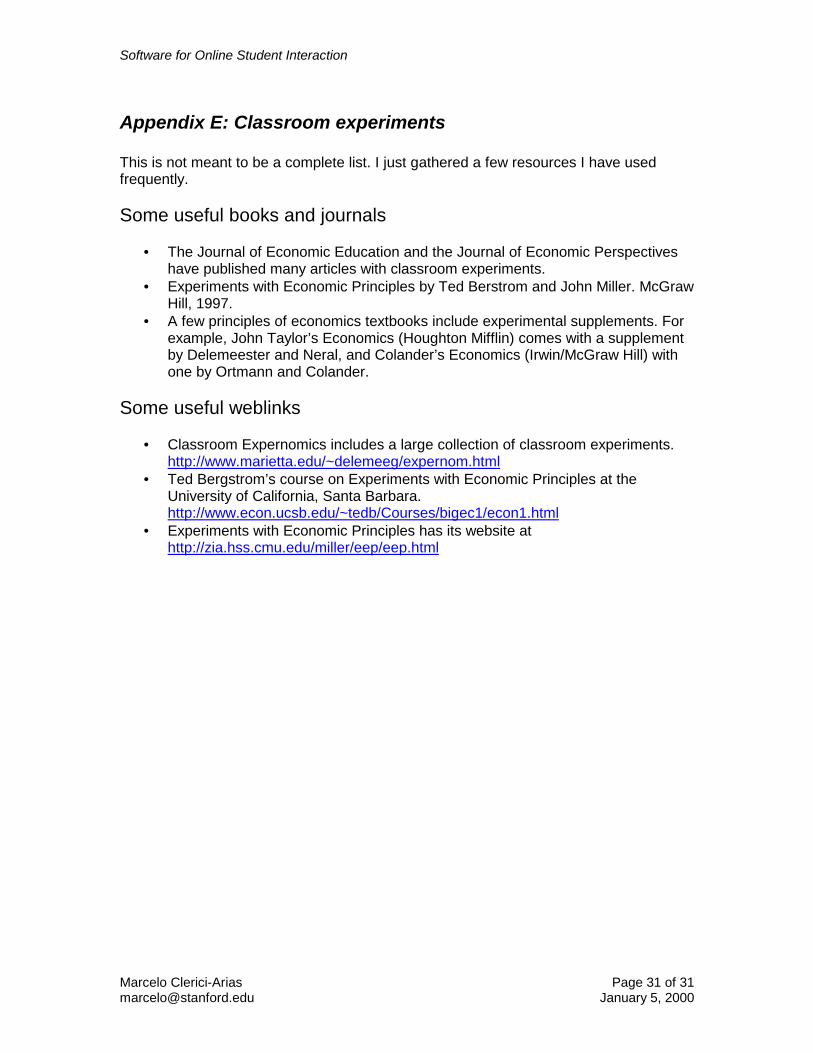
Appendix E: Classroom experiments This is not meant to be a complete list. I just gathered a few resources I have used frequently. Some useful books and journals
• = The Journal of Economic Education and the Journal of Economic Perspectives have published many articles with classroom experiments.
• = Experiments with Economic Principles by Ted Berstrom and John Miller. McGraw Hill, 1997.
• = A few principles of economics textbooks include experimental supplements. For example, John Taylor’s Economics (Houghton Mifflin) comes with a supplement by Delemeester and Neral, and Colander’s Economics (Irwin/McGraw Hill) with one by Ortmann and Colander.
Some useful weblinks
• = Classroom Expernomics includes a large collection of classroom experiments. http://www.marietta.edu/~delemeeg/expernom.html
• = Ted Bergstrom’s course on Experiments with Economic Principles at the University of California, Santa Barbara. http://www.econ.ucsb.edu/~tedb/Courses/bigec1/econ1.html
• = Experiments with Economic Principles has its website at http://zia.hss.cmu.edu/miller/eep/eep.html