Embed Size (px)
Citation preview
Software Effort/Cost Estimation
Lecture 7
Size and Cost Estimation
1
2
Overview
Different level of estimation
Project Evaluation
Introduction to Estimation
Size Estimation
Cost Estimation
3
Different level of estimation
Before decision to do a project
The estimation is coarse
The estimation is in high level terms
Profit? Good to the organization? etc.
After decision to go ahead
More detailed size and cost estimations are required
4
Project Evaluation
A high level assessment of the project
to see whether it is worthwhile to proceed with the project
to see whether the project will fit in the strategic planning of the whole organization
5
Project Evaluation - Why
Want to decide whether a project can proceed before it is too late
Want to decide which of the several alternative projects has a better success rate, a higher turnover, a higher ...
Is it desirable to carry out the development and operation of the software system?
6
Project Evaluation - Who
Senior management
Project manager/coordinator
Team leader
7
Project Evaluation - When
Usually at the beginning of the project
e.g. Step 0 of Step Wise Framework
8
Project Evaluation - What
Strategic assessment
Technical assessment
Economic assessment
9
Project Evaluation - How
Cost-benefit analysis
Cash flow forecasting
Cost-benefit evaluation techniques
Risk analysis
10
Strategic Assessment
Used to assess whether a project fits in the long-term goal of the organization
Usually carried out by senior management
Needs a strategic plan that clearly defines the objectives of the organization
Evaluates individual projects against the strategic plan or the overall business objectives
11
Strategic Assessment (cont‟d)
Programme management
suitable for projects developed for use in the organization
Portfolio management
suitable for project developed for other companies by software houses
12
SA – Programme Management
Individual projects as components of a programme within the organization
Programme as “a group of projects that are managed in a coordinated way to gain
benefits that would not be possible were the projects to be managed independently”
by D.C. Ferns
Journal of Project Management
Aug. 1991
13
SA – Programme Management Issues
Objectives
How does the project contribute to the long-term goal of the organization?
Will the product increase the market share? By how much?
14
SA – Programme Management Issues (cont‟d)
IS plan
Does the product fit into the overall IS plan?
How does the product relate to other existing systems?
15
SA – Programme Management Issues (cont‟d)
Organization structure
How does the product affect the existing organizational structure? the existing workflow? the overall business model?
16
SA – Programme Management Issues (cont‟d)
MIS
What information does the product provide?
To whom is the information provided?
How does the product relate to other existing MISs?
17
SA – Programme Management Issues (cont‟d)
Personnel
What are the staff implications?
What are the impacts on the overall policy on staff development?
Image
How does the product affect the image of the organization?
18
SA – Portfolio Management
suitable for product developed by a software company for an organization
may need to assess the product for the client organization Programme management issues apply
need to carry out strategic assessment for the providing software company
19
SA – Portfolio Management Issues
Long-term goal of the software company
The effects of the project on the portfolio of the company (synergies and conflicts)
Any added-value to the overall portfolio of the company
20
Technical Assessment
Functionality against hardware and software
The strategic IS plan of the organization
any constraints imposed by the IS plan
21
Economic Assessment
Why?
Consider whether the project is the best among other options
Prioritise the projects so that the resources can be allocated effectively if several projects are underway
22
Economic Assessment (cont‟d)
How?
Cost-benefit analysis
Cash flow forecasting
Various cost-benefit evaluation techniques
NPV and IRR
23
EA – Cost-benefit Analysis
A standard way to assess the economic benefits
Two steps
Identify and estimate all the costs and benefits of carrying out the project
Express the costs and benefits in a common unit for easy comparison (e.g. $)
24
EA – Cost-benefit Analysis (cont‟d)
Costs
Development costs
Setup costs
Operational costs
25
EA – Cost-benefit Analysis (cont‟d)
Benefits
Direct benefits
Assessable indirect benefits
Intangible benefits
26
EA – Cash Flow Forecasting
What?
Estimation of the cash flow over time
Why?
An excess of estimated benefits over the estimated costs is not sufficient
Need detailed estimation of benefits and costs versus time
27
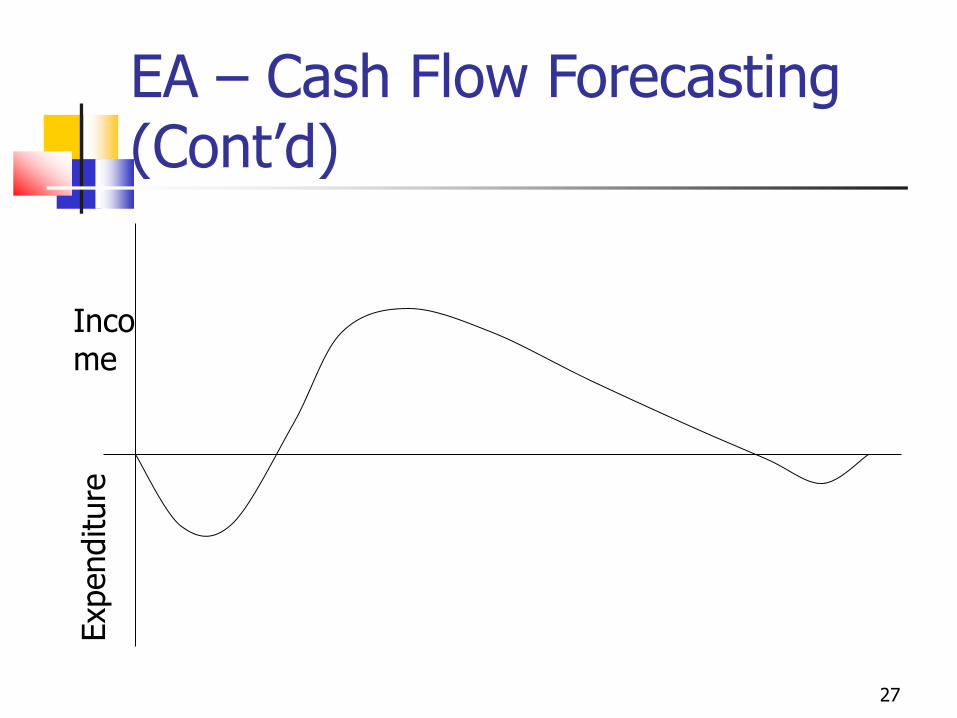
EA – Cash Flow Forecasting (Cont‟d)
Expenditure
Income
28
EA – Cash Flow Forecasting (Cont‟d)
Need to forecast the expenditure and the income
Accurate forecast is not easy
Need to revise the forecast from time to time
29
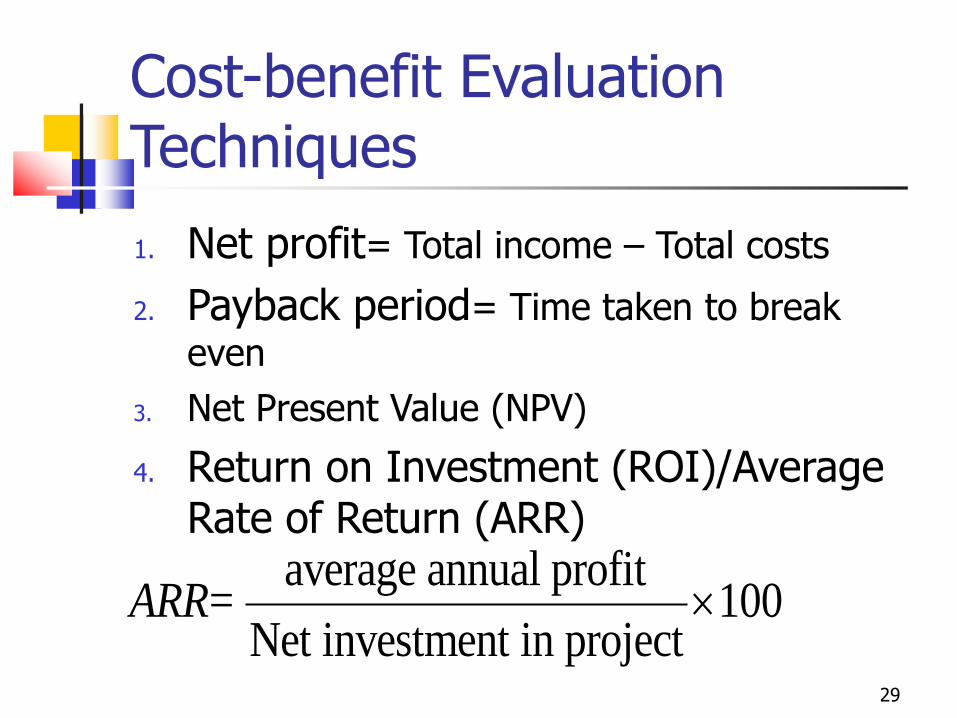
Cost-benefit Evaluation Techniques
1. Net profit= Total income – Total costs
2. Payback period= Time taken to break
even
3. Net Present Value (NPV)
4. Return on Investment (ROI)/Average Rate of Return (ARR)
average annual profit100
Net investment in projectARR=
30
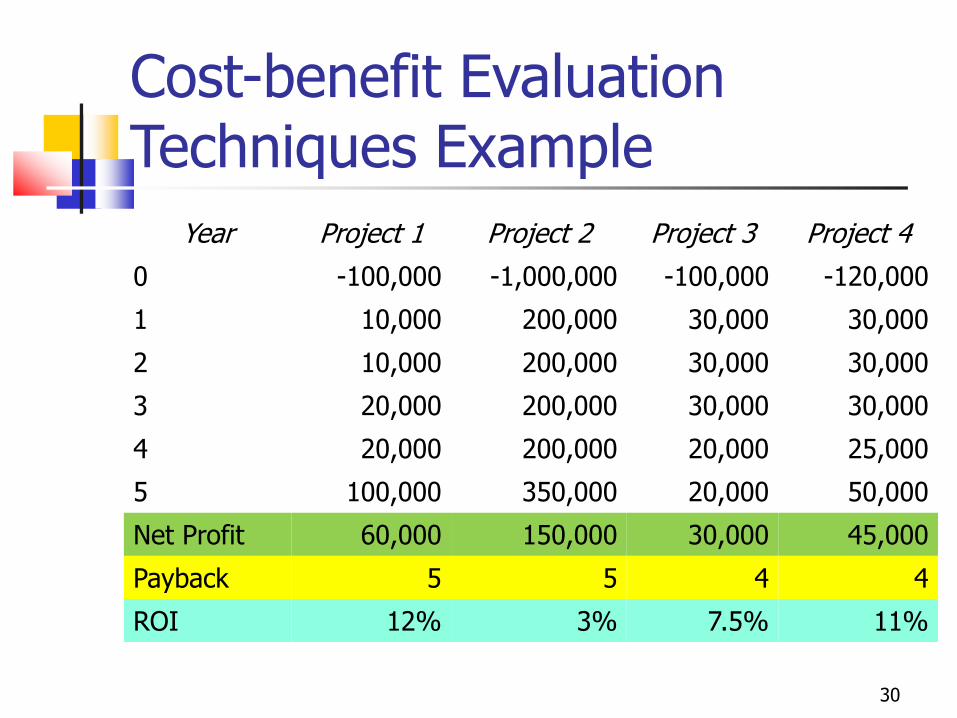
Cost-benefit Evaluation Techniques Example
Year Project 1 Project 2 Project 3 Project 4
0 -100,000 -1,000,000 -100,000 -120,000
1 10,000 200,000 30,000 30,000
2 10,000 200,000 30,000 30,000
3 20,000 200,000 30,000 30,000
4 20,000 200,000 20,000 25,000
5 100,000 350,000 20,000 50,000
Net Profit 60,000 150,000 30,000 45,000
Payback 5 5 4 4
ROI 12% 3% 7.5% 11%
Advantages/Disadvantages
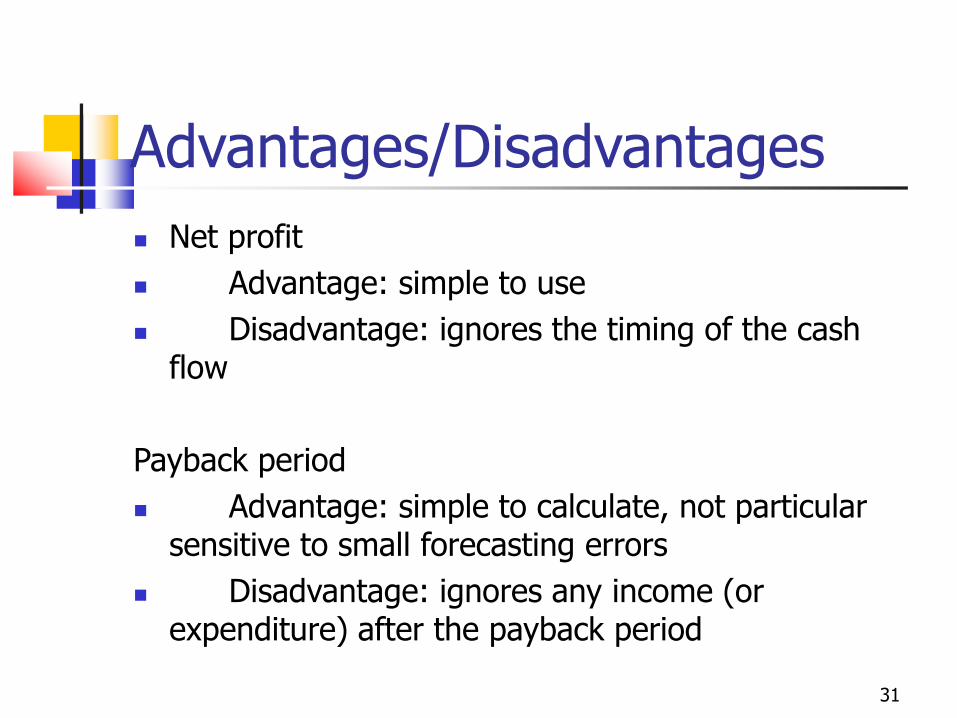
Net profit
Advantage: simple to use
Disadvantage: ignores the timing of the cash flow
Payback period
Advantage: simple to calculate, not particular sensitive to small forecasting errors
Disadvantage: ignores any income (or expenditure) after the payback period
31
Advantages/Disadvantages
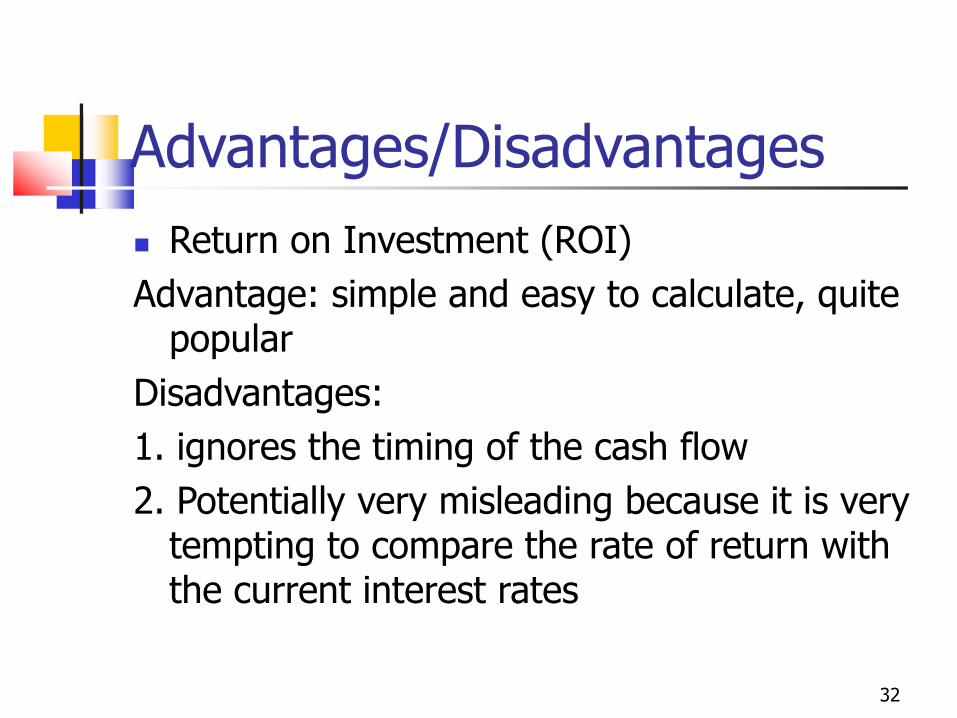
Return on Investment (ROI)
Advantage: simple and easy to calculate, quite popular
Disadvantages:
1. ignores the timing of the cash flow
2. Potentially very misleading because it is very tempting to compare the rate of return with the current interest rates
32
33
Cost-benefit Evaluation Techniques – Net Present Value
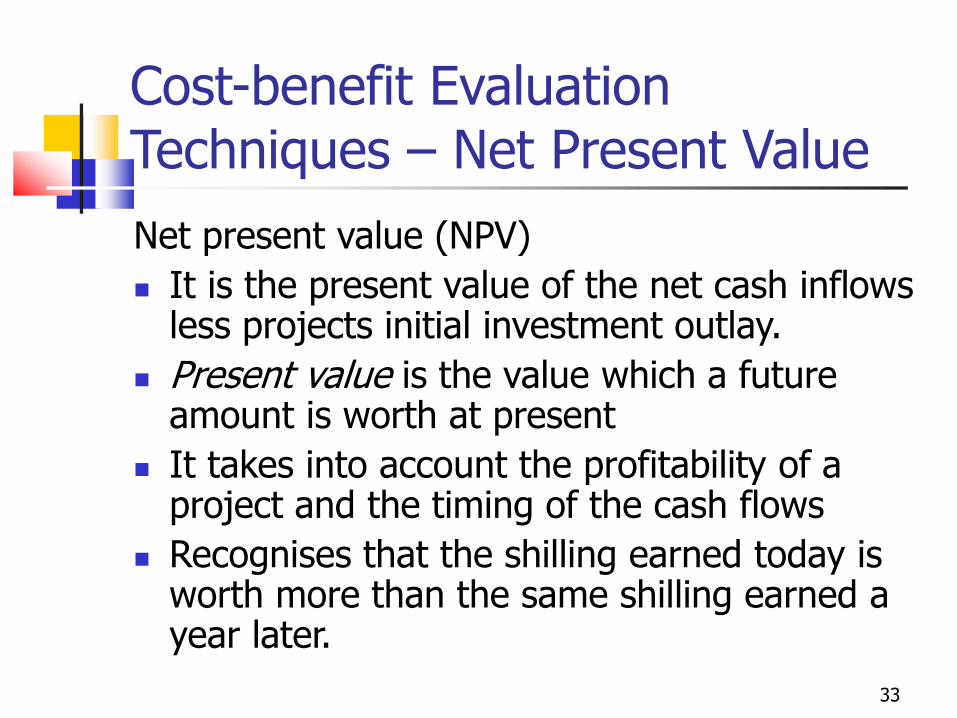
Net present value (NPV)
It is the present value of the net cash inflows less projects initial investment outlay.
Present value is the value which a future amount is worth at present
It takes into account the profitability of a project and the timing of the cash flows
Recognises that the shilling earned today is worth more than the same shilling earned a year later.
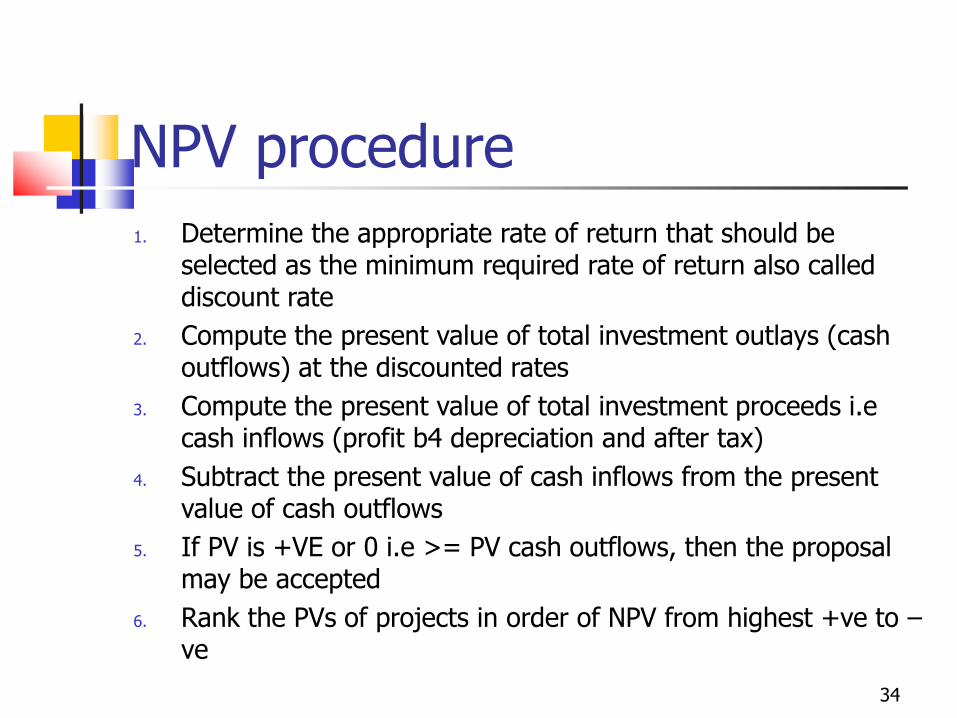
NPV procedure
1. Determine the appropriate rate of return that should be selected as the minimum required rate of return also called discount rate
2. Compute the present value of total investment outlays (cash outflows) at the discounted rates
3. Compute the present value of total investment proceeds i.e cash inflows (profit b4 depreciation and after tax)
4. Subtract the present value of cash inflows from the present value of cash outflows
5. If PV is +VE or 0 i.e >= PV cash outflows, then the proposal may be accepted
6. Rank the PVs of projects in order of NPV from highest +ve to –ve
34
35
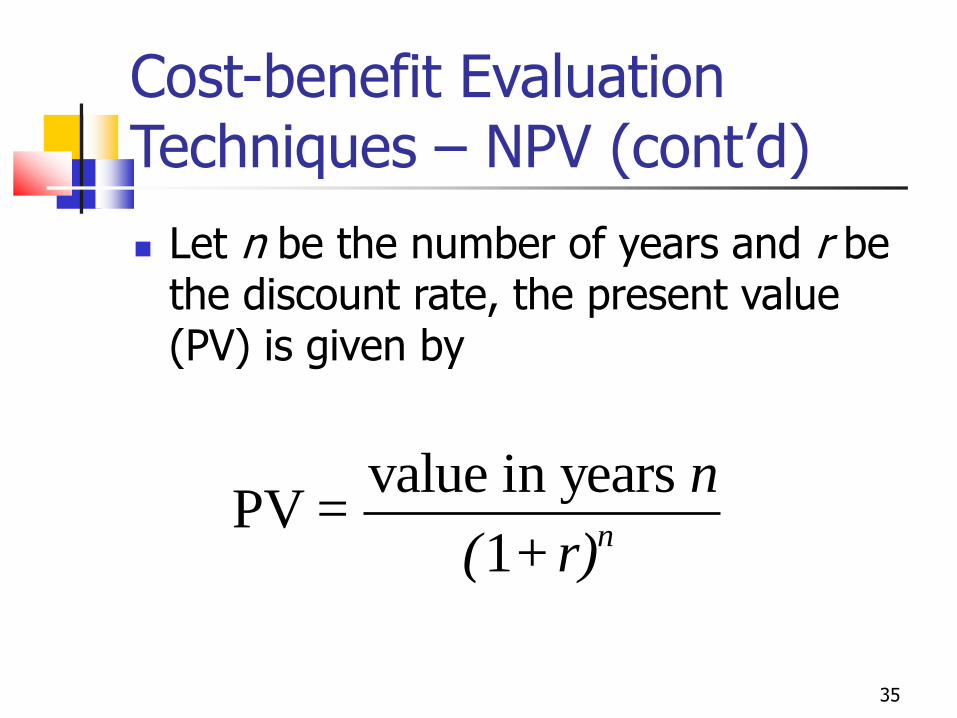
Cost-benefit Evaluation Techniques – NPV (cont‟d)
Let n be the number of years and r be the discount rate, the present value (PV) is given by
value in years PV
1 n
n=
( +r)
36
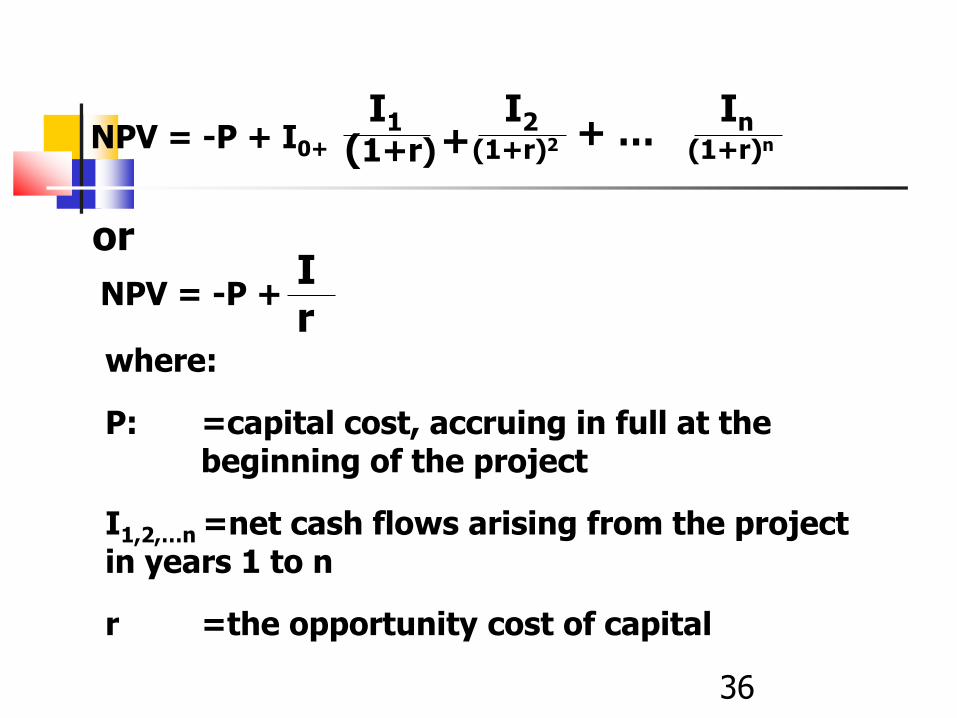
NPV = -P + I0+ I1
(1+r)
I2 (1+r)2 + … +
In (1+r)n
NPV = -P + I r
where:
P: =capital cost, accruing in full at the beginning of the project
I1,2,…n =net cash flows arising from the project in years 1 to n
r =the opportunity cost of capital
or
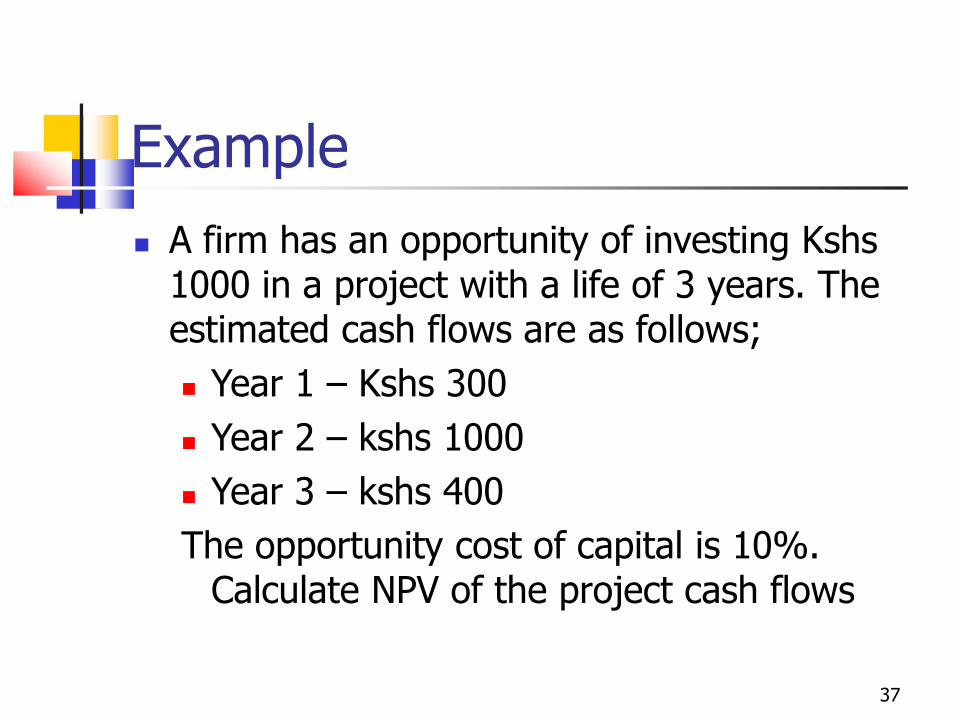
Example
A firm has an opportunity of investing Kshs 1000 in a project with a life of 3 years. The estimated cash flows are as follows;
Year 1 – Kshs 300
Year 2 – kshs 1000
Year 3 – kshs 400
The opportunity cost of capital is 10%. Calculate NPV of the project cash flows
37
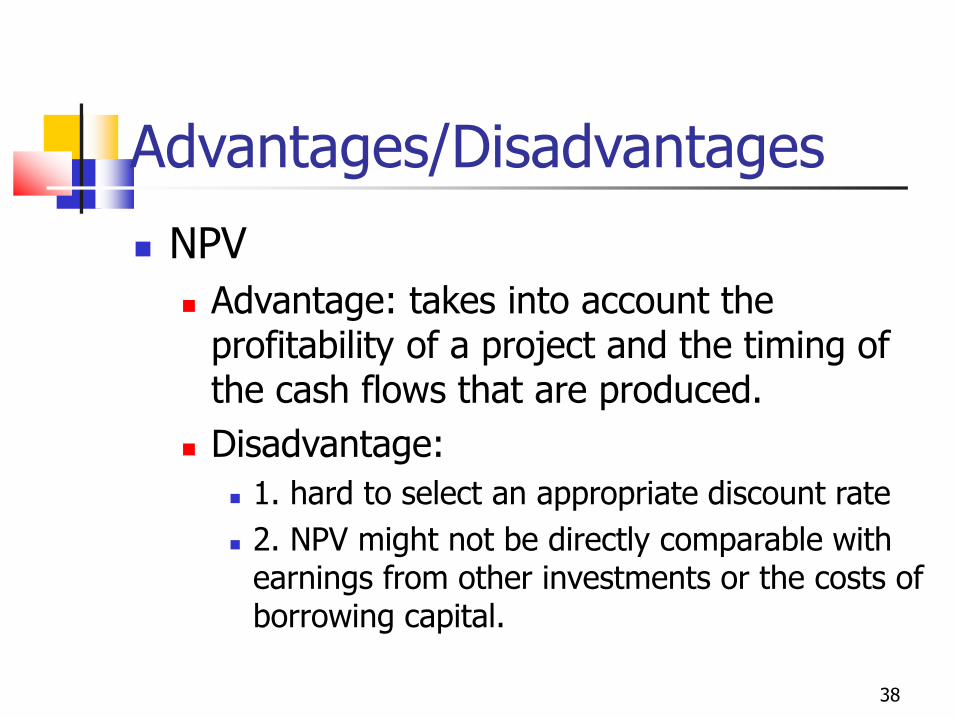
Advantages/Disadvantages
NPV
Advantage: takes into account the profitability of a project and the timing of the cash flows that are produced.
Disadvantage:
1. hard to select an appropriate discount rate
2. NPV might not be directly comparable with earnings from other investments or the costs of borrowing capital.
38
39
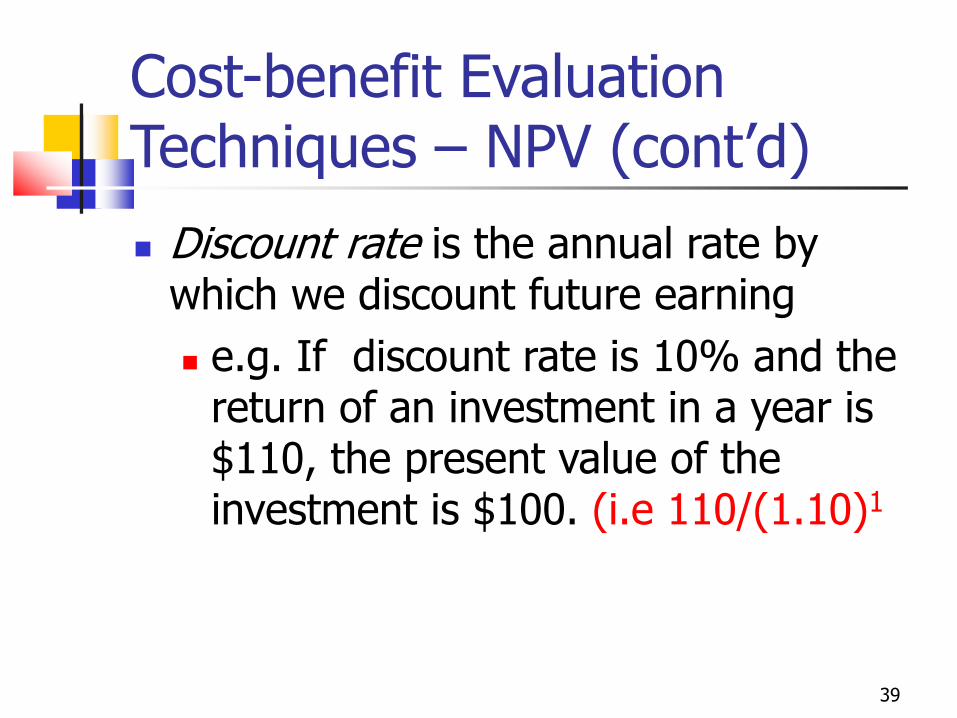
Cost-benefit Evaluation Techniques – NPV (cont‟d)
Discount rate is the annual rate by which we discount future earning
e.g. If discount rate is 10% and the return of an investment in a year is $110, the present value of the investment is $100. (i.e 110/(1.10)1
40
Cost-benefit Evaluation Techniques – NPV (cont‟d)
Issues with NPV
Choosing an appropriate discount rate is difficult
Ensuring that the rankings of projects are not sensitive to small changes in discount rate
41
Cost-benefit Evaluation Techniques – NPV (cont‟d)
Guidelines:
Use the standard rate prescribed by the organization
Use interest rate + premium rate
Use a target rate of return
Rank the projects using various discount rates
42
Cost-benefit Evaluation Techniques – IRR
Internal Rate of Return (IRR) The percentage discount rate that would produce
an NPV of zero
Internal rate of return (IRR) is the rate of return that will equate the present value of a multi-year cash flow with the cost of investing in a project.
IRR is a break-even discount rate
Using the NPV equation: the IRR is the discount rate that renders the NPV of the project equal to zero.
P, n and the expected future cash returns (I) are
known, we try to find IRR.
If the IRR is greater than the market rate of interest
r, it implies that the present value of the capital
good (PV) is greater than its purchase price (P) and
the firm should invest. Conversely, if IRR is smaller
than r, it implies that PV is smaller than P and the
firm should not invest.
What are the differences between NPV
technique and IRR method?
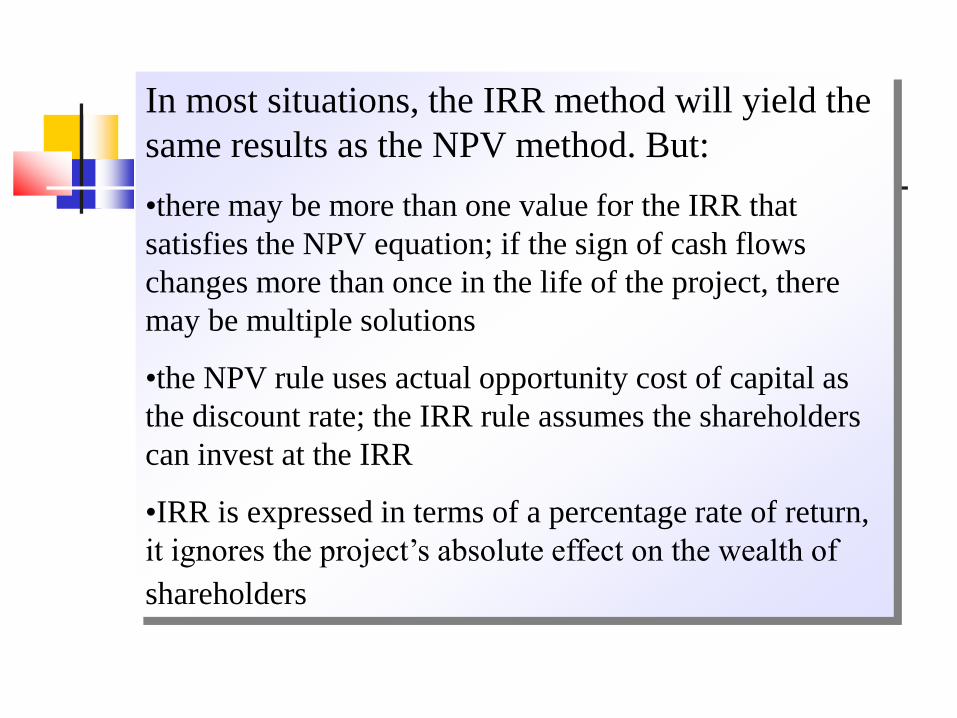
In most situations, the IRR method will yield the
same results as the NPV method. But:
•there may be more than one value for the IRR that
satisfies the NPV equation; if the sign of cash flows
changes more than once in the life of the project, there
may be multiple solutions
•the NPV rule uses actual opportunity cost of capital as
the discount rate; the IRR rule assumes the shareholders
can invest at the IRR
•IRR is expressed in terms of a percentage rate of return,
it ignores the project’s absolute effect on the wealth of
shareholders
45
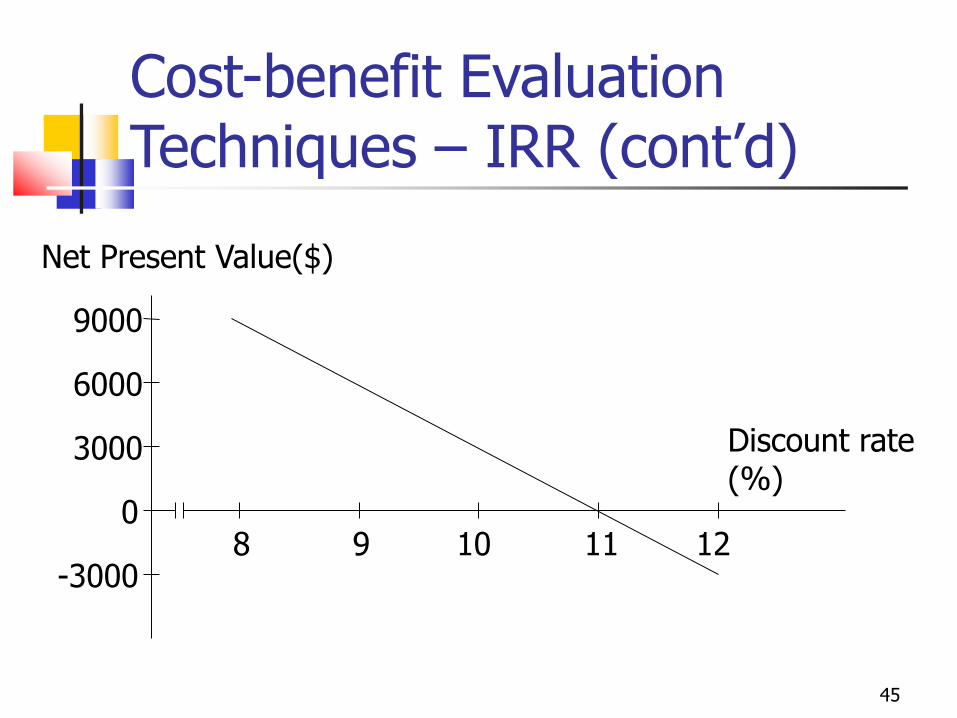
Cost-benefit Evaluation Techniques – IRR (cont‟d)
11 9 8 -3000
3000
6000
9000
12 10
Discount rate (%)
Net Present Value($)
0
46
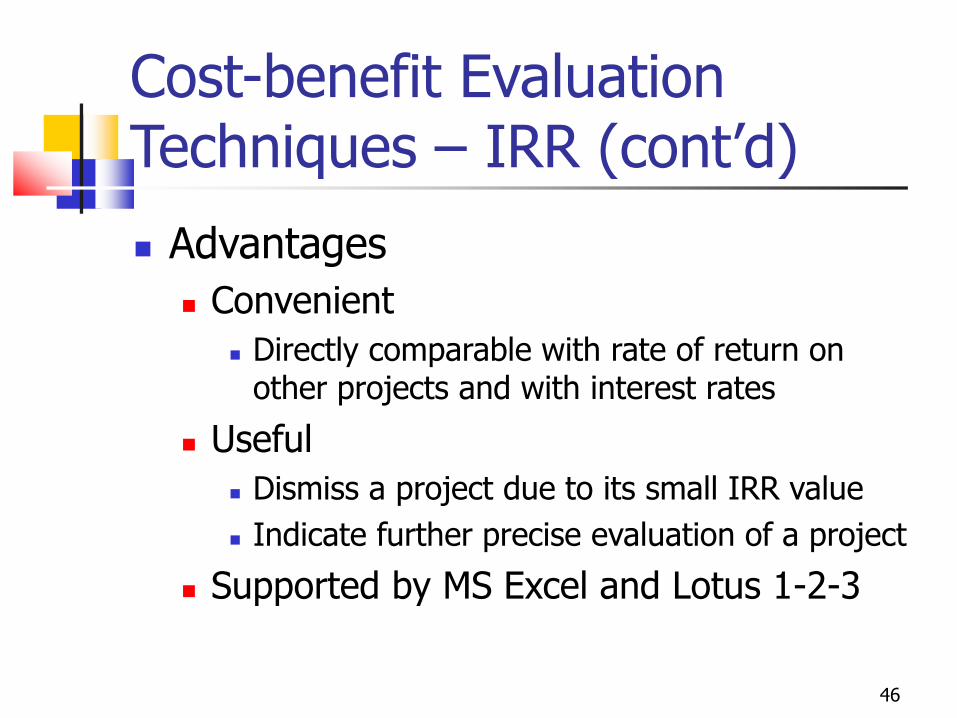
Cost-benefit Evaluation Techniques – IRR (cont‟d)
Advantages
Convenient
Directly comparable with rate of return on other projects and with interest rates
Useful
Dismiss a project due to its small IRR value
Indicate further precise evaluation of a project
Supported by MS Excel and Lotus 1-2-3
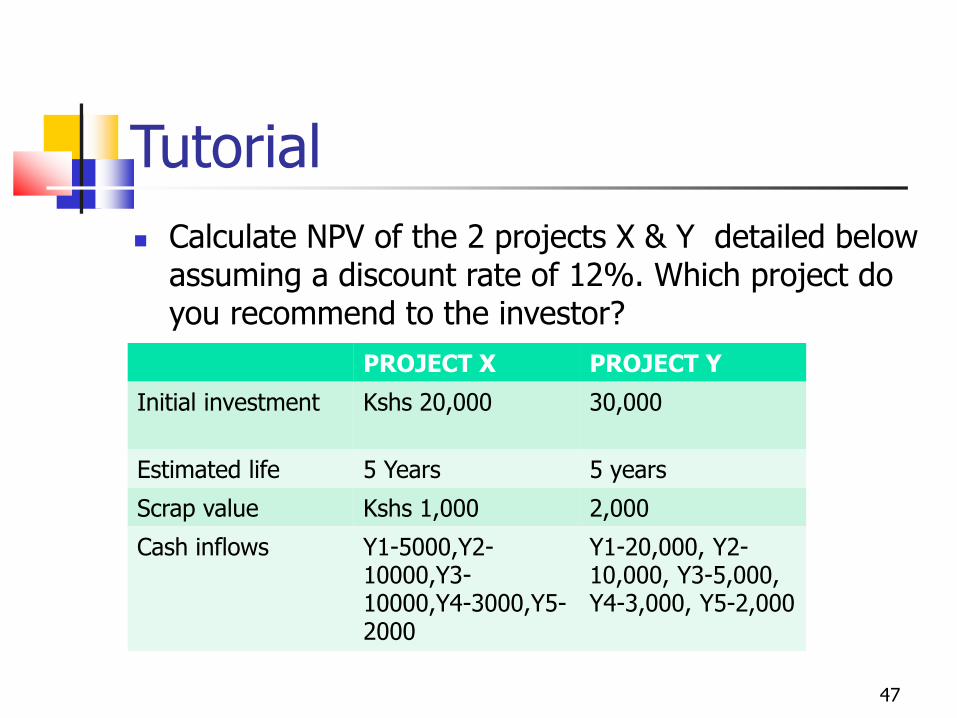
Tutorial
Calculate NPV of the 2 projects X & Y detailed below assuming a discount rate of 12%. Which project do you recommend to the investor?
47
PROJECT X PROJECT Y
Initial investment Kshs 20,000 30,000
Estimated life 5 Years 5 years
Scrap value Kshs 1,000 2,000
Cash inflows Y1-5000,Y2-10000,Y3-10000,Y4-3000,Y5-2000
Y1-20,000, Y2-10,000, Y3-5,000, Y4-3,000, Y5-2,000
48
Software Effort Estimation
Why? – to define the project budget and to „refine‟ the product to realize the budget
Who? – the manager
What? – size and cost
When? – always
How? – techniques and models
49
Issues related to Estimation
Difficult to make accurate estimation
Better to have previous data and analyze the actual values against their estimates so that you know how accurate you are
Even better to have previous data of the whole organization so that you know how accurate the estimation method, if any, used within the organization is
50
Positive Attitude Towards Estimation
Use your estimation as a guide to manage your project
From time to time, you need to revise your estimation based on the current status of the project
51
Estimation Approaches
Expert judgement Ask the knowledgeable experts
Estimation by analogy Use the data of a similar and completed
project
Pricing to win Use the price that is low enough to win the
contract
52
Estimation Approaches (cont‟d)
Top-down
An overall estimate is determined and then broken down into each component task
Bottom-up
The estimates of each component task are aggregated to form the overall estimate
Algorithmic model
Estimation is based on the characteristics of the product and the development environment.
53
Size Estimation
Problems related to size estimation
Size Estimation Model
Function Point Analysis (FPA)
54
Problems related to size estimation
Nature of software
Novel application of software
Fast changing technology
Lack of homogeneity of project experience
Subjective nature of estimation
Political implications within the organization
55
Function Point Analysis (FPA)
Developed by A. Albrecht in IBM
Aim: To estimate the LOC of a system
LOC (Line of Code) of system
= FP of system × LOC-per-FP of the
language
56
Function Point Analysis (cont‟d)
Idea: Software system consists of five major components (or, external user types) External input types
External output types
Logical internal file types
External interface file types
External inquiry types
External user types
External input types
Input transactions that update internal computer files
External output types
Transactions that output data to user such as report printing.
Logical internal file types
The standing file used by the system.
File: a group of data that is usually accessed together. It may have one or more record types. Example: A PurchaseOrder may contain one or more PurchaseItems.
57
External user types cont‟
External interface file types
Input and output that may pass from and to other computer applications.
Files shared among applications would also be counted.
Example: the transmission of accounting data from an order processing system to the main ledger system.
External inquiry types
Transactions initiated by the user that provide information but do not update the internal files.
58
59
Function Point Analysis - Steps
Identify each instance of each external user type in the proposed system
Classify each instance as having high, medium or low complexity
Assign the FP of each instance
FP of the system = sum of FP of individual components
60
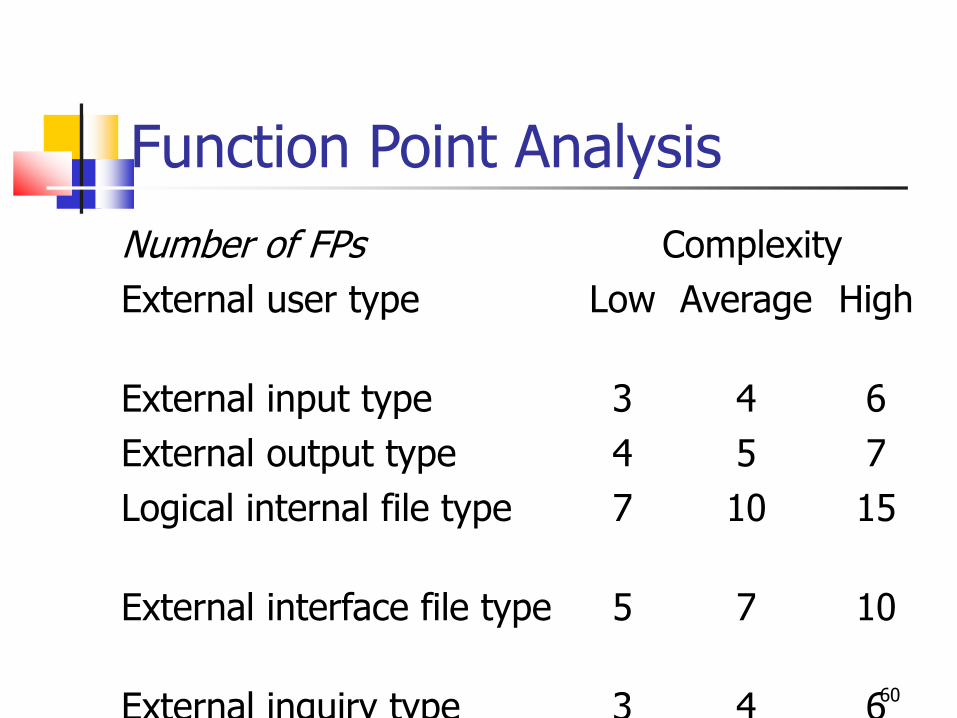
Function Point Analysis
Number of FPs Complexity
External user type Low Average High
External input type 3 4 6
External output type 4 5 7
Logical internal file type 7 10 15
External interface file type 5 7 10
External inquiry type 3 4 6
61
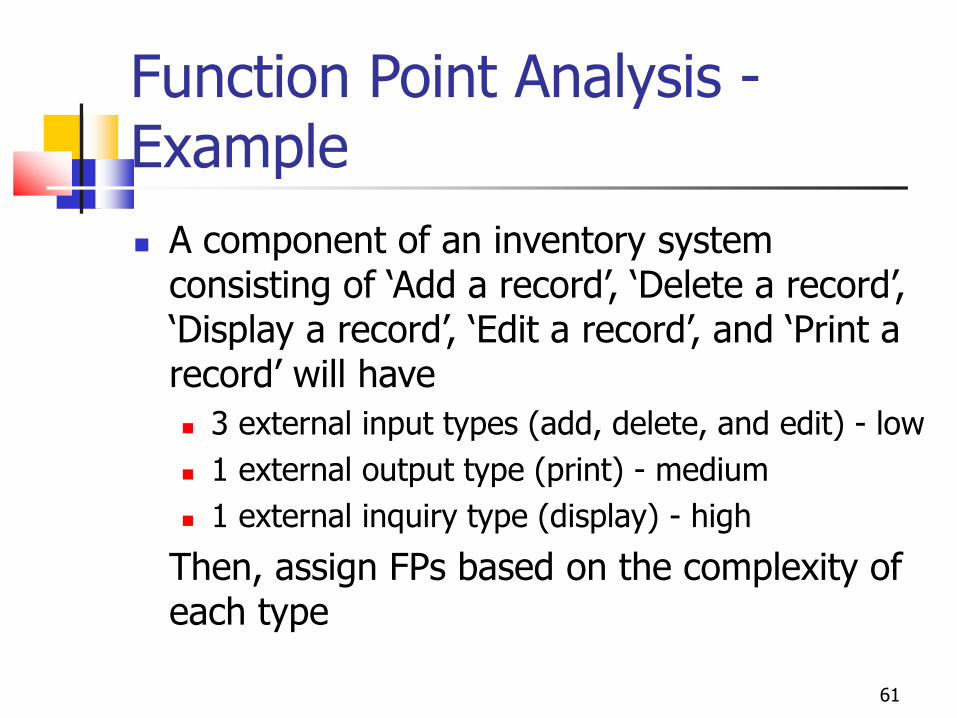
Function Point Analysis - Example
A component of an inventory system consisting of „Add a record‟, „Delete a record‟, „Display a record‟, „Edit a record‟, and „Print a record‟ will have
3 external input types (add, delete, and edit) - low
1 external output type (print) - medium
1 external inquiry type (display) - high
Then, assign FPs based on the complexity of each type
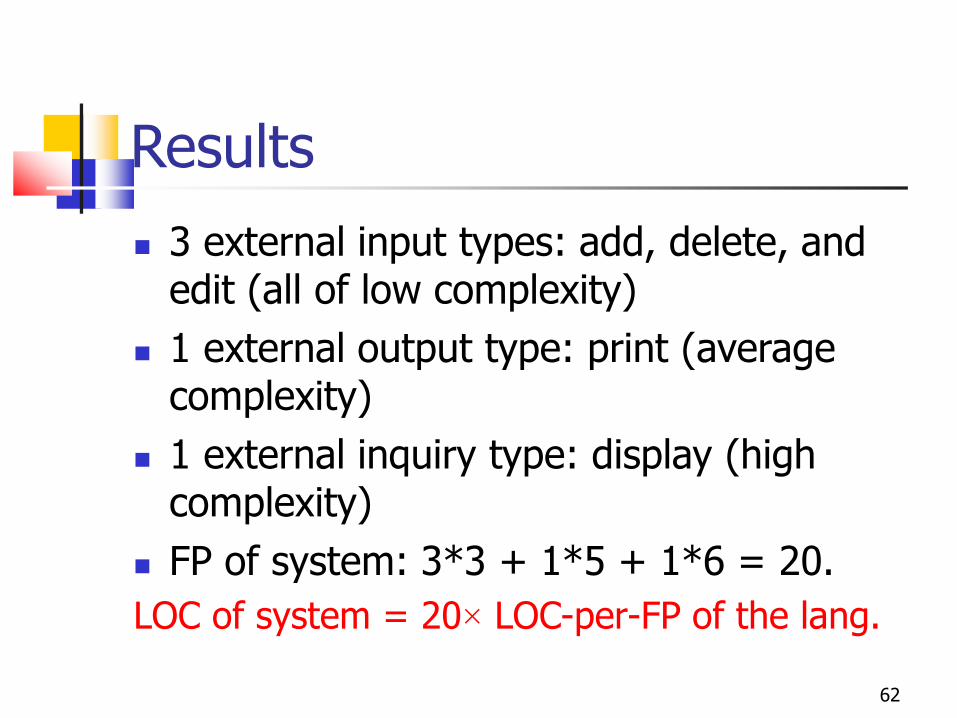
Results
3 external input types: add, delete, and edit (all of low complexity)
1 external output type: print (average complexity)
1 external inquiry type: display (high complexity)
FP of system: 3*3 + 1*5 + 1*6 = 20.
LOC of system = 20× LOC-per-FP of the lang.
62
63
Function Point Analysis (cont‟d)
Other issues
The assignment of level of complexity is rather subjective
International FP User Group (IFPUG) imposes rules on assigning the level of complexity to individual external user types
64
Object Point Analysis
Similar to function point analysis
Used on 4GL development projects
Takes account of features that may be more readily identifiable if the system is built on high-level application building tools
65
Object Point Analysis – Steps
Identify the number of screens, reports and 3GL components
Classify each object as Simple, Medium and Difficult
Assign the weight accordingly
Calculate the total object points
Total OP = sum of individual OP × weighting
66
Object Point Analysis – Steps (cont‟d)
Deduct the reused objects (r% reused) NOP (New Object Point) = OP × (1 – r%)
Identify the Productivity Rate (PR) of both developer and CASE
Productivity rate = average of the two PRs
Calculate the effort Effort = NOP / Productivity Rate
67
Object Point Analysis – Screens
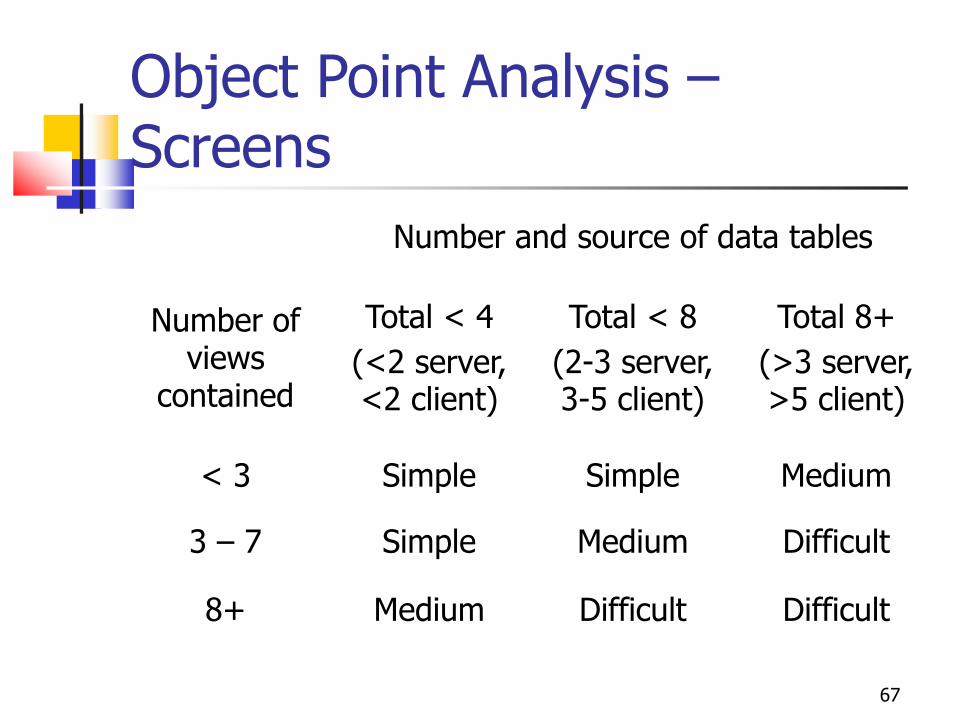
Number and source of data tables
Number of views
contained
Total < 4
(<2 server, <2 client)
Total < 8
(2-3 server, 3-5 client)
Total 8+
(>3 server, >5 client)
< 3 Simple Simple Medium
3 – 7 Simple Medium Difficult
8+ Medium Difficult Difficult
68
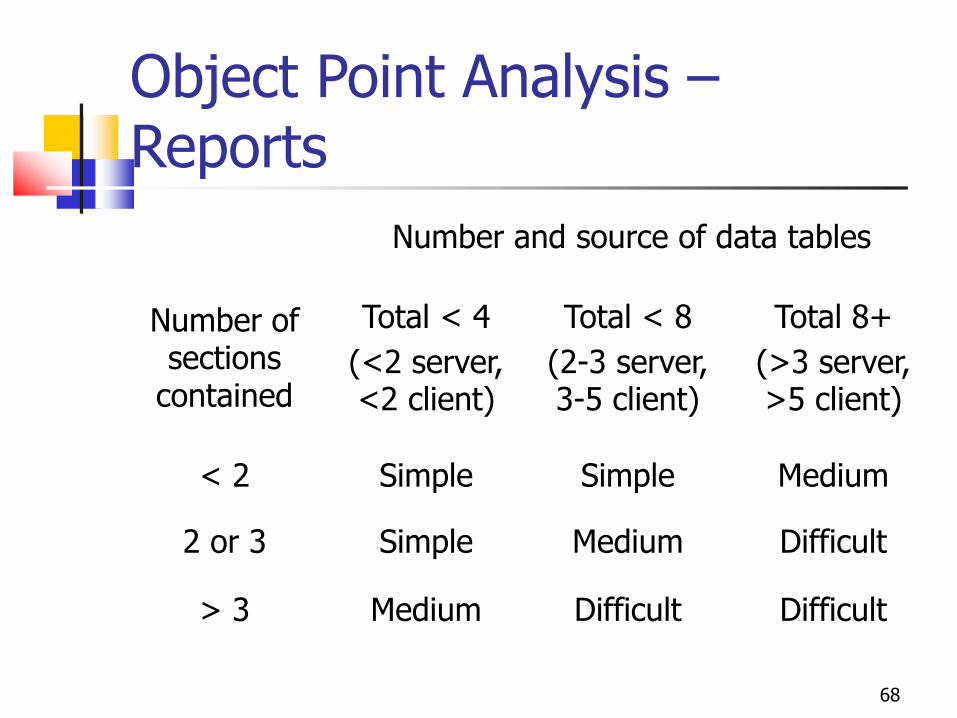
Object Point Analysis – Reports
Number and source of data tables
Number of sections
contained
Total < 4
(<2 server, <2 client)
Total < 8
(2-3 server, 3-5 client)
Total 8+
(>3 server, >5 client)
< 2 Simple Simple Medium
2 or 3 Simple Medium Difficult
> 3 Medium Difficult Difficult
69
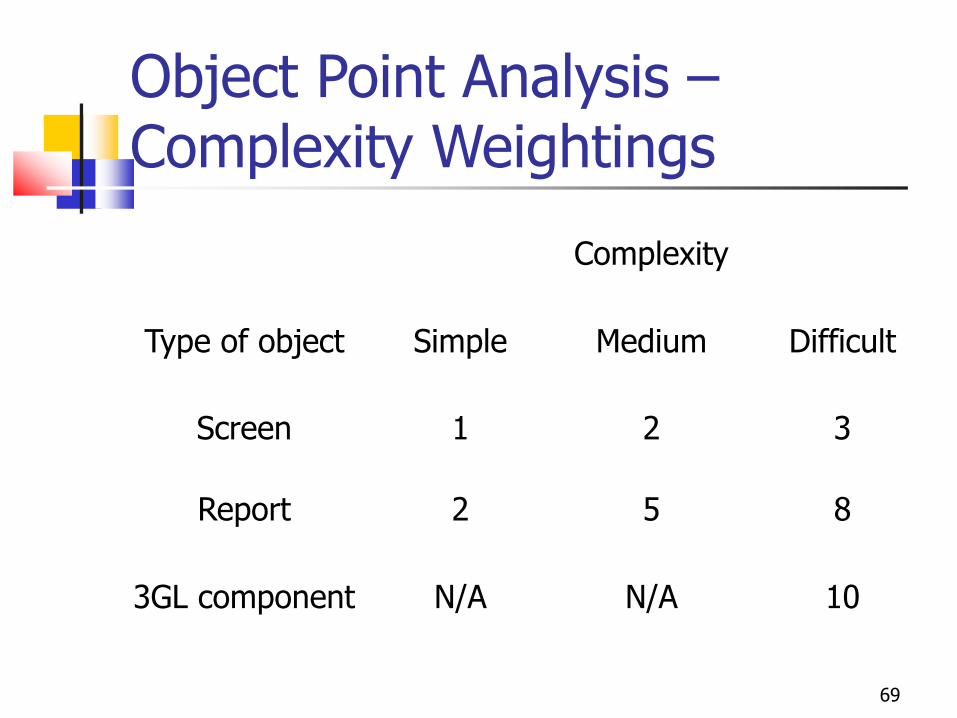
Object Point Analysis – Complexity Weightings
Complexity
Type of object Simple Medium Difficult
Screen 1 2 3
Report 2 5 8
3GL component N/A N/A 10
70
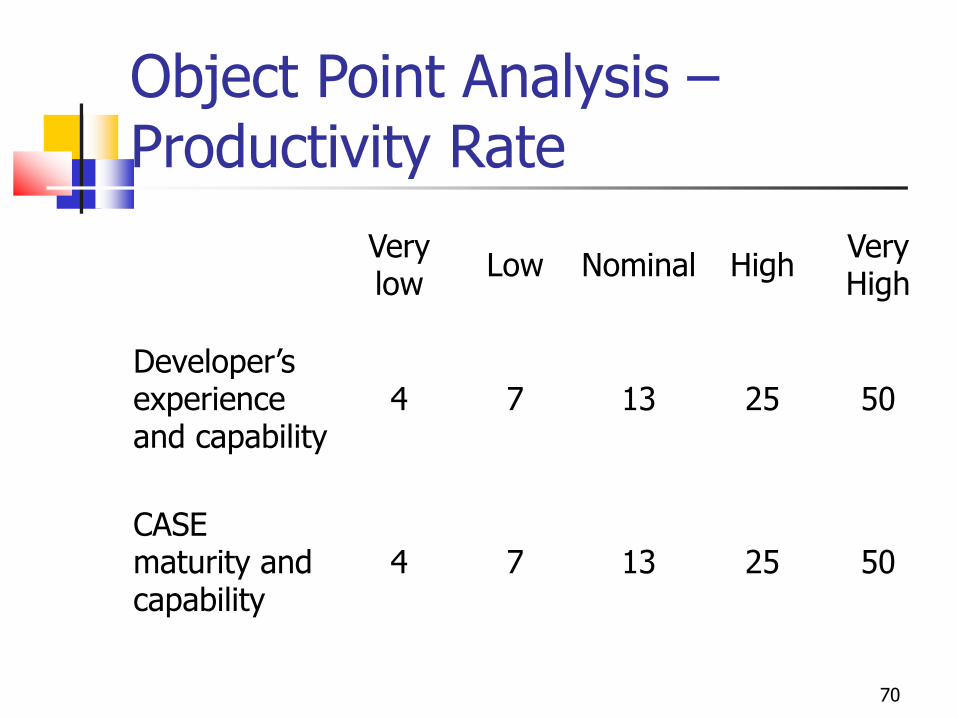
Object Point Analysis – Productivity Rate
Very low
Low Nominal High Very High
Developer‟s experience and capability
4 7 13 25 50
CASE maturity and capability
4 7 13 25 50
71
Object Point Analysis – Issues
Adopted in Boehm‟s COCOMO II in the application composition stage
72
Cost Estimation - Constructive Cost Model II (COCOMO II)
A parametric cost model
Important aspects of software projects are characterized by variables (or parameters)
Once the value of the parameters are determined, the cost can be computed from an equation
73
COCOMO II (cont‟d)
Recognizes different approaches to software development
Prototyping, Incremental development etc.
74
A history of COCOMOs
COCOMO originally proposed by Boehm in 1981, now called COCOMO 81
Later evolved to Ada COCOMO in 1989
In 1995, Boehm proposed COCOMO II
75
COCOMO II
A family of models
Uses different models in 3 different stages of the project
3 stages: application composition, early design and post architecture
Supports estimation early in the process
Allows further detailed estimation after the system architecture has been defined
76
COCOMO II (cont‟d)
The basic model equation
Effort = Constant × (Size)scale factor
× Effort Multiplier (EM)
Effort in terms of person-months
Constant: 2.45 in 1998
Size: Estimated Size in KSLOC (Kilo Source Line of Code)
Scale Factor: combined process factors
Effort Multiplier (EM): combined effort factors
77
The Application Composition Stage
Estimation at the early stage
Corresponding to exploratory work such as prototyping
Uses object points to estimate the size of the product
78
The Early Design Stage
Estimate after the requirements specification is completed and possibly with some design
Use the basic model equation
Estimate the size by FPs (preferred) or KSLOC
Estimate scale factor and effort multiplier
79
The Early Design Stage – Scale Factor
Estimation of the scale factor
A combined effect of 5 parameters
Application precedentedness
Process flexibility
Architecture risk resolution
Team cohesion
Process maturity
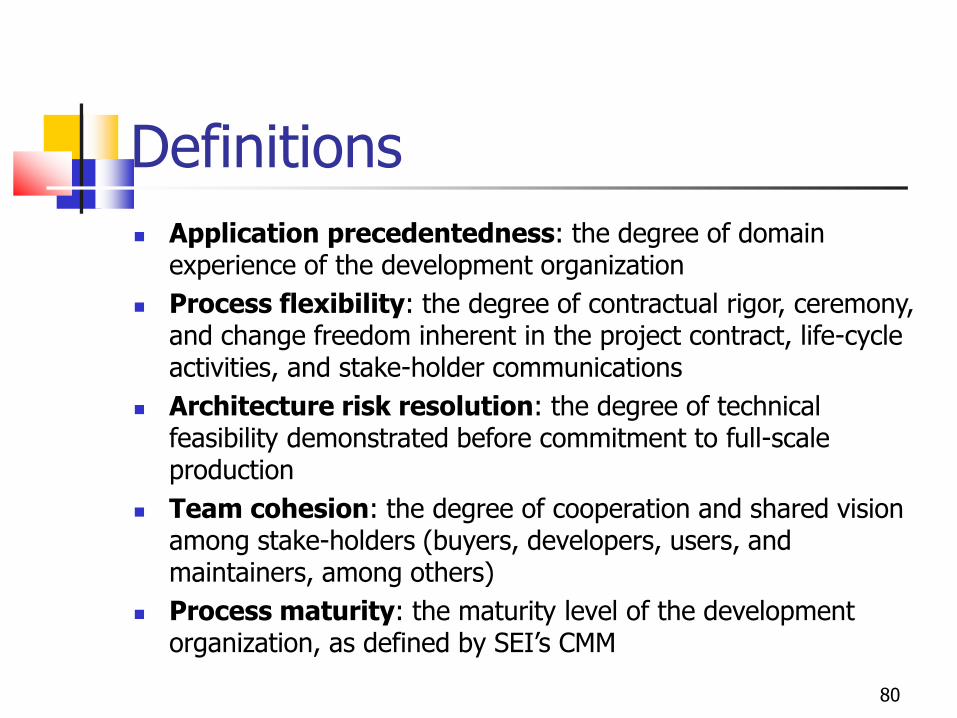
Definitions
Application precedentedness: the degree of domain experience of the development organization
Process flexibility: the degree of contractual rigor, ceremony, and change freedom inherent in the project contract, life-cycle activities, and stake-holder communications
Architecture risk resolution: the degree of technical feasibility demonstrated before commitment to full-scale production
Team cohesion: the degree of cooperation and shared vision among stake-holders (buyers, developers, users, and maintainers, among others)
Process maturity: the maturity level of the development organization, as defined by SEI‟s CMM
80
81
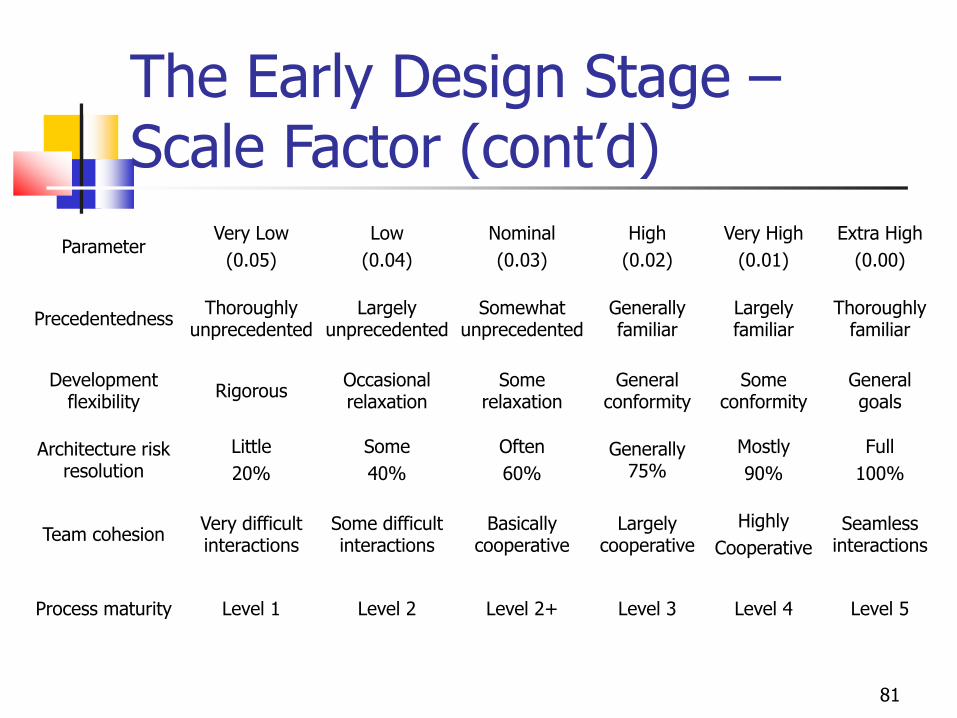
The Early Design Stage – Scale Factor (cont‟d)
Parameter Very Low
(0.05)
Low
(0.04)
Nominal
(0.03)
High
(0.02)
Very High
(0.01)
Extra High
(0.00)
Precedentedness Thoroughly
unprecedented Largely
unprecedented Somewhat
unprecedented Generally familiar
Largely familiar
Thoroughly familiar
Development flexibility
Rigorous Occasional relaxation
Some relaxation
General conformity
Some conformity
General goals
Architecture risk resolution
Little
20%
Some
40%
Often
60%
Generally 75%
Mostly
90%
Full
100%
Team cohesion Very difficult interactions
Some difficult interactions
Basically cooperative
Largely cooperative
Highly
Cooperative
Seamless interactions
Process maturity Level 1 Level 2 Level 2+ Level 3 Level 4 Level 5
82
The Early Design Stage – Scale Factor (Cont‟d)
Calculate the scale factor based on the equation
Scale factor = 1.01 + sum of the values
83
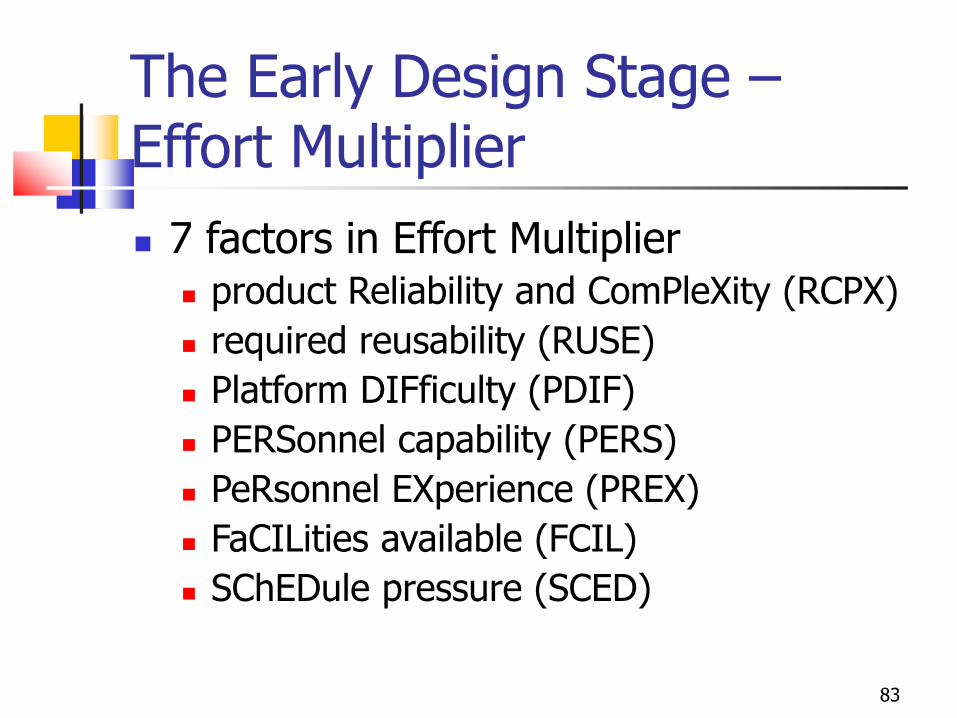
The Early Design Stage – Effort Multiplier
7 factors in Effort Multiplier product Reliability and ComPleXity (RCPX)
required reusability (RUSE)
Platform DIFficulty (PDIF)
PERSonnel capability (PERS)
PeRsonnel EXperience (PREX)
FaCILities available (FCIL)
SChEDule pressure (SCED)
84
The Early Design Stage – Effort Multiplier (cont‟d)
Assess each factor by
Very low, low, nominal, high, very high, and extra high
Assign each factor using a value between 0.5 and 1.5 (inclusive)
EM is the product of all these values
85
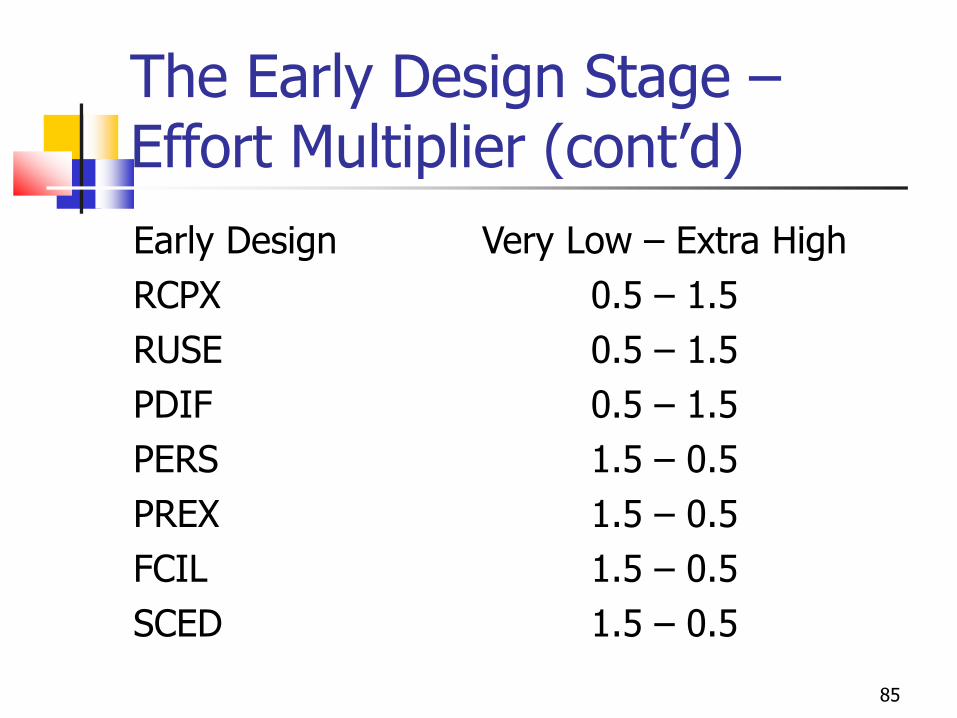
The Early Design Stage – Effort Multiplier (cont‟d)
Early Design Very Low – Extra High
RCPX 0.5 – 1.5
RUSE 0.5 – 1.5
PDIF 0.5 – 1.5
PERS 1.5 – 0.5
PREX 1.5 – 0.5
FCIL 1.5 – 0.5
SCED 1.5 – 0.5
86
The Post-architecture Stage
Estimation after the software architecture has been defined
The same basic model equation
Size estimation by KSLOC (preferred) or FPs
Same scale factor estimation
17 factors in EM (7 in early design stage)
87
The Post-architecture Stage – Effort Multiplier
17 factors in 4 different categories
Product attributes
Platform attributes
Personnel attributes
Project attributes
88
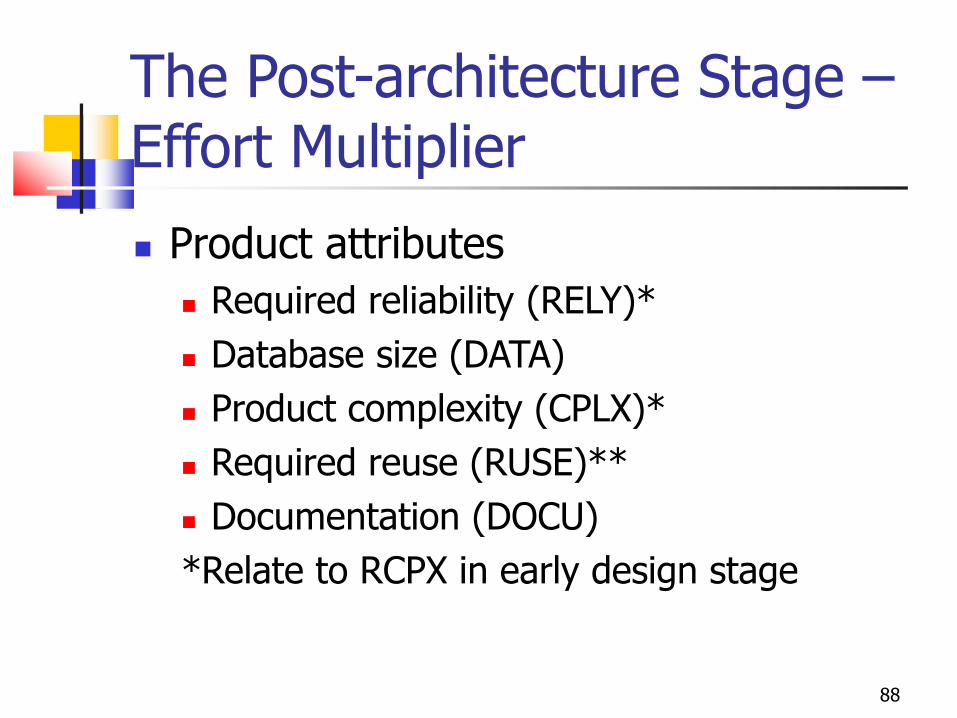
The Post-architecture Stage – Effort Multiplier
Product attributes
Required reliability (RELY)*
Database size (DATA)
Product complexity (CPLX)*
Required reuse (RUSE)**
Documentation (DOCU)
*Relate to RCPX in early design stage
89
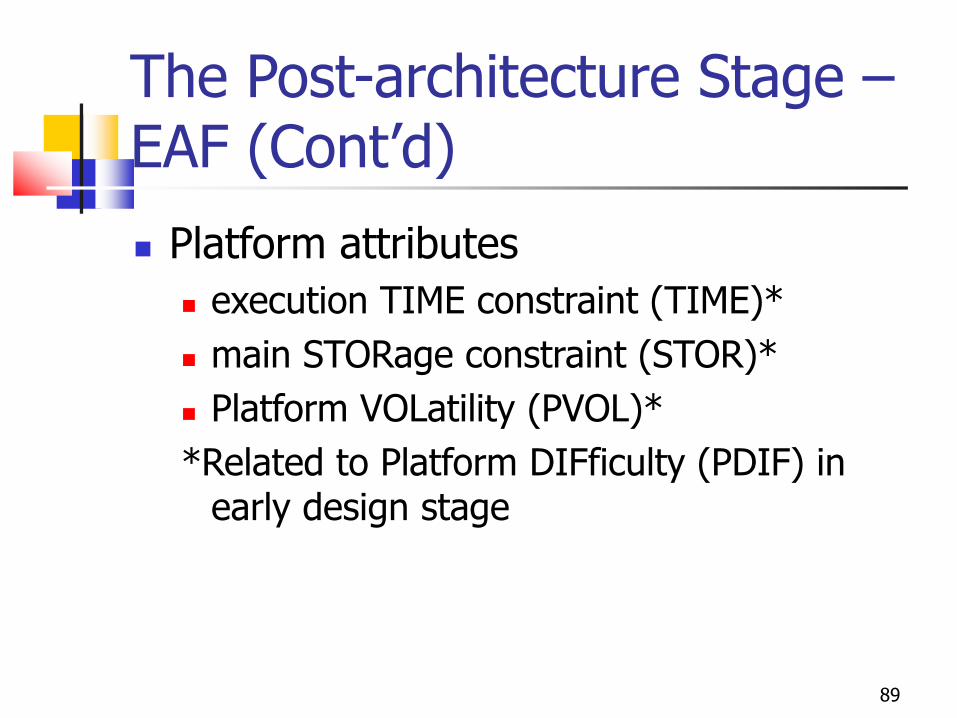
The Post-architecture Stage – EAF (Cont‟d)
Platform attributes
execution TIME constraint (TIME)*
main STORage constraint (STOR)*
Platform VOLatility (PVOL)*
*Related to Platform DIFficulty (PDIF) in early design stage
90
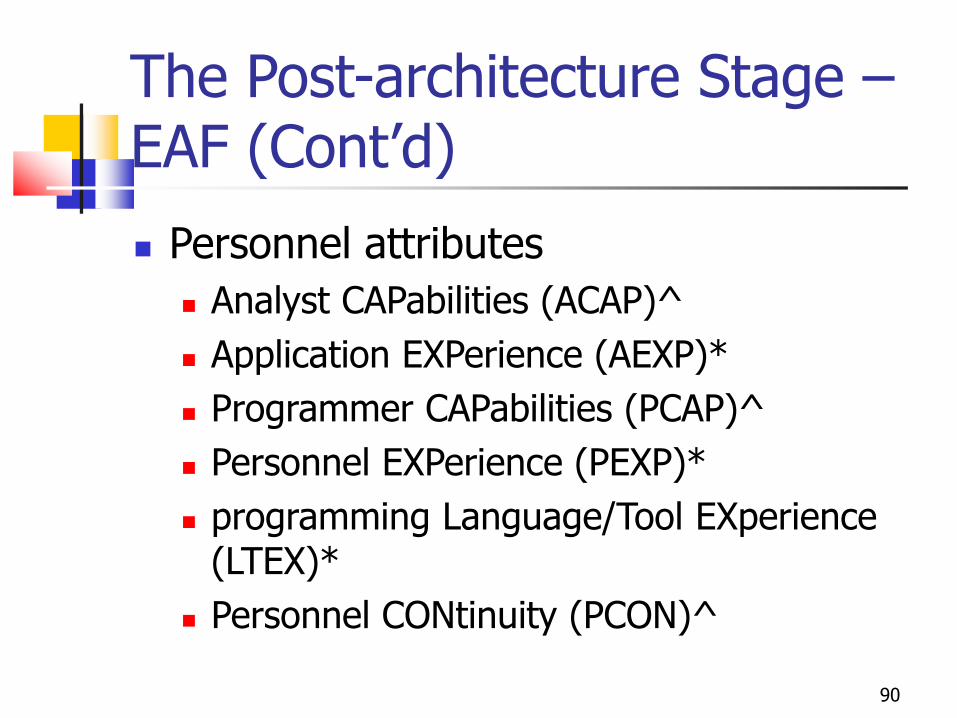
The Post-architecture Stage – EAF (Cont‟d)
Personnel attributes
Analyst CAPabilities (ACAP)^
Application EXPerience (AEXP)*
Programmer CAPabilities (PCAP)^
Personnel EXPerience (PEXP)*
programming Language/Tool EXperience (LTEX)*
Personnel CONtinuity (PCON)^
91
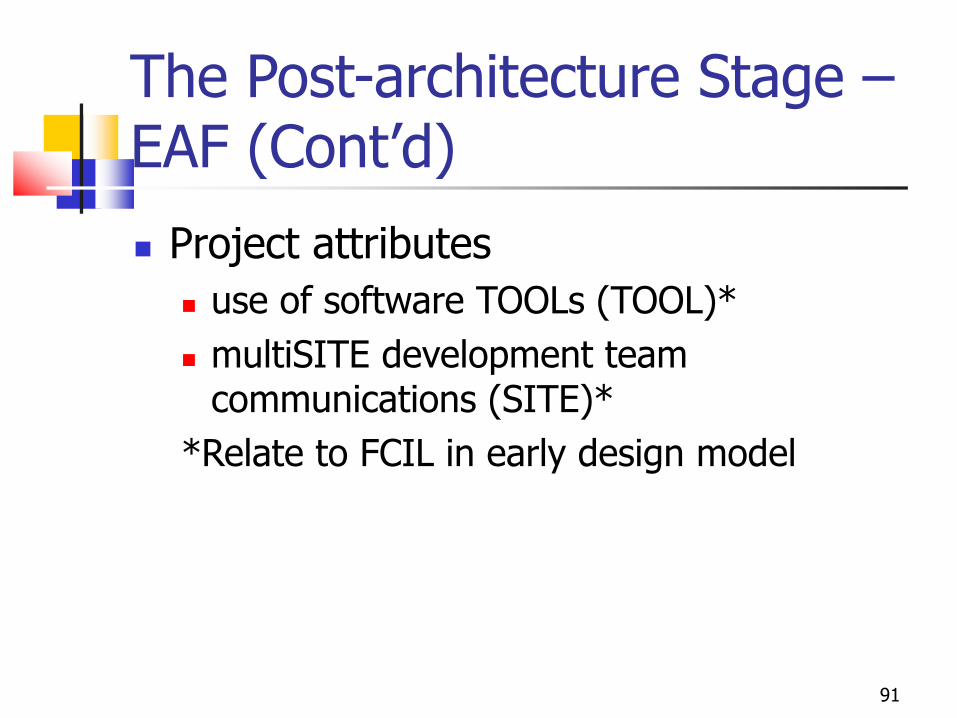
The Post-architecture Stage – EAF (Cont‟d)
Project attributes
use of software TOOLs (TOOL)*
multiSITE development team communications (SITE)*
*Relate to FCIL in early design model
92
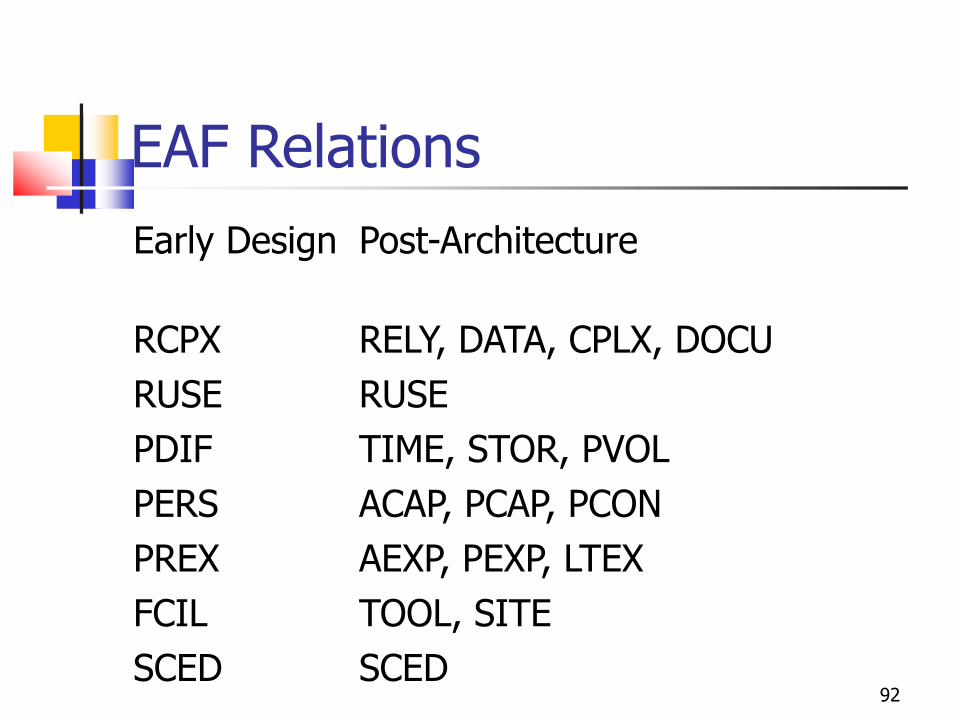
EAF Relations
Early Design Post-Architecture
RCPX RELY, DATA, CPLX, DOCU
RUSE RUSE
PDIF TIME, STOR, PVOL
PERS ACAP, PCAP, PCON
PREX AEXP, PEXP, LTEX
FCIL TOOL, SITE
SCED SCED
93
COCOMO II (cont‟d)
Advantages
Good improvement over COCOMO
Good match for iterative development, modern technology, and management process
Disadvantages
Still immature, diverse projects in database
Hard to believe that it will be any more reliable than the original COCOMO model
94
References
Hughes, B., and Cotterell, M. (1999) Software project management, 2nd ed., McGraw Hill
Pfleeger, S.L. (1998) Software Engineering: Theory and Practice, Prentice Hall
Royce, W. (1998) Software Project Management: A Unified Framework, Addison Wesley
Center for Software Engineering, USC (1999) COCOMO II Model Definition Manual.
http://csse.usc.edu/csse/research/COCOMOII/cocomo_main.html