Embed Size (px)
Citation preview

1 Copyright © BlueOptima Limited 2005-2012. All Rights Reserved Copyright © BlueOptima Limited 2005-2012. All Rights Reserved
… software development analytics enabling your
enterprise to deliver better software faster and at lower
cost.
Senior management and reporting
for Enterprise Agile:
Making sure the CTO “gets it”

2 Copyright © BlueOptima Limited 2005-2012. All Rights Reserved Copyright © BlueOptima Limited 2005-2012. All Rights Reserved
What is “Enterprise”
Large organizations
Large software portfolios
Lots of developers
Global / Geographically
Distributed
Split teams, common
objectives
Outsourced software
development
Heterogeneous
3 Copyright © BlueOptima Limited 2005-2012. All Rights Reserved Copyright © BlueOptima Limited 2005-2012. All Rights Reserved
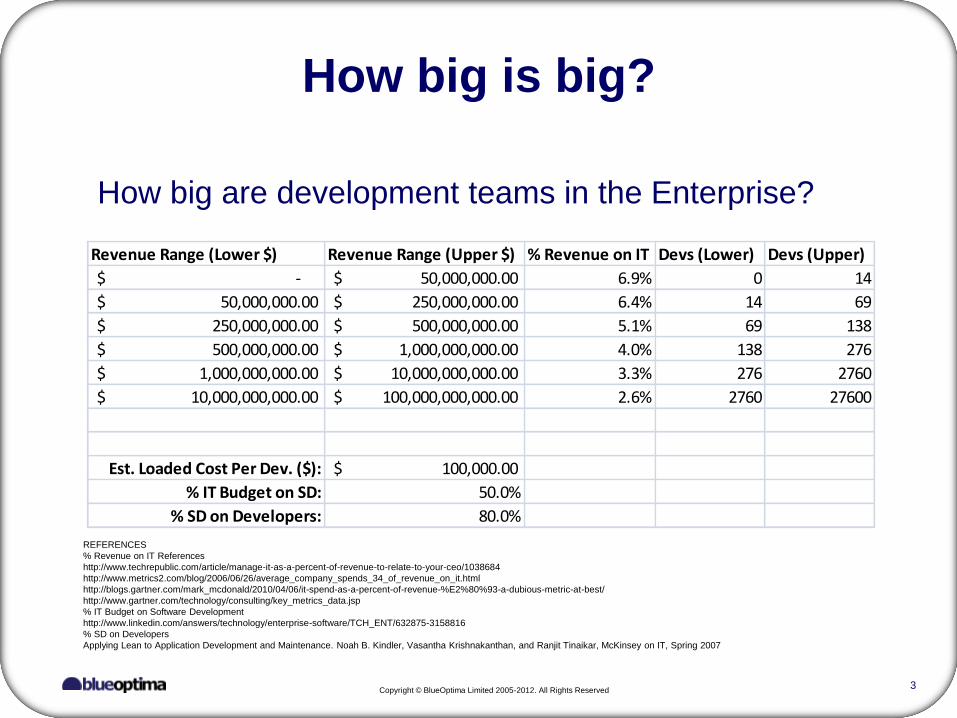
How big is big?
How big are development teams in the Enterprise?
Revenue Range (Lower $) Revenue Range (Upper $) % Revenue on IT Devs (Lower) Devs (Upper)
-$ 50,000,000.00$ 6.9% 0 14
50,000,000.00$ 250,000,000.00$ 6.4% 14 69
250,000,000.00$ 500,000,000.00$ 5.1% 69 138
500,000,000.00$ 1,000,000,000.00$ 4.0% 138 276
1,000,000,000.00$ 10,000,000,000.00$ 3.3% 276 2760
10,000,000,000.00$ 100,000,000,000.00$ 2.6% 2760 27600
Est. Loaded Cost Per Dev. ($): 100,000.00$
% IT Budget on SD: 50.0%
% SD on Developers: 80.0%
REFERENCES
% Revenue on IT References
http://www.techrepublic.com/article/manage-it-as-a-percent-of-revenue-to-relate-to-your-ceo/1038684
http://www.metrics2.com/blog/2006/06/26/average_company_spends_34_of_revenue_on_it.html
http://blogs.gartner.com/mark_mcdonald/2010/04/06/it-spend-as-a-percent-of-revenue-%E2%80%93-a-dubious-metric-at-best/
http://www.gartner.com/technology/consulting/key_metrics_data.jsp
% IT Budget on Software Development
http://www.linkedin.com/answers/technology/enterprise-software/TCH_ENT/632875-3158816
% SD on Developers
Applying Lean to Application Development and Maintenance. Noah B. Kindler, Vasantha Krishnakanthan, and Ranjit Tinaikar, McKinsey on IT, Spring 2007

4 Copyright © BlueOptima Limited 2005-2012. All Rights Reserved Copyright © BlueOptima Limited 2005-2012. All Rights Reserved
Geographically Distributed
Split teams, common objectives
Outsource
IT outsourcing industry expected 8% CAGR in 2011-2013 and is
(including BPO and hardware support) now worth over $1.7
trillion (see NASSCOM for statistics)
Heterogeneous
Does anyone know a universally mature and operationally
consistent Agile software development shop?
Need a metrics and management reporting regime that
satisfies all scenarios!

5 Copyright © BlueOptima Limited 2005-2012. All Rights Reserved Copyright © BlueOptima Limited 2005-2012. All Rights Reserved
CXOs need some lovin’
CTO/CIO/COO Answerable to CEO &
Chairman
Keeping one eye on the CFO
Multiple lines of business
Multiple operational domains
Keep it Simple! 1. Is our strategy right
2. Will we achieve our strategic
objectives on time
3. Are we appropriately
resourced (not just people)
4. What do I need to fix
KISS me
6 Copyright © BlueOptima Limited 2005-2012. All Rights Reserved Copyright © BlueOptima Limited 2005-2012. All Rights Reserved
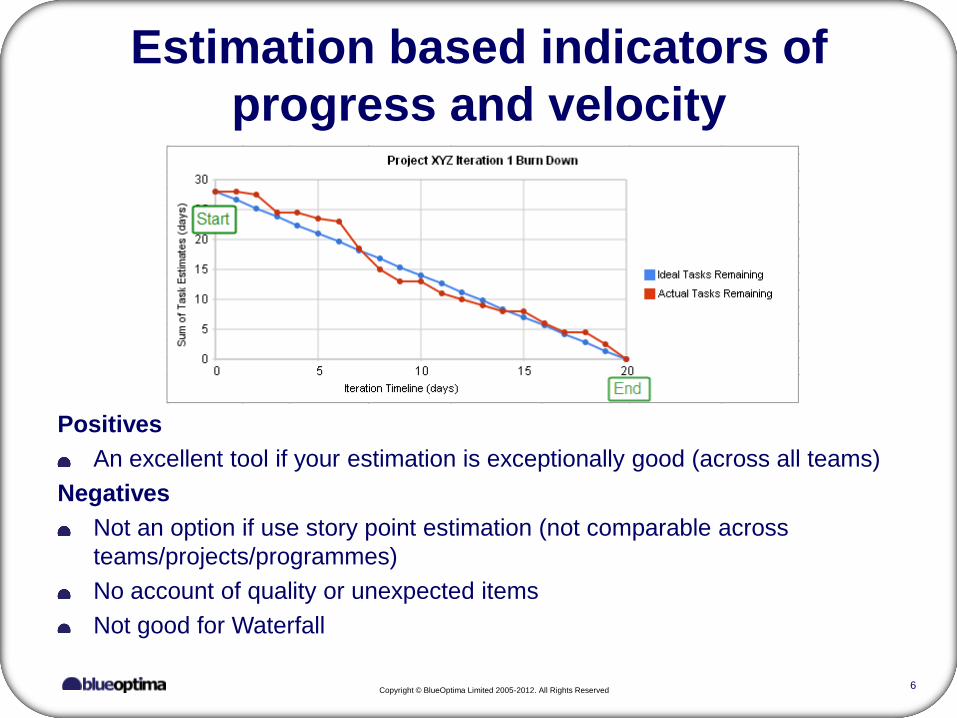
Estimation based indicators of
progress and velocity
Positives
An excellent tool if your estimation is exceptionally good (across all teams)
Negatives
Not an option if use story point estimation (not comparable across
teams/projects/programmes)
No account of quality or unexpected items
Not good for Waterfall

7 Copyright © BlueOptima Limited 2005-2012. All Rights Reserved Copyright © BlueOptima Limited 2005-2012. All Rights Reserved
Time based proxies of velocity
Positives
Easily understood
Probably already done (usually
poorly)
Negatives
Significant overhead for developers
to gather at a granular level
Remarkably difficult to get consistent
discipline across teams
Just when you need it it’s done worst
8 Copyright © BlueOptima Limited 2005-2012. All Rights Reserved Copyright © BlueOptima Limited 2005-2012. All Rights Reserved
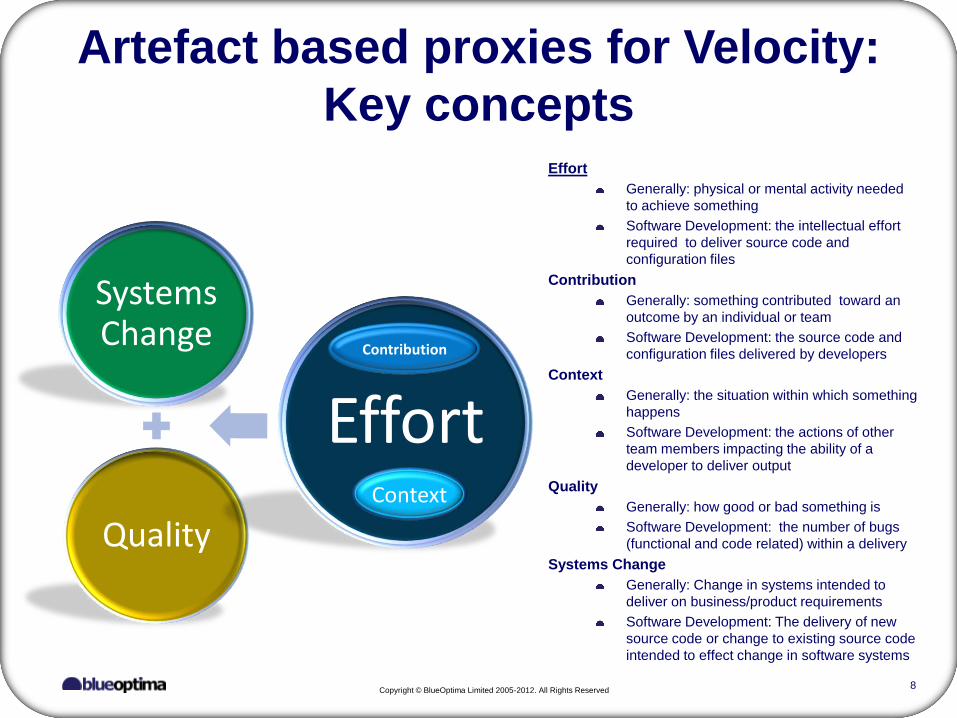
Artefact based proxies for Velocity:
Key concepts Effort
Generally: physical or mental activity needed
to achieve something
Software Development: the intellectual effort
required to deliver source code and
configuration files
Contribution
Generally: something contributed toward an
outcome by an individual or team
Software Development: the source code and
configuration files delivered by developers
Context
Generally: the situation within which something
happens
Software Development: the actions of other
team members impacting the ability of a
developer to deliver output
Quality
Generally: how good or bad something is
Software Development: the number of bugs
(functional and code related) within a delivery
Systems Change
Generally: Change in systems intended to
deliver on business/product requirements
Software Development: The delivery of new
source code or change to existing source code
intended to effect change in software systems
Systems Change
Quality
Effort
Contribution
Context

9 Copyright © BlueOptima Limited 2005-2012. All Rights Reserved Copyright © BlueOptima Limited 2005-2012. All Rights Reserved
Benchmarking artefact based
proxies of Coding Effort
Coding Effort Quantification
•BlueOptima allows software organizations to reliably quantify the contribution that is being delivered by their software development teams.
Performance Management
•This allows the calculation of Coding Effort for any given task that a development team is assigned to complete and development phases.
Volume (e.g. SLoC)
Complexity (e.g. Halstead,
McCabe)
Interelatedness (DAC, Fan-out)
Interaction (i.e. between
developers)
Other static metrics (>30)
Coding Effort
Work Context
Code Delivered

10 Copyright © BlueOptima Limited 2005-2012. All Rights Reserved
Capture Time
Measure Output
Two Ways to Measure Coding Effort:
How do they compare?
Correlation with
Actual Hours (Sample size is ~ 4000 timed
interactions with source files.
Controlled for differences in
developer role/ability)
>.86

11 Copyright © BlueOptima Limited 2005-2012. All Rights Reserved Copyright © BlueOptima Limited 2005-2012. All Rights Reserved
Reporting on Quality:
The Quality Abacus
Sources: Economics of Software Quality, Jones & Bonsignour; Software Defect Analysis, An Empirical Study of Causes and Costs in the IT Industry, Kristianson,
NTNU: CAST Report on Application Software Health (CRASH), 2012, Curtis, Sappidi, & Szynkarskii; IDC SQAM Forecast
0
1
2
3
4
5
6
Code SIT UAT Live
1x
2x
3x
6x
12 Copyright © BlueOptima Limited 2005-2012. All Rights Reserved Copyright © BlueOptima Limited 2005-2012. All Rights Reserved
0
500000
1000000
1500000
2000000
2500000
06/1
2/20
06
07/1
2/20
06
08/1
2/20
06
09/1
2/20
06
10/1
2/20
06
11/1
2/20
06
12/1
2/20
06
13/1
2/20
06
14/1
2/20
06
15/1
2/20
06
16/1
2/20
06
17/1
2/20
06
18/1
2/20
06
19/1
2/20
06
20/1
2/20
06
21/1
2/20
06
22/1
2/20
06
23/1
2/20
06
24/1
2/20
06
25/1
2/20
06
26/1
2/20
06
27/1
2/20
06
28/1
2/20
06
29/1
2/20
06
30/1
2/20
06
31/1
2/20
06
01/0
1/20
07
02/0
1/20
07
03/0
1/20
07
04/0
1/20
07
05/0
1/20
07
06/0
1/20
07
07/0
1/20
07
08/0
1/20
07
09/0
1/20
07
10/0
1/20
07
11/0
1/20
07
12/0
1/20
07
13/0
1/20
07
14/0
1/20
07
15/0
1/20
07
16/0
1/20
07
17/0
1/20
07
18/0
1/20
07
19/0
1/20
07
20/0
1/20
07
21/0
1/20
07
22/0
1/20
07
23/0
1/20
07
24/0
1/20
07
Release 7 Project Timeline
Cu
mu
lati
ve C
od
ing
Eff
ort
(W
ork
)
-50000
0
50000
100000
150000
200000
250000
Day o
n D
ay C
od
ing
Eff
ort
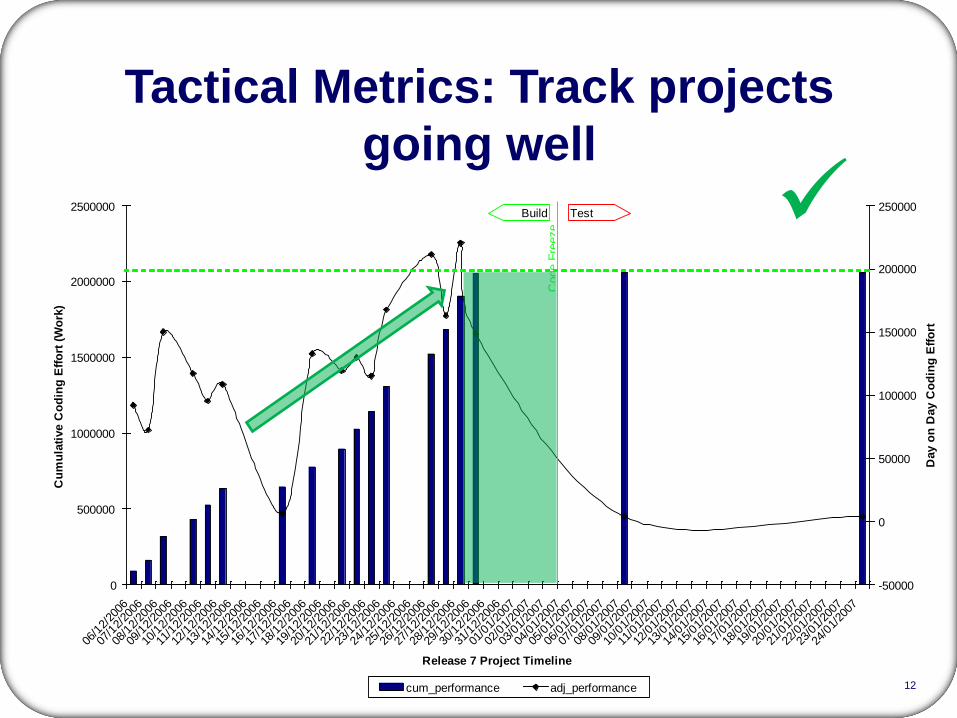
cum_performance adj_performance
TestBuild
Code F
reeze
Tactical Metrics: Track projects
going well
13 Copyright © BlueOptima Limited 2005-2012. All Rights Reserved Copyright © BlueOptima Limited 2005-2012. All Rights Reserved
0
500000
1000000
1500000
2000000
2500000
28/0
2/20
07
01/0
3/20
07
02/0
3/20
07
03/0
3/20
07
04/0
3/20
07
05/0
3/20
07
06/0
3/20
07
07/0
3/20
07
08/0
3/20
07
09/0
3/20
07
10/0
3/20
07
11/0
3/20
07
12/0
3/20
07
13/0
3/20
07
14/0
3/20
07
15/0
3/20
07
16/0
3/20
07
17/0
3/20
07
18/0
3/20
07
19/0
3/20
07
20/0
3/20
07
21/0
3/20
07
22/0
3/20
07
23/0
3/20
07
24/0
3/20
07
25/0
3/20
07
26/0
3/20
07
27/0
3/20
07
28/0
3/20
07
29/0
3/20
07
30/0
3/20
07
31/0
3/20
07
01/0
4/20
07
02/0
4/20
07
03/0
4/20
07
04/0
4/20
07
05/0
4/20
07
06/0
4/20
07
07/0
4/20
07
08/0
4/20
07
09/0
4/20
07
10/0
4/20
07
11/0
4/20
07
12/0
4/20
07
13/0
4/20
07
14/0
4/20
07
15/0
4/20
07
16/0
4/20
07
17/0
4/20
07
18/0
4/20
07
19/0
4/20
07
20/0
4/20
07
21/0
4/20
07
22/0
4/20
07
23/0
4/20
07
24/0
4/20
07
25/0
4/20
07
Release A Project Timeline
Cu
mu
lati
ve C
od
ing
Eff
ort
(W
ork
)
-50000
0
50000
100000
150000
200000
250000
300000
350000
Day o
n D
ay C
od
ing
Eff
ort
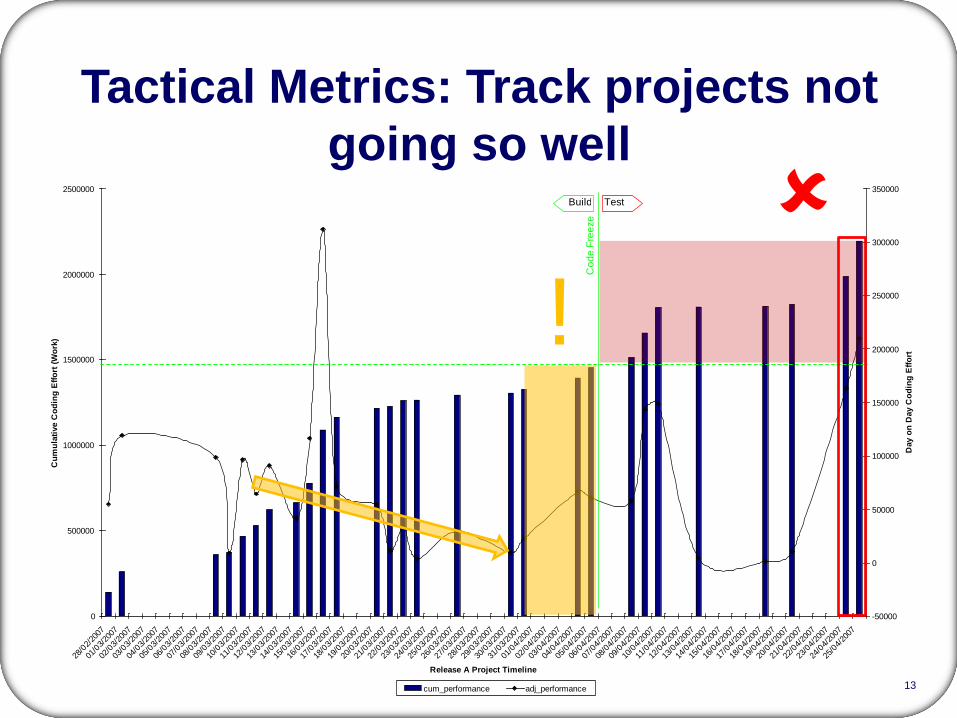
cum_performance adj_performance
TestBuild
Co
de
Fre
eze
Tactical Metrics: Track projects not
going so well
!

14 Copyright © BlueOptima Limited 2005-2012. All Rights Reserved Copyright © BlueOptima Limited 2005-2012. All Rights Reserved
Above all: Keep it light

15 Copyright © BlueOptima Limited 2005-2012. All Rights Reserved Copyright © BlueOptima Limited 2005-2012. All Rights Reserved
Strategic Programme XYZ – The development of a global application using
geographically distributed resources.
Key Accomplishments (01/03/11-31/3/11)
Status Date Activity
X 7 Feb Sign off requirements
14 Feb WM-Ware infrastructure delivered ready for the start of pilot
29 Feb Complete …..
Key Activities for Next Period (to 31/03/11)
Date Activity
25 Mar Complete contractual negotiations
31 Mar Complete rollout of …..
31 Mar Some other key activity
OB
G
OS
G
OT
A
O
A
Overall On Time On Scope On Budget
Outstanding Issues/Risks Resolution / Mitigation
Issue This is an issue (i.e. not yet a risk) that can be described here. What is done about the issue
Risk This is something that is a risk and may become and issue What is done to ameliorate the risk
Risk This is something that is a risk and may become and issue What is done to ameliorate the risk
13% $79,260.32 50,119 $566,806 $616,925
YTD $$ %
of Outlook
YTD $$ Variance
B /(W)
Full Year
Outlook $$
Full Year
Plan $$
Total Project
Outlook $$
To Date $$ %
of Approved$$
Project to Date
$$
Total Project
Approved $$
$587,806 17.7% $100,260.32 $567,000
Current Year Cash Spend (a/o Feb) Total Project Cash Spend (a/o Feb)
Name [Subproject] Start Date Test Date End DateCoding Effort
Ratio
Est.
Hours
Effort
Total
Devs
Coding
Phase
Est. Hrs.
Effort /
Day
Test
Phase
Est. Hrs.
Effort /
Day
Total Cost
IPS 57 [IPS57] 31-Oct-11 28-Dec-11 30-Apr-12 53.14 : 46.86 816.23 3 10.33 4.35 20,000.00
SDS 57 [SDS57] 31-Oct-11 28-Dec-11 31-Mar-12 96.92 : 3.08 1,023.28 4 23.61 0.47 40,000.00
Trading 57 [Trading57] 23-Nov-11 14-Jan-12 05-Jul-12 74.25 : 25.75 665.04 18 13.35 1.38 80,000.00