Embed Size (px)
DESCRIPTION
State of the Freeport Address Subic Bay Freport
Citation preview

2009 STATE OF THE FREEPORT ADDRESS(Part Two)
“A VISION OF TOMORROW”
by Armand C. ArrezaSBMA Administrator and CEO
Subic Bay Exhibition & Convention Center
23 February 2010

The President’s Vision
2
“The Subic-Clark corridor will be
the most competitive international
service and logistics center in the
Southeast Asian Region”
From the inaugural speech of
Her Excellency President Gloria Macapagal-Arroyo
When Chairman Salonga and I were appointed in Sept. 2005, the President
presented us with a challenge…
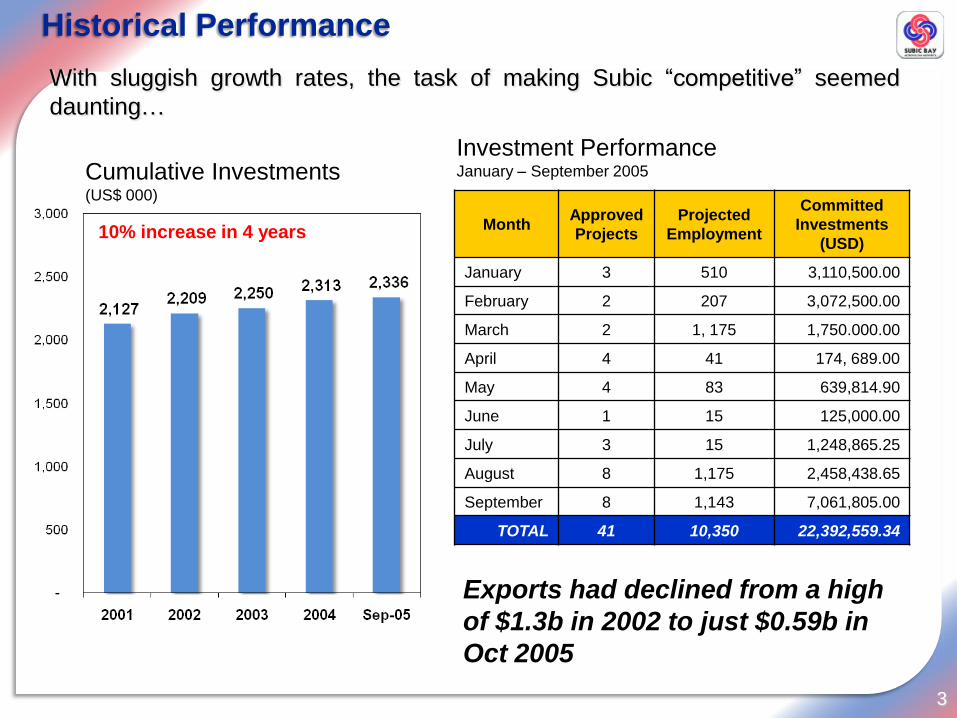
Historical Performance
3
10% increase in 4 years
Cumulative Investments (US$ 000)
MonthApproved
Projects
Projected
Employment
Committed
Investments
(USD)
January 3 510 3,110,500.00
February 2 207 3,072,500.00
March 2 1, 175 1,750.000.00
April 4 41 174, 689.00
May 4 83 639,814.90
June 1 15 125,000.00
July 3 15 1,248,865.25
August 8 1,175 2,458,438.65
September 8 1,143 7,061,805.00
TOTAL 41 10,350 22,392,559.34
Investment Performance January – September 2005
With sluggish growth rates, the task of making Subic ―competitive‖ seemed
daunting…
Exports had declined from a high
of $1.3b in 2002 to just $0.59b in
Oct 2005
4
HIGHLIGHTS COST
Clark International Airport
expansion & upgradingUS$ 37.4M
Subic Port
Development ProjectUS$ 230.0M
Subic-Clark-Tarlac Expressway
(SCTEx)US$ 504.3M
North Luzon Railway Phase 1 US$ 503.4 M
North Luzon
Expressway RehabilitationUS$ 226.4M
Subic-Clark Area Development
Several key infrastructure projects were in the pipeline and it was incumbent upon us and the
entire SCAD team to ensure their timely completion

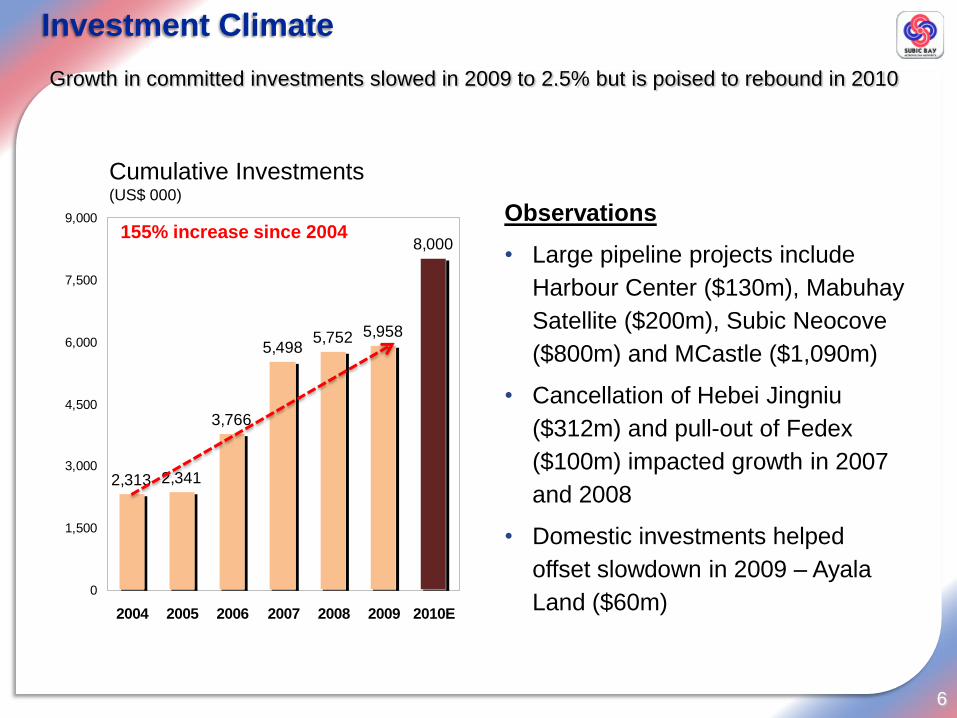
Investment Climate
5
Number of Investors
Nonetheless, by focusing on creating a more investor-friendly environment, the number of
investors continued to climb from 2005, growing at more than 20% per annum from 2006
to 2008
116% increase since 2004Observations
• Number of investors have almost
doubled since 2005
• Growth rate, however slowed to 7%
in 2009 from a high of 23% in 2008
due to the impact of Global Financial
Crisis
• Projects from domestic firms offset
slow-down in investments from
foreign firms
Investment Climate
6
2,313 2,341
3,766
5,4985,752
8,000
5,958
0
1,500
3,000
4,500
6,000
7,500
9,000
2004 2005 2006 2007 2008 2009 2010E
Cumulative Investments (US$ 000)
Growth in committed investments slowed in 2009 to 2.5% but is poised to rebound in 2010
Observations
• Large pipeline projects include
Harbour Center ($130m), Mabuhay
Satellite ($200m), Subic Neocove
($800m) and MCastle ($1,090m)
• Cancellation of Hebei Jingniu
($312m) and pull-out of Fedex
($100m) impacted growth in 2007
and 2008
• Domestic investments helped
offset slowdown in 2009 – Ayala
Land ($60m)
155% increase since 2004

Investment Profile
7
Rank Industry Sector 2005 2006 2007 2008 2009 Total
1 Maritime & Port-related 6.21 1,003.74 4.35 4.35 26.95 1,044
2 Manufacturing 8.23 388.84 106.03 12.63 9.93 526
3 Tourism/Leisure 2.32 70.37 158.68 191.29 56.70 428
4 Utilities 0 0 431.64 1.52 0 433
2005-2009 Top 4 Industry Sectors
in terms of Committed Investments (US$M)
New projects reflect a shift from manufacturing investments to tourism related activities
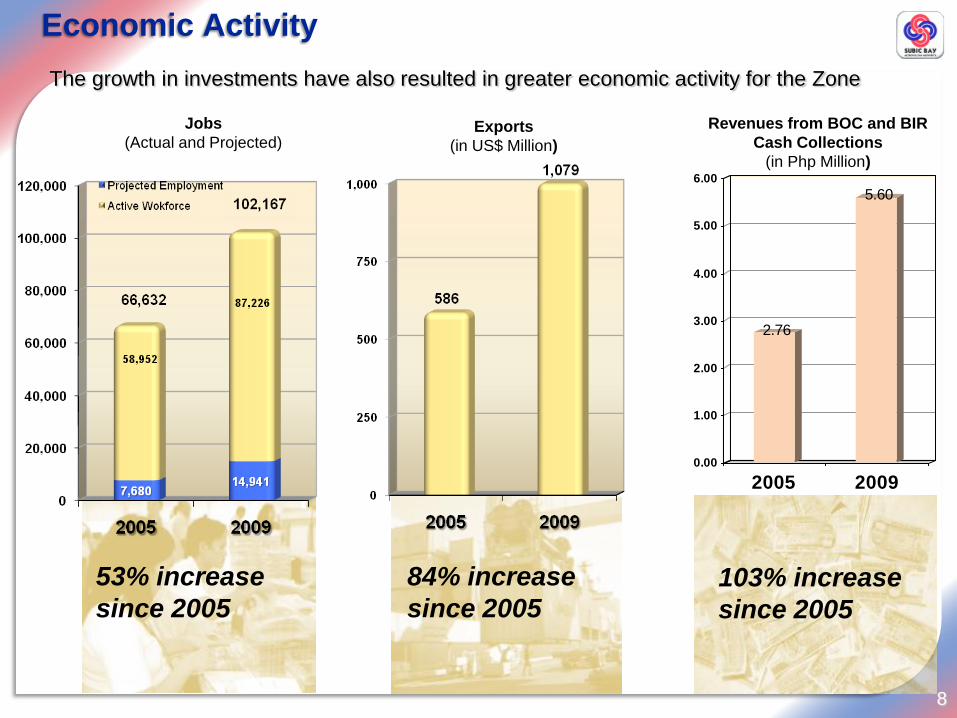
Economic Activity
8
2.76
5.60
0.00
1.00
2.00
3.00
4.00
5.00
6.00
2005 2009
Revenues from BOC and BIR
Cash Collections
(in Php Million)
Exports
(in US$ Million)
Jobs
(Actual and Projected)
53% increase
since 2005
84% increase
since 2005103% increase
since 2005
The growth in investments have also resulted in greater economic activity for the Zone

Core Purpose – Broken Down to Stakeholders
9
Country
Local
CommunitiesInvestors
Employees
To unite around a sense of achievement
To create jobs and
economic opportunities
responsibly and
sustainably
To create a safe,
stable, efficient and
transparent business
environment where
companies can grow
To harness their talents to create a better
future for them and the country

SBMA’s Core Ideology
10
Core Ideology
C
O
R
E
V
A
L
U
E
S
Malasakit
• Bayanihan spirit, going the extra mile
• Common good over self-interest, care,
• Respect for the environment
• Social responsibility & accountability
• Enhancing, perpetuating gains of development
Excellence • Integrity
• Professionalism
• Discipline, world-class
Passion
• Fire that drives us to have ―Malasakit‖, Excellence &
Professionalism
• Innovative
• Commitment
C
O
R
E
P
U
R
P
O
S
E
To generate economic opportunities & livelihood as a
competitive maritime, logistics and eco-tourism hub in
East Asia.
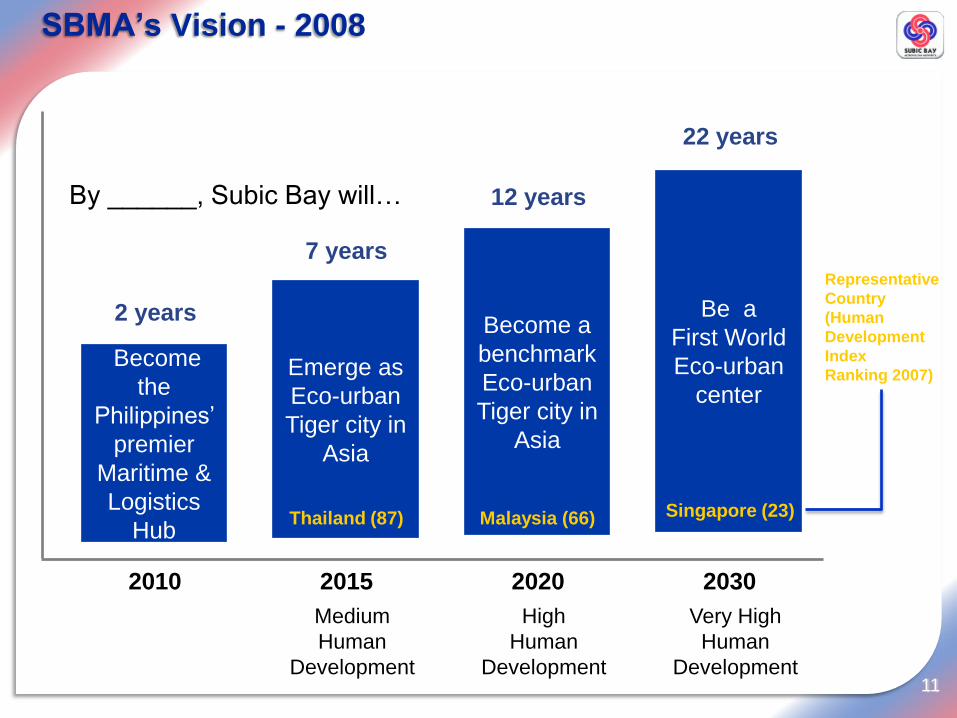
SBMA’s Vision - 2008
11
Become
the
Philippines’
premier
Maritime &
Logistics
Hub
2010
2 years
By ______, Subic Bay will…
Emerge as
Eco-urban
Tiger city in
Asia
2015
7 years
Thailand (87)
Become a
benchmark
Eco-urban
Tiger city in
Asia
2020
12 years
Malaysia (66)
Be a
First World
Eco-urban
center
2030
22 years
Singapore (23)
Medium
Human
Development
High
Human
Development
Very High
Human
Development
Representative
Country
(Human
Development
Index
Ranking 2007)
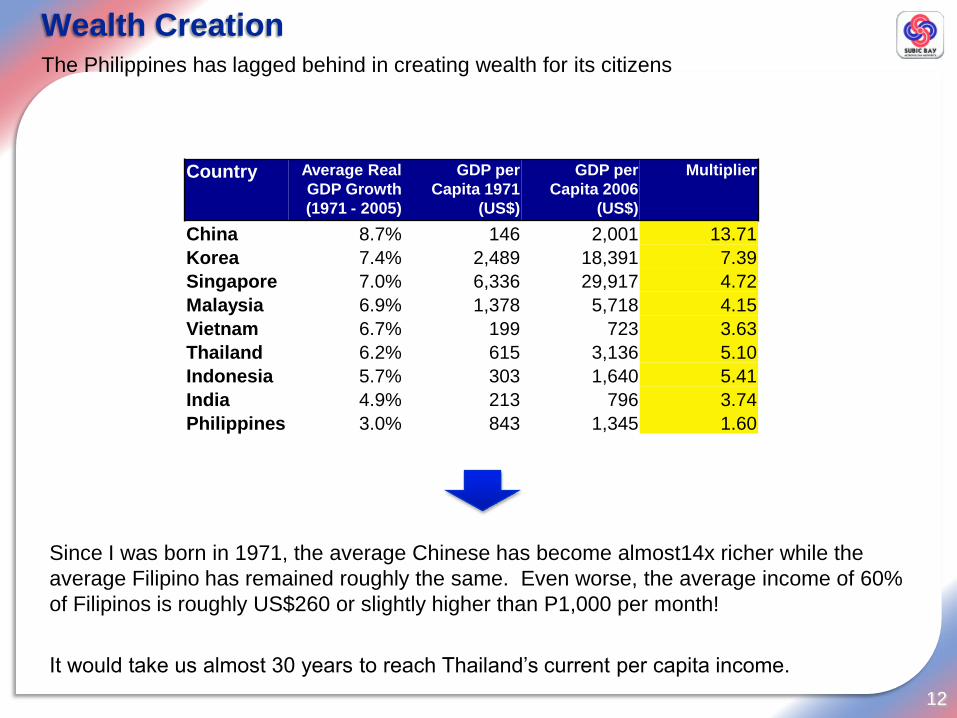
Wealth Creation
12
The Philippines has lagged behind in creating wealth for its citizens
Since I was born in 1971, the average Chinese has become almost14x richer while the
average Filipino has remained roughly the same. Even worse, the average income of 60%
of Filipinos is roughly US$260 or slightly higher than P1,000 per month!
It would take us almost 30 years to reach Thailand’s current per capita income.
Country Average Real
GDP Growth
(1971 - 2005)
GDP per
Capita 1971
(US$)
GDP per
Capita 2006
(US$)
Multiplier
China 8.7% 146 2,001 13.71
Korea 7.4% 2,489 18,391 7.39
Singapore 7.0% 6,336 29,917 4.72
Malaysia 6.9% 1,378 5,718 4.15
Vietnam 6.7% 199 723 3.63
Thailand 6.2% 615 3,136 5.10
Indonesia 5.7% 303 1,640 5.41
India 4.9% 213 796 3.74
Philippines 3.0% 843 1,345 1.60

Philippine Real GDP Growth Rate
13
Asian
Financial
Crisis
Power
Crisis
Anti-Marcos
Rallies
The Philippines has failed to sustain high levels of growth for prolonged periods
The Economic Pie simply is not getting bigger

2006 Philippine Family Income and Poverty Statistics
14
SOURCE: National Statistical Coordination Board (www.nscb.com.ph)
2000 2003 2006 2000 2003 2006
Nearly 27% of Filipino Families are officially ―poor‖ – equivalent to 33% of Filipinos or
30 million individuals
Subsistence = Food Threshold
= P4,177/month for family of 5
Poverty Line = Food Threshold + basic needs
= P6,274/month for family of 5
= P41/day/person!
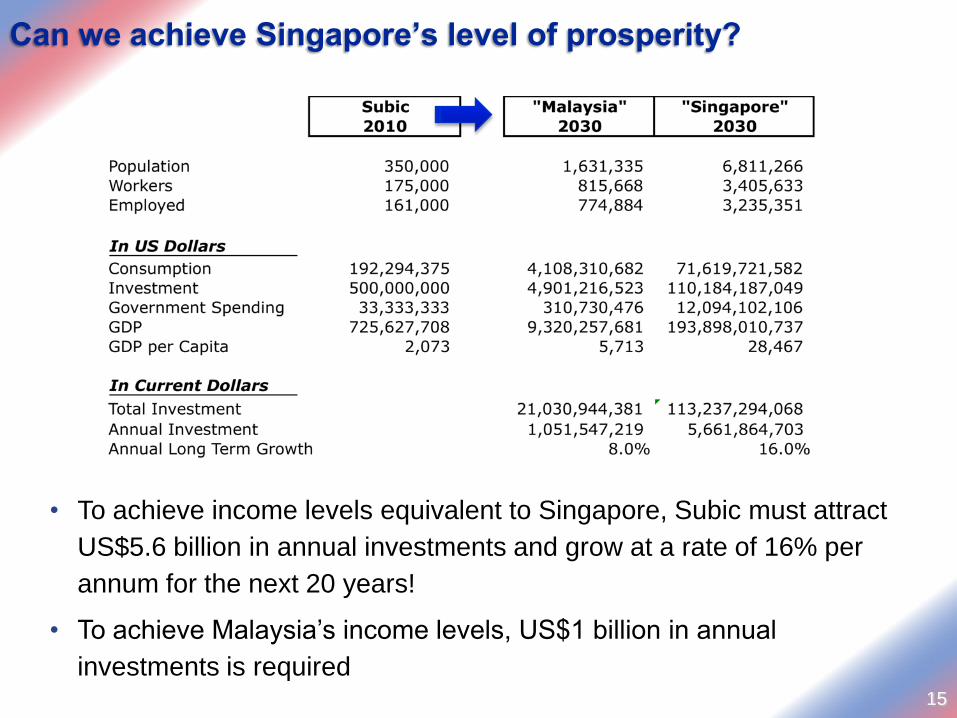
Can we achieve Singapore’s level of prosperity?
15
• To achieve income levels equivalent to Singapore, Subic must attract
US$5.6 billion in annual investments and grow at a rate of 16% per
annum for the next 20 years!
• To achieve Malaysia’s income levels, US$1 billion in annual
investments is required
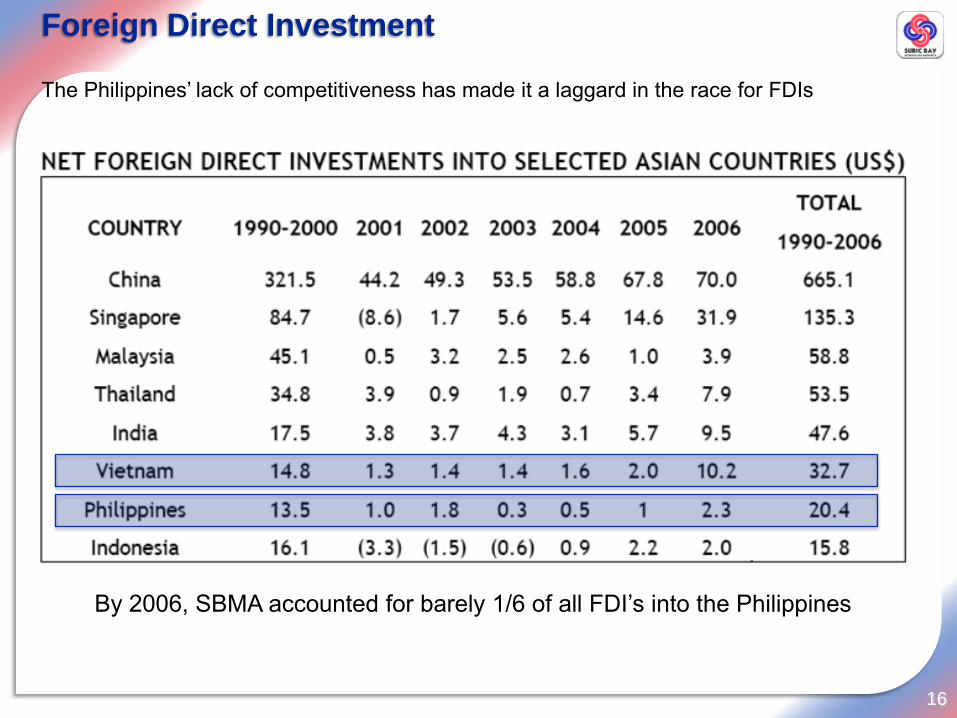
Foreign Direct Investment
16
The Philippines’ lack of competitiveness has made it a laggard in the race for FDIs
By 2006, SBMA accounted for barely 1/6 of all FDI’s into the Philippines
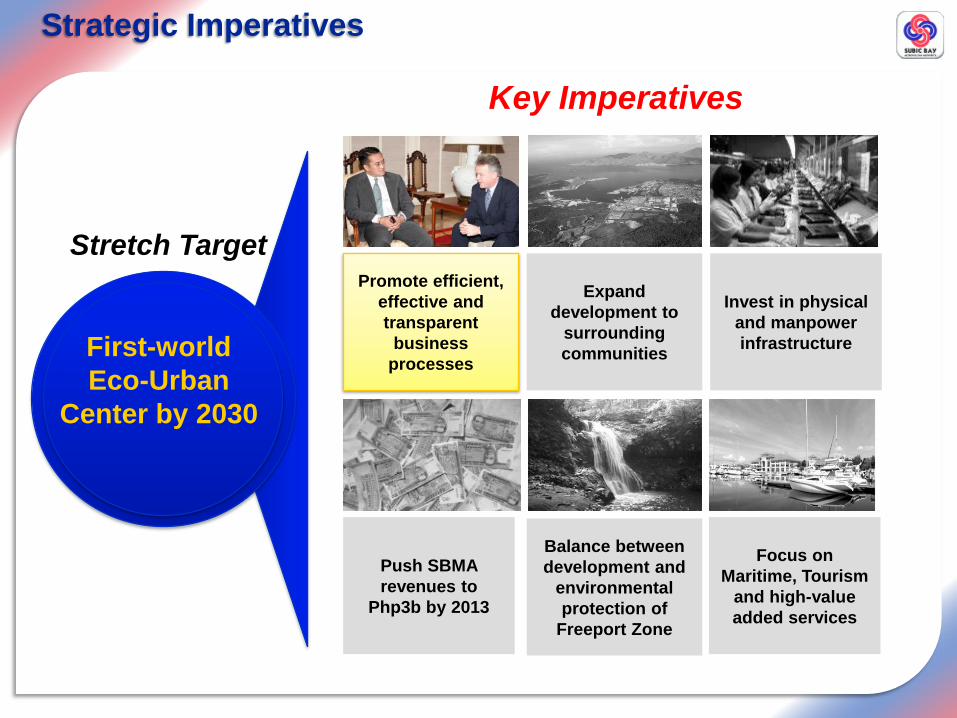
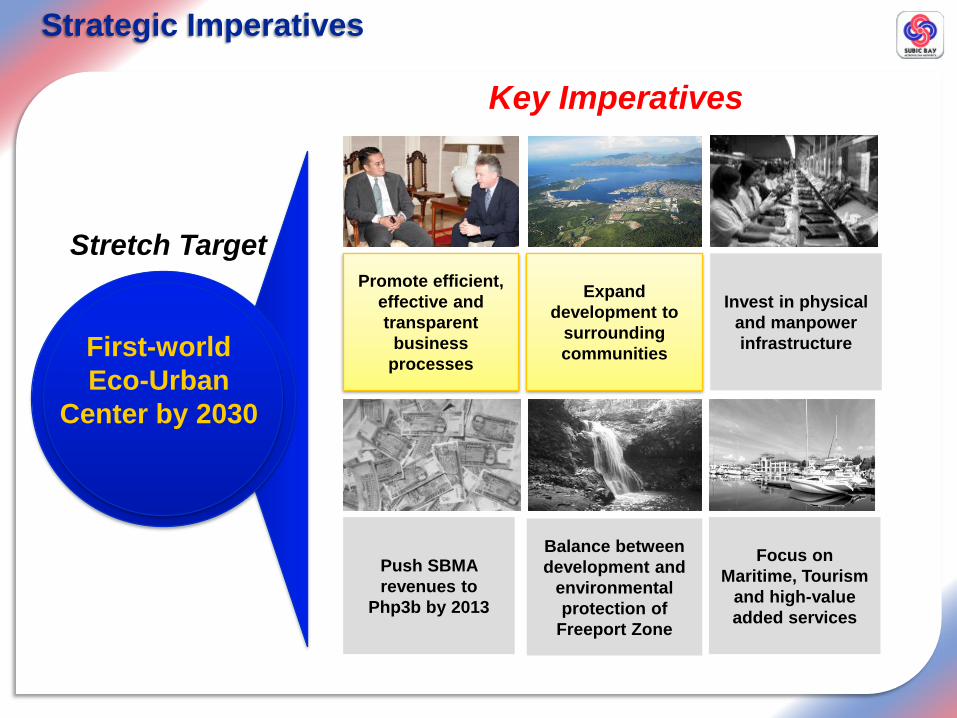
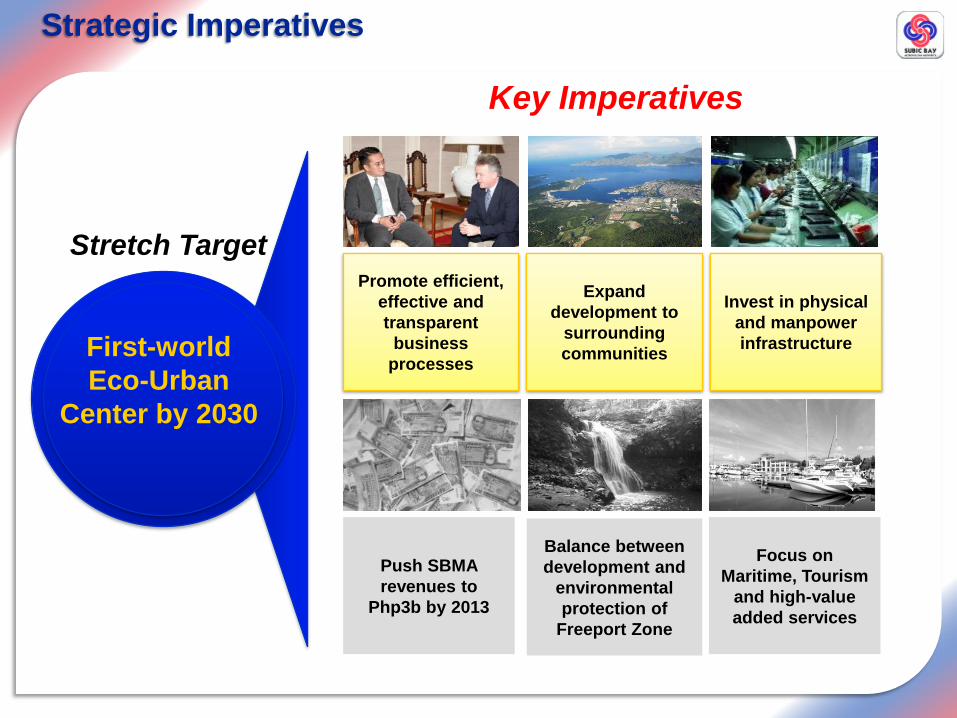
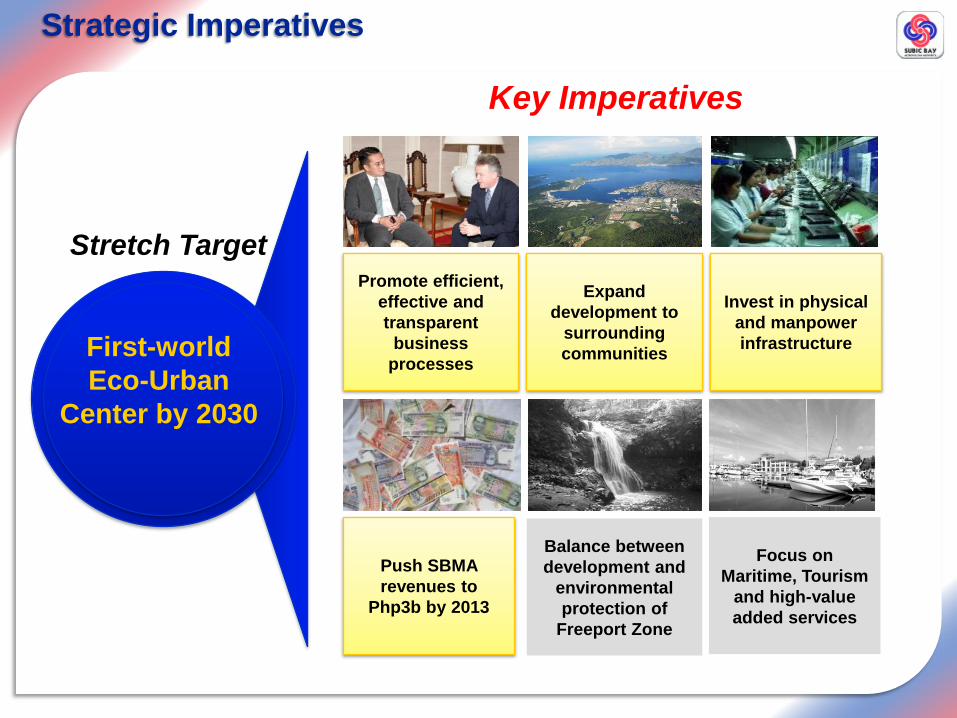
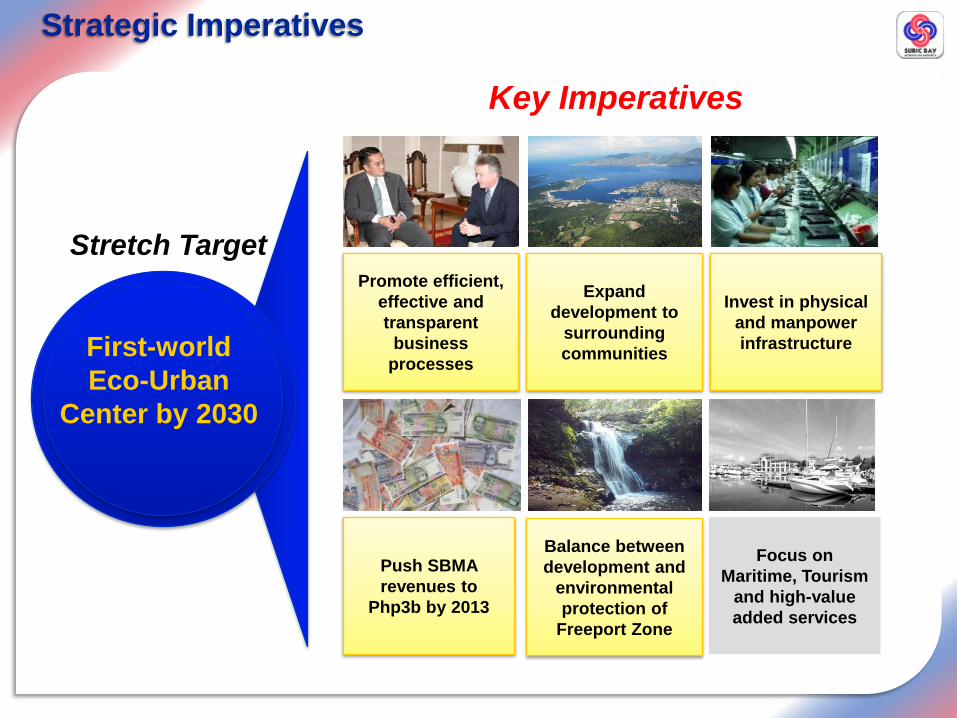
Strategic Imperatives
First-world
Eco-Urban
Center by 2030
Promote efficient,
effective and
transparent
business
processes
Expand
development to
surrounding
communities
Invest in physical
and manpower
infrastructure
Key Imperatives
Stretch Target
Push SBMA
revenues to
Php3b by 2013
Balance between
development and
environmental
protection of
Freeport Zone
Focus on
Maritime, Tourism
and high-value
added services
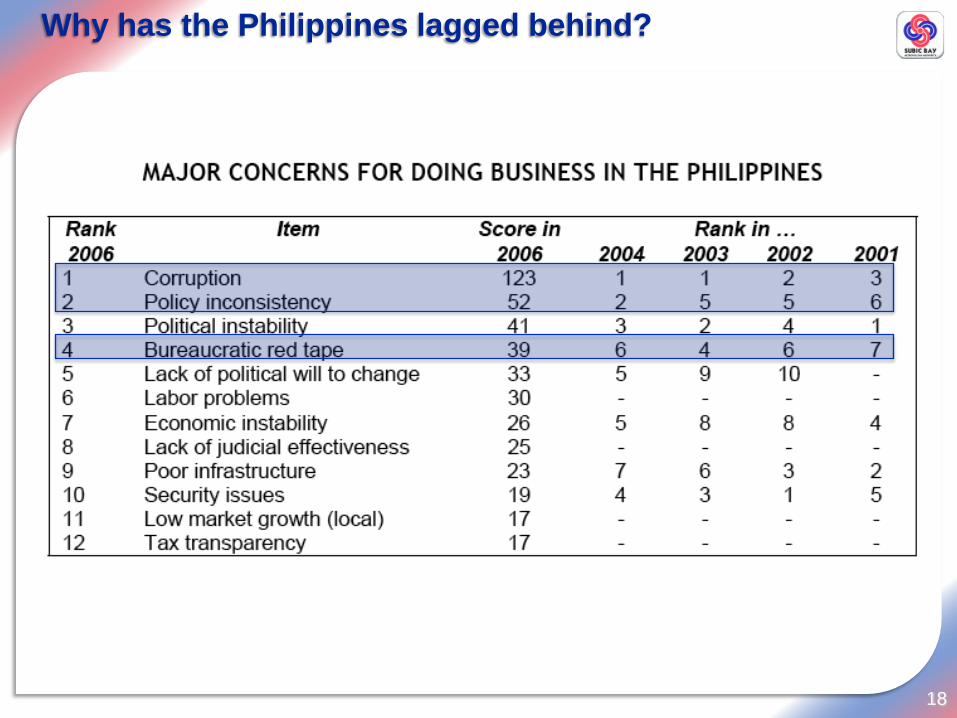
Why has the Philippines lagged behind?
18

Corruption
19
Stopping corruption is one thing, changing the perception is another…
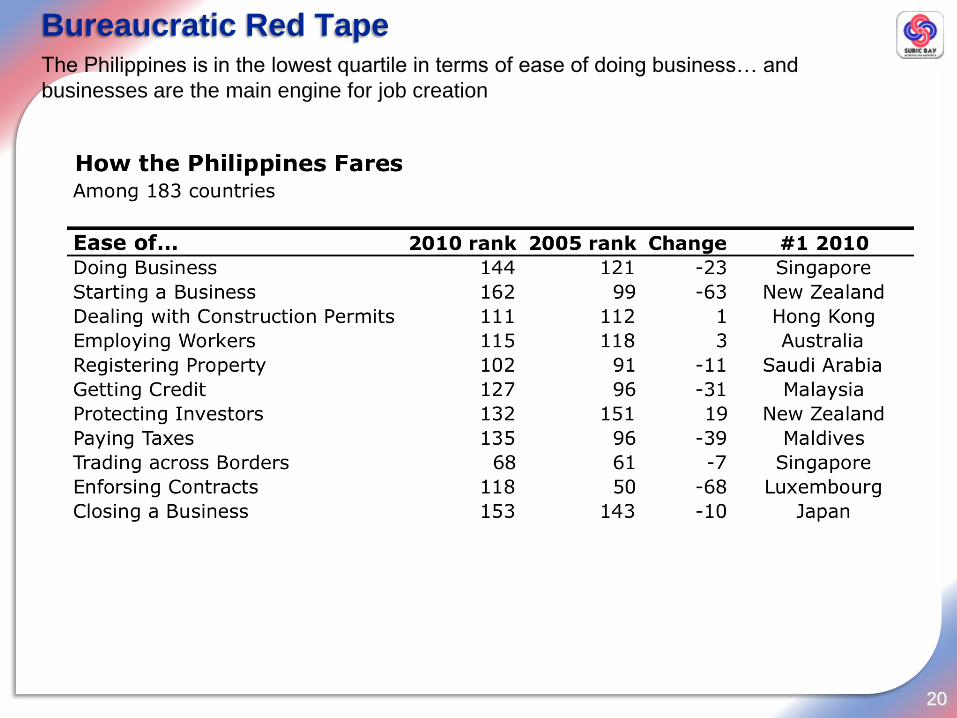
Bureaucratic Red Tape
20
The Philippines is in the lowest quartile in terms of ease of doing business… and
businesses are the main engine for job creation
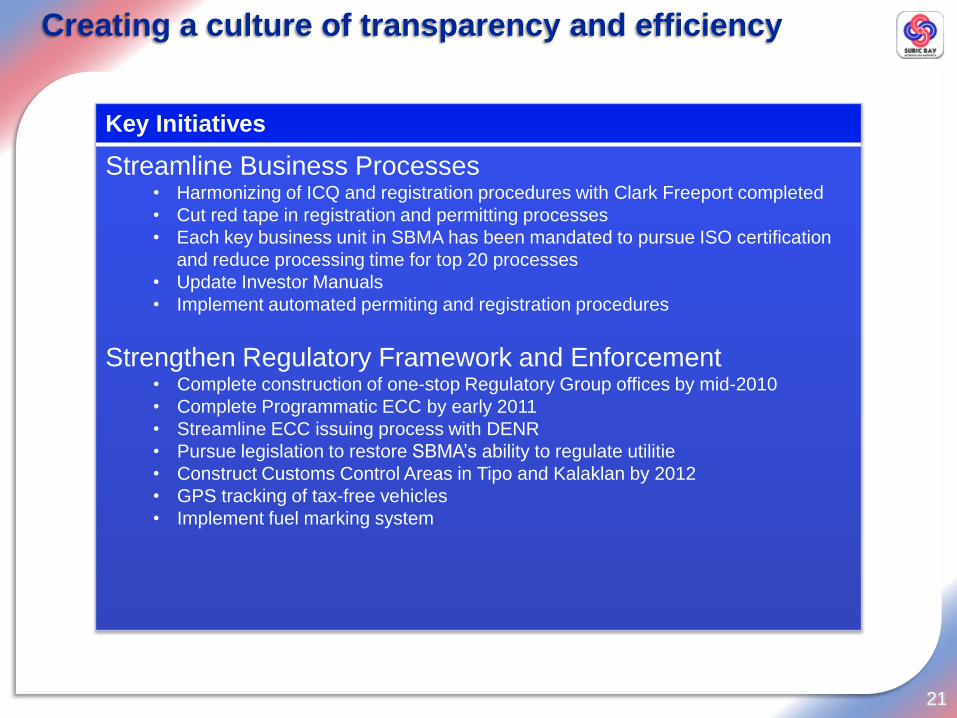
Creating a culture of transparency and efficiency
21
Key Initiatives
Streamline Business Processes• Harmonizing of ICQ and registration procedures with Clark Freeport completed
• Cut red tape in registration and permitting processes
• Each key business unit in SBMA has been mandated to pursue ISO certification
and reduce processing time for top 20 processes
• Update Investor Manuals
• Implement automated permiting and registration procedures
Strengthen Regulatory Framework and Enforcement• Complete construction of one-stop Regulatory Group offices by mid-2010
• Complete Programmatic ECC by early 2011
• Streamline ECC issuing process with DENR
• Pursue legislation to restore SBMA’s ability to regulate utilitie
• Construct Customs Control Areas in Tipo and Kalaklan by 2012
• GPS tracking of tax-free vehicles
• Implement fuel marking system
Strategic Imperatives
First-world
Eco-Urban
Center by 2030
Promote efficient,
effective and
transparent
business
processes
Expand
development to
surrounding
communities
Invest in physical
and manpower
infrastructure
Key Imperatives
Stretch Target
Push SBMA
revenues to
Php3b by 2013
Balance between
development and
environmental
protection of
Freeport Zone
Focus on
Maritime, Tourism
and high-value
added services
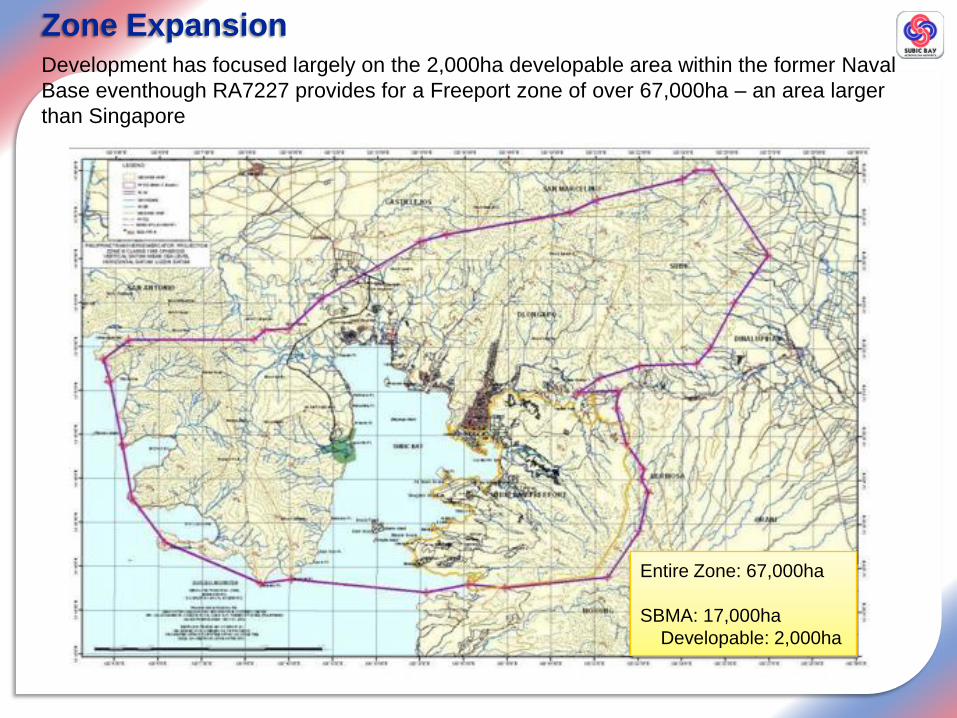
Zone ExpansionDevelopment has focused largely on the 2,000ha developable area within the former Naval
Base eventhough RA7227 provides for a Freeport zone of over 67,000ha – an area larger
than Singapore
Entire Zone: 67,000ha
SBMA: 17,000ha
Developable: 2,000ha
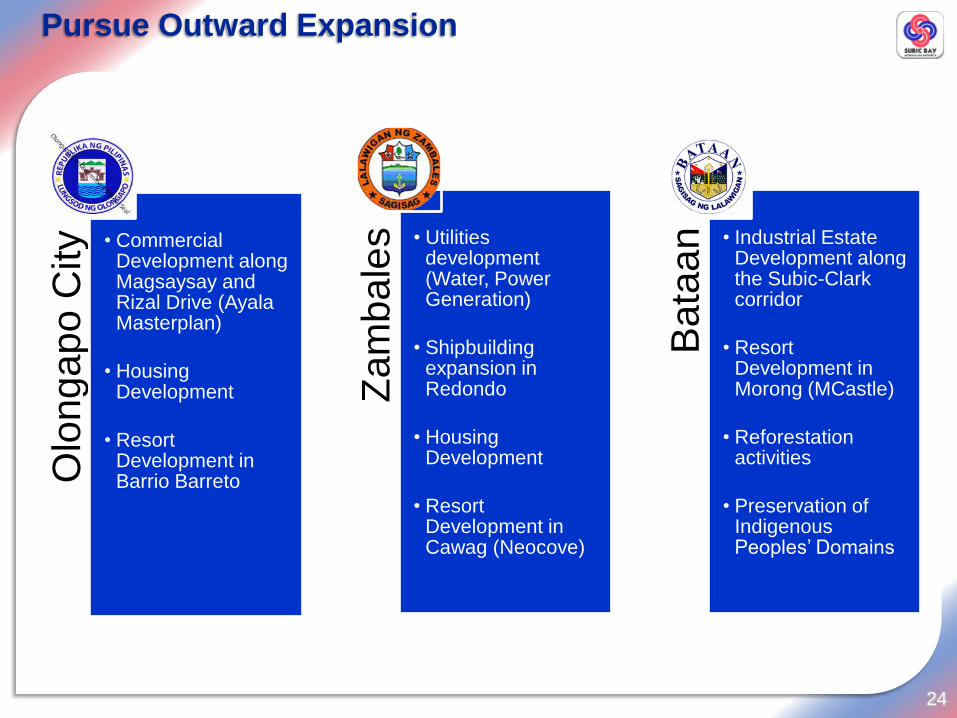
Pursue Outward Expansion
24
Olo
ng
apo
City • Commercial
Development along Magsaysay and Rizal Drive (Ayala Masterplan)
• Housing Development
• Resort Development in Barrio Barreto
Za
mb
ale
s • Utilities development (Water, Power Generation)
• Shipbuilding expansion in Redondo
• Housing Development
• Resort Development in Cawag (Neocove)
Bata
an • Industrial Estate
Development along the Subic-Clark corridor
• Resort Development in Morong (MCastle)
• Reforestation activities
• Preservation of Indigenous Peoples’ Domains
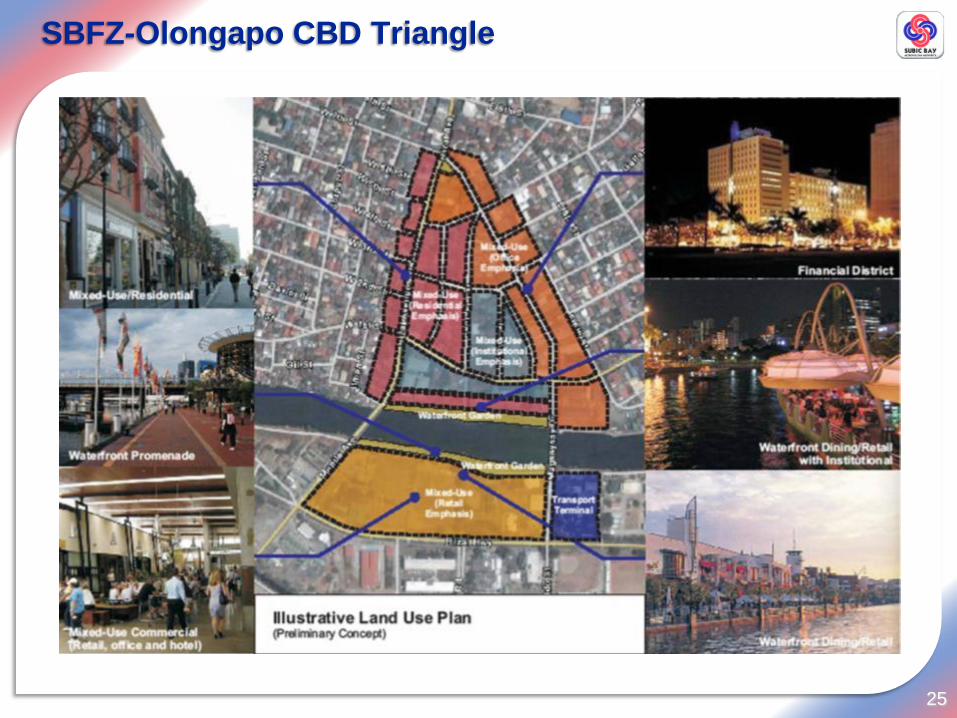
SBFZ-Olongapo CBD Triangle
25
Strategic Imperatives
First-world
Eco-Urban
Center by 2030
Promote efficient,
effective and
transparent
business
processes
Expand
development to
surrounding
communities
Invest in physical
and manpower
infrastructure
Key Imperatives
Stretch Target
Push SBMA
revenues to
Php3b by 2013
Balance between
development and
environmental
protection of
Freeport Zone
Focus on
Maritime, Tourism
and high-value
added services

Infrastructure
27
The Philippines must build more infrastructure to attract businesses

Manpower Development
28
Of the 2 million Filipino Children born in 2010
Percent Number
100% 2,000,000 Primary School Age
94% 1,888,000 Start Grade 1
67% 1,349,920 Reach Grade 6
64% 1,280,000 Start High School
19% 380,000 Drop-out
45% 900,000 Finish High School
24% 480,000 Enter College
17% 340,000 Drop-out
7% 140,000 Finish College
6% 112,000 No Education
27% 538,080 Up to Grade 6
22% 449,920 Up to High School
38% 760,000 Some College
7% 140,000 Finish College
Education is the way out of poverty… not in the Philippines!
In this day and age, it’s not labor, capital or natural resources that dictate a country’s
competitive edge—it is knowledge. Educated people get jobs or, at least, have a far better
chance at doing so. An educated workforce attracts investment. That creates jobs, and
national wealth.
EduCity
29
• Bring world class education to Greater Subic Bay
• George Dewey
• Subac
• Bataan Technopark
• Cubi
• Zero-lease incentive for educational institutions
• Multi-varsity university environment: World’s best universities invited to establish local
facilities
• Complement growth of high-value added and service industries within the Greater Subic
Bay area
Strategic Imperatives
First-world
Eco-Urban
Center by 2030
Promote efficient,
effective and
transparent
business
processes
Expand
development to
surrounding
communities
Invest in physical
and manpower
infrastructure
Key Imperatives
Stretch Target
Push SBMA
revenues to
Php3b by 2013
Balance between
development and
environmental
protection of
Freeport Zone
Focus on
Maritime, Tourism
and high-value
added services
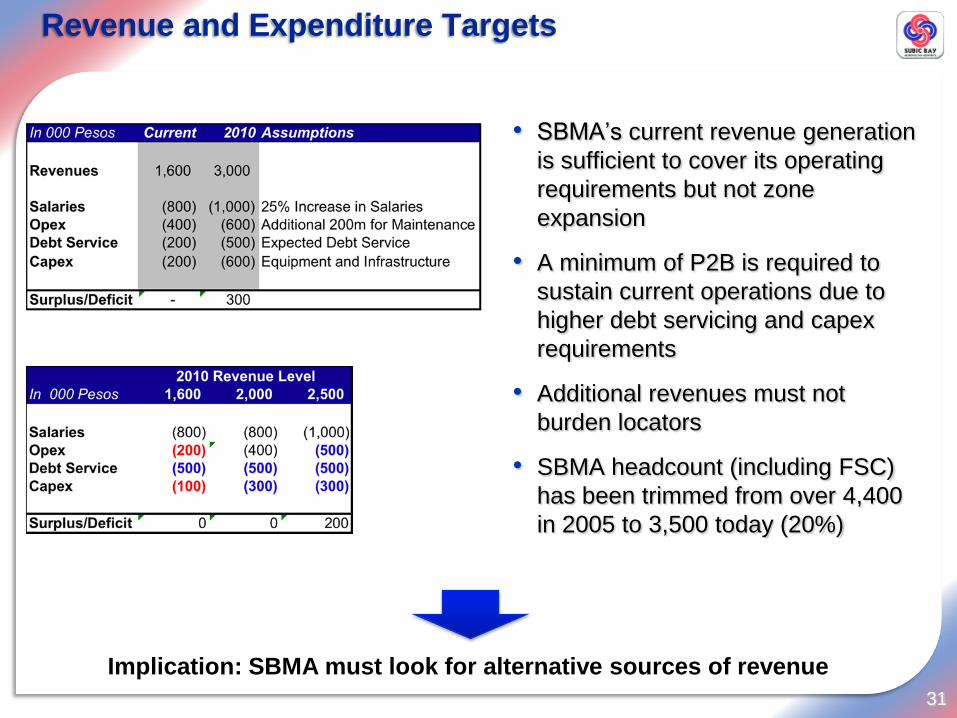
Revenue and Expenditure Targets
31
• SBMA’s current revenue generation
is sufficient to cover its operating
requirements but not zone
expansion
• A minimum of P2B is required to
sustain current operations due to
higher debt servicing and capex
requirements
• Additional revenues must not
burden locators
• SBMA headcount (including FSC)
has been trimmed from over 4,400
in 2005 to 3,500 today (20%)
Implication: SBMA must look for alternative sources of revenue
Strategic Imperatives
First-world
Eco-Urban
Center by 2030
Promote efficient,
effective and
transparent
business
processes
Expand
development to
surrounding
communities
Invest in physical
and manpower
infrastructure
Key Imperatives
Stretch Target
Push SBMA
revenues to
Php3b by 2013
Balance between
development and
environmental
protection of
Freeport Zone
Focus on
Maritime, Tourism
and high-value
added services
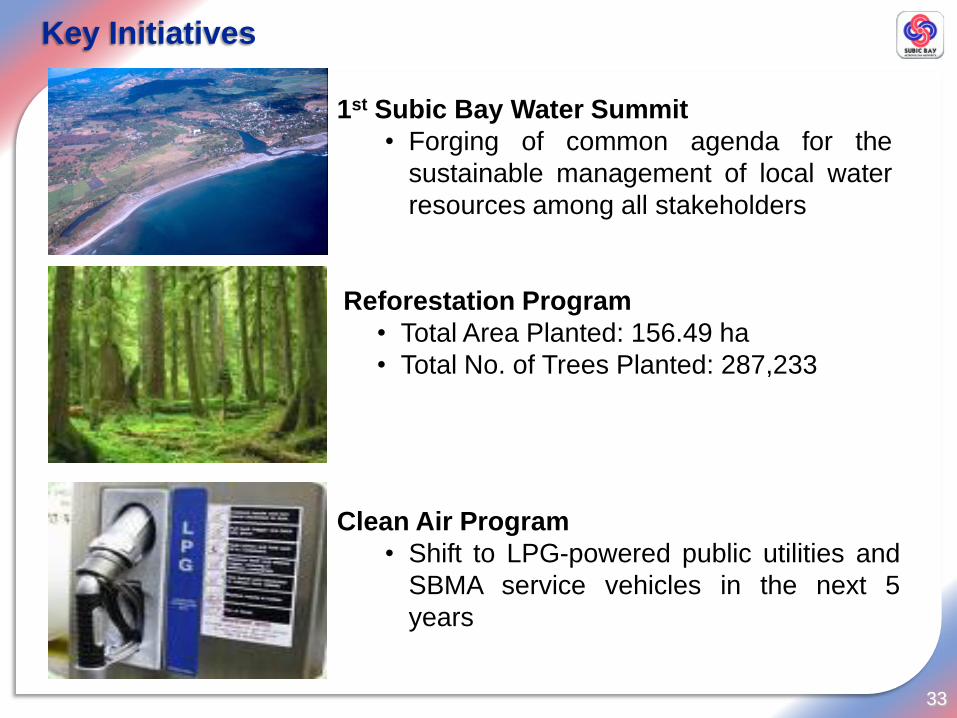
Key Initiatives
33
1st Subic Bay Water Summit
• Forging of common agenda for the
sustainable management of local water
resources among all stakeholders
Reforestation Program
• Total Area Planted: 156.49 ha
• Total No. of Trees Planted: 287,233
Clean Air Program
• Shift to LPG-powered public utilities and
SBMA service vehicles in the next 5
years
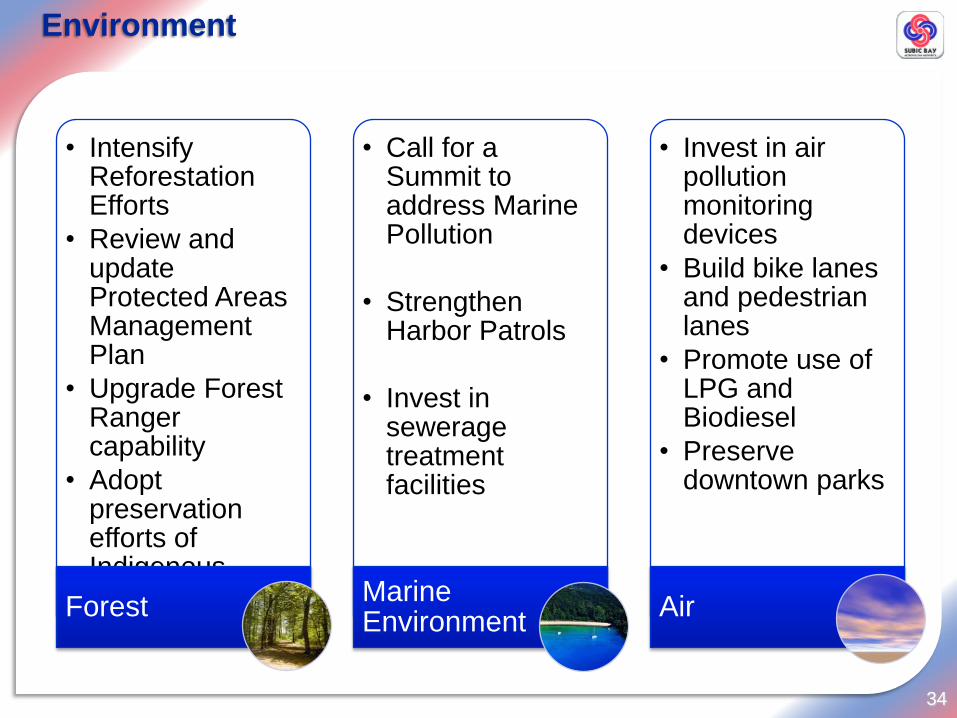
Environment
34
• Intensify Reforestation Efforts
• Review and update Protected Areas Management Plan
• Upgrade Forest Ranger capability
• Adopt preservation efforts of Indigenous TribesForest
• Call for a Summit to address Marine Pollution
• Strengthen Harbor Patrols
• Invest in sewerage treatment facilities
Marine Environment
• Invest in air pollution monitoring devices
• Build bike lanes and pedestrian lanes
• Promote use of LPG and Biodiesel
• Preserve downtown parks
Air

Renewable Energy Sources
35
• According to WWF, the Philippines has more than 1,000
wind sites with a potential capacity of at least 7,400
megawatts – enough to power 19 million homes.
• Possible site in SBFZ: Redondo Ridge
• It is estimated that the Philippines ―could save US$2.9
billion in fossil-fuel imports over the next 10 years, if the
country’s cast renewal energy resources are tapped‖.

Strategic Imperatives
First-world
Eco-Urban
Center by 2030
Promote efficient,
effective and
transparent
business
processes
Expand
development to
surrounding
communities
Invest in physical
and manpower
infrastructure
Key Imperatives
Stretch Target
Push SBMA
revenues to
Php3b by 2013
Balance between
development and
environmental
protection of
Freeport Zone
Focus on
Maritime, Tourism
and high-value
added services
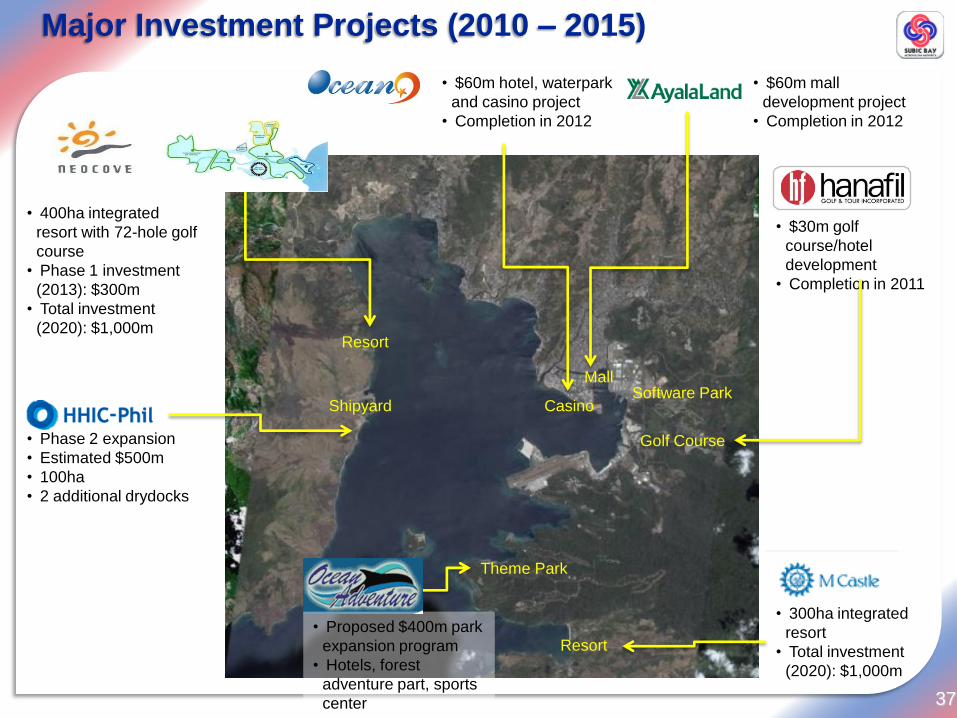
Major Investment Projects (2010 – 2015)
37
• Phase 2 expansion
• Estimated $500m
• 100ha
• 2 additional drydocks
• 400ha integrated
resort with 72-hole golf
course
• Phase 1 investment
(2013): $300m
• Total investment
(2020): $1,000m
• $60m hotel, waterpark
and casino project
• Completion in 2012
• $60m mall
development project
• Completion in 2012
Shipyard
Resort
Casino
MallSoftware Park
• $30m golf
course/hotel
development
• Completion in 2011
Golf Course
• Proposed $400m park
expansion program
• Hotels, forest
adventure part, sports
center
Theme Park
• 300ha integrated
resort
• Total investment
(2020): $1,000m
Resort
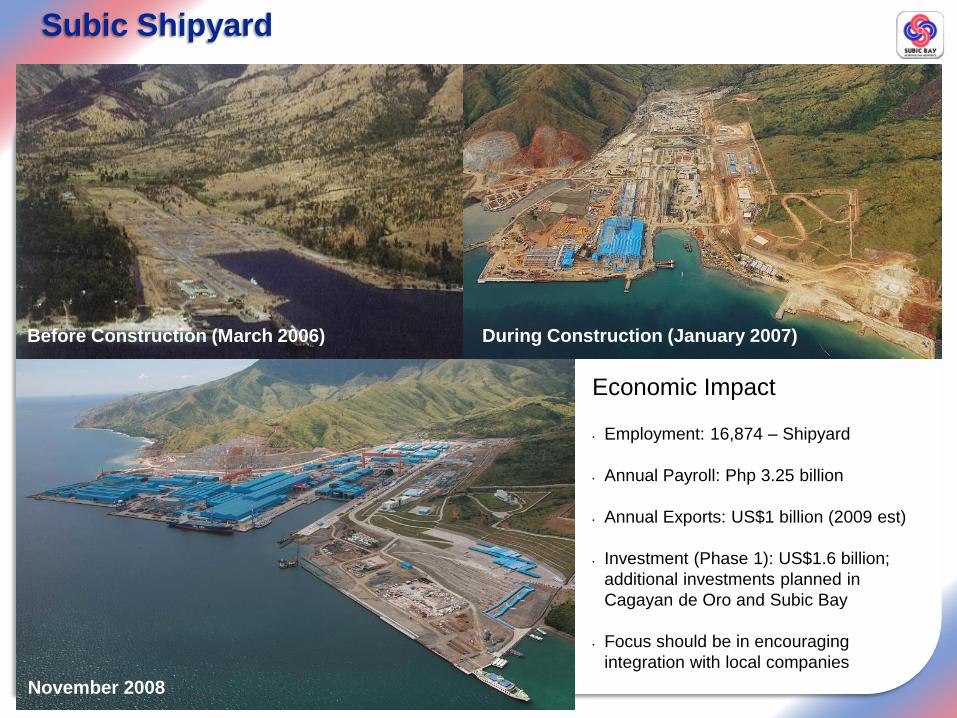
Before Construction (March 2006)
Subic Shipyard
November 2008
During Construction (January 2007)
Economic Impact
• Employment: 16,874 – Shipyard
• Annual Payroll: Php 3.25 billion
• Annual Exports: US$1 billion (2009 est)
• Investment (Phase 1): US$1.6 billion;
additional investments planned in
Cagayan de Oro and Subic Bay
• Focus should be in encouraging
integration with local companies
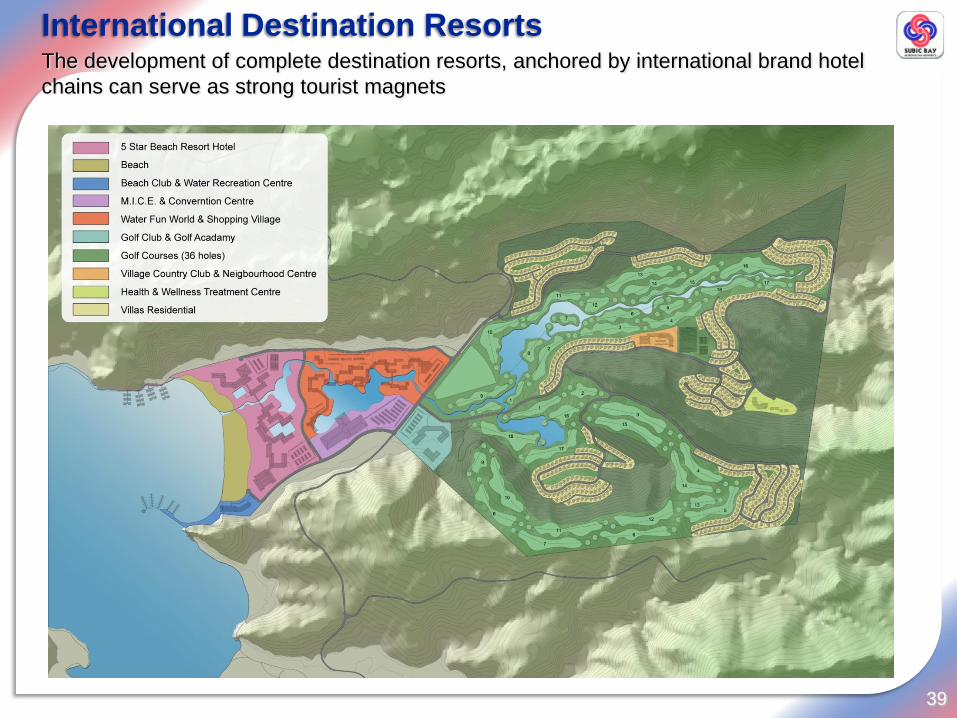
International Destination Resorts
39
The development of complete destination resorts, anchored by international brand hotel
chains can serve as strong tourist magnets
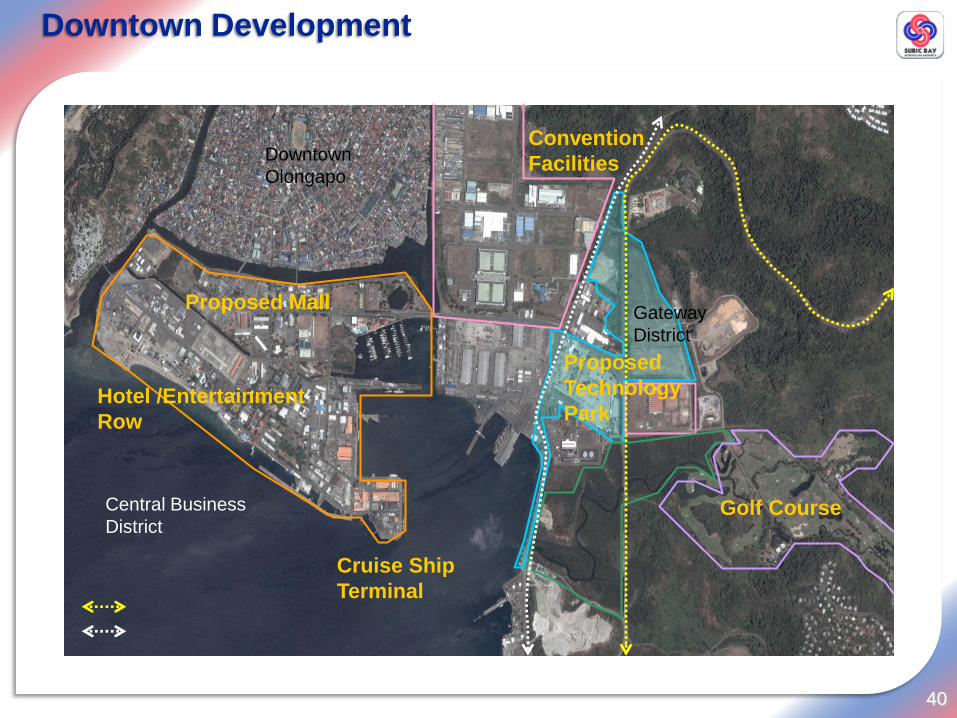
40
Downtown Development
Gateway
District
Downtown
Olongapo
Central Business
District
Proposed
Technology
Park
Proposed Mall
Hotel /Entertainment
Row
Cruise Ship
Terminal
Golf Course
Convention
Facilities
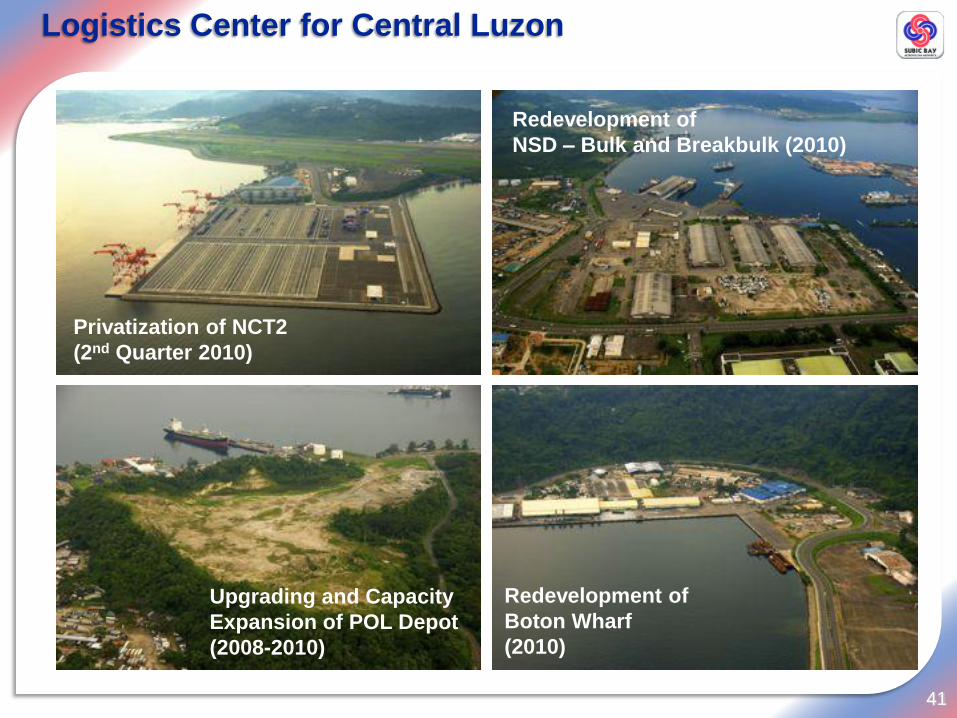
Logistics Center for Central Luzon
41
Privatization of NCT2
(2nd Quarter 2010)
Upgrading and Capacity
Expansion of POL Depot
(2008-2010)
Redevelopment of
NSD – Bulk and Breakbulk (2010)
Redevelopment of
Boton Wharf
(2010)

End of Presentation
![[loop] - inelis.sk popis.pdf · NF P PF Sofa Sofa mit Seitenteilverstel-Sofa groß Sofa groß mit Seitenteilver-lung stellung ... doporučujeme z naší řady 10006 plexisklo L010](https://img.dokumen.tips/doc/110x75/5b9dd92909d3f2de128d08e0/loop-popispdf-nf-p-pf-sofa-sofa-mit-seitenteilverstel-sofa-gross-sofa-gross.jpg)